North Fort Myers, FL
North Fort Myers Map
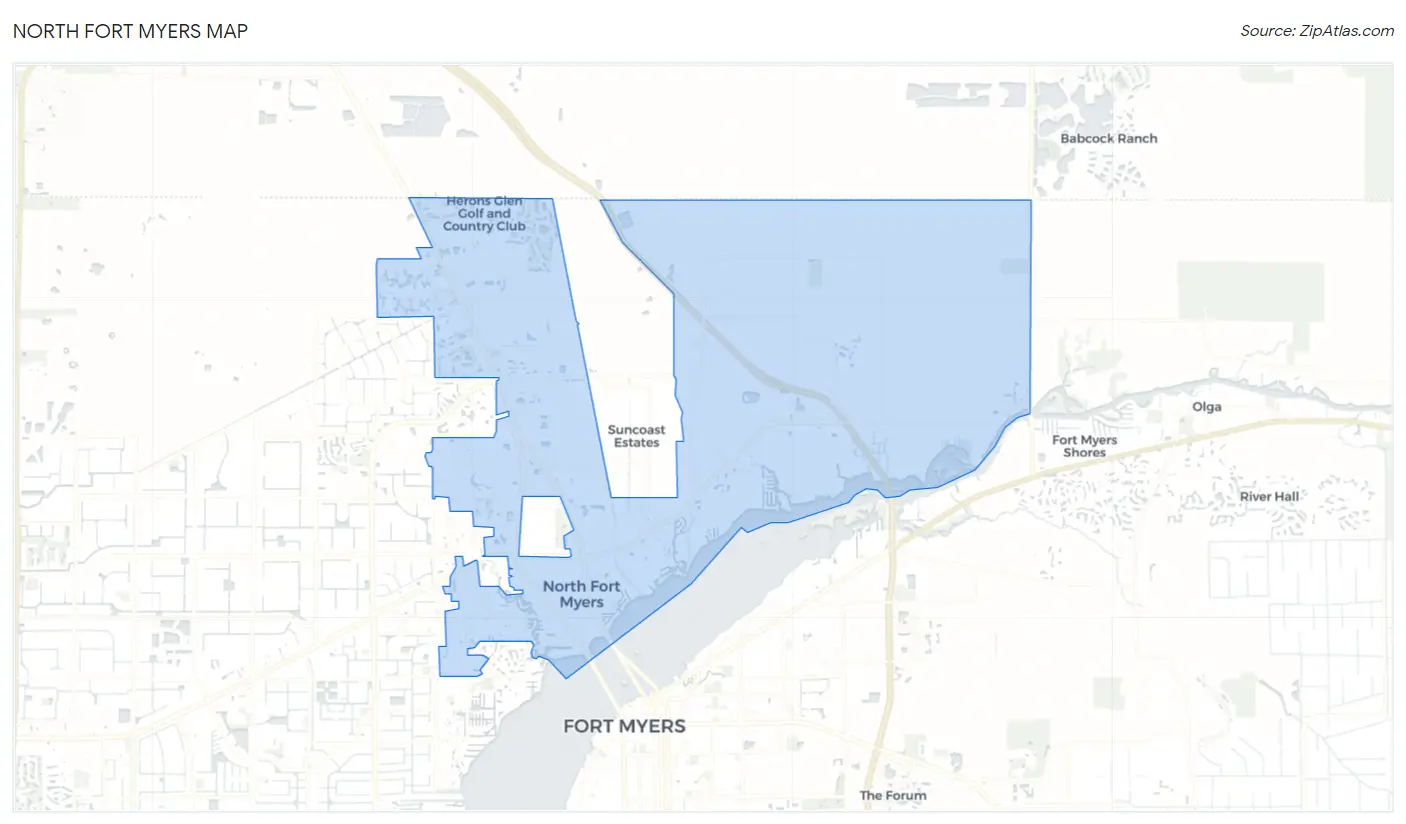
North Fort Myers Overview
42,492
TOTAL POPULATION
20,427
MALE POPULATION
22,065
FEMALE POPULATION
92.58
MALES / 100 FEMALES
108.02
FEMALES / 100 MALES
64.0
MEDIAN AGE
2.6
AVG FAMILY SIZE
2.0
AVG HOUSEHOLD SIZE
$35,992
PER CAPITA INCOME
$68,578
AVG FAMILY INCOME
$53,705
AVG HOUSEHOLD INCOME
23.9%
WAGE / INCOME GAP [ % ]
76.1¢/ $1
WAGE / INCOME GAP [ $ ]
$9,209
FAMILY INCOME DEFICIT
0.44
INEQUALITY / GINI INDEX
15,541
LABOR FORCE [ PEOPLE ]
39.8%
PERCENT IN LABOR FORCE
5.0%
UNEMPLOYMENT RATE
North Fort Myers Area Codes
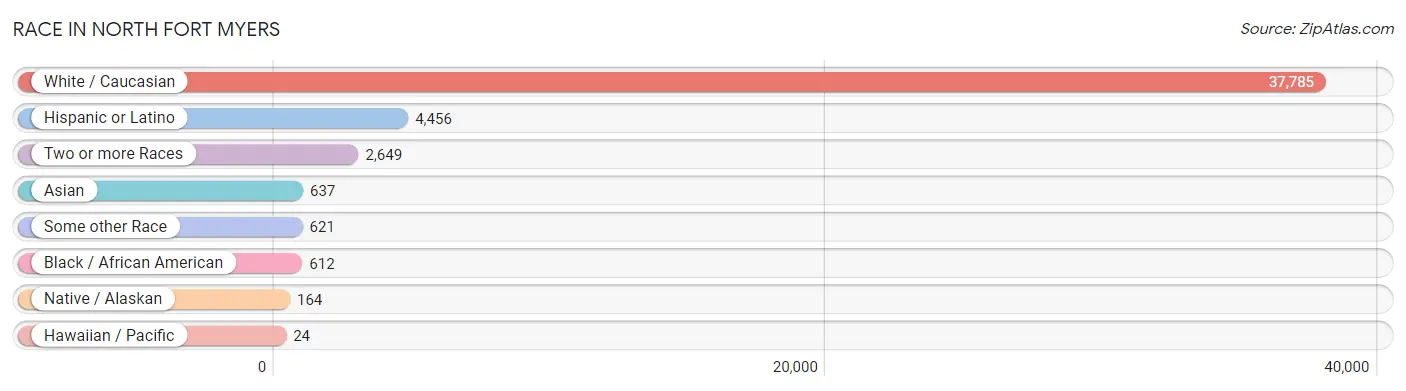
Race in North Fort Myers
The most populous races in North Fort Myers are White / Caucasian (37,785 | 88.9%), Hispanic or Latino (4,456 | 10.5%), and Two or more Races (2,649 | 6.2%).
| Race | # Population | % Population |
| Asian | 637 | 1.5% |
| Black / African American | 612 | 1.4% |
| Hawaiian / Pacific | 24 | 0.1% |
| Hispanic or Latino | 4,456 | 10.5% |
| Native / Alaskan | 164 | 0.4% |
| White / Caucasian | 37,785 | 88.9% |
| Two or more Races | 2,649 | 6.2% |
| Some other Race | 621 | 1.5% |
| Total | 42,492 | 100.0% |
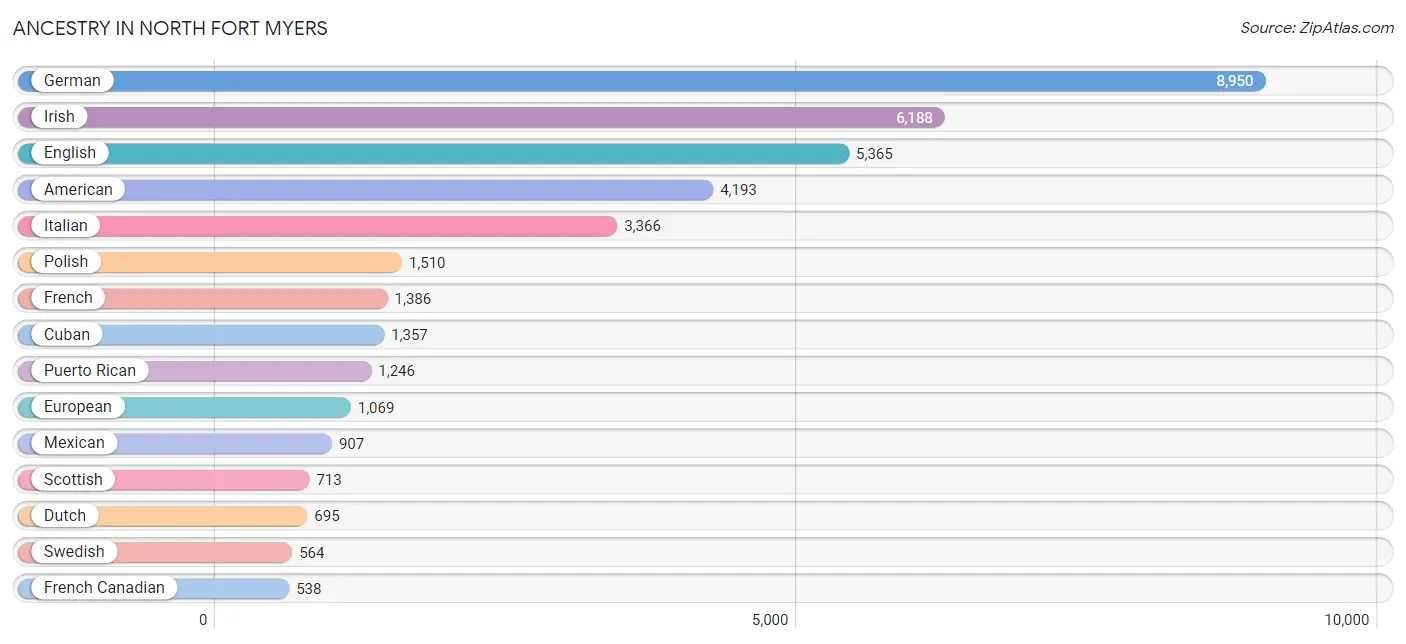
Ancestry in North Fort Myers
The most populous ancestries reported in North Fort Myers are German (8,950 | 21.1%), Irish (6,188 | 14.6%), English (5,365 | 12.6%), American (4,193 | 9.9%), and Italian (3,366 | 7.9%), together accounting for 66.0% of all North Fort Myers residents.
| Ancestry | # Population | % Population |
| African | 27 | 0.1% |
| American | 4,193 | 9.9% |
| Arab | 199 | 0.5% |
| Argentinean | 48 | 0.1% |
| Armenian | 59 | 0.1% |
| Austrian | 96 | 0.2% |
| Barbadian | 29 | 0.1% |
| Belgian | 17 | 0.0% |
| Bermudan | 9 | 0.0% |
| Bhutanese | 49 | 0.1% |
| Brazilian | 146 | 0.3% |
| British | 429 | 1.0% |
| Cajun | 25 | 0.1% |
| Canadian | 529 | 1.2% |
| Celtic | 27 | 0.1% |
| Central American | 325 | 0.8% |
| Central American Indian | 12 | 0.0% |
| Cherokee | 103 | 0.2% |
| Chippewa | 1 | 0.0% |
| Colombian | 134 | 0.3% |
| Costa Rican | 82 | 0.2% |
| Croatian | 82 | 0.2% |
| Cuban | 1,357 | 3.2% |
| Czech | 110 | 0.3% |
| Czechoslovakian | 31 | 0.1% |
| Danish | 117 | 0.3% |
| Dominican | 66 | 0.2% |
| Dutch | 695 | 1.6% |
| Eastern European | 71 | 0.2% |
| Ecuadorian | 59 | 0.1% |
| English | 5,365 | 12.6% |
| European | 1,069 | 2.5% |
| Finnish | 119 | 0.3% |
| French | 1,386 | 3.3% |
| French Canadian | 538 | 1.3% |
| German | 8,950 | 21.1% |
| Greek | 32 | 0.1% |
| Guamanian / Chamorro | 5 | 0.0% |
| Guatemalan | 15 | 0.0% |
| Haitian | 25 | 0.1% |
| Honduran | 145 | 0.3% |
| Hungarian | 258 | 0.6% |
| Indian (Asian) | 46 | 0.1% |
| Irish | 6,188 | 14.6% |
| Iroquois | 10 | 0.0% |
| Israeli | 16 | 0.0% |
| Italian | 3,366 | 7.9% |
| Jamaican | 21 | 0.1% |
| Jordanian | 16 | 0.0% |
| Korean | 46 | 0.1% |
| Laotian | 15 | 0.0% |
| Lebanese | 114 | 0.3% |
| Lithuanian | 187 | 0.4% |
| Lumbee | 11 | 0.0% |
| Maltese | 8 | 0.0% |
| Mexican | 907 | 2.1% |
| Mexican American Indian | 83 | 0.2% |
| Native Hawaiian | 19 | 0.0% |
| Nicaraguan | 5 | 0.0% |
| Northern European | 34 | 0.1% |
| Norwegian | 397 | 0.9% |
| Palestinian | 38 | 0.1% |
| Pennsylvania German | 53 | 0.1% |
| Peruvian | 66 | 0.2% |
| Polish | 1,510 | 3.5% |
| Portuguese | 235 | 0.5% |
| Puerto Rican | 1,246 | 2.9% |
| Romanian | 69 | 0.2% |
| Russian | 427 | 1.0% |
| Salvadoran | 78 | 0.2% |
| Scandinavian | 114 | 0.3% |
| Scotch-Irish | 468 | 1.1% |
| Scottish | 713 | 1.7% |
| Sioux | 14 | 0.0% |
| Slavic | 61 | 0.1% |
| Slovak | 124 | 0.3% |
| Slovene | 63 | 0.2% |
| South African | 18 | 0.0% |
| South American | 321 | 0.8% |
| South American Indian | 6 | 0.0% |
| Spaniard | 20 | 0.1% |
| Spanish | 87 | 0.2% |
| Sri Lankan | 41 | 0.1% |
| Subsaharan African | 45 | 0.1% |
| Swedish | 564 | 1.3% |
| Swiss | 71 | 0.2% |
| Syrian | 31 | 0.1% |
| Thai | 309 | 0.7% |
| Ukrainian | 205 | 0.5% |
| Venezuelan | 14 | 0.0% |
| Welsh | 350 | 0.8% | View All 91 Rows |
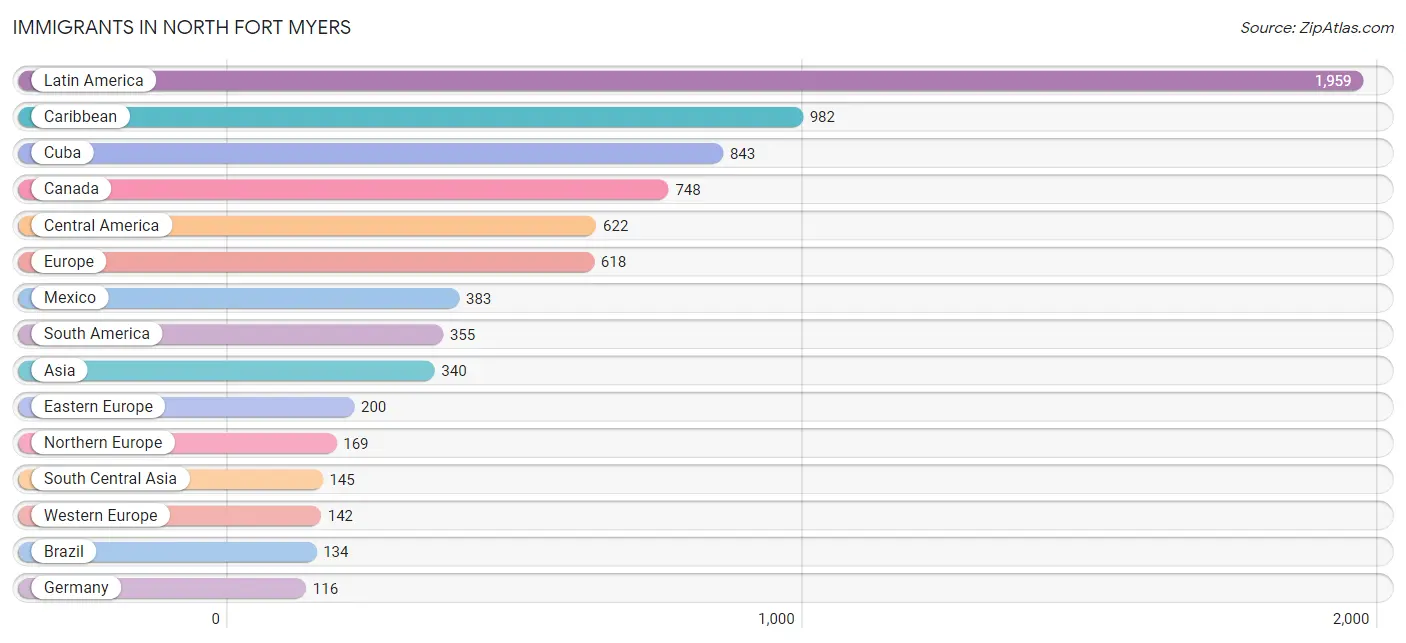
Immigrants in North Fort Myers
The most numerous immigrant groups reported in North Fort Myers came from Latin America (1,959 | 4.6%), Caribbean (982 | 2.3%), Cuba (843 | 2.0%), Canada (748 | 1.8%), and Central America (622 | 1.5%), together accounting for 12.1% of all North Fort Myers residents.
| Immigration Origin | # Population | % Population |
| Argentina | 48 | 0.1% |
| Asia | 340 | 0.8% |
| Bangladesh | 69 | 0.2% |
| Barbados | 29 | 0.1% |
| Brazil | 134 | 0.3% |
| Cambodia | 32 | 0.1% |
| Canada | 748 | 1.8% |
| Caribbean | 982 | 2.3% |
| Central America | 622 | 1.5% |
| China | 28 | 0.1% |
| Colombia | 45 | 0.1% |
| Costa Rica | 82 | 0.2% |
| Croatia | 12 | 0.0% |
| Cuba | 843 | 2.0% |
| Czechoslovakia | 49 | 0.1% |
| Eastern Asia | 49 | 0.1% |
| Eastern Europe | 200 | 0.5% |
| Ecuador | 44 | 0.1% |
| El Salvador | 33 | 0.1% |
| England | 34 | 0.1% |
| Europe | 618 | 1.5% |
| Germany | 116 | 0.3% |
| Honduras | 112 | 0.3% |
| India | 31 | 0.1% |
| Indonesia | 15 | 0.0% |
| Ireland | 84 | 0.2% |
| Israel | 32 | 0.1% |
| Italy | 77 | 0.2% |
| Jamaica | 3 | 0.0% |
| Japan | 12 | 0.0% |
| Korea | 9 | 0.0% |
| Latin America | 1,959 | 4.6% |
| Lebanon | 49 | 0.1% |
| Mexico | 383 | 0.9% |
| Nepal | 44 | 0.1% |
| Netherlands | 26 | 0.1% |
| Nicaragua | 12 | 0.0% |
| North Macedonia | 24 | 0.1% |
| Northern Europe | 169 | 0.4% |
| Pakistan | 1 | 0.0% |
| Peru | 28 | 0.1% |
| Philippines | 18 | 0.0% |
| Poland | 8 | 0.0% |
| Portugal | 25 | 0.1% |
| Romania | 15 | 0.0% |
| Russia | 67 | 0.2% |
| Scotland | 24 | 0.1% |
| South America | 355 | 0.8% |
| South Central Asia | 145 | 0.3% |
| South Eastern Asia | 65 | 0.2% |
| Southern Europe | 107 | 0.3% |
| Spain | 5 | 0.0% |
| Sweden | 11 | 0.0% |
| Trinidad and Tobago | 66 | 0.2% |
| Ukraine | 25 | 0.1% |
| Venezuela | 56 | 0.1% |
| Western Asia | 81 | 0.2% |
| Western Europe | 142 | 0.3% | View All 58 Rows |
Sex and Age in North Fort Myers
Sex and Age in North Fort Myers
The most populous age groups in North Fort Myers are 75 to 79 Years (2,343 | 11.5%) for men and 60 to 64 Years (2,730 | 12.4%) for women.
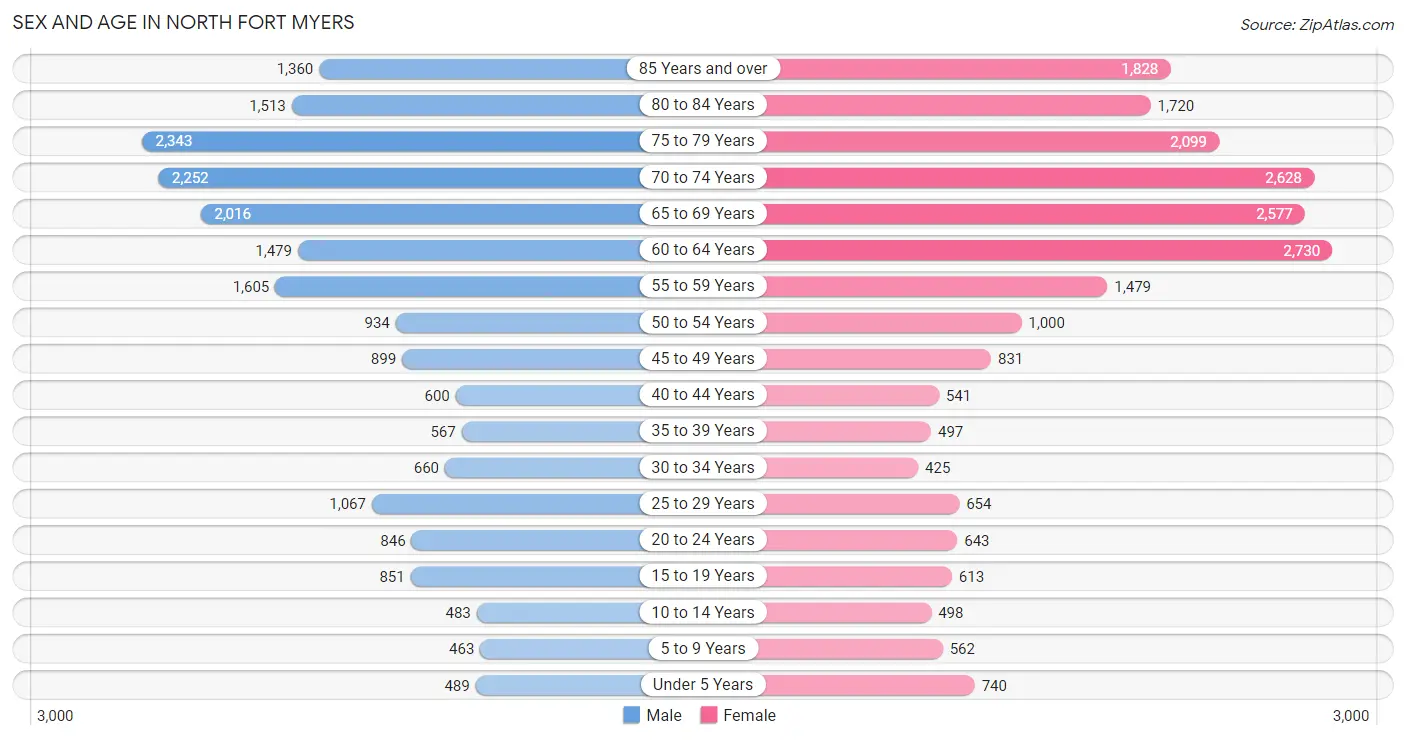
| Age Bracket | Male | Female |
| Under 5 Years | 489 (2.4%) | 740 (3.4%) |
| 5 to 9 Years | 463 (2.3%) | 562 (2.5%) |
| 10 to 14 Years | 483 (2.4%) | 498 (2.3%) |
| 15 to 19 Years | 851 (4.2%) | 613 (2.8%) |
| 20 to 24 Years | 846 (4.1%) | 643 (2.9%) |
| 25 to 29 Years | 1,067 (5.2%) | 654 (3.0%) |
| 30 to 34 Years | 660 (3.2%) | 425 (1.9%) |
| 35 to 39 Years | 567 (2.8%) | 497 (2.2%) |
| 40 to 44 Years | 600 (2.9%) | 541 (2.5%) |
| 45 to 49 Years | 899 (4.4%) | 831 (3.8%) |
| 50 to 54 Years | 934 (4.6%) | 1,000 (4.5%) |
| 55 to 59 Years | 1,605 (7.9%) | 1,479 (6.7%) |
| 60 to 64 Years | 1,479 (7.2%) | 2,730 (12.4%) |
| 65 to 69 Years | 2,016 (9.9%) | 2,577 (11.7%) |
| 70 to 74 Years | 2,252 (11.0%) | 2,628 (11.9%) |
| 75 to 79 Years | 2,343 (11.5%) | 2,099 (9.5%) |
| 80 to 84 Years | 1,513 (7.4%) | 1,720 (7.8%) |
| 85 Years and over | 1,360 (6.7%) | 1,828 (8.3%) |
| Total | 20,427 (100.0%) | 22,065 (100.0%) |
Families and Households in North Fort Myers
Median Family Size in North Fort Myers
The median family size in North Fort Myers is 2.62 persons per family, with single male/father families (691 | 6.1%) accounting for the largest median family size of 3.44 persons per family. On the other hand, married-couple families (9,576 | 84.0%) represent the smallest median family size with 2.47 persons per family.
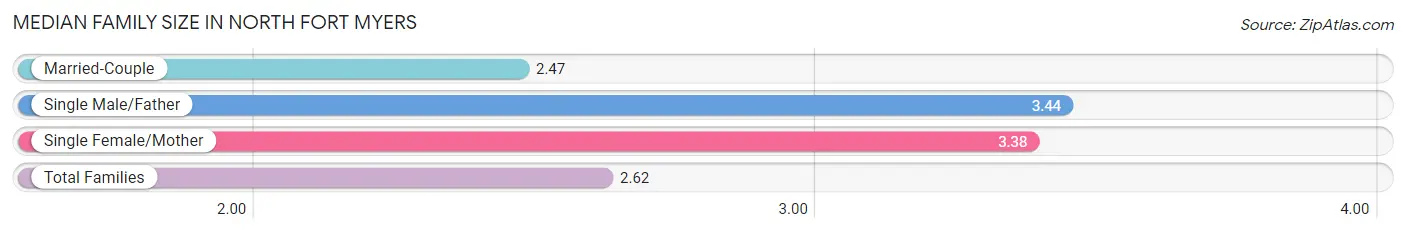
| Family Type | # Families | Family Size |
| Married-Couple | 9,576 (84.0%) | 2.47 |
| Single Male/Father | 691 (6.1%) | 3.44 |
| Single Female/Mother | 1,130 (9.9%) | 3.38 |
| Total Families | 11,397 (100.0%) | 2.62 |
Median Household Size in North Fort Myers
The median household size in North Fort Myers is 1.98 persons per household, with single male/father households (691 | 3.2%) accounting for the largest median household size of 3.66 persons per household. non-family households (9,958 | 46.6%) represent the smallest median household size with 1.19 persons per household.
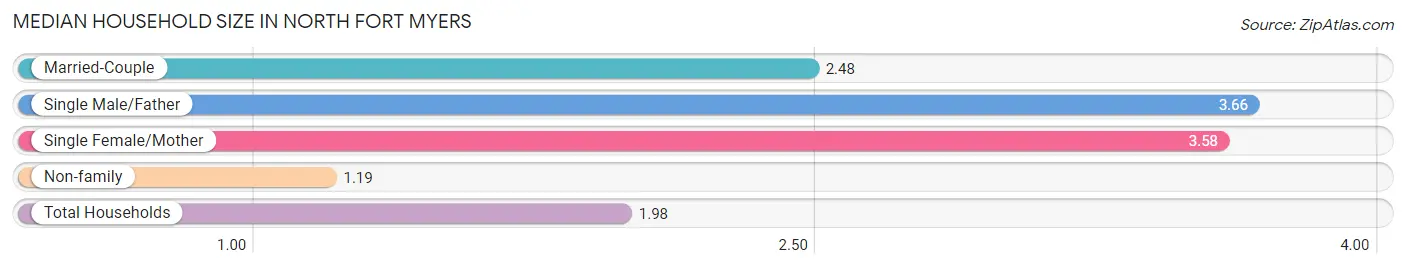
| Household Type | # Households | Household Size |
| Married-Couple | 9,576 (44.8%) | 2.48 |
| Single Male/Father | 691 (3.2%) | 3.66 |
| Single Female/Mother | 1,130 (5.3%) | 3.58 |
| Non-family | 9,958 (46.6%) | 1.19 |
| Total Households | 21,355 (100.0%) | 1.98 |
Household Size by Marriage Status in North Fort Myers
Out of a total of 21,355 households in North Fort Myers, 11,397 (53.4%) are family households, while 9,958 (46.6%) are nonfamily households. The most numerous type of family households are 2-person households, comprising 8,564, and the most common type of nonfamily households are 1-person households, comprising 8,622.
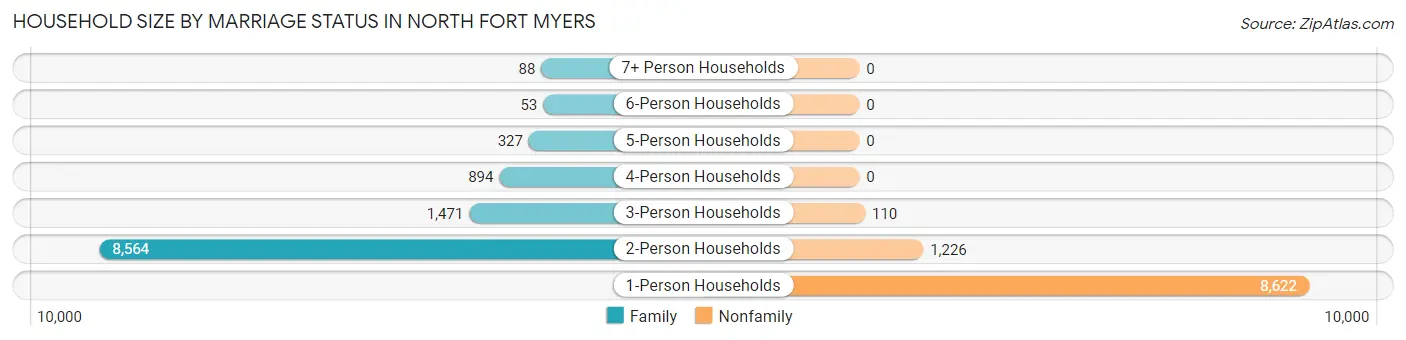
| Household Size | Family Households | Nonfamily Households |
| 1-Person Households | - | 8,622 (40.4%) |
| 2-Person Households | 8,564 (40.1%) | 1,226 (5.7%) |
| 3-Person Households | 1,471 (6.9%) | 110 (0.5%) |
| 4-Person Households | 894 (4.2%) | 0 (0.0%) |
| 5-Person Households | 327 (1.5%) | 0 (0.0%) |
| 6-Person Households | 53 (0.3%) | 0 (0.0%) |
| 7+ Person Households | 88 (0.4%) | 0 (0.0%) |
| Total | 11,397 (53.4%) | 9,958 (46.6%) |
Female Fertility in North Fort Myers
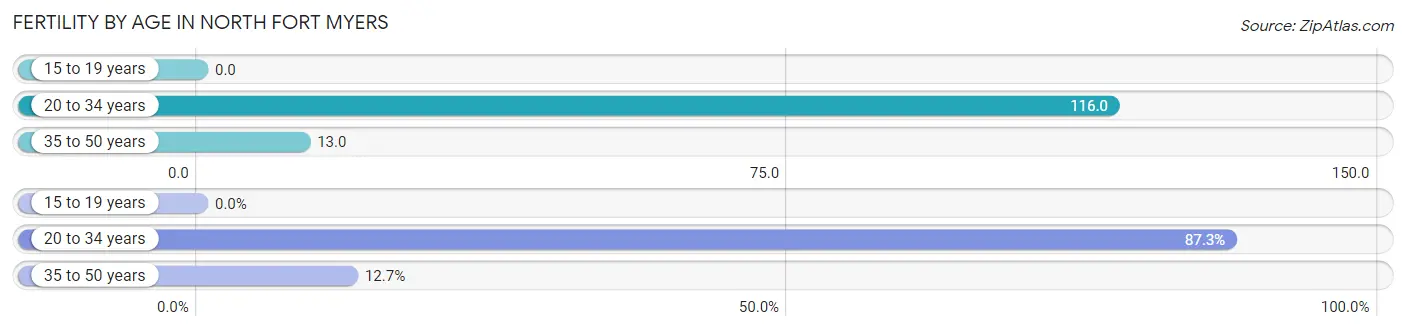
Fertility by Age in North Fort Myers
Average fertility rate in North Fort Myers is 50.0 births per 1,000 women. Women in the age bracket of 20 to 34 years have the highest fertility rate with 116.0 births per 1,000 women. Women in the age bracket of 20 to 34 years acount for 87.3% of all women with births.
| Age Bracket | Women with Births | Births / 1,000 Women |
| 15 to 19 years | 0 (0.0%) | 0.0 |
| 20 to 34 years | 199 (87.3%) | 116.0 |
| 35 to 50 years | 29 (12.7%) | 13.0 |
| Total | 228 (100.0%) | 50.0 |
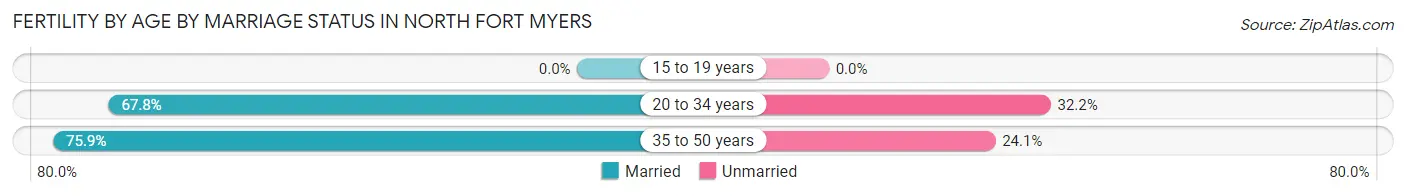
Fertility by Age by Marriage Status in North Fort Myers
68.9% of women with births (228) in North Fort Myers are married. The highest percentage of unmarried women with births falls into 20 to 34 years age bracket with 32.2% of them unmarried at the time of birth, while the lowest percentage of unmarried women with births belong to 35 to 50 years age bracket with 24.1% of them unmarried.
| Age Bracket | Married | Unmarried |
| 15 to 19 years | 0 (0.0%) | 0 (0.0%) |
| 20 to 34 years | 135 (67.8%) | 64 (32.2%) |
| 35 to 50 years | 22 (75.9%) | 7 (24.1%) |
| Total | 157 (68.9%) | 71 (31.1%) |
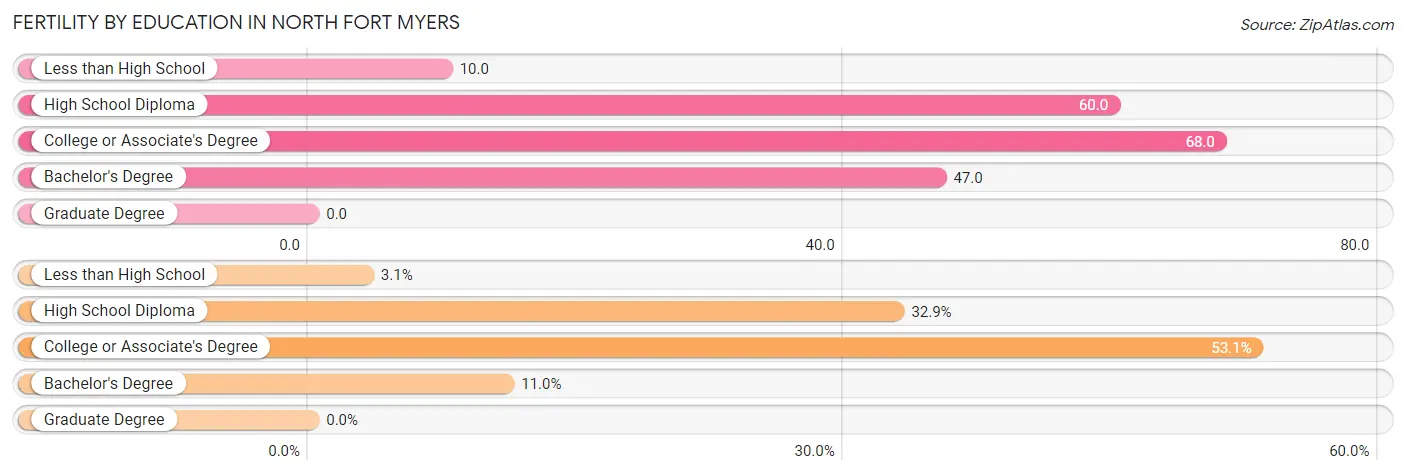
Fertility by Education in North Fort Myers
| Educational Attainment | Women with Births | Births / 1,000 Women |
| Less than High School | 7 (3.1%) | 10.0 |
| High School Diploma | 75 (32.9%) | 60.0 |
| College or Associate's Degree | 121 (53.1%) | 68.0 |
| Bachelor's Degree | 25 (11.0%) | 47.0 |
| Graduate Degree | 0 (0.0%) | 0.0 |
| Total | 228 (100.0%) | 50.0 |
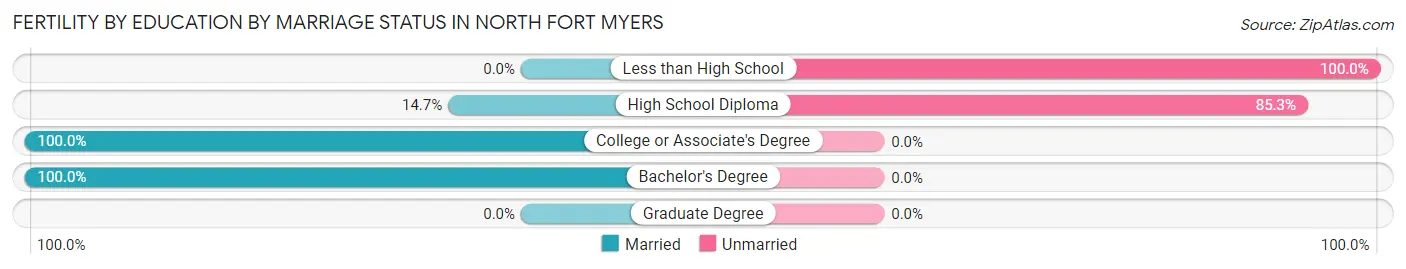
Fertility by Education by Marriage Status in North Fort Myers
31.1% of women with births in North Fort Myers are unmarried. Women with the educational attainment of college or associate's degree are most likely to be married with 100.0% of them married at childbirth, while women with the educational attainment of less than high school are least likely to be married with 100.0% of them unmarried at childbirth.
| Educational Attainment | Married | Unmarried |
| Less than High School | 0 (0.0%) | 7 (100.0%) |
| High School Diploma | 11 (14.7%) | 64 (85.3%) |
| College or Associate's Degree | 121 (100.0%) | 0 (0.0%) |
| Bachelor's Degree | 25 (100.0%) | 0 (0.0%) |
| Graduate Degree | 0 (0.0%) | 0 (0.0%) |
| Total | 157 (68.9%) | 71 (31.1%) |
Income in North Fort Myers
Income Overview in North Fort Myers
Per Capita Income in North Fort Myers is $35,992, while median incomes of families and households are $68,578 and $53,705 respectively.
| Characteristic | Number | Measure |
| Per Capita Income | 42,492 | $35,992 |
| Median Family Income | 11,397 | $68,578 |
| Mean Family Income | 11,397 | $86,009 |
| Median Household Income | 21,355 | $53,705 |
| Mean Household Income | 21,355 | $67,336 |
| Income Deficit | 11,397 | $9,209 |
| Wage / Income Gap (%) | 42,492 | 23.94% |
| Wage / Income Gap ($) | 42,492 | 76.06¢ per $1 |
| Gini / Inequality Index | 42,492 | 0.44 |
Earnings by Sex in North Fort Myers
Average Earnings in North Fort Myers are $32,877, $36,560 for men and $27,806 for women, a difference of 23.9%.
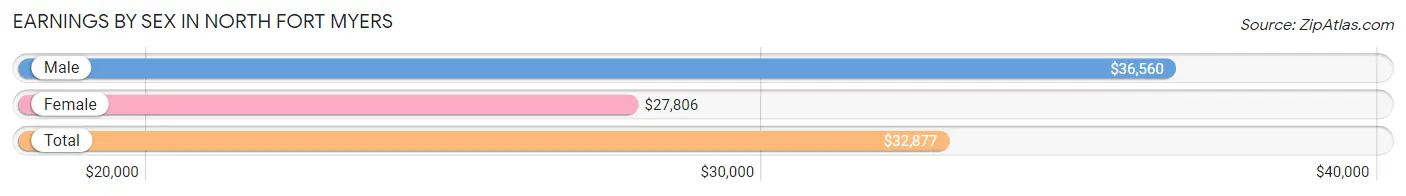
| Sex | Number | Average Earnings |
| Male | 8,703 (52.3%) | $36,560 |
| Female | 7,927 (47.7%) | $27,806 |
| Total | 16,630 (100.0%) | $32,877 |
Earnings by Sex by Income Bracket in North Fort Myers
The most common earnings brackets in North Fort Myers are $100,000+ for men (875 | 10.1%) and $25,000 to $29,999 for women (682 | 8.6%).
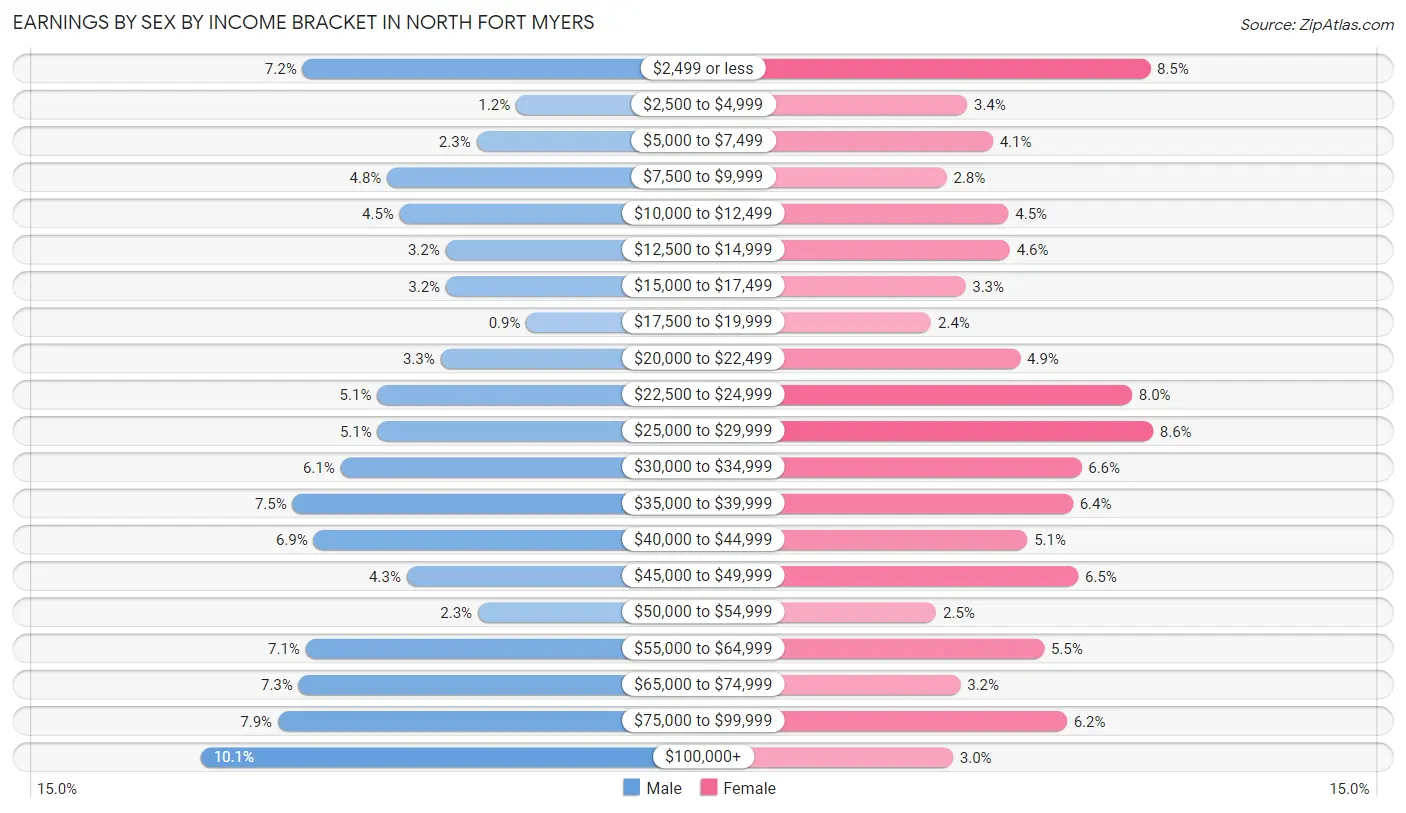
| Income | Male | Female |
| $2,499 or less | 626 (7.2%) | 675 (8.5%) |
| $2,500 to $4,999 | 104 (1.2%) | 268 (3.4%) |
| $5,000 to $7,499 | 200 (2.3%) | 325 (4.1%) |
| $7,500 to $9,999 | 419 (4.8%) | 222 (2.8%) |
| $10,000 to $12,499 | 388 (4.5%) | 360 (4.5%) |
| $12,500 to $14,999 | 276 (3.2%) | 363 (4.6%) |
| $15,000 to $17,499 | 275 (3.2%) | 264 (3.3%) |
| $17,500 to $19,999 | 78 (0.9%) | 188 (2.4%) |
| $20,000 to $22,499 | 288 (3.3%) | 386 (4.9%) |
| $22,500 to $24,999 | 443 (5.1%) | 635 (8.0%) |
| $25,000 to $29,999 | 442 (5.1%) | 682 (8.6%) |
| $30,000 to $34,999 | 533 (6.1%) | 522 (6.6%) |
| $35,000 to $39,999 | 650 (7.5%) | 503 (6.4%) |
| $40,000 to $44,999 | 599 (6.9%) | 402 (5.1%) |
| $45,000 to $49,999 | 371 (4.3%) | 515 (6.5%) |
| $50,000 to $54,999 | 197 (2.3%) | 199 (2.5%) |
| $55,000 to $64,999 | 618 (7.1%) | 439 (5.5%) |
| $65,000 to $74,999 | 635 (7.3%) | 253 (3.2%) |
| $75,000 to $99,999 | 686 (7.9%) | 490 (6.2%) |
| $100,000+ | 875 (10.1%) | 236 (3.0%) |
| Total | 8,703 (100.0%) | 7,927 (100.0%) |
Earnings by Sex by Educational Attainment in North Fort Myers
Average earnings in North Fort Myers are $39,350 for men and $28,683 for women, a difference of 27.1%. Men with an educational attainment of high school diploma enjoy the highest average annual earnings of $44,747, while those with college or associate's degree education earn the least with $35,786. Women with an educational attainment of graduate degree earn the most with the average annual earnings of $50,893, while those with less than high school education have the smallest earnings of $22,150.
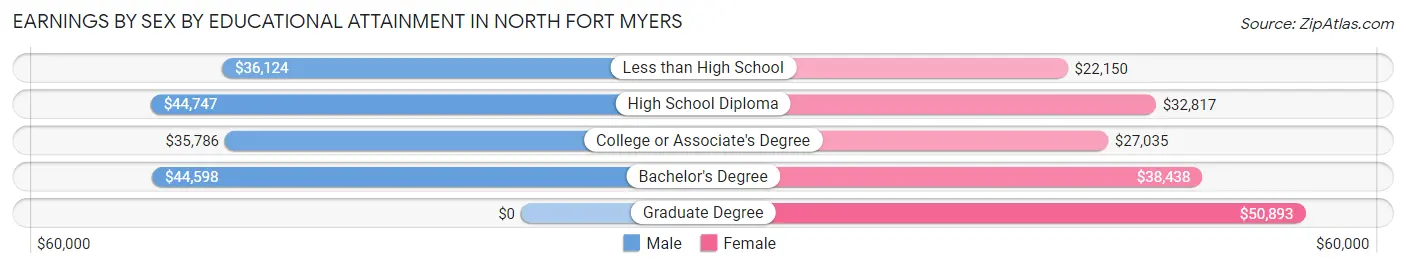
| Educational Attainment | Male Income | Female Income |
| Less than High School | $36,124 | $22,150 |
| High School Diploma | $44,747 | $32,817 |
| College or Associate's Degree | $35,786 | $27,035 |
| Bachelor's Degree | $44,598 | $38,438 |
| Graduate Degree | - | - |
| Total | $39,350 | $28,683 |
Family Income in North Fort Myers
Family Income Brackets in North Fort Myers
According to the North Fort Myers family income data, there are 2,633 families falling into the $50,000 to $74,999 income range, which is the most common income bracket and makes up 23.1% of all families. Conversely, the less than $10,000 income bracket is the least frequent group with only 285 families (2.5%) belonging to this category.
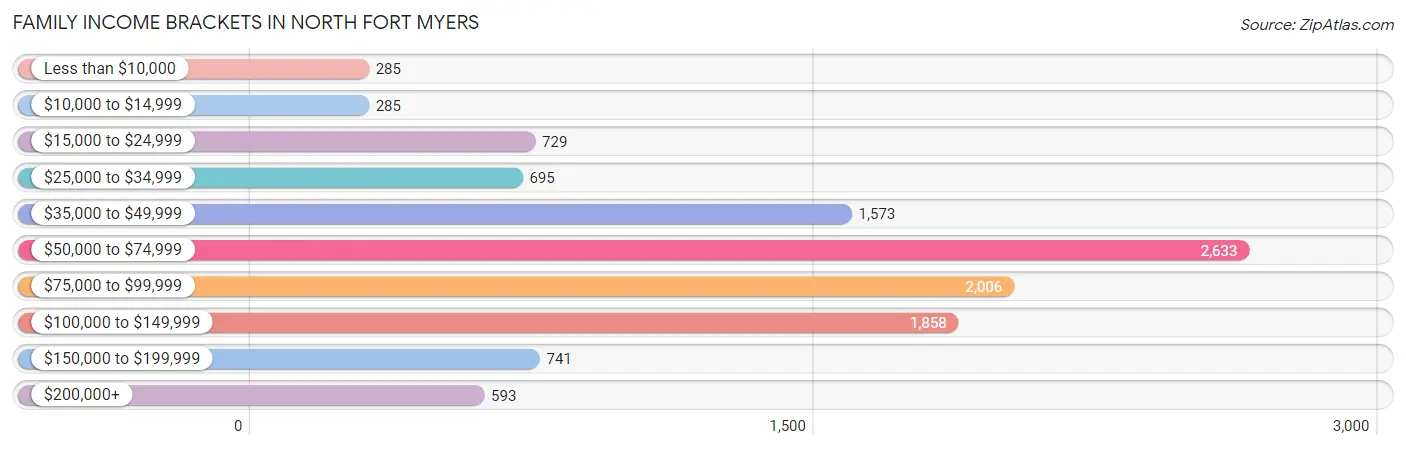
| Income Bracket | # Families | % Families |
| Less than $10,000 | 285 | 2.5% |
| $10,000 to $14,999 | 285 | 2.5% |
| $15,000 to $24,999 | 729 | 6.4% |
| $25,000 to $34,999 | 695 | 6.1% |
| $35,000 to $49,999 | 1,573 | 13.8% |
| $50,000 to $74,999 | 2,633 | 23.1% |
| $75,000 to $99,999 | 2,006 | 17.6% |
| $100,000 to $149,999 | 1,858 | 16.3% |
| $150,000 to $199,999 | 741 | 6.5% |
| $200,000+ | 593 | 5.2% |
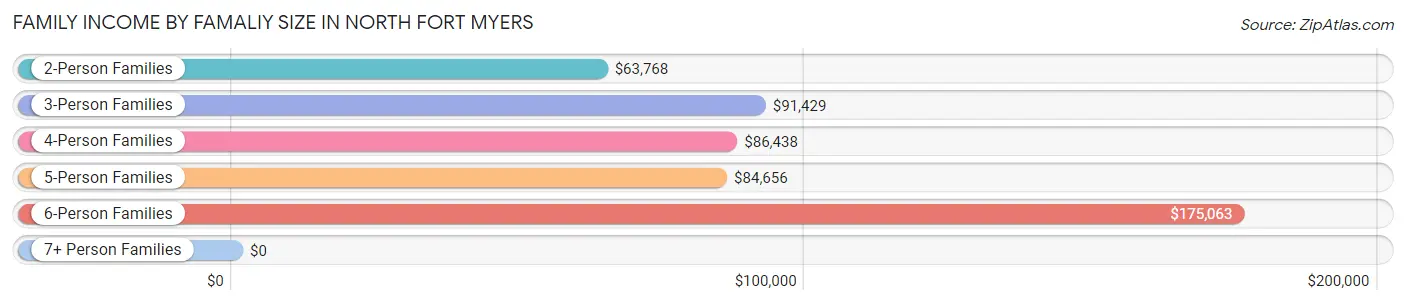
Family Income by Famaliy Size in North Fort Myers
6-person families (63 | 0.5%) account for the highest median family income in North Fort Myers with $175,063 per family, while 2-person families (8,718 | 76.5%) have the highest median income of $31,884 per family member.
| Income Bracket | # Families | Median Income |
| 2-Person Families | 8,718 (76.5%) | $63,768 |
| 3-Person Families | 1,440 (12.6%) | $91,429 |
| 4-Person Families | 849 (7.4%) | $86,438 |
| 5-Person Families | 259 (2.3%) | $84,656 |
| 6-Person Families | 63 (0.5%) | $175,063 |
| 7+ Person Families | 68 (0.6%) | $0 |
| Total | 11,397 (100.0%) | $68,578 |
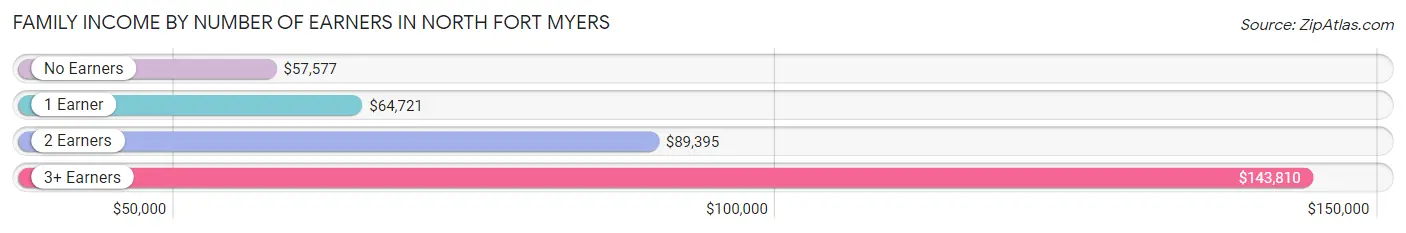
Family Income by Number of Earners in North Fort Myers
The median family income in North Fort Myers is $68,578, with families comprising 3+ earners (598) having the highest median family income of $143,810, while families with no earners (5,171) have the lowest median family income of $57,577, accounting for 5.2% and 45.4% of families, respectively.
| Number of Earners | # Families | Median Income |
| No Earners | 5,171 (45.4%) | $57,577 |
| 1 Earner | 3,051 (26.8%) | $64,721 |
| 2 Earners | 2,577 (22.6%) | $89,395 |
| 3+ Earners | 598 (5.2%) | $143,810 |
| Total | 11,397 (100.0%) | $68,578 |
Household Income in North Fort Myers
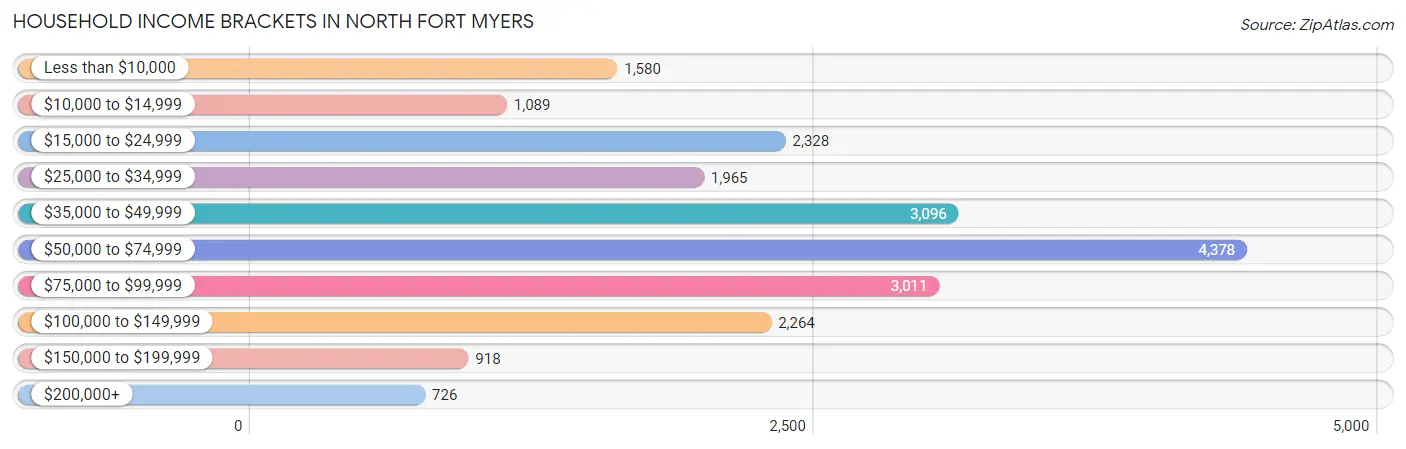
Household Income Brackets in North Fort Myers
With 4,378 households falling in the category, the $50,000 to $74,999 income range is the most frequent in North Fort Myers, accounting for 20.5% of all households. In contrast, only 726 households (3.4%) fall into the $200,000+ income bracket, making it the least populous group.
| Income Bracket | # Households | % Households |
| Less than $10,000 | 1,580 | 7.4% |
| $10,000 to $14,999 | 1,089 | 5.1% |
| $15,000 to $24,999 | 2,328 | 10.9% |
| $25,000 to $34,999 | 1,965 | 9.2% |
| $35,000 to $49,999 | 3,096 | 14.5% |
| $50,000 to $74,999 | 4,378 | 20.5% |
| $75,000 to $99,999 | 3,011 | 14.1% |
| $100,000 to $149,999 | 2,264 | 10.6% |
| $150,000 to $199,999 | 918 | 4.3% |
| $200,000+ | 726 | 3.4% |
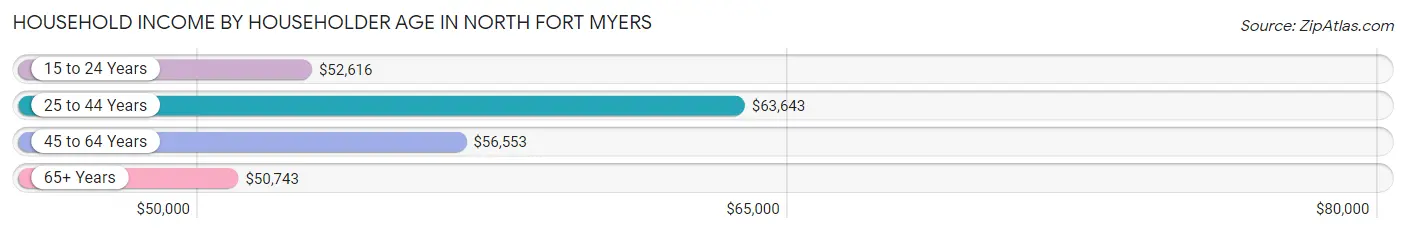
Household Income by Householder Age in North Fort Myers
The median household income in North Fort Myers is $53,705, with the highest median household income of $63,643 found in the 25 to 44 years age bracket for the primary householder. A total of 2,130 households (10.0%) fall into this category. Meanwhile, the 65+ years age bracket for the primary householder has the lowest median household income of $50,743, with 12,553 households (58.8%) in this group.
| Income Bracket | # Households | Median Income |
| 15 to 24 Years | 255 (1.2%) | $52,616 |
| 25 to 44 Years | 2,130 (10.0%) | $63,643 |
| 45 to 64 Years | 6,417 (30.0%) | $56,553 |
| 65+ Years | 12,553 (58.8%) | $50,743 |
| Total | 21,355 (100.0%) | $53,705 |
Poverty in North Fort Myers
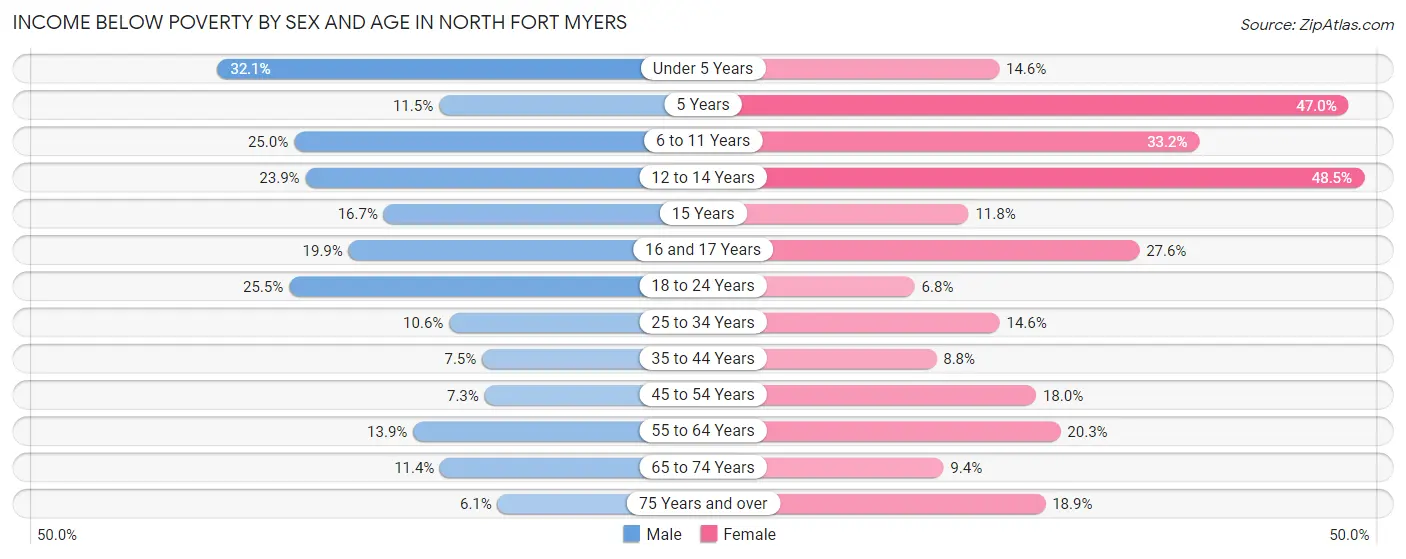
Income Below Poverty by Sex and Age in North Fort Myers
With 11.9% poverty level for males and 16.6% for females among the residents of North Fort Myers, under 5 year old males and 12 to 14 year old females are the most vulnerable to poverty, with 149 males (32.1%) and 125 females (48.4%) in their respective age groups living below the poverty level.
| Age Bracket | Male | Female |
| Under 5 Years | 149 (32.1%) | 108 (14.6%) |
| 5 Years | 6 (11.5%) | 87 (47.0%) |
| 6 to 11 Years | 157 (25.0%) | 204 (33.2%) |
| 12 to 14 Years | 62 (23.9%) | 125 (48.4%) |
| 15 Years | 15 (16.7%) | 14 (11.8%) |
| 16 and 17 Years | 61 (19.9%) | 69 (27.6%) |
| 18 to 24 Years | 331 (25.5%) | 60 (6.8%) |
| 25 to 34 Years | 183 (10.6%) | 158 (14.6%) |
| 35 to 44 Years | 88 (7.5%) | 91 (8.8%) |
| 45 to 54 Years | 134 (7.3%) | 330 (18.0%) |
| 55 to 64 Years | 430 (13.9%) | 854 (20.3%) |
| 65 to 74 Years | 486 (11.4%) | 491 (9.4%) |
| 75 Years and over | 314 (6.1%) | 1,052 (18.9%) |
| Total | 2,416 (11.9%) | 3,643 (16.6%) |
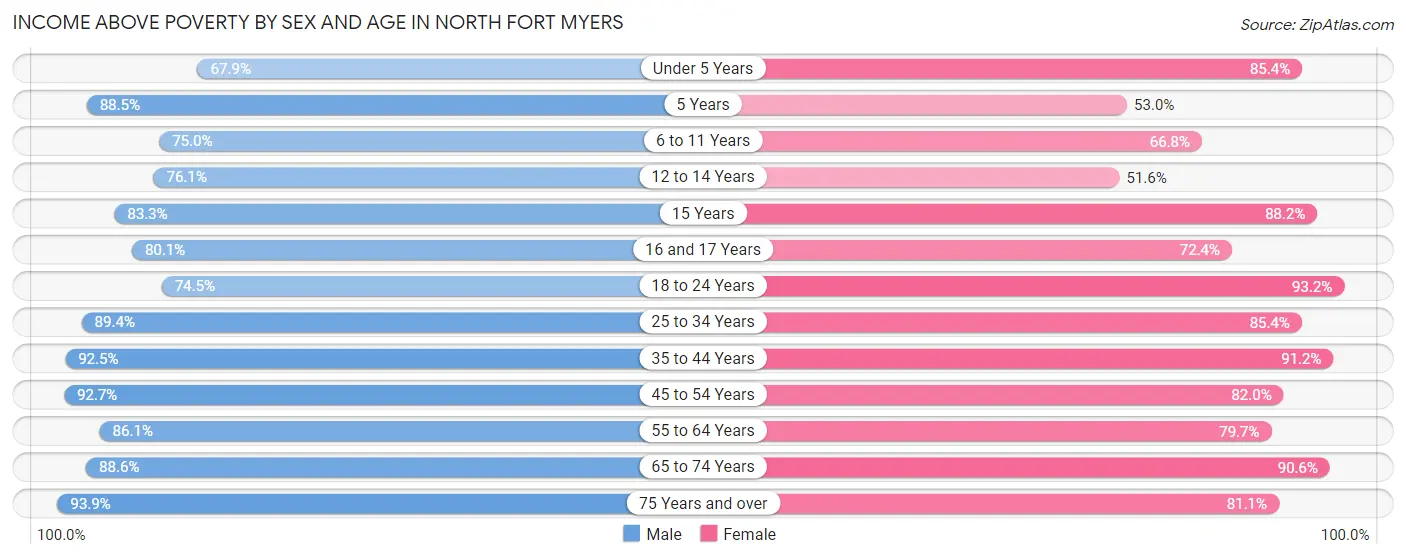
Income Above Poverty by Sex and Age in North Fort Myers
According to the poverty statistics in North Fort Myers, males aged 75 years and over and females aged 18 to 24 years are the age groups that are most secure financially, with 93.9% of males and 93.2% of females in these age groups living above the poverty line.
| Age Bracket | Male | Female |
| Under 5 Years | 315 (67.9%) | 632 (85.4%) |
| 5 Years | 46 (88.5%) | 98 (53.0%) |
| 6 to 11 Years | 471 (75.0%) | 411 (66.8%) |
| 12 to 14 Years | 197 (76.1%) | 133 (51.5%) |
| 15 Years | 75 (83.3%) | 105 (88.2%) |
| 16 and 17 Years | 245 (80.1%) | 181 (72.4%) |
| 18 to 24 Years | 969 (74.5%) | 827 (93.2%) |
| 25 to 34 Years | 1,544 (89.4%) | 921 (85.4%) |
| 35 to 44 Years | 1,079 (92.5%) | 947 (91.2%) |
| 45 to 54 Years | 1,699 (92.7%) | 1,501 (82.0%) |
| 55 to 64 Years | 2,654 (86.1%) | 3,355 (79.7%) |
| 65 to 74 Years | 3,767 (88.6%) | 4,714 (90.6%) |
| 75 Years and over | 4,834 (93.9%) | 4,520 (81.1%) |
| Total | 17,895 (88.1%) | 18,345 (83.4%) |
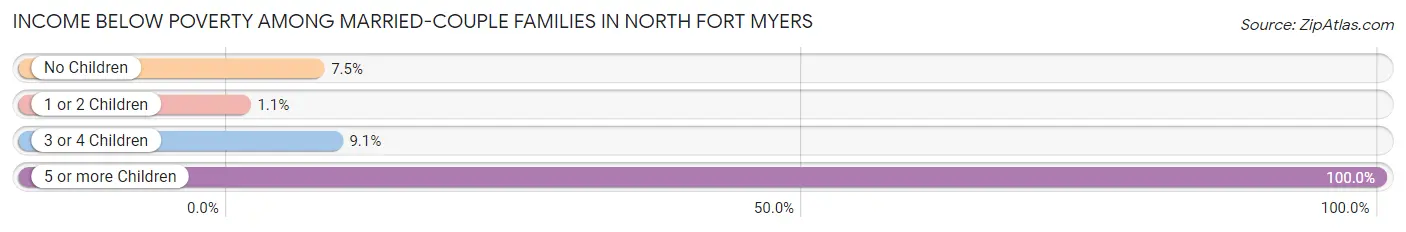
Income Below Poverty Among Married-Couple Families in North Fort Myers
The poverty statistics for married-couple families in North Fort Myers show that 7.0% or 667 of the total 9,576 families live below the poverty line. Families with 5 or more children have the highest poverty rate of 100.0%, comprising of 13 families. On the other hand, families with 1 or 2 children have the lowest poverty rate of 1.1%, which includes 11 families.
| Children | Above Poverty | Below Poverty |
| No Children | 7,792 (92.5%) | 632 (7.5%) |
| 1 or 2 Children | 1,007 (98.9%) | 11 (1.1%) |
| 3 or 4 Children | 110 (90.9%) | 11 (9.1%) |
| 5 or more Children | 0 (0.0%) | 13 (100.0%) |
| Total | 8,909 (93.0%) | 667 (7.0%) |
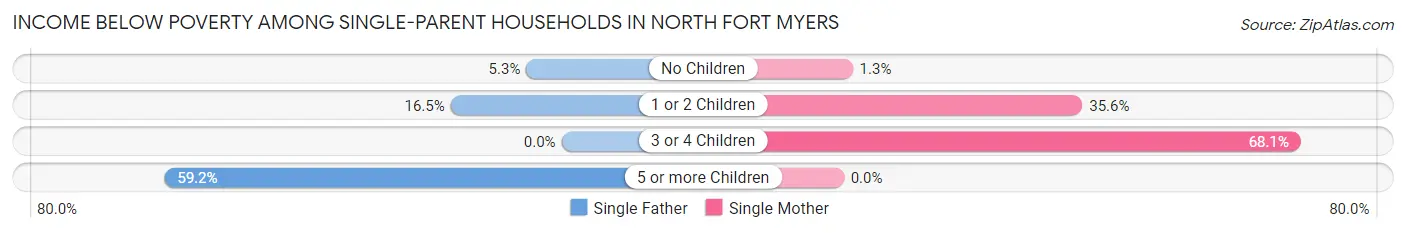
Income Below Poverty Among Single-Parent Households in North Fort Myers
According to the poverty data in North Fort Myers, 13.0% or 90 single-father households and 20.9% or 236 single-mother households are living below the poverty line. Among single-father households, those with 5 or more children have the highest poverty rate, with 29 households (59.2%) experiencing poverty. Likewise, among single-mother households, those with 3 or 4 children have the highest poverty rate, with 79 households (68.1%) falling below the poverty line.
| Children | Single Father | Single Mother |
| No Children | 21 (5.2%) | 8 (1.3%) |
| 1 or 2 Children | 40 (16.5%) | 149 (35.6%) |
| 3 or 4 Children | 0 (0.0%) | 79 (68.1%) |
| 5 or more Children | 29 (59.2%) | 0 (0.0%) |
| Total | 90 (13.0%) | 236 (20.9%) |
Income Below Poverty Among Married-Couple vs Single-Parent Households in North Fort Myers
The poverty data for North Fort Myers shows that 667 of the married-couple family households (7.0%) and 326 of the single-parent households (17.9%) are living below the poverty level. Within the married-couple family households, those with 5 or more children have the highest poverty rate, with 13 households (100.0%) falling below the poverty line. Among the single-parent households, those with 3 or 4 children have the highest poverty rate, with 79 household (68.1%) living below poverty.
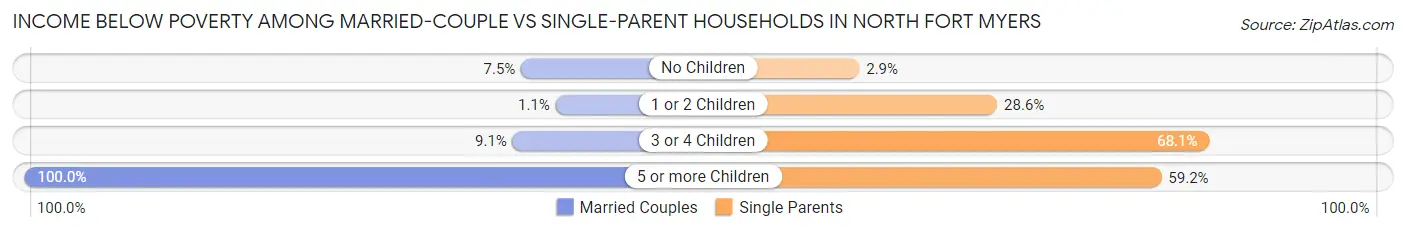
| Children | Married-Couple Families | Single-Parent Households |
| No Children | 632 (7.5%) | 29 (2.9%) |
| 1 or 2 Children | 11 (1.1%) | 189 (28.6%) |
| 3 or 4 Children | 11 (9.1%) | 79 (68.1%) |
| 5 or more Children | 13 (100.0%) | 29 (59.2%) |
| Total | 667 (7.0%) | 326 (17.9%) |
Employment Characteristics in North Fort Myers
Employment by Class of Employer in North Fort Myers
Among the 14,419 employed individuals in North Fort Myers, private company employees (10,134 | 70.3%), local government employees (1,106 | 7.7%), and self-employed (incorporated) (1,101 | 7.6%) make up the most common classes of employment.
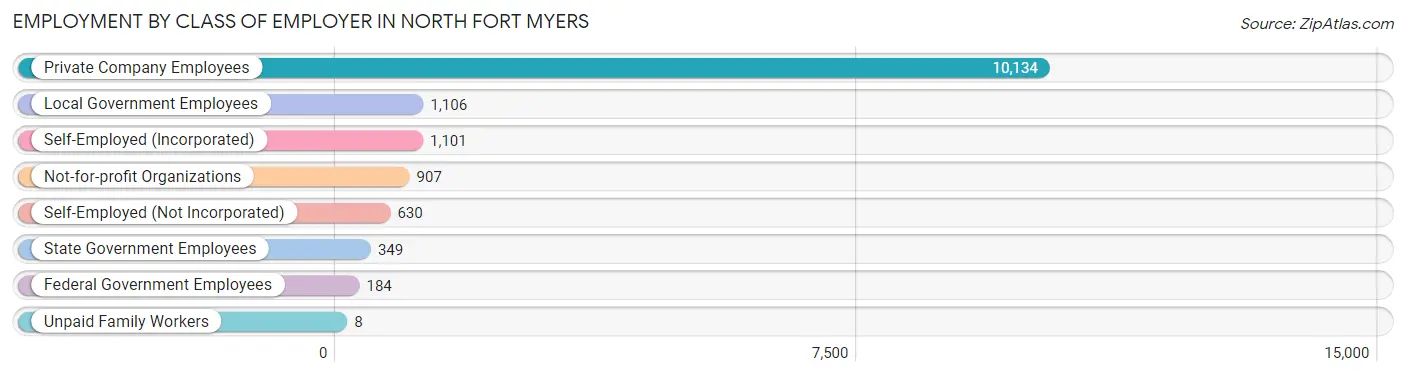
| Employer Class | # Employees | % Employees |
| Private Company Employees | 10,134 | 70.3% |
| Self-Employed (Incorporated) | 1,101 | 7.6% |
| Self-Employed (Not Incorporated) | 630 | 4.4% |
| Not-for-profit Organizations | 907 | 6.3% |
| Local Government Employees | 1,106 | 7.7% |
| State Government Employees | 349 | 2.4% |
| Federal Government Employees | 184 | 1.3% |
| Unpaid Family Workers | 8 | 0.1% |
| Total | 14,419 | 100.0% |
Employment Status by Age in North Fort Myers
According to the labor force statistics for North Fort Myers, out of the total population over 16 years of age (39,047), 39.8% or 15,541 individuals are in the labor force, with 5.0% or 777 of them unemployed. The age group with the highest labor force participation rate is 35 to 44 years, with 88.7% or 1,956 individuals in the labor force. Within the labor force, the 55 to 59 years age range has the highest percentage of unemployed individuals, with 18.0% or 359 of them being unemployed.
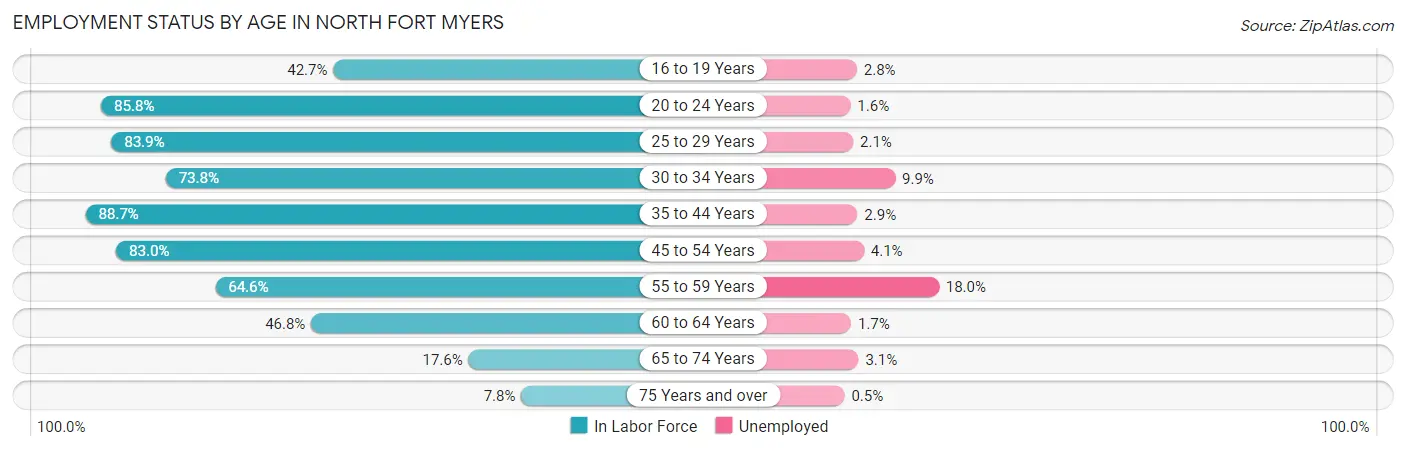
| Age Bracket | In Labor Force | Unemployed |
| 16 to 19 Years | 535 (42.7%) | 15 (2.8%) |
| 20 to 24 Years | 1,278 (85.8%) | 20 (1.6%) |
| 25 to 29 Years | 1,444 (83.9%) | 30 (2.1%) |
| 30 to 34 Years | 801 (73.8%) | 79 (9.9%) |
| 35 to 44 Years | 1,956 (88.7%) | 57 (2.9%) |
| 45 to 54 Years | 3,041 (83.0%) | 125 (4.1%) |
| 55 to 59 Years | 1,992 (64.6%) | 359 (18.0%) |
| 60 to 64 Years | 1,970 (46.8%) | 33 (1.7%) |
| 65 to 74 Years | 1,667 (17.6%) | 52 (3.1%) |
| 75 Years and over | 847 (7.8%) | 4 (0.5%) |
| Total | 15,541 (39.8%) | 777 (5.0%) |
Employment Status by Educational Attainment in North Fort Myers
According to labor force statistics for North Fort Myers, 70.2% of individuals (11,210) out of the total population between 25 and 64 years of age (15,968) are in the labor force, with 6.1% or 684 of them being unemployed. The group with the highest labor force participation rate are those with the educational attainment of college / associate degree, with 78.4% or 4,455 individuals in the labor force. Within the labor force, individuals with high school diploma education have the highest percentage of unemployment, with 9.2% or 344 of them being unemployed.
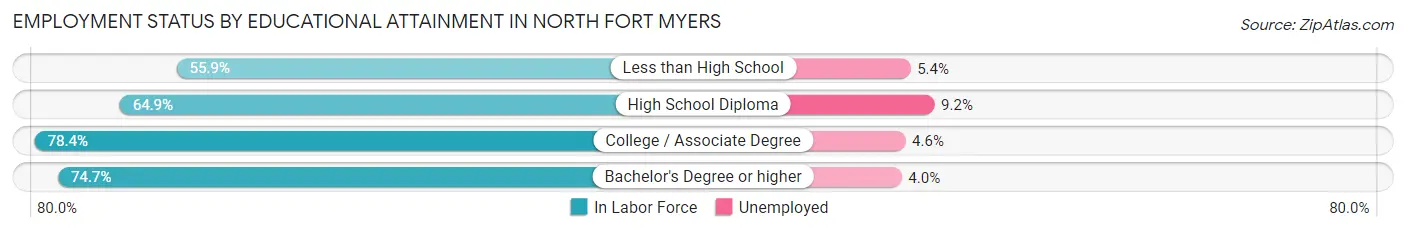
| Educational Attainment | In Labor Force | Unemployed |
| Less than High School | 1,105 (55.9%) | 107 (5.4%) |
| High School Diploma | 3,739 (64.9%) | 530 (9.2%) |
| College / Associate Degree | 4,455 (78.4%) | 261 (4.6%) |
| Bachelor's Degree or higher | 1,903 (74.7%) | 102 (4.0%) |
| Total | 11,210 (70.2%) | 974 (6.1%) |
Employment Occupations by Sex in North Fort Myers
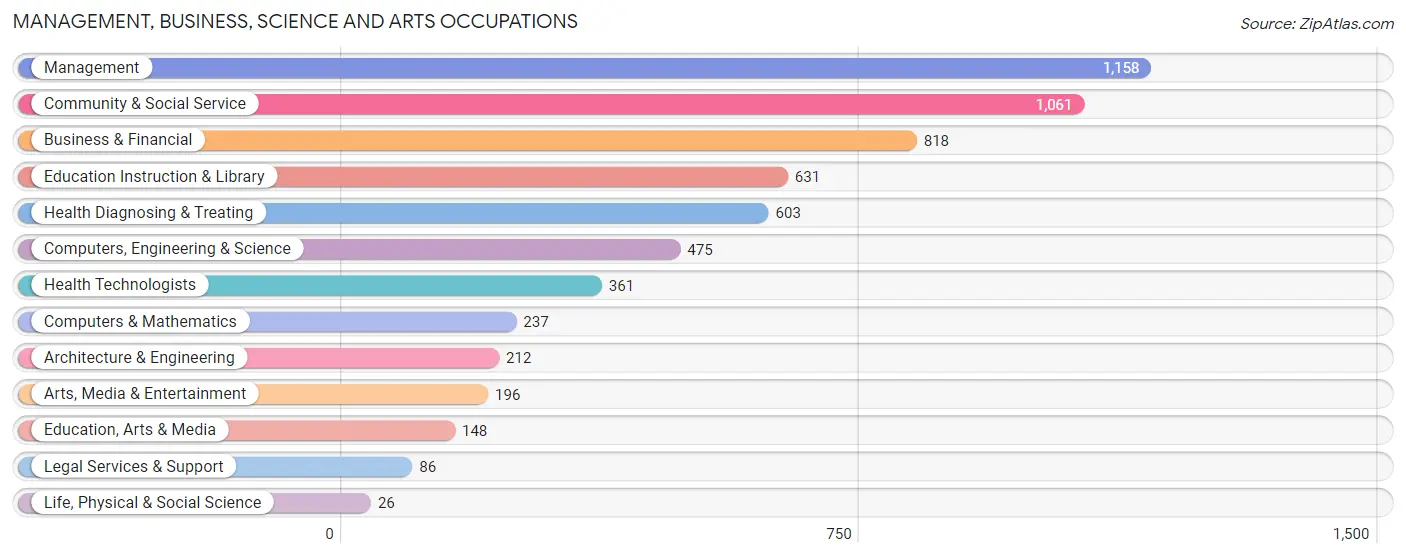
Management, Business, Science and Arts Occupations
The most common Management, Business, Science and Arts occupations in North Fort Myers are Management (1,158 | 7.9%), Community & Social Service (1,061 | 7.2%), Business & Financial (818 | 5.6%), Education Instruction & Library (631 | 4.3%), and Health Diagnosing & Treating (603 | 4.1%).
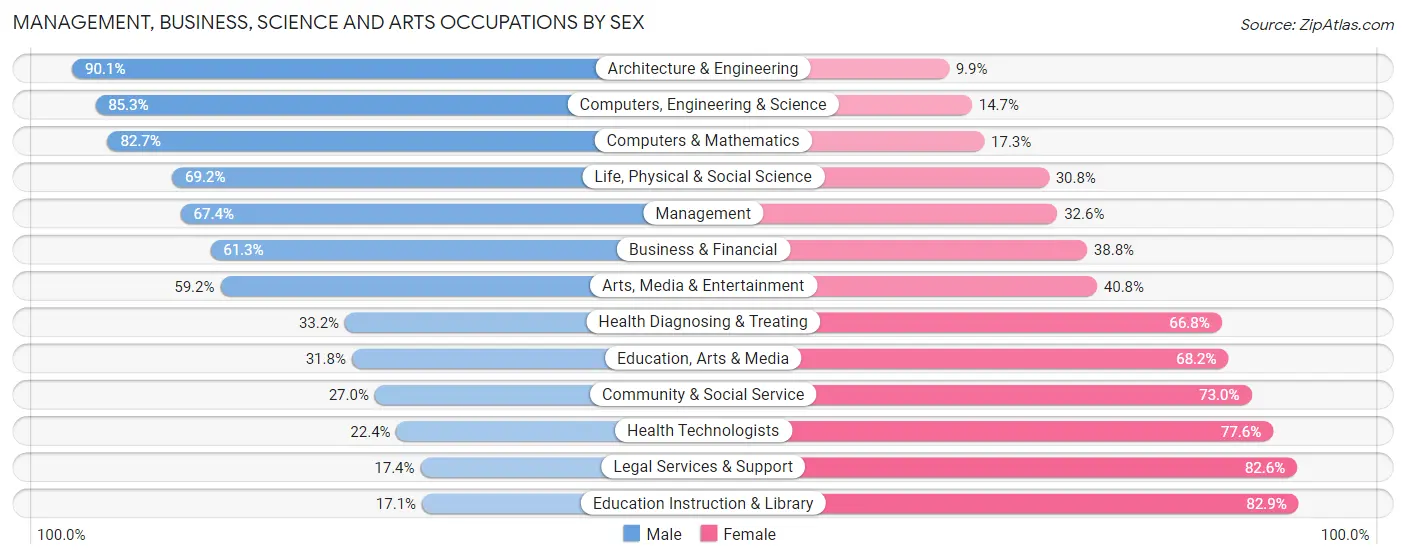
Management, Business, Science and Arts Occupations by Sex
Within the Management, Business, Science and Arts occupations in North Fort Myers, the most male-oriented occupations are Architecture & Engineering (90.1%), Computers, Engineering & Science (85.3%), and Computers & Mathematics (82.7%), while the most female-oriented occupations are Education Instruction & Library (82.9%), Legal Services & Support (82.6%), and Health Technologists (77.6%).
| Occupation | Male | Female |
| Management | 781 (67.4%) | 377 (32.6%) |
| Business & Financial | 501 (61.3%) | 317 (38.8%) |
| Computers, Engineering & Science | 405 (85.3%) | 70 (14.7%) |
| Computers & Mathematics | 196 (82.7%) | 41 (17.3%) |
| Architecture & Engineering | 191 (90.1%) | 21 (9.9%) |
| Life, Physical & Social Science | 18 (69.2%) | 8 (30.8%) |
| Community & Social Service | 286 (27.0%) | 775 (73.0%) |
| Education, Arts & Media | 47 (31.8%) | 101 (68.2%) |
| Legal Services & Support | 15 (17.4%) | 71 (82.6%) |
| Education Instruction & Library | 108 (17.1%) | 523 (82.9%) |
| Arts, Media & Entertainment | 116 (59.2%) | 80 (40.8%) |
| Health Diagnosing & Treating | 200 (33.2%) | 403 (66.8%) |
| Health Technologists | 81 (22.4%) | 280 (77.6%) |
| Total (Category) | 2,173 (52.8%) | 1,942 (47.2%) |
| Total (Overall) | 7,482 (50.7%) | 7,265 (49.3%) |
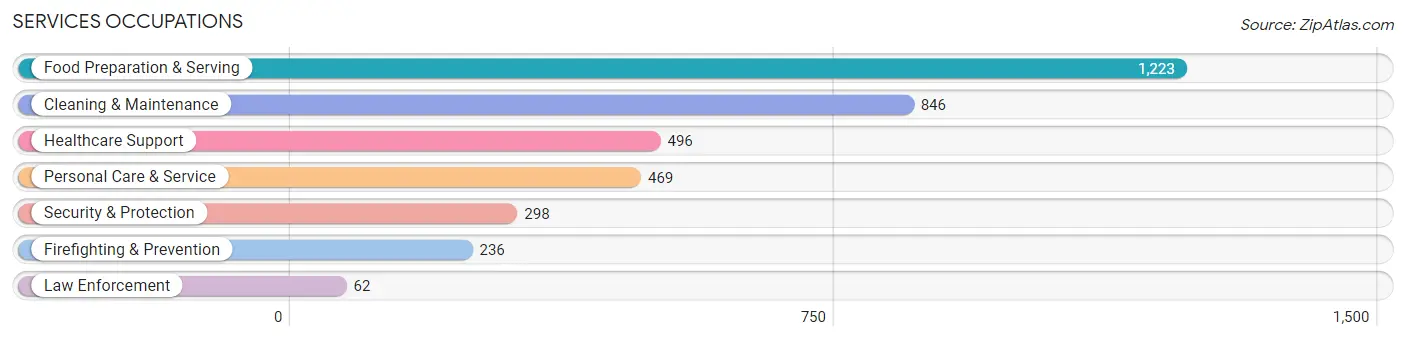
Services Occupations
The most common Services occupations in North Fort Myers are Food Preparation & Serving (1,223 | 8.3%), Cleaning & Maintenance (846 | 5.7%), Healthcare Support (496 | 3.4%), Personal Care & Service (469 | 3.2%), and Security & Protection (298 | 2.0%).
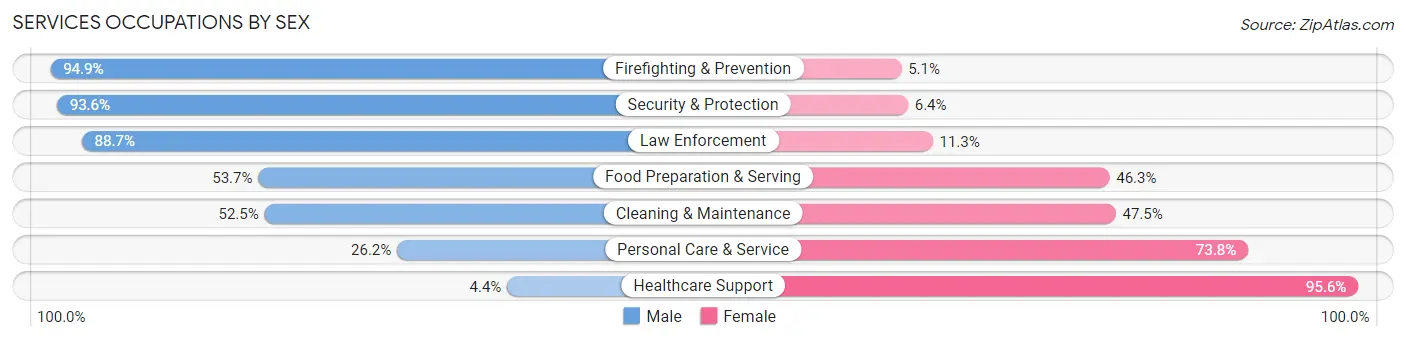
Services Occupations by Sex
Within the Services occupations in North Fort Myers, the most male-oriented occupations are Firefighting & Prevention (94.9%), Security & Protection (93.6%), and Law Enforcement (88.7%), while the most female-oriented occupations are Healthcare Support (95.6%), Personal Care & Service (73.8%), and Cleaning & Maintenance (47.5%).
| Occupation | Male | Female |
| Healthcare Support | 22 (4.4%) | 474 (95.6%) |
| Security & Protection | 279 (93.6%) | 19 (6.4%) |
| Firefighting & Prevention | 224 (94.9%) | 12 (5.1%) |
| Law Enforcement | 55 (88.7%) | 7 (11.3%) |
| Food Preparation & Serving | 657 (53.7%) | 566 (46.3%) |
| Cleaning & Maintenance | 444 (52.5%) | 402 (47.5%) |
| Personal Care & Service | 123 (26.2%) | 346 (73.8%) |
| Total (Category) | 1,525 (45.8%) | 1,807 (54.2%) |
| Total (Overall) | 7,482 (50.7%) | 7,265 (49.3%) |
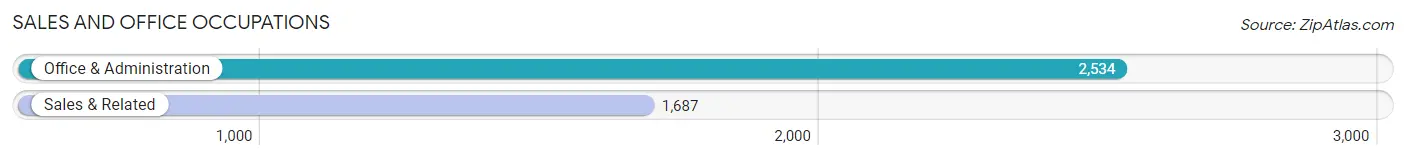
Sales and Office Occupations
The most common Sales and Office occupations in North Fort Myers are Office & Administration (2,534 | 17.2%), and Sales & Related (1,687 | 11.4%).
Sales and Office Occupations by Sex
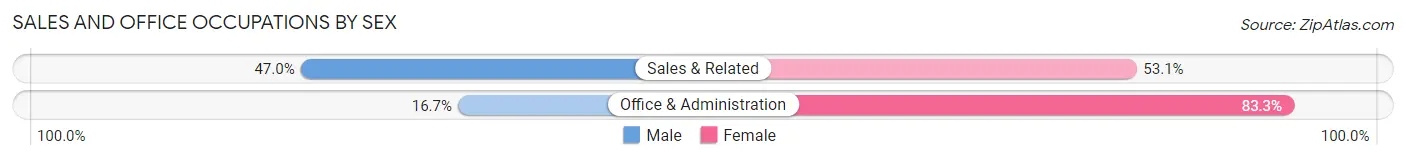
| Occupation | Male | Female |
| Sales & Related | 792 (46.9%) | 895 (53.0%) |
| Office & Administration | 423 (16.7%) | 2,111 (83.3%) |
| Total (Category) | 1,215 (28.8%) | 3,006 (71.2%) |
| Total (Overall) | 7,482 (50.7%) | 7,265 (49.3%) |
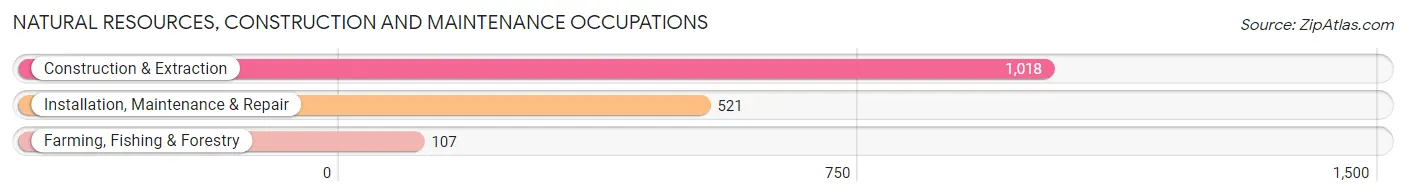
Natural Resources, Construction and Maintenance Occupations
The most common Natural Resources, Construction and Maintenance occupations in North Fort Myers are Construction & Extraction (1,018 | 6.9%), Installation, Maintenance & Repair (521 | 3.5%), and Farming, Fishing & Forestry (107 | 0.7%).
Natural Resources, Construction and Maintenance Occupations by Sex
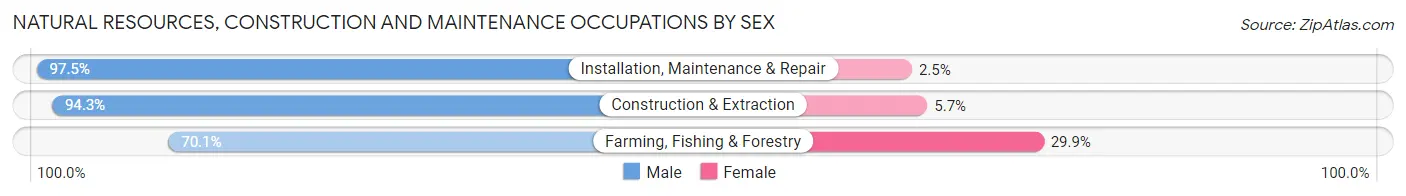
| Occupation | Male | Female |
| Farming, Fishing & Forestry | 75 (70.1%) | 32 (29.9%) |
| Construction & Extraction | 960 (94.3%) | 58 (5.7%) |
| Installation, Maintenance & Repair | 508 (97.5%) | 13 (2.5%) |
| Total (Category) | 1,543 (93.7%) | 103 (6.3%) |
| Total (Overall) | 7,482 (50.7%) | 7,265 (49.3%) |
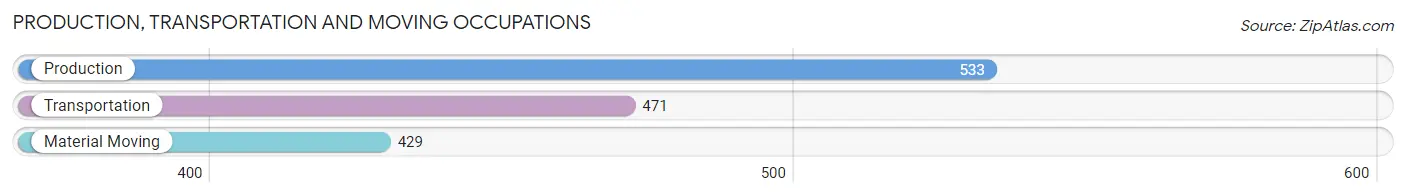
Production, Transportation and Moving Occupations
The most common Production, Transportation and Moving occupations in North Fort Myers are Production (533 | 3.6%), Transportation (471 | 3.2%), and Material Moving (429 | 2.9%).
Production, Transportation and Moving Occupations by Sex
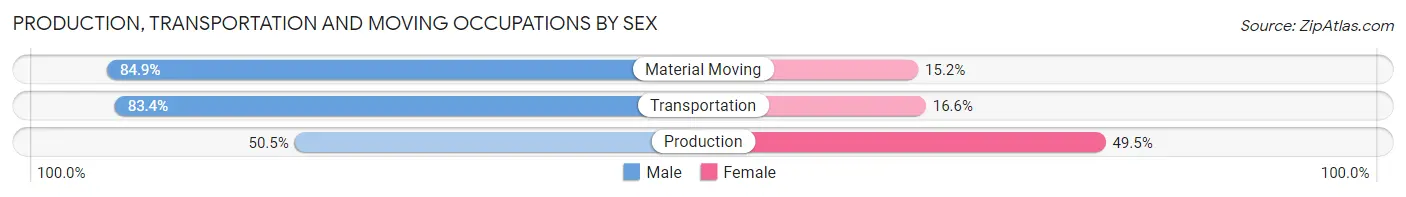
| Occupation | Male | Female |
| Production | 269 (50.5%) | 264 (49.5%) |
| Transportation | 393 (83.4%) | 78 (16.6%) |
| Material Moving | 364 (84.9%) | 65 (15.1%) |
| Total (Category) | 1,026 (71.6%) | 407 (28.4%) |
| Total (Overall) | 7,482 (50.7%) | 7,265 (49.3%) |
Employment Industries by Sex in North Fort Myers
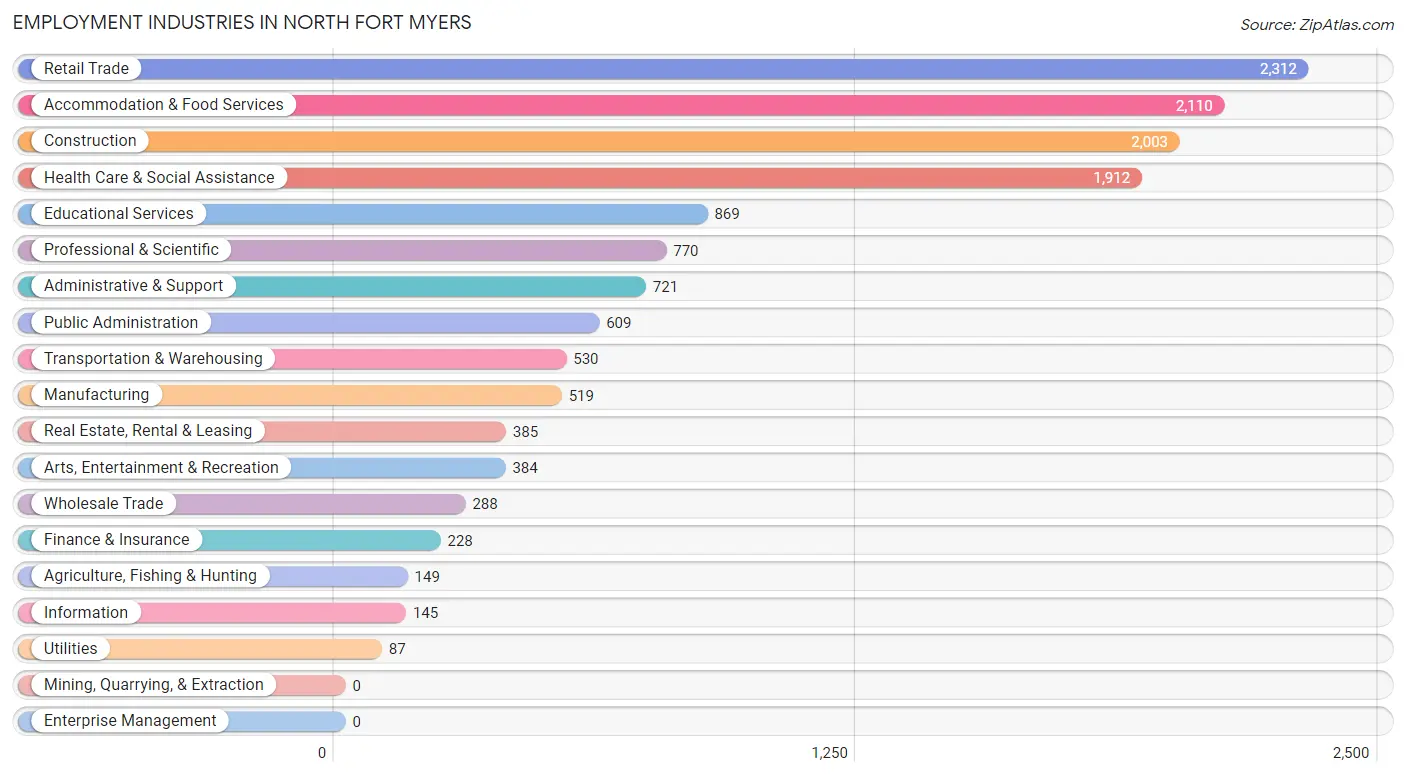
Employment Industries in North Fort Myers
The major employment industries in North Fort Myers include Retail Trade (2,312 | 15.7%), Accommodation & Food Services (2,110 | 14.3%), Construction (2,003 | 13.6%), Health Care & Social Assistance (1,912 | 13.0%), and Educational Services (869 | 5.9%).
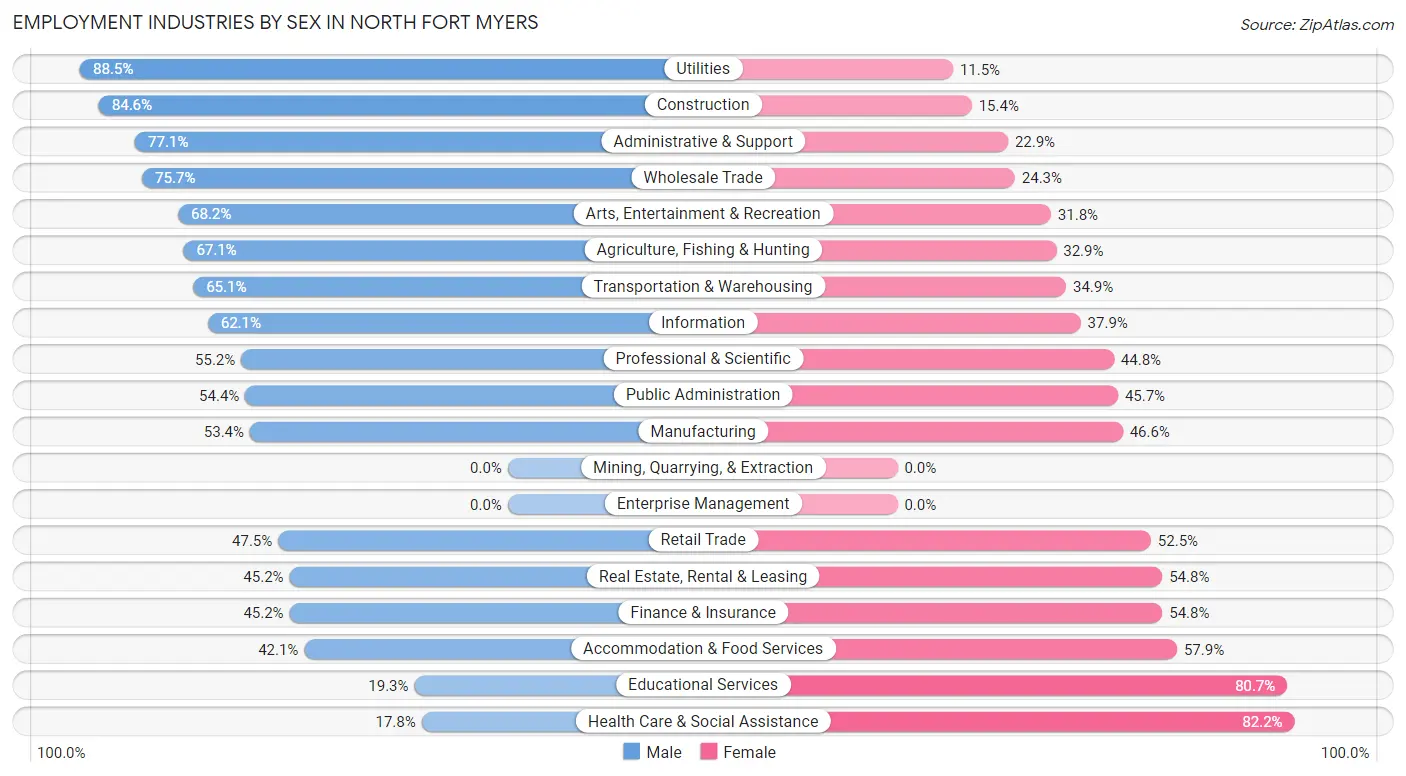
Employment Industries by Sex in North Fort Myers
The North Fort Myers industries that see more men than women are Utilities (88.5%), Construction (84.6%), and Administrative & Support (77.1%), whereas the industries that tend to have a higher number of women are Health Care & Social Assistance (82.2%), Educational Services (80.7%), and Accommodation & Food Services (57.9%).
| Industry | Male | Female |
| Agriculture, Fishing & Hunting | 100 (67.1%) | 49 (32.9%) |
| Mining, Quarrying, & Extraction | 0 (0.0%) | 0 (0.0%) |
| Construction | 1,695 (84.6%) | 308 (15.4%) |
| Manufacturing | 277 (53.4%) | 242 (46.6%) |
| Wholesale Trade | 218 (75.7%) | 70 (24.3%) |
| Retail Trade | 1,099 (47.5%) | 1,213 (52.5%) |
| Transportation & Warehousing | 345 (65.1%) | 185 (34.9%) |
| Utilities | 77 (88.5%) | 10 (11.5%) |
| Information | 90 (62.1%) | 55 (37.9%) |
| Finance & Insurance | 103 (45.2%) | 125 (54.8%) |
| Real Estate, Rental & Leasing | 174 (45.2%) | 211 (54.8%) |
| Professional & Scientific | 425 (55.2%) | 345 (44.8%) |
| Enterprise Management | 0 (0.0%) | 0 (0.0%) |
| Administrative & Support | 556 (77.1%) | 165 (22.9%) |
| Educational Services | 168 (19.3%) | 701 (80.7%) |
| Health Care & Social Assistance | 341 (17.8%) | 1,571 (82.2%) |
| Arts, Entertainment & Recreation | 262 (68.2%) | 122 (31.8%) |
| Accommodation & Food Services | 889 (42.1%) | 1,221 (57.9%) |
| Public Administration | 331 (54.3%) | 278 (45.7%) |
| Total | 7,482 (50.7%) | 7,265 (49.3%) |
Education in North Fort Myers
School Enrollment in North Fort Myers
The most common levels of schooling among the 4,409 students in North Fort Myers are high school (1,089 | 24.7%), college / undergraduate (969 | 22.0%), and middle school (811 | 18.4%).
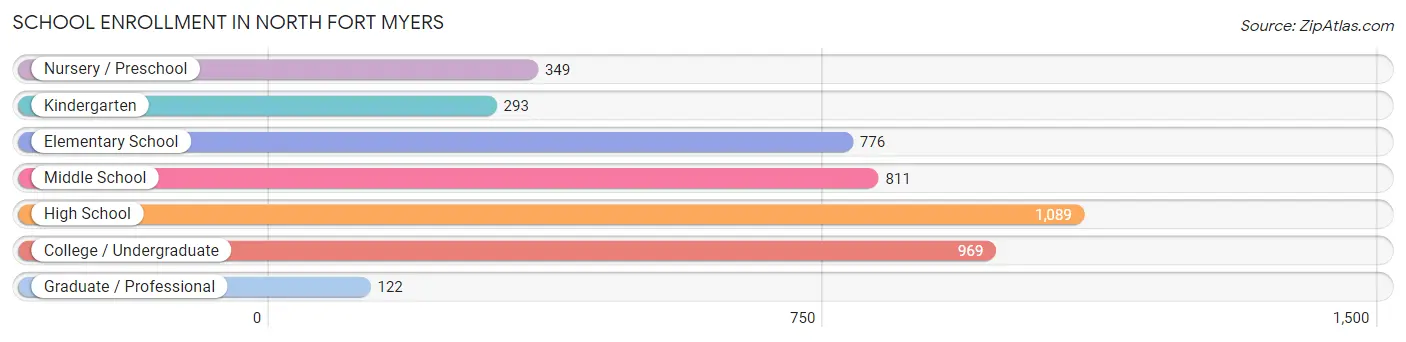
| School Level | # Students | % Students |
| Nursery / Preschool | 349 | 7.9% |
| Kindergarten | 293 | 6.7% |
| Elementary School | 776 | 17.6% |
| Middle School | 811 | 18.4% |
| High School | 1,089 | 24.7% |
| College / Undergraduate | 969 | 22.0% |
| Graduate / Professional | 122 | 2.8% |
| Total | 4,409 | 100.0% |
School Enrollment by Age by Funding Source in North Fort Myers
Out of a total of 4,409 students who are enrolled in schools in North Fort Myers, 736 (16.7%) attend a private institution, while the remaining 3,673 (83.3%) are enrolled in public schools. The age group of 3 to 4 year olds has the highest likelihood of being enrolled in private schools, with 171 (55.3% in the age bracket) enrolled. Conversely, the age group of 25 to 34 year olds has the lowest likelihood of being enrolled in a private school, with 256 (93.1% in the age bracket) attending a public institution.
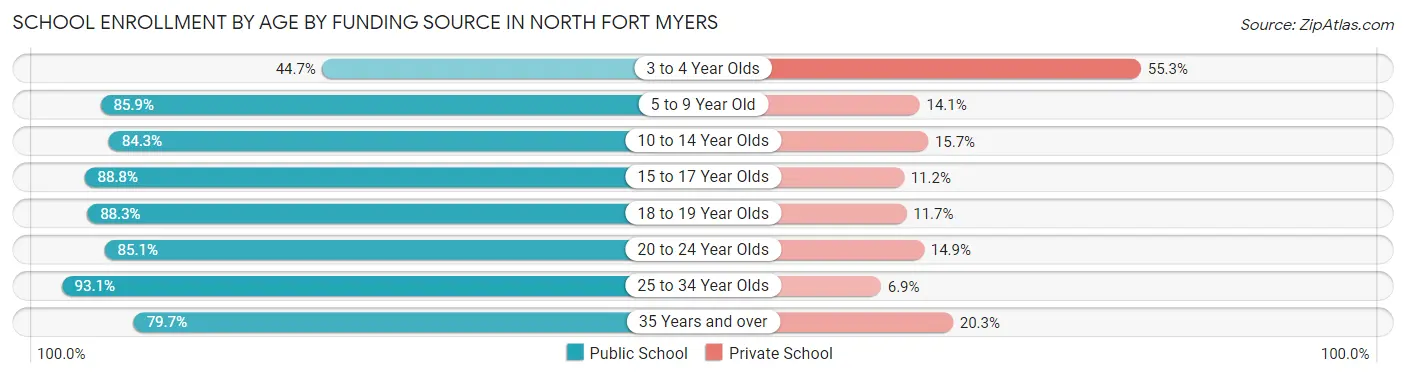
| Age Bracket | Public School | Private School |
| 3 to 4 Year Olds | 138 (44.7%) | 171 (55.3%) |
| 5 to 9 Year Old | 856 (85.9%) | 141 (14.1%) |
| 10 to 14 Year Olds | 827 (84.3%) | 154 (15.7%) |
| 15 to 17 Year Olds | 667 (88.8%) | 84 (11.2%) |
| 18 to 19 Year Olds | 386 (88.3%) | 51 (11.7%) |
| 20 to 24 Year Olds | 251 (85.1%) | 44 (14.9%) |
| 25 to 34 Year Olds | 256 (93.1%) | 19 (6.9%) |
| 35 Years and over | 290 (79.7%) | 74 (20.3%) |
| Total | 3,673 (83.3%) | 736 (16.7%) |
Educational Attainment by Field of Study in North Fort Myers
Business (1,660 | 21.2%), education (1,319 | 16.9%), science & technology (989 | 12.7%), social sciences (897 | 11.5%), and arts & humanities (423 | 5.4%) are the most common fields of study among 7,820 individuals in North Fort Myers who have obtained a bachelor's degree or higher.
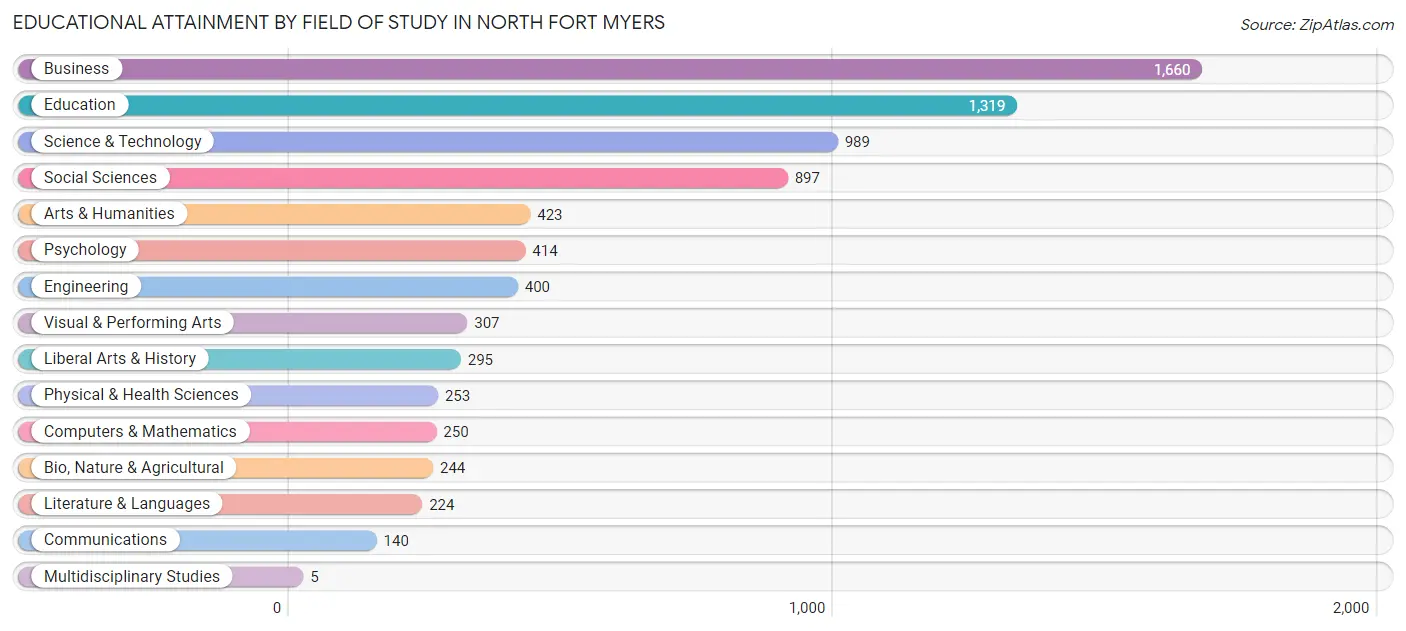
| Field of Study | # Graduates | % Graduates |
| Computers & Mathematics | 250 | 3.2% |
| Bio, Nature & Agricultural | 244 | 3.1% |
| Physical & Health Sciences | 253 | 3.2% |
| Psychology | 414 | 5.3% |
| Social Sciences | 897 | 11.5% |
| Engineering | 400 | 5.1% |
| Multidisciplinary Studies | 5 | 0.1% |
| Science & Technology | 989 | 12.7% |
| Business | 1,660 | 21.2% |
| Education | 1,319 | 16.9% |
| Literature & Languages | 224 | 2.9% |
| Liberal Arts & History | 295 | 3.8% |
| Visual & Performing Arts | 307 | 3.9% |
| Communications | 140 | 1.8% |
| Arts & Humanities | 423 | 5.4% |
| Total | 7,820 | 100.0% |
Transportation & Commute in North Fort Myers
Vehicle Availability by Sex in North Fort Myers
The most prevalent vehicle ownership categories in North Fort Myers are males with 2 vehicles (3,102, accounting for 42.3%) and females with 2 vehicles (2,713, making up 43.9%).
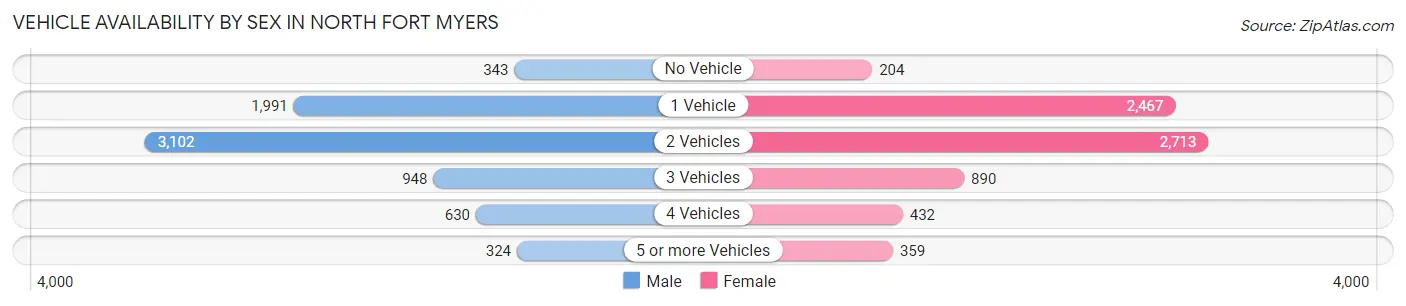
| Vehicles Available | Male | Female |
| No Vehicle | 343 (4.7%) | 204 (2.9%) |
| 1 Vehicle | 1,991 (27.1%) | 2,467 (34.9%) |
| 2 Vehicles | 3,102 (42.3%) | 2,713 (38.4%) |
| 3 Vehicles | 948 (12.9%) | 890 (12.6%) |
| 4 Vehicles | 630 (8.6%) | 432 (6.1%) |
| 5 or more Vehicles | 324 (4.4%) | 359 (5.1%) |
| Total | 7,338 (100.0%) | 7,065 (100.0%) |
Commute Time in North Fort Myers
The most frequently occuring commute durations in North Fort Myers are 20 to 24 minutes (2,438 commuters, 18.5%), 30 to 34 minutes (2,224 commuters, 16.9%), and 15 to 19 minutes (1,952 commuters, 14.8%).
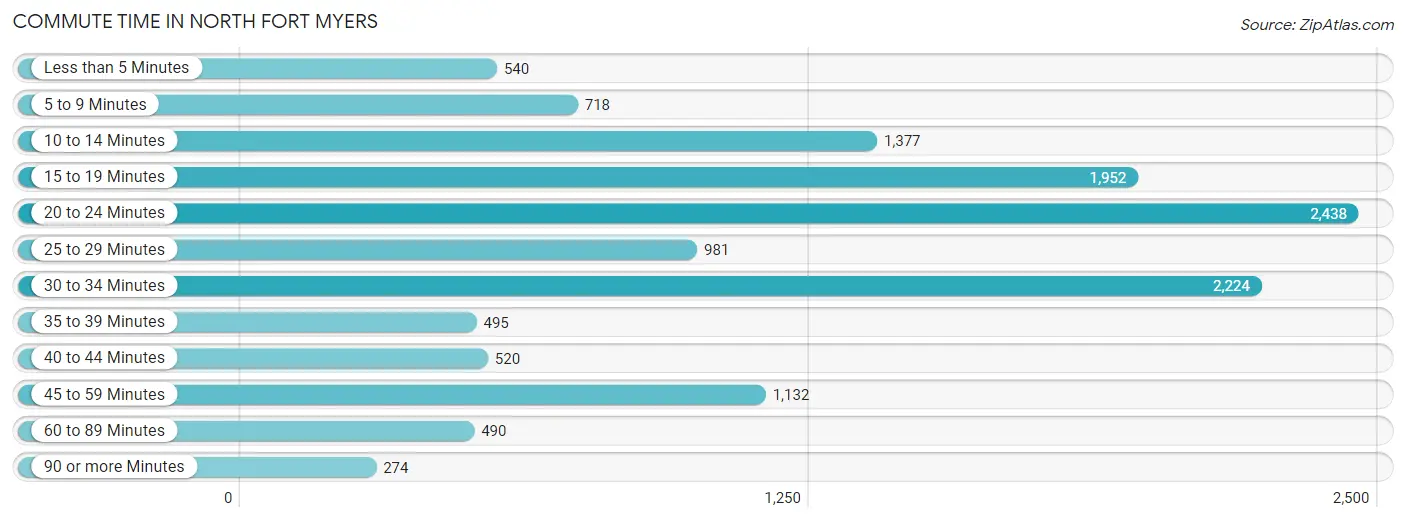
| Commute Time | # Commuters | % Commuters |
| Less than 5 Minutes | 540 | 4.1% |
| 5 to 9 Minutes | 718 | 5.5% |
| 10 to 14 Minutes | 1,377 | 10.5% |
| 15 to 19 Minutes | 1,952 | 14.8% |
| 20 to 24 Minutes | 2,438 | 18.5% |
| 25 to 29 Minutes | 981 | 7.5% |
| 30 to 34 Minutes | 2,224 | 16.9% |
| 35 to 39 Minutes | 495 | 3.8% |
| 40 to 44 Minutes | 520 | 4.0% |
| 45 to 59 Minutes | 1,132 | 8.6% |
| 60 to 89 Minutes | 490 | 3.7% |
| 90 or more Minutes | 274 | 2.1% |
Commute Time by Sex in North Fort Myers
The most common commute times in North Fort Myers are 20 to 24 minutes (1,170 commuters, 17.4%) for males and 20 to 24 minutes (1,268 commuters, 19.8%) for females.
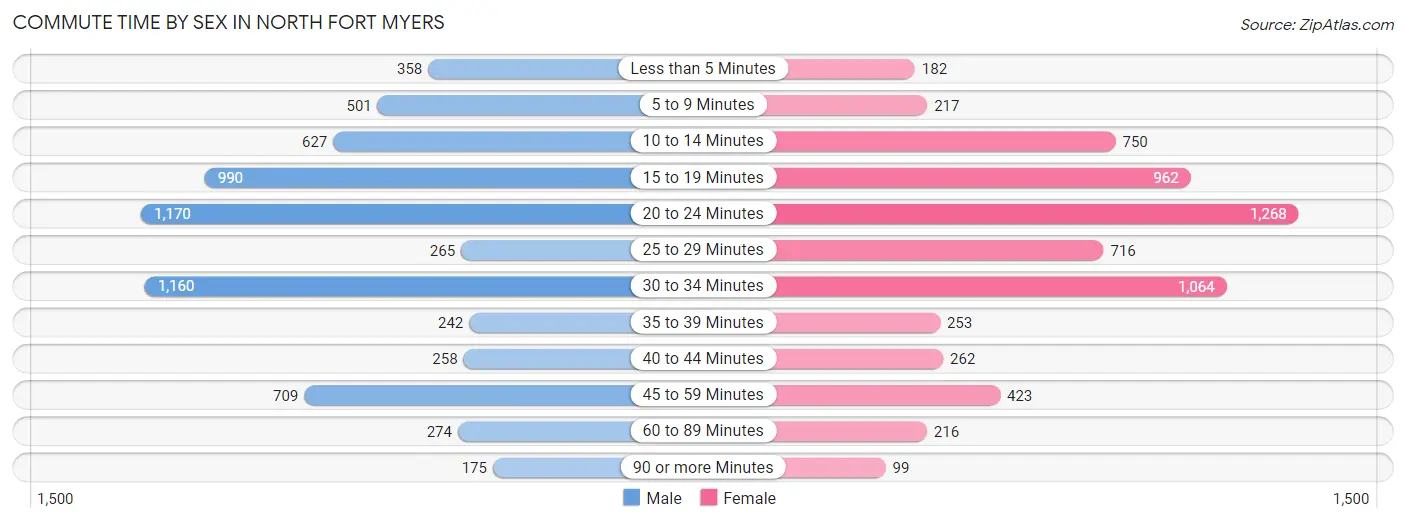
| Commute Time | Male | Female |
| Less than 5 Minutes | 358 (5.3%) | 182 (2.8%) |
| 5 to 9 Minutes | 501 (7.4%) | 217 (3.4%) |
| 10 to 14 Minutes | 627 (9.3%) | 750 (11.7%) |
| 15 to 19 Minutes | 990 (14.7%) | 962 (15.0%) |
| 20 to 24 Minutes | 1,170 (17.4%) | 1,268 (19.8%) |
| 25 to 29 Minutes | 265 (3.9%) | 716 (11.2%) |
| 30 to 34 Minutes | 1,160 (17.2%) | 1,064 (16.6%) |
| 35 to 39 Minutes | 242 (3.6%) | 253 (4.0%) |
| 40 to 44 Minutes | 258 (3.8%) | 262 (4.1%) |
| 45 to 59 Minutes | 709 (10.5%) | 423 (6.6%) |
| 60 to 89 Minutes | 274 (4.1%) | 216 (3.4%) |
| 90 or more Minutes | 175 (2.6%) | 99 (1.5%) |
Time of Departure to Work by Sex in North Fort Myers
The most frequent times of departure to work in North Fort Myers are 7:00 AM to 7:29 AM (1,144, 17.0%) for males and 7:00 AM to 7:29 AM (1,261, 19.7%) for females.
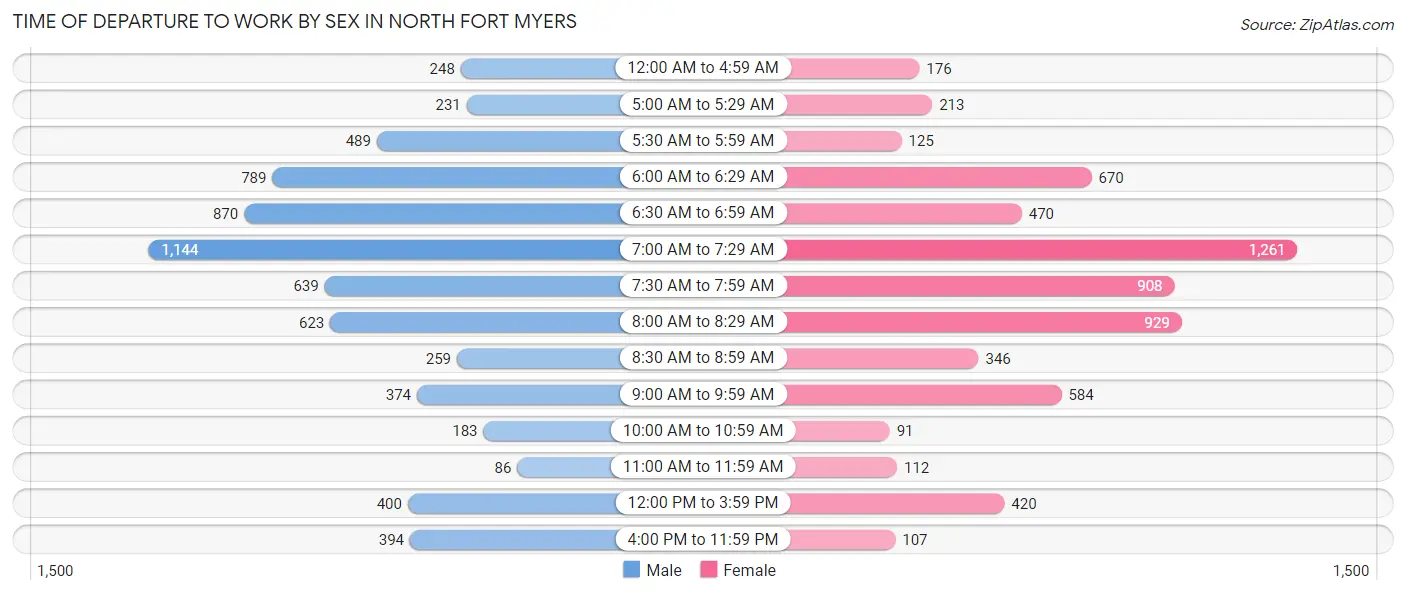
| Time of Departure | Male | Female |
| 12:00 AM to 4:59 AM | 248 (3.7%) | 176 (2.7%) |
| 5:00 AM to 5:29 AM | 231 (3.4%) | 213 (3.3%) |
| 5:30 AM to 5:59 AM | 489 (7.3%) | 125 (1.9%) |
| 6:00 AM to 6:29 AM | 789 (11.7%) | 670 (10.4%) |
| 6:30 AM to 6:59 AM | 870 (12.9%) | 470 (7.3%) |
| 7:00 AM to 7:29 AM | 1,144 (17.0%) | 1,261 (19.7%) |
| 7:30 AM to 7:59 AM | 639 (9.5%) | 908 (14.2%) |
| 8:00 AM to 8:29 AM | 623 (9.3%) | 929 (14.5%) |
| 8:30 AM to 8:59 AM | 259 (3.8%) | 346 (5.4%) |
| 9:00 AM to 9:59 AM | 374 (5.6%) | 584 (9.1%) |
| 10:00 AM to 10:59 AM | 183 (2.7%) | 91 (1.4%) |
| 11:00 AM to 11:59 AM | 86 (1.3%) | 112 (1.8%) |
| 12:00 PM to 3:59 PM | 400 (5.9%) | 420 (6.6%) |
| 4:00 PM to 11:59 PM | 394 (5.9%) | 107 (1.7%) |
| Total | 6,729 (100.0%) | 6,412 (100.0%) |
Housing Occupancy in North Fort Myers
Occupancy by Ownership in North Fort Myers
Of the total 21,355 dwellings in North Fort Myers, owner-occupied units account for 18,242 (85.4%), while renter-occupied units make up 3,113 (14.6%).
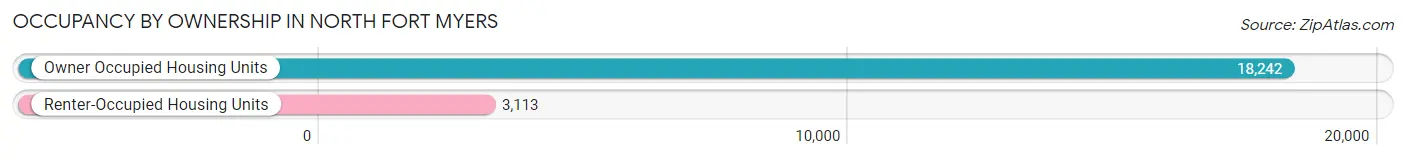
| Occupancy | # Housing Units | % Housing Units |
| Owner Occupied Housing Units | 18,242 | 85.4% |
| Renter-Occupied Housing Units | 3,113 | 14.6% |
| Total Occupied Housing Units | 21,355 | 100.0% |
Occupancy by Household Size in North Fort Myers
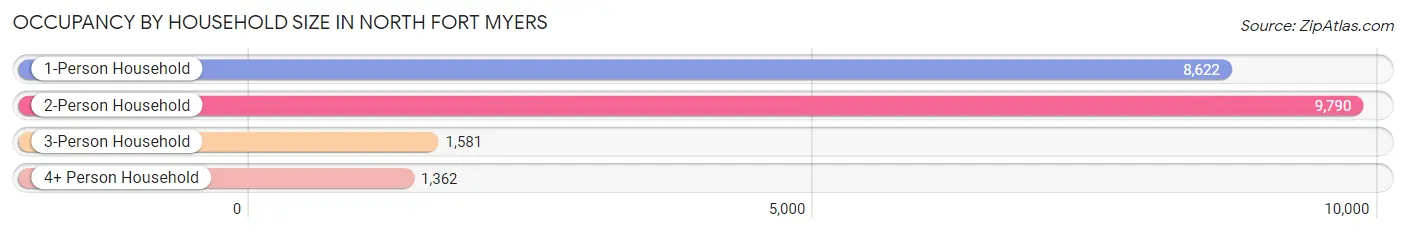
| Household Size | # Housing Units | % Housing Units |
| 1-Person Household | 8,622 | 40.4% |
| 2-Person Household | 9,790 | 45.8% |
| 3-Person Household | 1,581 | 7.4% |
| 4+ Person Household | 1,362 | 6.4% |
| Total Housing Units | 21,355 | 100.0% |
Occupancy by Ownership by Household Size in North Fort Myers
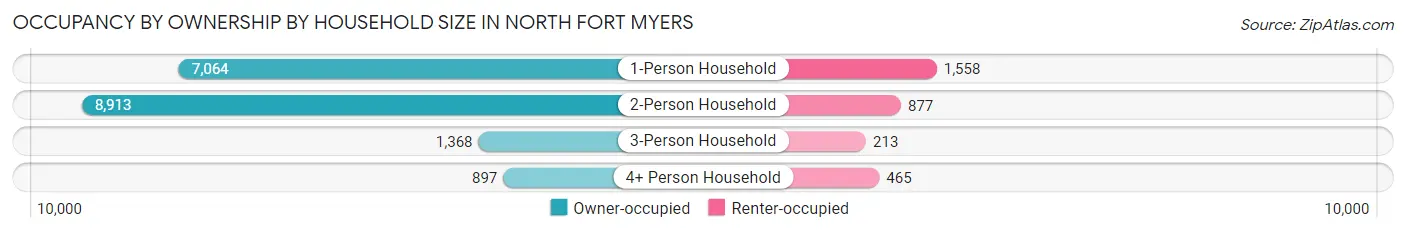
| Household Size | Owner-occupied | Renter-occupied |
| 1-Person Household | 7,064 (81.9%) | 1,558 (18.1%) |
| 2-Person Household | 8,913 (91.0%) | 877 (9.0%) |
| 3-Person Household | 1,368 (86.5%) | 213 (13.5%) |
| 4+ Person Household | 897 (65.9%) | 465 (34.1%) |
| Total Housing Units | 18,242 (85.4%) | 3,113 (14.6%) |
Occupancy by Educational Attainment in North Fort Myers
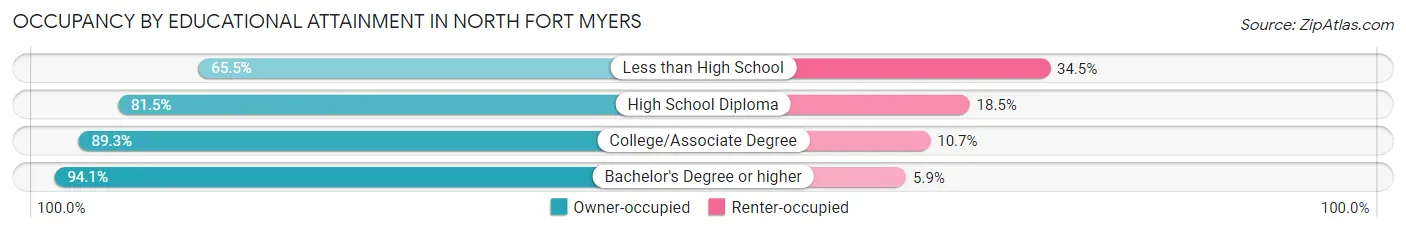
| Household Size | Owner-occupied | Renter-occupied |
| Less than High School | 1,407 (65.5%) | 740 (34.5%) |
| High School Diploma | 5,662 (81.5%) | 1,289 (18.5%) |
| College/Associate Degree | 6,638 (89.3%) | 798 (10.7%) |
| Bachelor's Degree or higher | 4,535 (94.1%) | 286 (5.9%) |
Occupancy by Age of Householder in North Fort Myers
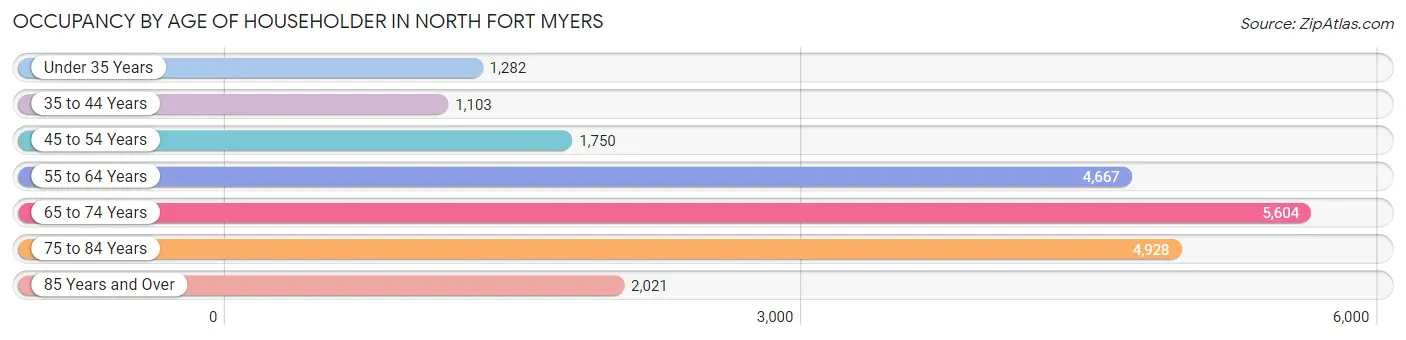
| Age Bracket | # Households | % Households |
| Under 35 Years | 1,282 | 6.0% |
| 35 to 44 Years | 1,103 | 5.2% |
| 45 to 54 Years | 1,750 | 8.2% |
| 55 to 64 Years | 4,667 | 21.8% |
| 65 to 74 Years | 5,604 | 26.2% |
| 75 to 84 Years | 4,928 | 23.1% |
| 85 Years and Over | 2,021 | 9.5% |
| Total | 21,355 | 100.0% |
Housing Finances in North Fort Myers
Median Income by Occupancy in North Fort Myers
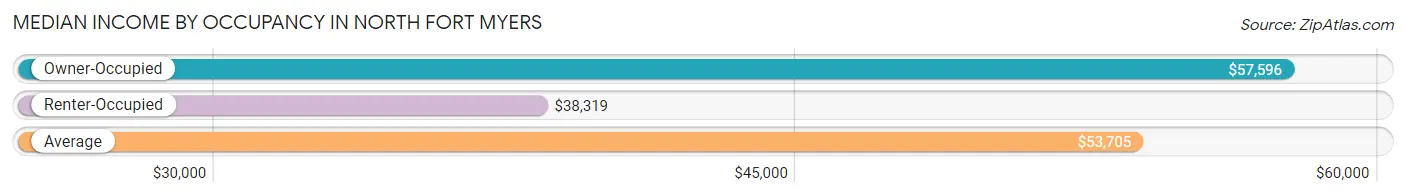
| Occupancy Type | # Households | Median Income |
| Owner-Occupied | 18,242 (85.4%) | $57,596 |
| Renter-Occupied | 3,113 (14.6%) | $38,319 |
| Average | 21,355 (100.0%) | $53,705 |
Occupancy by Householder Income Bracket in North Fort Myers
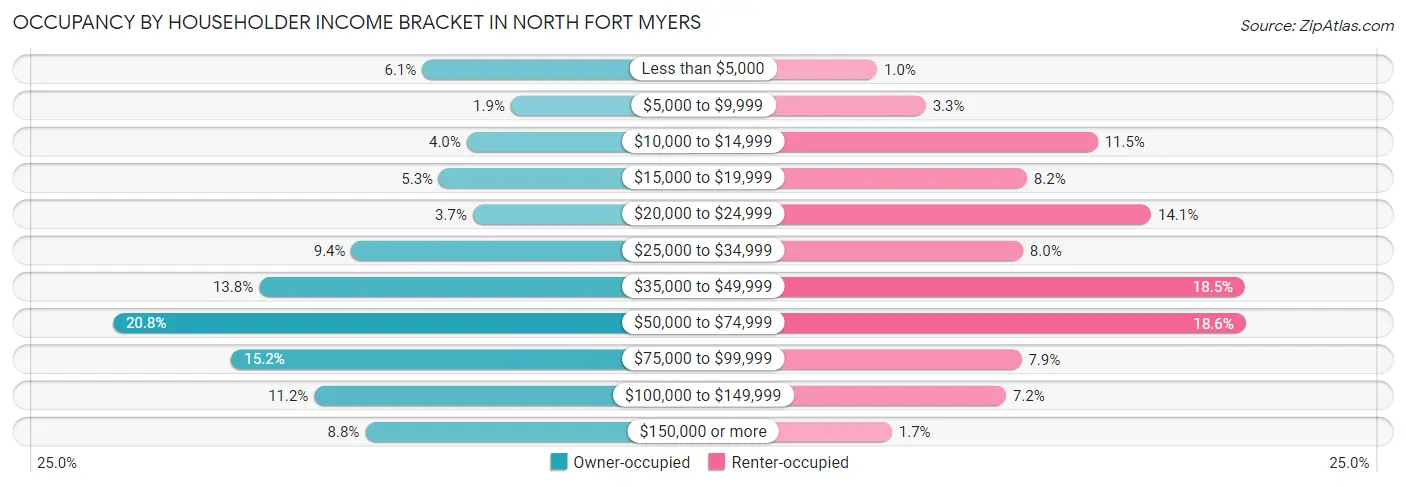
| Income Bracket | Owner-occupied | Renter-occupied |
| Less than $5,000 | 1,107 (6.1%) | 32 (1.0%) |
| $5,000 to $9,999 | 338 (1.8%) | 104 (3.3%) |
| $10,000 to $14,999 | 720 (4.0%) | 359 (11.5%) |
| $15,000 to $19,999 | 962 (5.3%) | 254 (8.2%) |
| $20,000 to $24,999 | 667 (3.7%) | 438 (14.1%) |
| $25,000 to $34,999 | 1,722 (9.4%) | 248 (8.0%) |
| $35,000 to $49,999 | 2,524 (13.8%) | 577 (18.5%) |
| $50,000 to $74,999 | 3,792 (20.8%) | 578 (18.6%) |
| $75,000 to $99,999 | 2,764 (15.1%) | 246 (7.9%) |
| $100,000 to $149,999 | 2,045 (11.2%) | 223 (7.2%) |
| $150,000 or more | 1,601 (8.8%) | 54 (1.7%) |
| Total | 18,242 (100.0%) | 3,113 (100.0%) |
Monthly Housing Cost Tiers in North Fort Myers
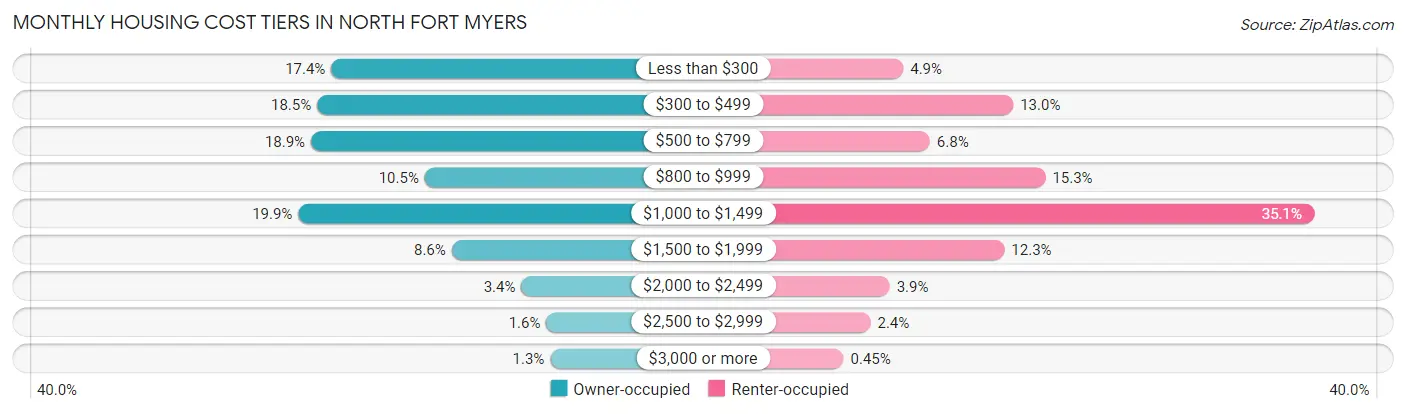
| Monthly Cost | Owner-occupied | Renter-occupied |
| Less than $300 | 3,178 (17.4%) | 151 (4.9%) |
| $300 to $499 | 3,367 (18.5%) | 403 (13.0%) |
| $500 to $799 | 3,449 (18.9%) | 212 (6.8%) |
| $800 to $999 | 1,920 (10.5%) | 477 (15.3%) |
| $1,000 to $1,499 | 3,621 (19.9%) | 1,092 (35.1%) |
| $1,500 to $1,999 | 1,560 (8.6%) | 383 (12.3%) |
| $2,000 to $2,499 | 624 (3.4%) | 120 (3.8%) |
| $2,500 to $2,999 | 288 (1.6%) | 76 (2.4%) |
| $3,000 or more | 235 (1.3%) | 14 (0.4%) |
| Total | 18,242 (100.0%) | 3,113 (100.0%) |
Physical Housing Characteristics in North Fort Myers
Housing Structures in North Fort Myers
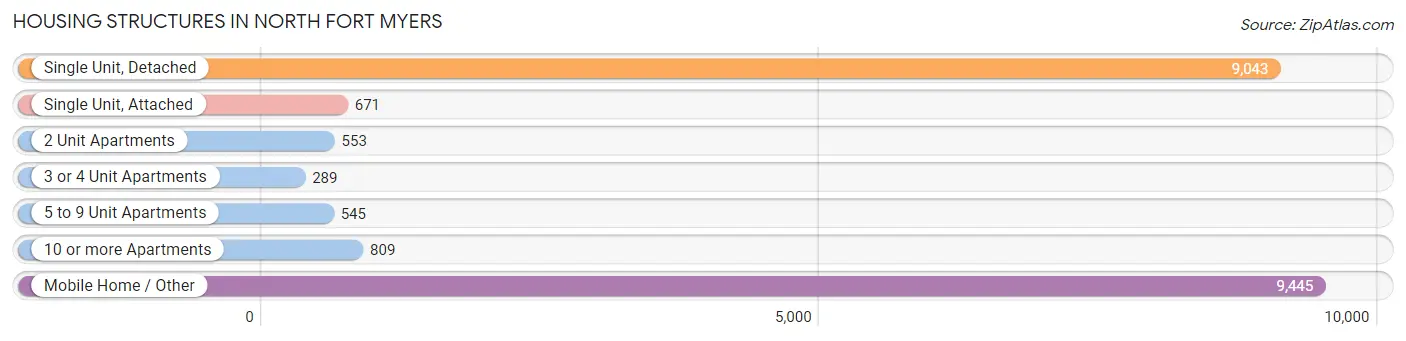
| Structure Type | # Housing Units | % Housing Units |
| Single Unit, Detached | 9,043 | 42.3% |
| Single Unit, Attached | 671 | 3.1% |
| 2 Unit Apartments | 553 | 2.6% |
| 3 or 4 Unit Apartments | 289 | 1.3% |
| 5 to 9 Unit Apartments | 545 | 2.5% |
| 10 or more Apartments | 809 | 3.8% |
| Mobile Home / Other | 9,445 | 44.2% |
| Total | 21,355 | 100.0% |
Housing Structures by Occupancy in North Fort Myers
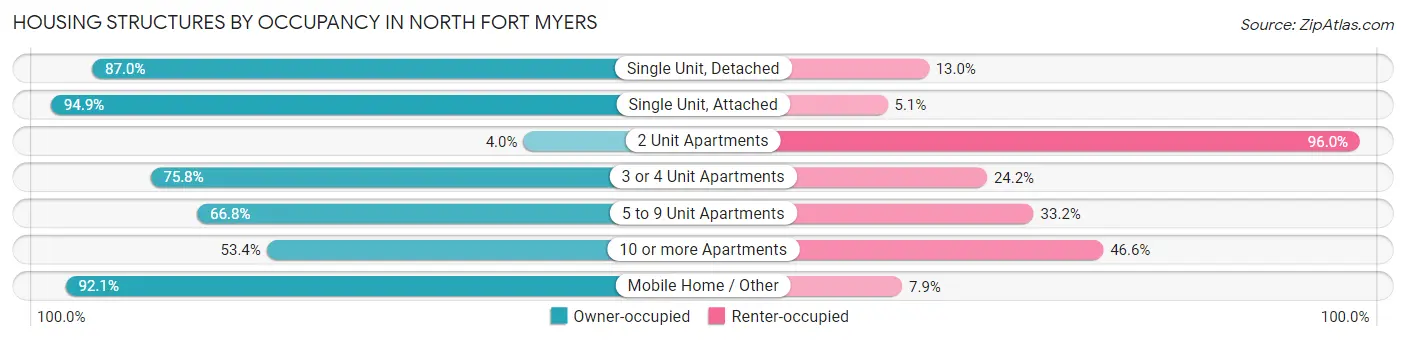
| Structure Type | Owner-occupied | Renter-occupied |
| Single Unit, Detached | 7,867 (87.0%) | 1,176 (13.0%) |
| Single Unit, Attached | 637 (94.9%) | 34 (5.1%) |
| 2 Unit Apartments | 22 (4.0%) | 531 (96.0%) |
| 3 or 4 Unit Apartments | 219 (75.8%) | 70 (24.2%) |
| 5 to 9 Unit Apartments | 364 (66.8%) | 181 (33.2%) |
| 10 or more Apartments | 432 (53.4%) | 377 (46.6%) |
| Mobile Home / Other | 8,701 (92.1%) | 744 (7.9%) |
| Total | 18,242 (85.4%) | 3,113 (14.6%) |
Housing Structures by Number of Rooms in North Fort Myers
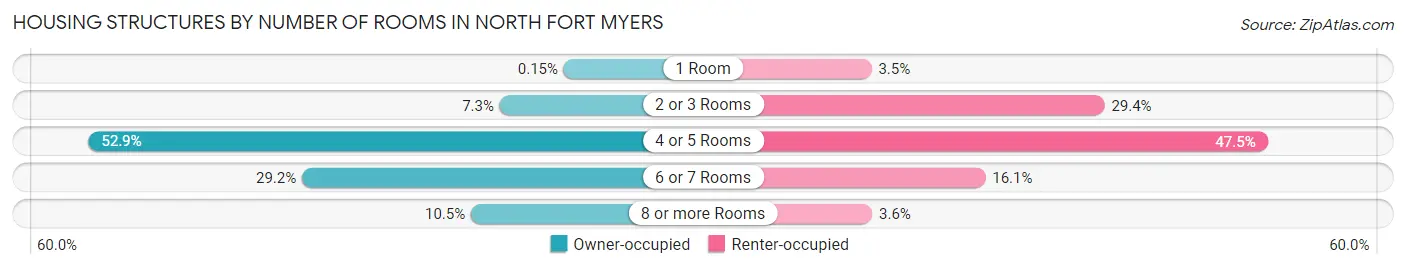
| Number of Rooms | Owner-occupied | Renter-occupied |
| 1 Room | 28 (0.2%) | 109 (3.5%) |
| 2 or 3 Rooms | 1,325 (7.3%) | 914 (29.4%) |
| 4 or 5 Rooms | 9,654 (52.9%) | 1,477 (47.4%) |
| 6 or 7 Rooms | 5,328 (29.2%) | 502 (16.1%) |
| 8 or more Rooms | 1,907 (10.4%) | 111 (3.6%) |
| Total | 18,242 (100.0%) | 3,113 (100.0%) |
Housing Structure by Heating Type in North Fort Myers
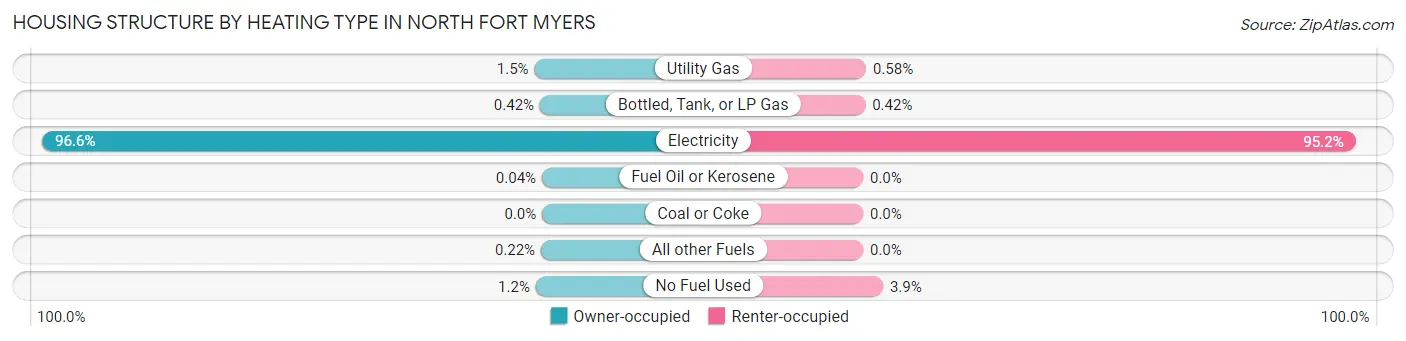
| Heating Type | Owner-occupied | Renter-occupied |
| Utility Gas | 271 (1.5%) | 18 (0.6%) |
| Bottled, Tank, or LP Gas | 76 (0.4%) | 13 (0.4%) |
| Electricity | 17,623 (96.6%) | 2,962 (95.2%) |
| Fuel Oil or Kerosene | 7 (0.0%) | 0 (0.0%) |
| Coal or Coke | 0 (0.0%) | 0 (0.0%) |
| All other Fuels | 40 (0.2%) | 0 (0.0%) |
| No Fuel Used | 225 (1.2%) | 120 (3.8%) |
| Total | 18,242 (100.0%) | 3,113 (100.0%) |
Household Vehicle Usage in North Fort Myers
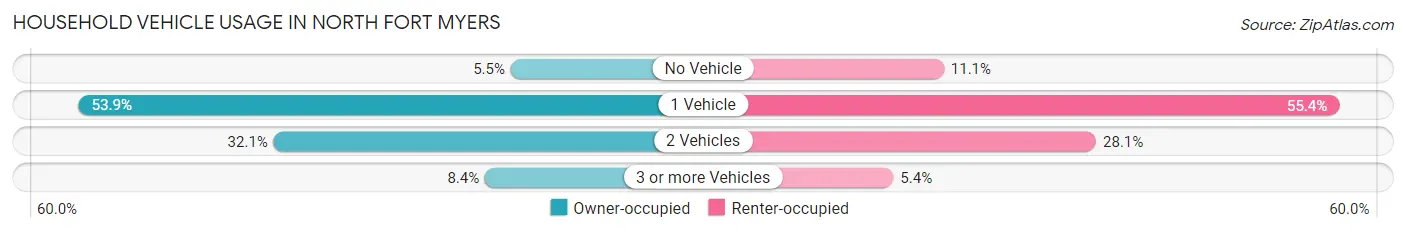
| Vehicles per Household | Owner-occupied | Renter-occupied |
| No Vehicle | 1,010 (5.5%) | 345 (11.1%) |
| 1 Vehicle | 9,840 (53.9%) | 1,723 (55.3%) |
| 2 Vehicles | 5,856 (32.1%) | 876 (28.1%) |
| 3 or more Vehicles | 1,536 (8.4%) | 169 (5.4%) |
| Total | 18,242 (100.0%) | 3,113 (100.0%) |
Real Estate & Mortgages in North Fort Myers
Real Estate and Mortgage Overview in North Fort Myers
| Characteristic | Without Mortgage | With Mortgage |
| Housing Units | 13,130 | 5,112 |
| Median Property Value | $94,600 | $236,000 |
| Median Household Income | $51,797 | $705 |
| Monthly Housing Costs | $505 | $198 |
| Real Estate Taxes | $1,053 | $233 |
Property Value by Mortgage Status in North Fort Myers
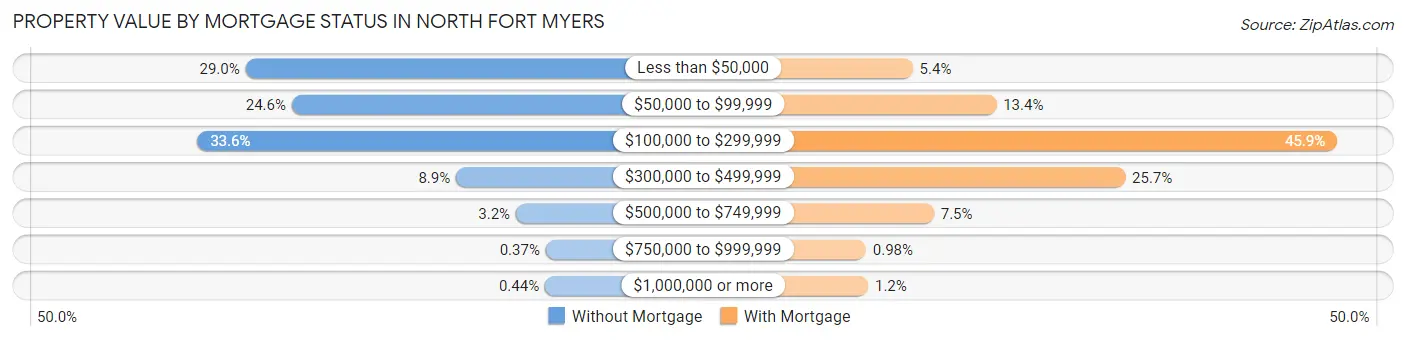
| Property Value | Without Mortgage | With Mortgage |
| Less than $50,000 | 3,802 (29.0%) | 278 (5.4%) |
| $50,000 to $99,999 | 3,224 (24.5%) | 685 (13.4%) |
| $100,000 to $299,999 | 4,407 (33.6%) | 2,345 (45.9%) |
| $300,000 to $499,999 | 1,170 (8.9%) | 1,312 (25.7%) |
| $500,000 to $749,999 | 421 (3.2%) | 381 (7.4%) |
| $750,000 to $999,999 | 48 (0.4%) | 50 (1.0%) |
| $1,000,000 or more | 58 (0.4%) | 61 (1.2%) |
| Total | 13,130 (100.0%) | 5,112 (100.0%) |
Household Income by Mortgage Status in North Fort Myers
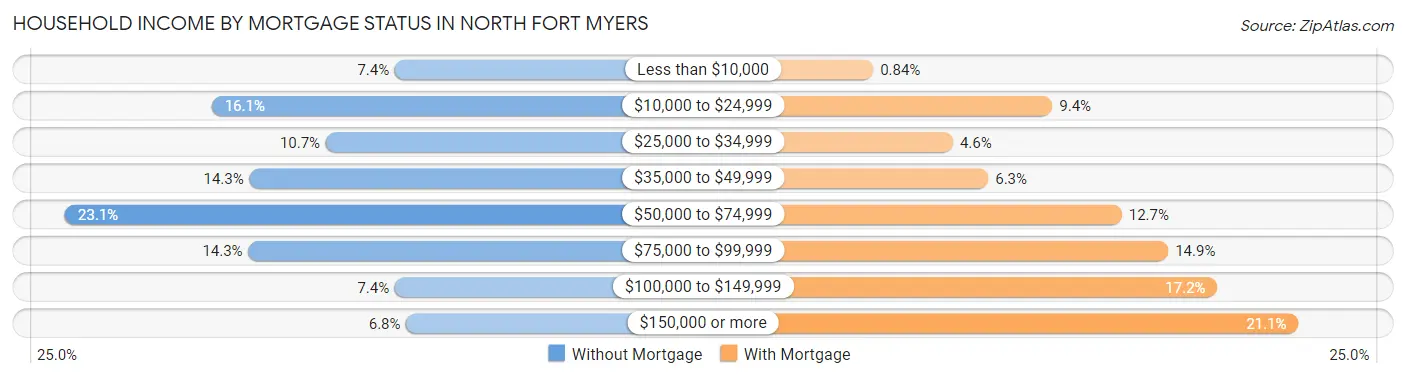
| Household Income | Without Mortgage | With Mortgage |
| Less than $10,000 | 966 (7.4%) | 43 (0.8%) |
| $10,000 to $24,999 | 2,112 (16.1%) | 479 (9.4%) |
| $25,000 to $34,999 | 1,399 (10.6%) | 237 (4.6%) |
| $35,000 to $49,999 | 1,876 (14.3%) | 323 (6.3%) |
| $50,000 to $74,999 | 3,031 (23.1%) | 648 (12.7%) |
| $75,000 to $99,999 | 1,883 (14.3%) | 761 (14.9%) |
| $100,000 to $149,999 | 967 (7.4%) | 881 (17.2%) |
| $150,000 or more | 896 (6.8%) | 1,078 (21.1%) |
| Total | 13,130 (100.0%) | 5,112 (100.0%) |
Property Value to Household Income Ratio in North Fort Myers
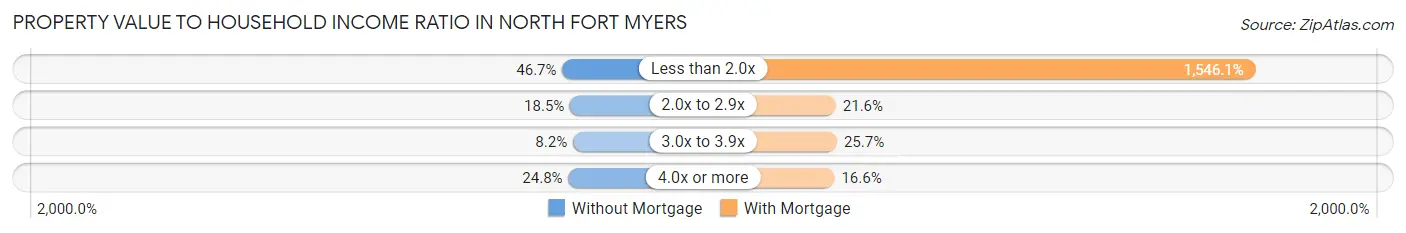
| Value-to-Income Ratio | Without Mortgage | With Mortgage |
| Less than 2.0x | 6,134 (46.7%) | 79,036 (1,546.1%) |
| 2.0x to 2.9x | 2,429 (18.5%) | 1,104 (21.6%) |
| 3.0x to 3.9x | 1,074 (8.2%) | 1,316 (25.7%) |
| 4.0x or more | 3,250 (24.7%) | 850 (16.6%) |
| Total | 13,130 (100.0%) | 5,112 (100.0%) |
Real Estate Taxes by Mortgage Status in North Fort Myers
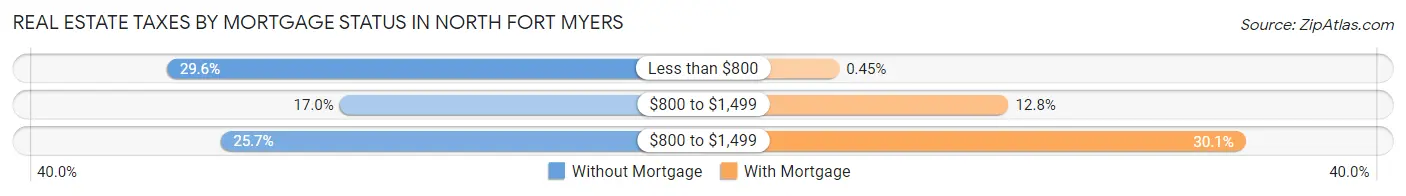
| Property Taxes | Without Mortgage | With Mortgage |
| Less than $800 | 3,888 (29.6%) | 23 (0.4%) |
| $800 to $1,499 | 2,231 (17.0%) | 656 (12.8%) |
| $800 to $1,499 | 3,374 (25.7%) | 1,541 (30.1%) |
| Total | 13,130 (100.0%) | 5,112 (100.0%) |
Health & Disability in North Fort Myers
Health Insurance Coverage by Age in North Fort Myers
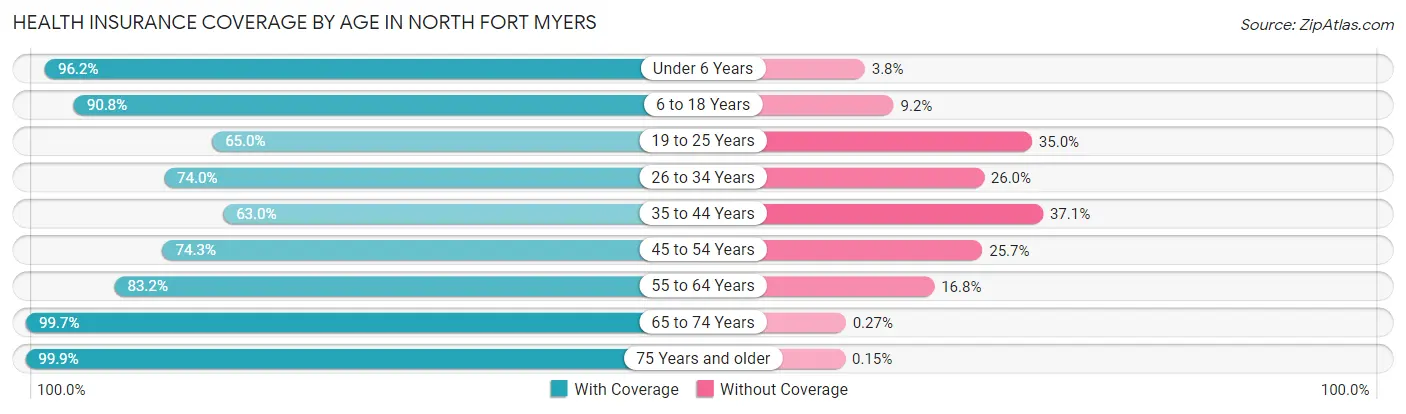
| Age Bracket | With Coverage | Without Coverage |
| Under 6 Years | 1,410 (96.2%) | 56 (3.8%) |
| 6 to 18 Years | 2,470 (90.8%) | 250 (9.2%) |
| 19 to 25 Years | 1,399 (65.0%) | 753 (35.0%) |
| 26 to 34 Years | 1,964 (74.0%) | 691 (26.0%) |
| 35 to 44 Years | 1,388 (62.9%) | 817 (37.0%) |
| 45 to 54 Years | 2,721 (74.3%) | 943 (25.7%) |
| 55 to 64 Years | 6,070 (83.2%) | 1,223 (16.8%) |
| 65 to 74 Years | 9,432 (99.7%) | 26 (0.3%) |
| 75 Years and older | 10,704 (99.9%) | 16 (0.2%) |
| Total | 37,558 (88.7%) | 4,775 (11.3%) |
Health Insurance Coverage by Citizenship Status in North Fort Myers
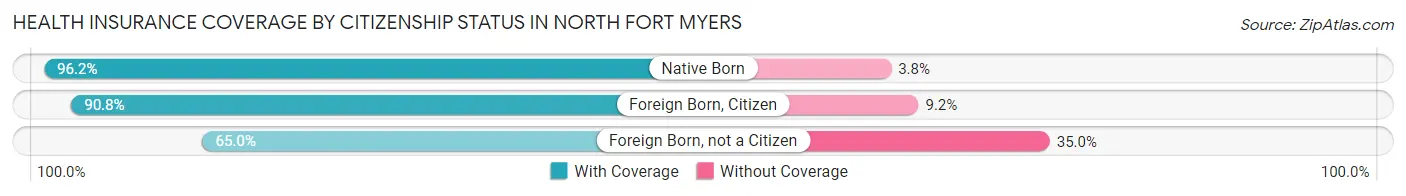
| Citizenship Status | With Coverage | Without Coverage |
| Native Born | 1,410 (96.2%) | 56 (3.8%) |
| Foreign Born, Citizen | 2,470 (90.8%) | 250 (9.2%) |
| Foreign Born, not a Citizen | 1,399 (65.0%) | 753 (35.0%) |
Health Insurance Coverage by Household Income in North Fort Myers
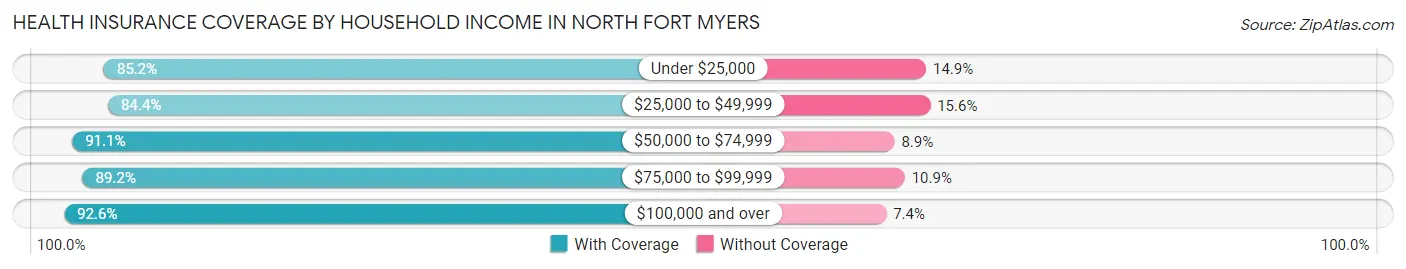
| Household Income | With Coverage | Without Coverage |
| Under $25,000 | 6,136 (85.2%) | 1,070 (14.8%) |
| $25,000 to $49,999 | 7,620 (84.4%) | 1,412 (15.6%) |
| $50,000 to $74,999 | 7,780 (91.1%) | 763 (8.9%) |
| $75,000 to $99,999 | 5,795 (89.1%) | 705 (10.8%) |
| $100,000 and over | 10,119 (92.6%) | 807 (7.4%) |
Public vs Private Health Insurance Coverage by Age in North Fort Myers
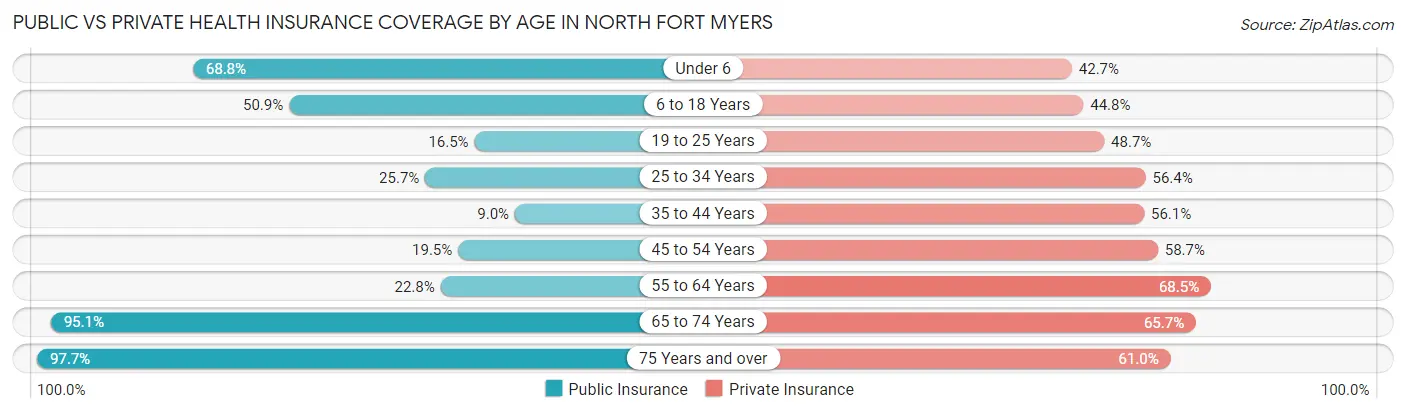
| Age Bracket | Public Insurance | Private Insurance |
| Under 6 | 1,008 (68.8%) | 626 (42.7%) |
| 6 to 18 Years | 1,385 (50.9%) | 1,219 (44.8%) |
| 19 to 25 Years | 355 (16.5%) | 1,048 (48.7%) |
| 25 to 34 Years | 681 (25.7%) | 1,497 (56.4%) |
| 35 to 44 Years | 198 (9.0%) | 1,237 (56.1%) |
| 45 to 54 Years | 716 (19.5%) | 2,149 (58.7%) |
| 55 to 64 Years | 1,663 (22.8%) | 4,997 (68.5%) |
| 65 to 74 Years | 8,998 (95.1%) | 6,218 (65.7%) |
| 75 Years and over | 10,473 (97.7%) | 6,542 (61.0%) |
| Total | 25,477 (60.2%) | 25,533 (60.3%) |
Disability Status by Sex by Age in North Fort Myers
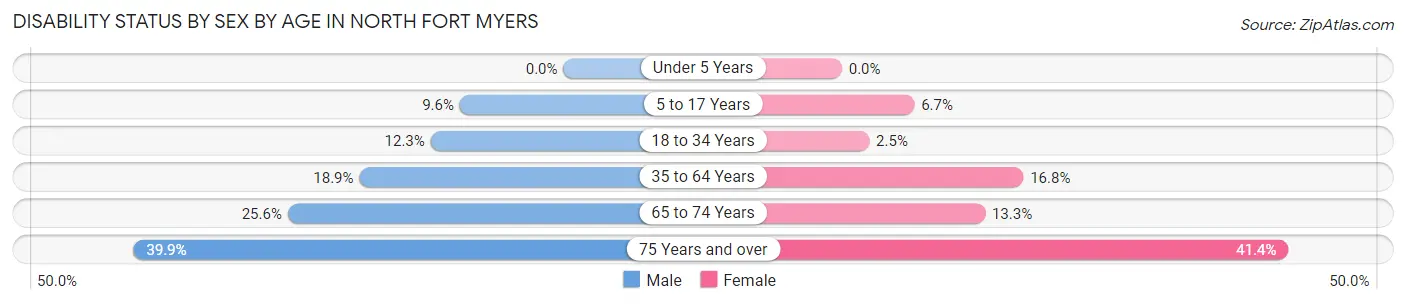
| Age Bracket | Male | Female |
| Under 5 Years | 0 (0.0%) | 0 (0.0%) |
| 5 to 17 Years | 129 (9.6%) | 96 (6.7%) |
| 18 to 34 Years | 373 (12.3%) | 50 (2.5%) |
| 35 to 64 Years | 1,152 (18.9%) | 1,192 (16.8%) |
| 65 to 74 Years | 1,088 (25.6%) | 692 (13.3%) |
| 75 Years and over | 2,054 (39.9%) | 2,309 (41.4%) |
Disability Class by Sex by Age in North Fort Myers
Disability Class: Hearing Difficulty
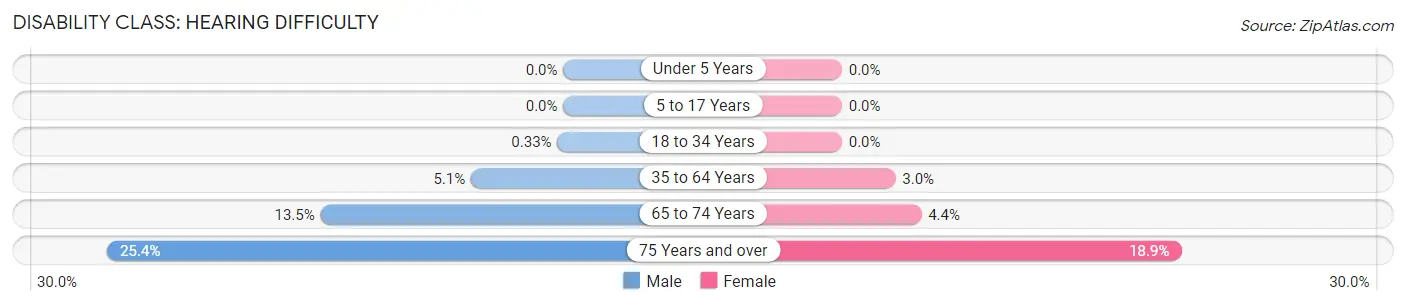
| Age Bracket | Male | Female |
| Under 5 Years | 0 (0.0%) | 0 (0.0%) |
| 5 to 17 Years | 0 (0.0%) | 0 (0.0%) |
| 18 to 34 Years | 10 (0.3%) | 0 (0.0%) |
| 35 to 64 Years | 313 (5.1%) | 211 (3.0%) |
| 65 to 74 Years | 575 (13.5%) | 230 (4.4%) |
| 75 Years and over | 1,308 (25.4%) | 1,053 (18.9%) |
Disability Class: Vision Difficulty
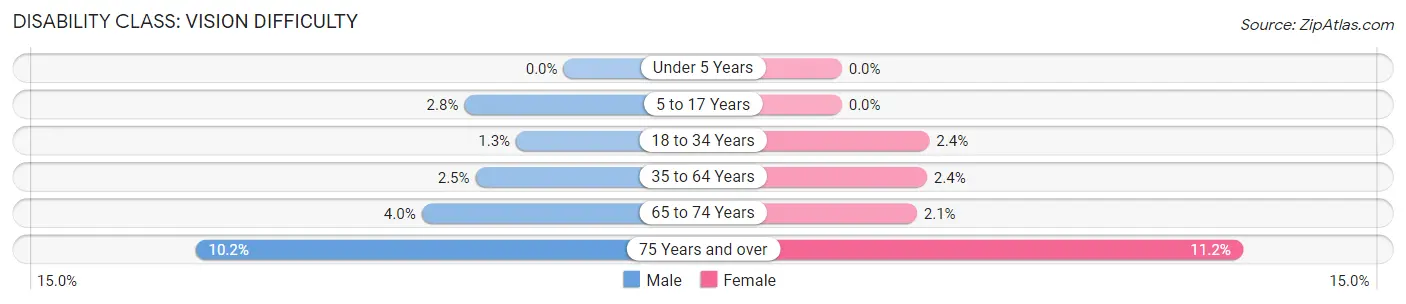
| Age Bracket | Male | Female |
| Under 5 Years | 0 (0.0%) | 0 (0.0%) |
| 5 to 17 Years | 37 (2.8%) | 0 (0.0%) |
| 18 to 34 Years | 40 (1.3%) | 48 (2.4%) |
| 35 to 64 Years | 149 (2.5%) | 168 (2.4%) |
| 65 to 74 Years | 168 (4.0%) | 109 (2.1%) |
| 75 Years and over | 527 (10.2%) | 622 (11.2%) |
Disability Class: Cognitive Difficulty
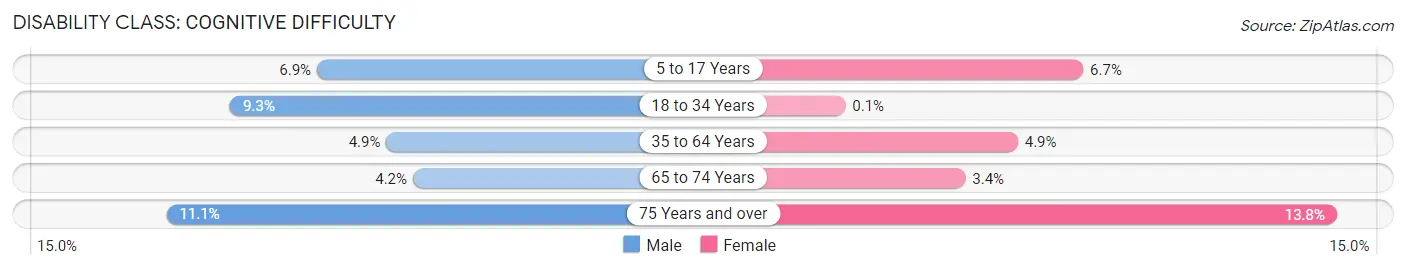
| Age Bracket | Male | Female |
| 5 to 17 Years | 92 (6.9%) | 96 (6.7%) |
| 18 to 34 Years | 281 (9.3%) | 2 (0.1%) |
| 35 to 64 Years | 300 (4.9%) | 347 (4.9%) |
| 65 to 74 Years | 178 (4.2%) | 179 (3.4%) |
| 75 Years and over | 569 (11.1%) | 768 (13.8%) |
Disability Class: Ambulatory Difficulty
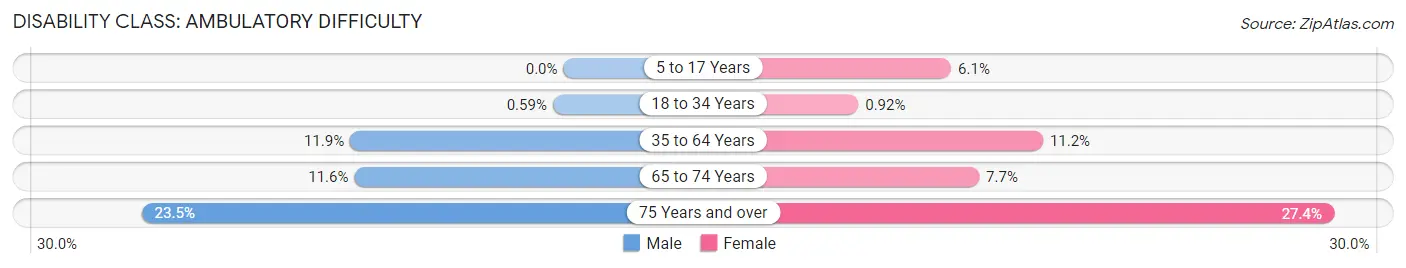
| Age Bracket | Male | Female |
| 5 to 17 Years | 0 (0.0%) | 87 (6.1%) |
| 18 to 34 Years | 18 (0.6%) | 18 (0.9%) |
| 35 to 64 Years | 723 (11.9%) | 793 (11.2%) |
| 65 to 74 Years | 495 (11.6%) | 398 (7.6%) |
| 75 Years and over | 1,209 (23.5%) | 1,526 (27.4%) |
Disability Class: Self-Care Difficulty
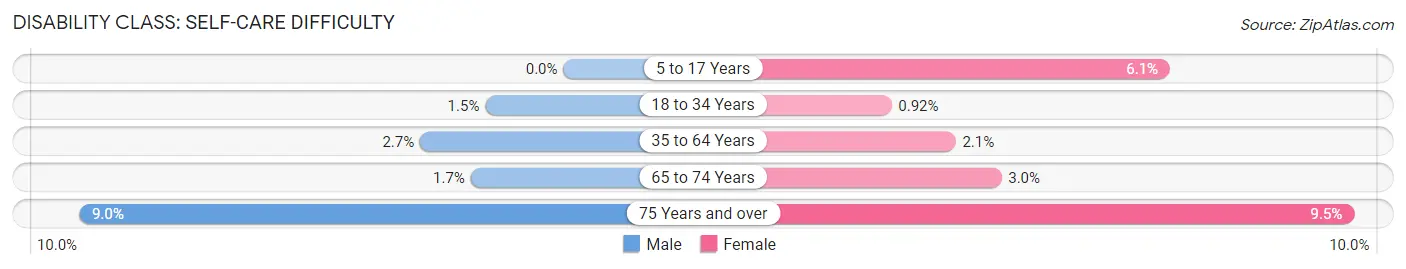
| Age Bracket | Male | Female |
| 5 to 17 Years | 0 (0.0%) | 87 (6.1%) |
| 18 to 34 Years | 44 (1.5%) | 18 (0.9%) |
| 35 to 64 Years | 162 (2.7%) | 149 (2.1%) |
| 65 to 74 Years | 73 (1.7%) | 154 (3.0%) |
| 75 Years and over | 463 (9.0%) | 530 (9.5%) |
Technology Access in North Fort Myers
Computing Device Access in North Fort Myers
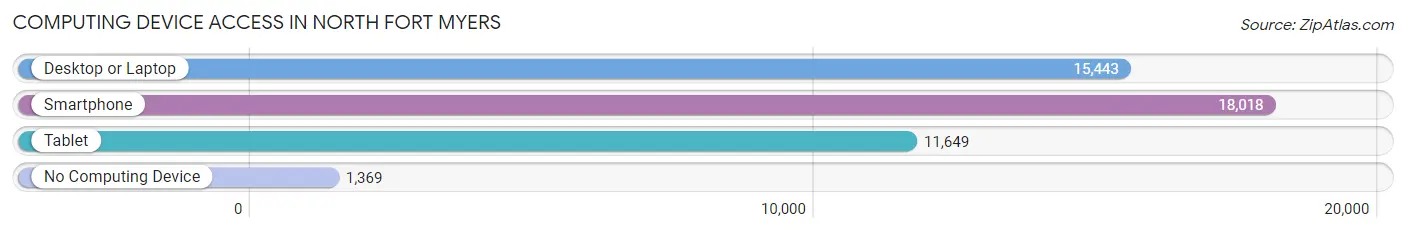
| Device Type | # Households | % Households |
| Desktop or Laptop | 15,443 | 72.3% |
| Smartphone | 18,018 | 84.4% |
| Tablet | 11,649 | 54.5% |
| No Computing Device | 1,369 | 6.4% |
| Total | 21,355 | 100.0% |
Internet Access in North Fort Myers
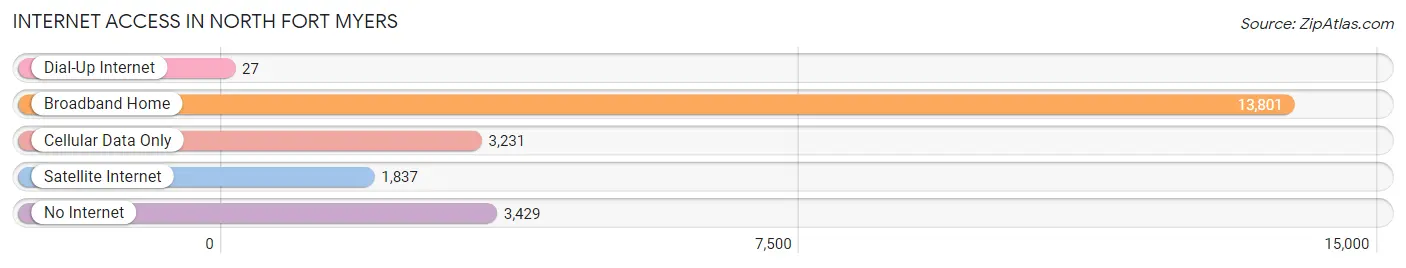
| Internet Type | # Households | % Households |
| Dial-Up Internet | 27 | 0.1% |
| Broadband Home | 13,801 | 64.6% |
| Cellular Data Only | 3,231 | 15.1% |
| Satellite Internet | 1,837 | 8.6% |
| No Internet | 3,429 | 16.1% |
| Total | 21,355 | 100.0% |
North Fort Myers Summary
Fort Myers, Florida is a city located in Lee County, Florida, United States. It is the county seat of Lee County and is located on the Caloosahatchee River in the southwestern part of the state. The city is part of the Cape Coral-Fort Myers Metropolitan Statistical Area. As of the 2010 census, the population of Fort Myers was 62,298.
History
The area that is now Fort Myers was originally inhabited by the Calusa Indians. The first European to visit the area was Spanish explorer Ponce de Leon in 1513. The area was later explored by the Spanish in the 16th century and was part of the Spanish Empire until 1821 when it became part of the United States.
In 1885, Fort Myers was founded by Captain Manuel A. Gonzalez, who named the city after Colonel Abraham C. Myers, a military officer who served in the Second Seminole War. The city was incorporated in 1886 and was the county seat of Lee County.
In the late 19th century, Fort Myers became a popular winter resort for wealthy northerners. The city was also a popular destination for celebrities such as Thomas Edison and Henry Ford.
Geography
Fort Myers is located in southwestern Florida, on the Caloosahatchee River. The city is located about 90 miles south of Tampa and about 120 miles west of Miami. The city covers an area of 40.2 square miles and has a population density of 1,521 people per square mile.
The city is located in a humid subtropical climate zone and has an average annual temperature of 73.2 degrees Fahrenheit. The average high temperature in the summer is 90 degrees Fahrenheit and the average low temperature in the winter is 59 degrees Fahrenheit.
Economy
The economy of Fort Myers is largely based on tourism, healthcare, and manufacturing. The city is home to several major employers, including Lee Memorial Health System, Chico's FAS, and Lee County Public Schools.
The city is also home to several major tourist attractions, including the Edison and Ford Winter Estates, the Calusa Nature Center and Planetarium, and the Imaginarium Hands-On Museum and Aquarium.
Demographics
As of the 2010 census, the population of Fort Myers was 62,298. The racial makeup of the city was 68.2% White, 22.3% African American, 0.4% Native American, 2.2% Asian, 0.1% Pacific Islander, 4.3% from other races, and 2.5% from two or more races. Hispanic or Latino of any race were 18.2% of the population.
The median income for a household in the city was $37,837 and the median income for a family was $45,837. The per capita income for the city was $22,837. About 17.2% of the population was below the poverty line.
Common Questions
What is the Total Population of North Fort Myers?
Total Population of North Fort Myers is 42,492.
What is the Total Male Population of North Fort Myers?
Total Male Population of North Fort Myers is 20,427.
What is the Total Female Population of North Fort Myers?
Total Female Population of North Fort Myers is 22,065.
What is the Ratio of Males per 100 Females in North Fort Myers?
There are 92.58 Males per 100 Females in North Fort Myers.
What is the Ratio of Females per 100 Males in North Fort Myers?
There are 108.02 Females per 100 Males in North Fort Myers.
What is the Median Population Age in North Fort Myers?
Median Population Age in North Fort Myers is 64.0 Years.
What is the Average Family Size in North Fort Myers
Average Family Size in North Fort Myers is 2.6 People.
What is the Average Household Size in North Fort Myers
Average Household Size in North Fort Myers is 2.0 People.
What is Per Capita Income in North Fort Myers?
Per Capita income in North Fort Myers is $35,992.
What is the Median Family Income in North Fort Myers?
Median Family Income in North Fort Myers is $68,578.
What is the Median Household income in North Fort Myers?
Median Household Income in North Fort Myers is $53,705.
What is Income or Wage Gap in North Fort Myers?
Income or Wage Gap in North Fort Myers is 23.9%.
Women in North Fort Myers earn 76.1 cents for every dollar earned by a man.
What is Family Income Deficit in North Fort Myers?
Family Income Deficit in North Fort Myers is $9,209.
Families that are below poverty line in North Fort Myers earn $9,209 less on average than the poverty threshold level.
What is Inequality or Gini Index in North Fort Myers?
Inequality or Gini Index in North Fort Myers is 0.44.
How Large is the Labor Force in North Fort Myers?
There are 15,541 People in the Labor Forcein in North Fort Myers.
What is the Percentage of People in the Labor Force in North Fort Myers?
39.8% of People are in the Labor Force in North Fort Myers.
What is the Unemployment Rate in North Fort Myers?
Unemployment Rate in North Fort Myers is 5.0%.