Navarre Beach, FL
Navarre Beach Map

Navarre Beach Overview
1,594
TOTAL POPULATION
709
MALE POPULATION
885
FEMALE POPULATION
80.11
MALES / 100 FEMALES
124.82
FEMALES / 100 MALES
55.1
MEDIAN AGE
2.3
AVG FAMILY SIZE
2.0
AVG HOUSEHOLD SIZE
$57,196
PER CAPITA INCOME
$130,550
AVG FAMILY INCOME
$121,266
AVG HOUSEHOLD INCOME
0.33
INEQUALITY / GINI INDEX
918
LABOR FORCE [ PEOPLE ]
61.7%
PERCENT IN LABOR FORCE
4.6%
UNEMPLOYMENT RATE
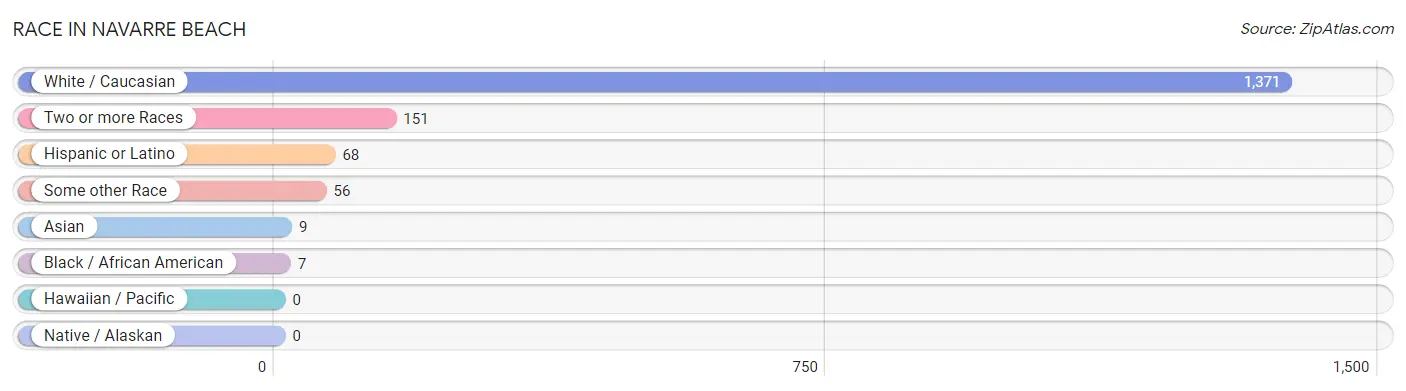
Race in Navarre Beach
The most populous races in Navarre Beach are White / Caucasian (1,371 | 86.0%), Two or more Races (151 | 9.5%), and Hispanic or Latino (68 | 4.3%).
| Race | # Population | % Population |
| Asian | 9 | 0.6% |
| Black / African American | 7 | 0.4% |
| Hawaiian / Pacific | 0 | 0.0% |
| Hispanic or Latino | 68 | 4.3% |
| Native / Alaskan | 0 | 0.0% |
| White / Caucasian | 1,371 | 86.0% |
| Two or more Races | 151 | 9.5% |
| Some other Race | 56 | 3.5% |
| Total | 1,594 | 100.0% |
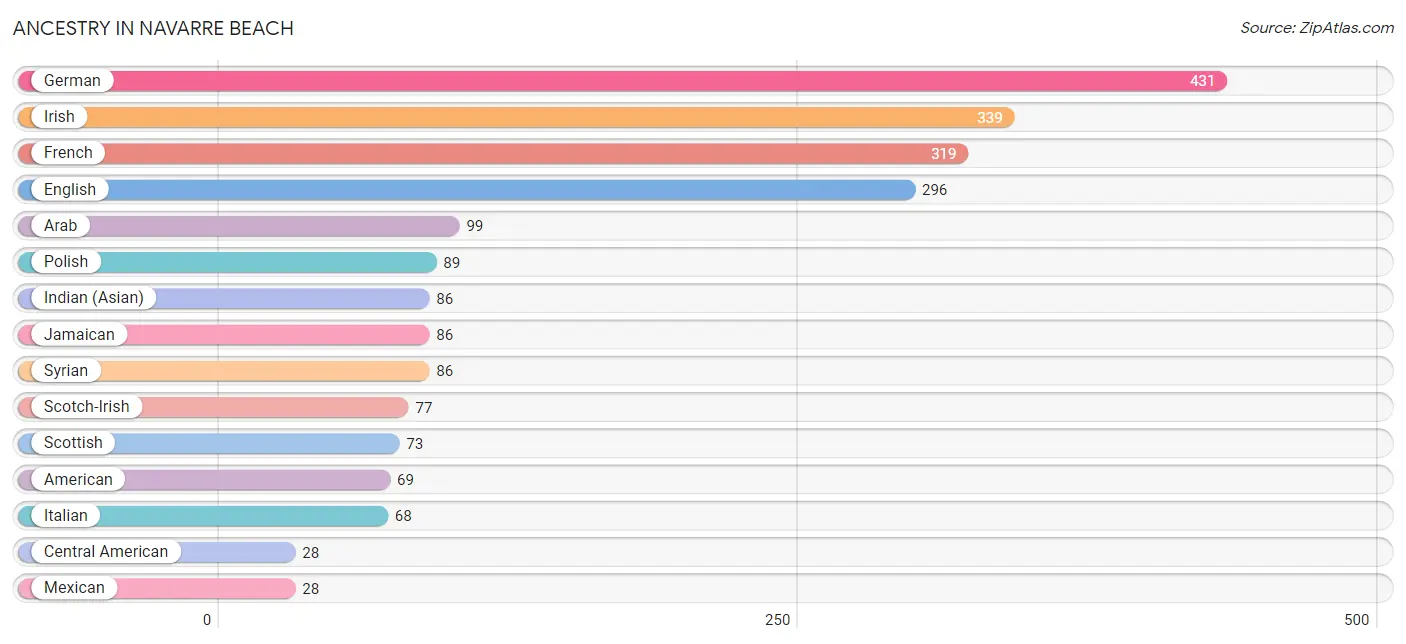
Ancestry in Navarre Beach
The most populous ancestries reported in Navarre Beach are German (431 | 27.0%), Irish (339 | 21.3%), French (319 | 20.0%), English (296 | 18.6%), and Arab (99 | 6.2%), together accounting for 93.1% of all Navarre Beach residents.
| Ancestry | # Population | % Population |
| American | 69 | 4.3% |
| Arab | 99 | 6.2% |
| British | 17 | 1.1% |
| Burmese | 21 | 1.3% |
| Central American | 28 | 1.8% |
| Colombian | 12 | 0.7% |
| Eastern European | 10 | 0.6% |
| English | 296 | 18.6% |
| European | 23 | 1.4% |
| French | 319 | 20.0% |
| French Canadian | 10 | 0.6% |
| German | 431 | 27.0% |
| Indian (Asian) | 86 | 5.4% |
| Irish | 339 | 21.3% |
| Italian | 68 | 4.3% |
| Jamaican | 86 | 5.4% |
| Korean | 9 | 0.6% |
| Lebanese | 13 | 0.8% |
| Mexican | 28 | 1.8% |
| Panamanian | 28 | 1.8% |
| Polish | 89 | 5.6% |
| Scotch-Irish | 77 | 4.8% |
| Scottish | 73 | 4.6% |
| South American | 12 | 0.7% |
| Syrian | 86 | 5.4% | View All 25 Rows |
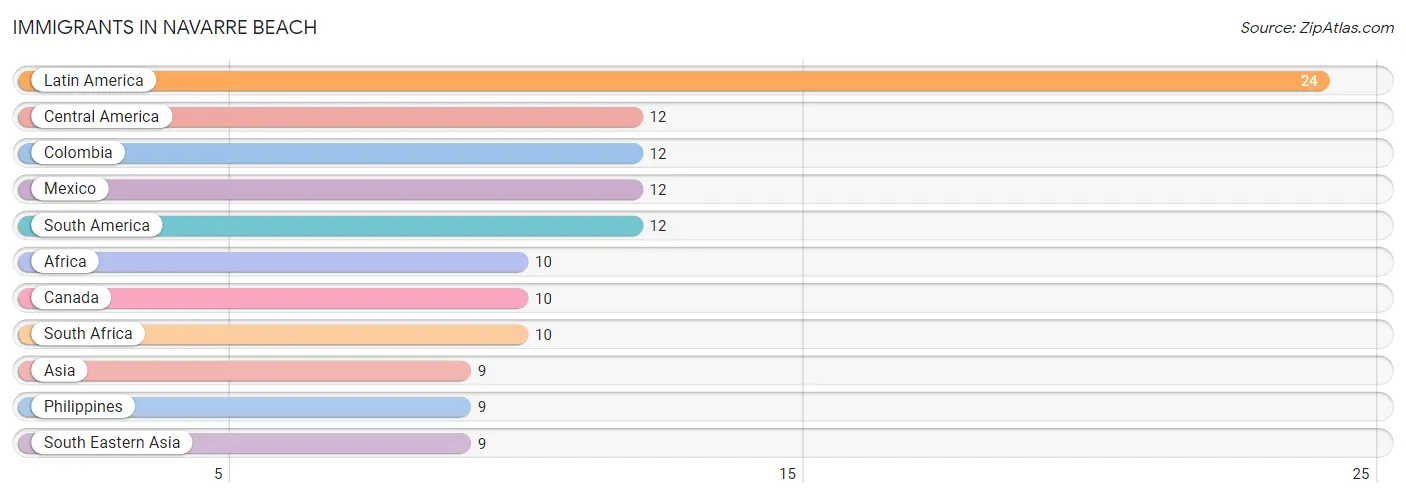
Immigrants in Navarre Beach
The most numerous immigrant groups reported in Navarre Beach came from Latin America (24 | 1.5%), Central America (12 | 0.7%), Colombia (12 | 0.7%), Mexico (12 | 0.7%), and South America (12 | 0.7%), together accounting for 4.5% of all Navarre Beach residents.
| Immigration Origin | # Population | % Population |
| Africa | 10 | 0.6% |
| Asia | 9 | 0.6% |
| Canada | 10 | 0.6% |
| Central America | 12 | 0.7% |
| Colombia | 12 | 0.7% |
| Latin America | 24 | 1.5% |
| Mexico | 12 | 0.7% |
| Philippines | 9 | 0.6% |
| South Africa | 10 | 0.6% |
| South America | 12 | 0.7% |
| South Eastern Asia | 9 | 0.6% | View All 11 Rows |
Sex and Age in Navarre Beach
Sex and Age in Navarre Beach
The most populous age groups in Navarre Beach are 40 to 44 Years (136 | 19.2%) for men and 40 to 44 Years (180 | 20.3%) for women.

| Age Bracket | Male | Female |
| Under 5 Years | 0 (0.0%) | 63 (7.1%) |
| 5 to 9 Years | 0 (0.0%) | 14 (1.6%) |
| 10 to 14 Years | 14 (2.0%) | 15 (1.7%) |
| 15 to 19 Years | 0 (0.0%) | 7 (0.8%) |
| 20 to 24 Years | 11 (1.5%) | 94 (10.6%) |
| 25 to 29 Years | 0 (0.0%) | 0 (0.0%) |
| 30 to 34 Years | 45 (6.4%) | 31 (3.5%) |
| 35 to 39 Years | 48 (6.8%) | 14 (1.6%) |
| 40 to 44 Years | 136 (19.2%) | 180 (20.3%) |
| 45 to 49 Years | 18 (2.5%) | 22 (2.5%) |
| 50 to 54 Years | 21 (3.0%) | 63 (7.1%) |
| 55 to 59 Years | 100 (14.1%) | 93 (10.5%) |
| 60 to 64 Years | 63 (8.9%) | 169 (19.1%) |
| 65 to 69 Years | 98 (13.8%) | 78 (8.8%) |
| 70 to 74 Years | 120 (16.9%) | 17 (1.9%) |
| 75 to 79 Years | 15 (2.1%) | 18 (2.0%) |
| 80 to 84 Years | 20 (2.8%) | 7 (0.8%) |
| 85 Years and over | 0 (0.0%) | 0 (0.0%) |
| Total | 709 (100.0%) | 885 (100.0%) |
Families and Households in Navarre Beach
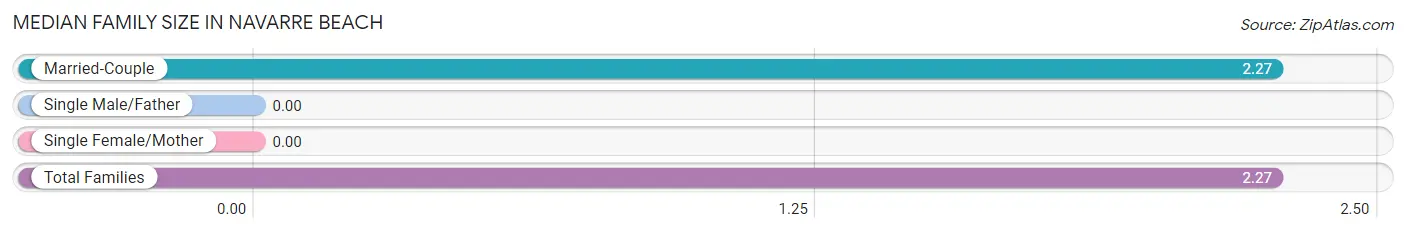
Median Family Size in Navarre Beach
| Family Type | # Families | Family Size |
| Married-Couple | 615 (100.0%) | 2.27 |
| Single Male/Father | 0 (0.0%) | - |
| Single Female/Mother | 0 (0.0%) | - |
| Total Families | 615 (100.0%) | 2.27 |
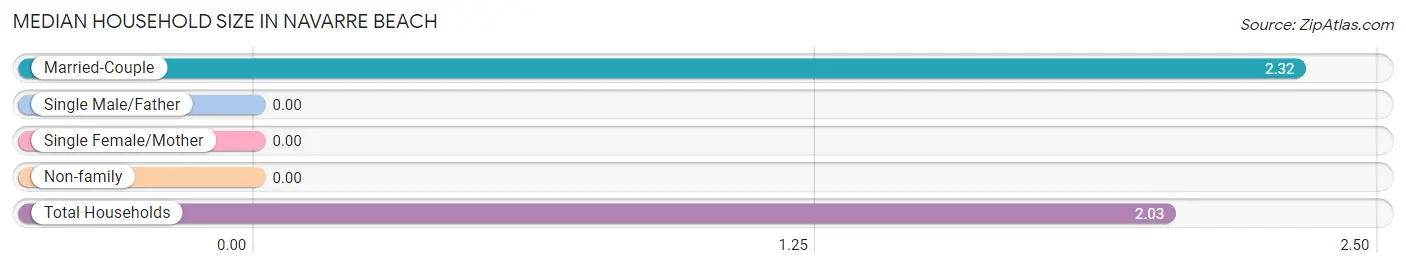
Median Household Size in Navarre Beach
| Household Type | # Households | Household Size |
| Married-Couple | 615 (78.4%) | 2.32 |
| Single Male/Father | 0 (0.0%) | - |
| Single Female/Mother | 0 (0.0%) | - |
| Non-family | 169 (21.6%) | - |
| Total Households | 784 (100.0%) | 2.03 |
Household Size by Marriage Status in Navarre Beach
Out of a total of 784 households in Navarre Beach, 615 (78.4%) are family households, while 169 (21.6%) are nonfamily households. The most numerous type of family households are 2-person households, comprising 403, and the most common type of nonfamily households are 1-person households, comprising 169.

| Household Size | Family Households | Nonfamily Households |
| 1-Person Households | - | 169 (21.6%) |
| 2-Person Households | 403 (51.4%) | 0 (0.0%) |
| 3-Person Households | 160 (20.4%) | 0 (0.0%) |
| 4-Person Households | 22 (2.8%) | 0 (0.0%) |
| 5-Person Households | 30 (3.8%) | 0 (0.0%) |
| 6-Person Households | 0 (0.0%) | 0 (0.0%) |
| 7+ Person Households | 0 (0.0%) | 0 (0.0%) |
| Total | 615 (78.4%) | 169 (21.6%) |
Female Fertility in Navarre Beach
Fertility by Age in Navarre Beach
| Age Bracket | Women with Births | Births / 1,000 Women |
| 15 to 19 years | 0 (0.0%) | 0.0 |
| 20 to 34 years | 0 (0.0%) | 0.0 |
| 35 to 50 years | 0 (0.0%) | 0.0 |
| Total | 0 (0.0%) | 0.0 |
Fertility by Age by Marriage Status in Navarre Beach
| Age Bracket | Married | Unmarried |
| 15 to 19 years | 0 (0.0%) | 0 (0.0%) |
| 20 to 34 years | 0 (0.0%) | 0 (0.0%) |
| 35 to 50 years | 0 (0.0%) | 0 (0.0%) |
| Total | 0 (0.0%) | 0 (0.0%) |
Fertility by Education in Navarre Beach
| Educational Attainment | Women with Births | Births / 1,000 Women |
| Less than High School | 0 (0.0%) | 0.0 |
| High School Diploma | 0 (0.0%) | 0.0 |
| College or Associate's Degree | 0 (0.0%) | 0.0 |
| Bachelor's Degree | 0 (0.0%) | 0.0 |
| Graduate Degree | 0 (0.0%) | 0.0 |
| Total | 0 (0.0%) | 0.0 |
Fertility by Education by Marriage Status in Navarre Beach
| Educational Attainment | Married | Unmarried |
| Less than High School | 0 (0.0%) | 0 (0.0%) |
| High School Diploma | 0 (0.0%) | 0 (0.0%) |
| College or Associate's Degree | 0 (0.0%) | 0 (0.0%) |
| Bachelor's Degree | 0 (0.0%) | 0 (0.0%) |
| Graduate Degree | 0 (0.0%) | 0 (0.0%) |
| Total | 0 (0.0%) | 0 (0.0%) |
Income in Navarre Beach
Income Overview in Navarre Beach
Per Capita Income in Navarre Beach is $57,196, while median incomes of families and households are $130,550 and $121,266 respectively.
| Characteristic | Number | Measure |
| Per Capita Income | 1,594 | $57,196 |
| Median Family Income | 615 | $130,550 |
| Mean Family Income | 615 | $138,799 |
| Median Household Income | 784 | $121,266 |
| Mean Household Income | 784 | $117,786 |
| Income Deficit | 615 | $0 |
| Wage / Income Gap (%) | 1,594 | 0.00% |
| Wage / Income Gap ($) | 1,594 | 100.00¢ per $1 |
| Gini / Inequality Index | 1,594 | 0.33 |
Earnings by Sex in Navarre Beach
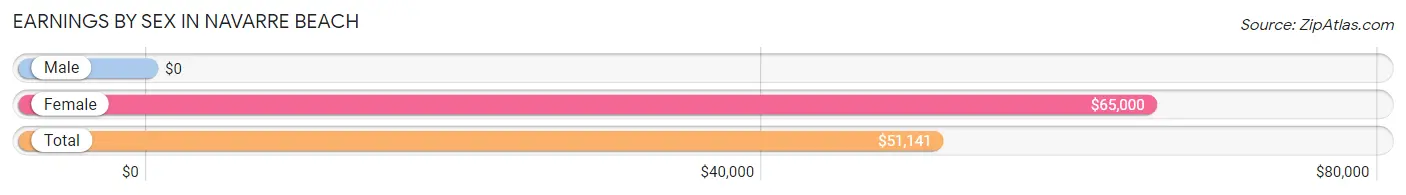
| Sex | Number | Average Earnings |
| Male | 469 (48.8%) | $0 |
| Female | 492 (51.2%) | $65,000 |
| Total | 961 (100.0%) | $51,141 |
Earnings by Sex by Income Bracket in Navarre Beach
The most common earnings brackets in Navarre Beach are $100,000+ for men (164 | 35.0%) and $75,000 to $99,999 for women (167 | 33.9%).
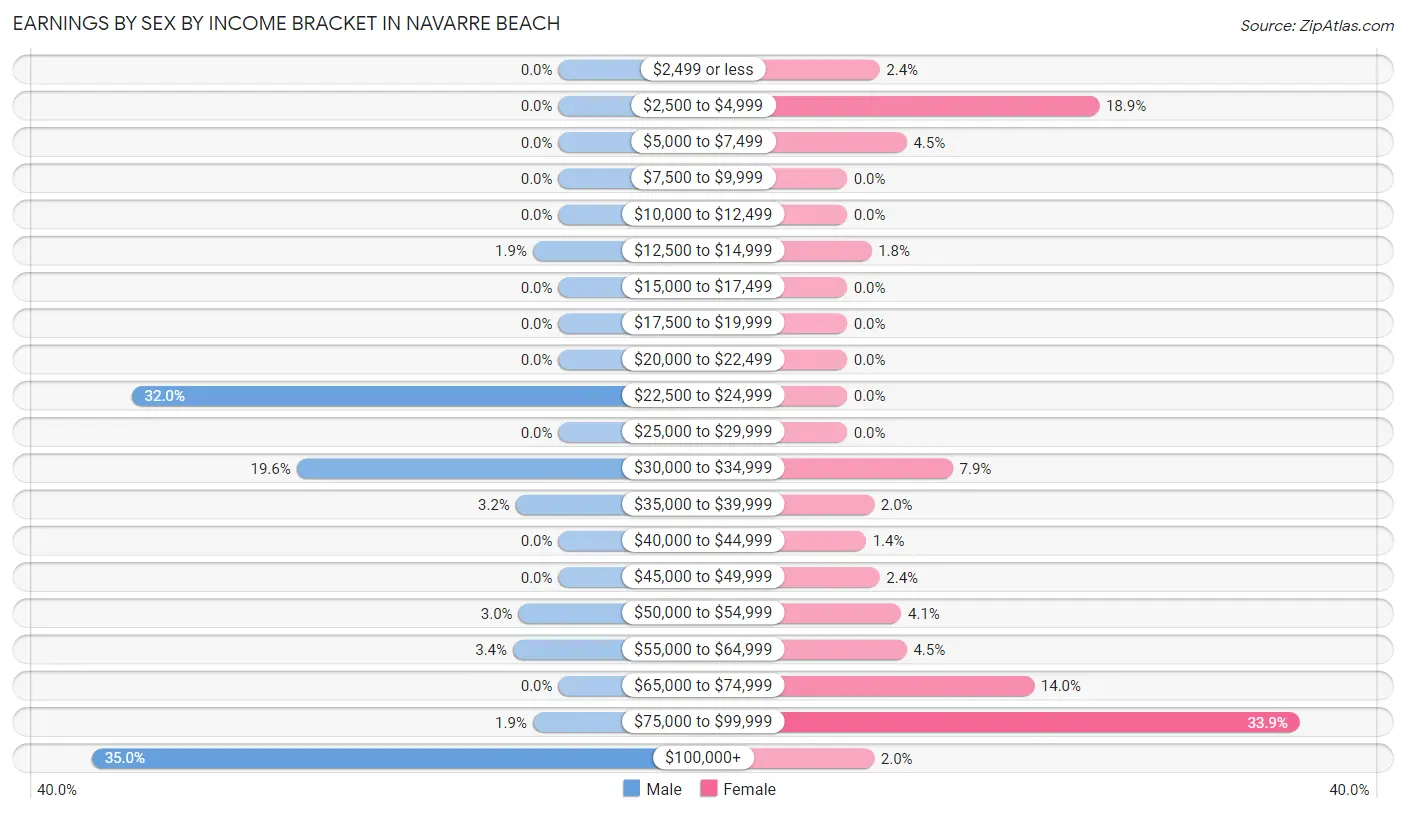
| Income | Male | Female |
| $2,499 or less | 0 (0.0%) | 12 (2.4%) |
| $2,500 to $4,999 | 0 (0.0%) | 93 (18.9%) |
| $5,000 to $7,499 | 0 (0.0%) | 22 (4.5%) |
| $7,500 to $9,999 | 0 (0.0%) | 0 (0.0%) |
| $10,000 to $12,499 | 0 (0.0%) | 0 (0.0%) |
| $12,500 to $14,999 | 9 (1.9%) | 9 (1.8%) |
| $15,000 to $17,499 | 0 (0.0%) | 0 (0.0%) |
| $17,500 to $19,999 | 0 (0.0%) | 0 (0.0%) |
| $20,000 to $22,499 | 0 (0.0%) | 0 (0.0%) |
| $22,500 to $24,999 | 150 (32.0%) | 0 (0.0%) |
| $25,000 to $29,999 | 0 (0.0%) | 0 (0.0%) |
| $30,000 to $34,999 | 92 (19.6%) | 39 (7.9%) |
| $35,000 to $39,999 | 15 (3.2%) | 10 (2.0%) |
| $40,000 to $44,999 | 0 (0.0%) | 7 (1.4%) |
| $45,000 to $49,999 | 0 (0.0%) | 12 (2.4%) |
| $50,000 to $54,999 | 14 (3.0%) | 20 (4.1%) |
| $55,000 to $64,999 | 16 (3.4%) | 22 (4.5%) |
| $65,000 to $74,999 | 0 (0.0%) | 69 (14.0%) |
| $75,000 to $99,999 | 9 (1.9%) | 167 (33.9%) |
| $100,000+ | 164 (35.0%) | 10 (2.0%) |
| Total | 469 (100.0%) | 492 (100.0%) |
Earnings by Sex by Educational Attainment in Navarre Beach
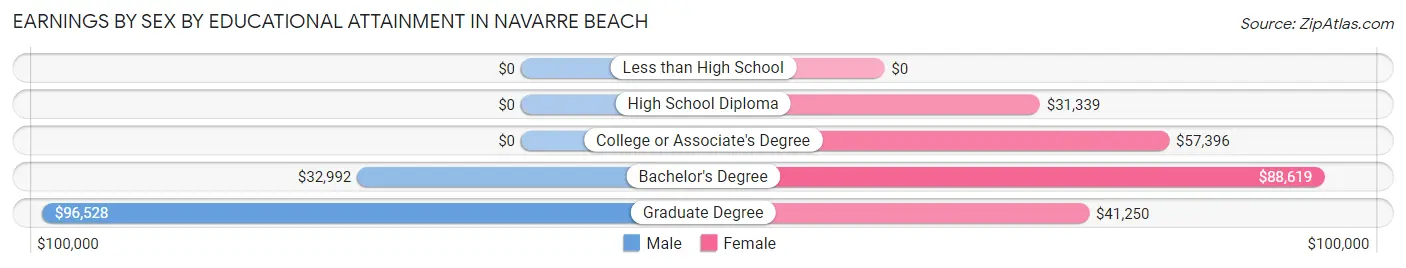
| Educational Attainment | Male Income | Female Income |
| Less than High School | - | - |
| High School Diploma | - | - |
| College or Associate's Degree | - | - |
| Bachelor's Degree | $32,992 | $88,619 |
| Graduate Degree | $96,528 | $41,250 |
| Total | - | - |
Family Income in Navarre Beach
Family Income Brackets in Navarre Beach
According to the Navarre Beach family income data, there are 224 families falling into the $100,000 to $149,999 income range, which is the most common income bracket and makes up 36.4% of all families.
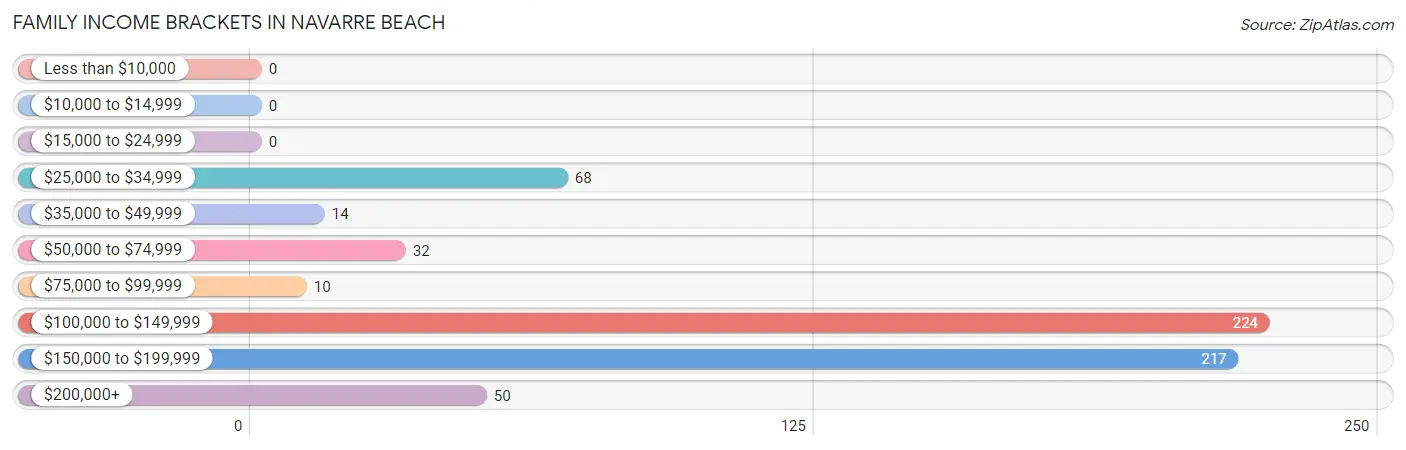
| Income Bracket | # Families | % Families |
| Less than $10,000 | 0 | 0.0% |
| $10,000 to $14,999 | 0 | 0.0% |
| $15,000 to $24,999 | 0 | 0.0% |
| $25,000 to $34,999 | 68 | 11.1% |
| $35,000 to $49,999 | 14 | 2.3% |
| $50,000 to $74,999 | 32 | 5.2% |
| $75,000 to $99,999 | 10 | 1.6% |
| $100,000 to $149,999 | 224 | 36.4% |
| $150,000 to $199,999 | 217 | 35.3% |
| $200,000+ | 50 | 8.1% |
Family Income by Famaliy Size in Navarre Beach
2-person families (403 | 65.5%) account for the highest median family income in Navarre Beach with $160,547 per family, while 2-person families (403 | 65.5%) have the highest median income of $80,274 per family member.
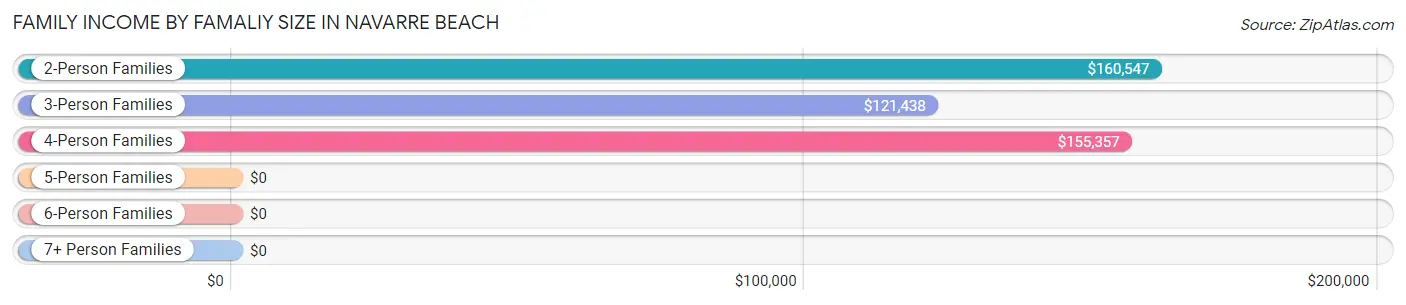
| Income Bracket | # Families | Median Income |
| 2-Person Families | 403 (65.5%) | $160,547 |
| 3-Person Families | 176 (28.6%) | $121,438 |
| 4-Person Families | 22 (3.6%) | $155,357 |
| 5-Person Families | 14 (2.3%) | $0 |
| 6-Person Families | 0 (0.0%) | $0 |
| 7+ Person Families | 0 (0.0%) | $0 |
| Total | 615 (100.0%) | $130,550 |
Family Income by Number of Earners in Navarre Beach
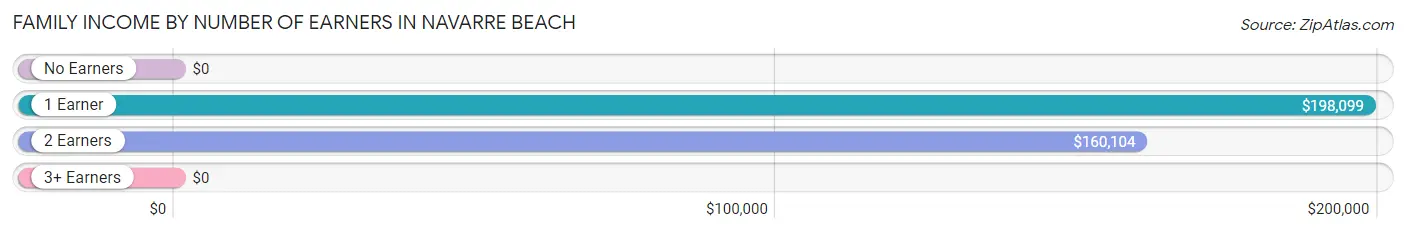
| Number of Earners | # Families | Median Income |
| No Earners | 155 (25.2%) | $0 |
| 1 Earner | 128 (20.8%) | $198,099 |
| 2 Earners | 172 (28.0%) | $160,104 |
| 3+ Earners | 160 (26.0%) | $0 |
| Total | 615 (100.0%) | $130,550 |
Household Income in Navarre Beach
Household Income Brackets in Navarre Beach
With 227 households falling in the category, the $100,000 to $149,999 income range is the most frequent in Navarre Beach, accounting for 28.9% of all households.
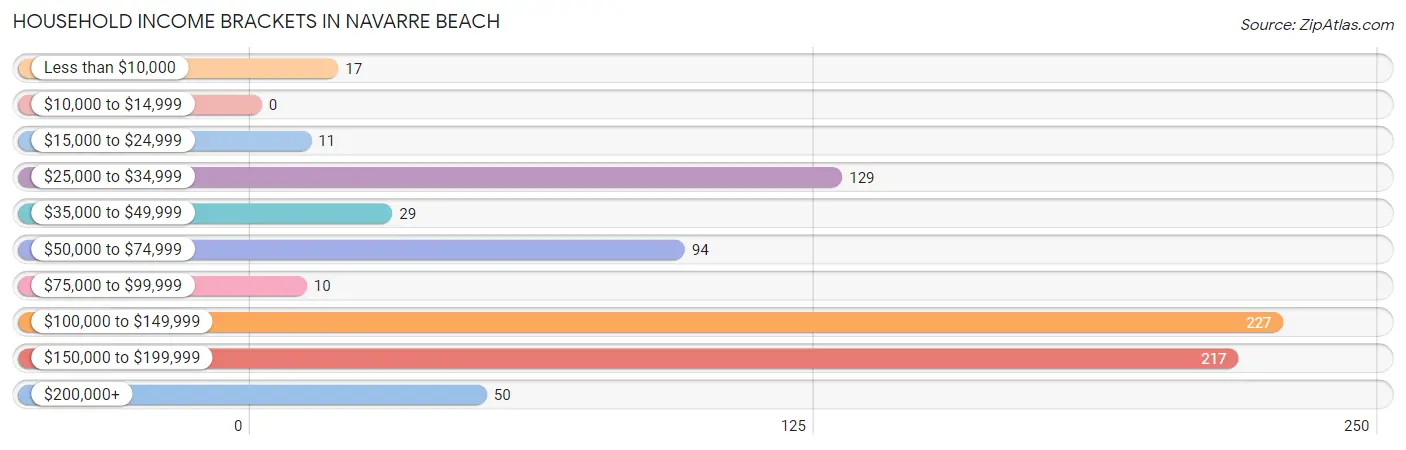
| Income Bracket | # Households | % Households |
| Less than $10,000 | 17 | 2.2% |
| $10,000 to $14,999 | 0 | 0.0% |
| $15,000 to $24,999 | 11 | 1.4% |
| $25,000 to $34,999 | 129 | 16.5% |
| $35,000 to $49,999 | 29 | 3.7% |
| $50,000 to $74,999 | 94 | 12.0% |
| $75,000 to $99,999 | 10 | 1.3% |
| $100,000 to $149,999 | 227 | 29.0% |
| $150,000 to $199,999 | 217 | 27.7% |
| $200,000+ | 50 | 6.4% |
Household Income by Householder Age in Navarre Beach
The median household income in Navarre Beach is $121,266, with the highest median household income of $167,813 found in the 45 to 64 years age bracket for the primary householder. A total of 229 households (29.2%) fall into this category.
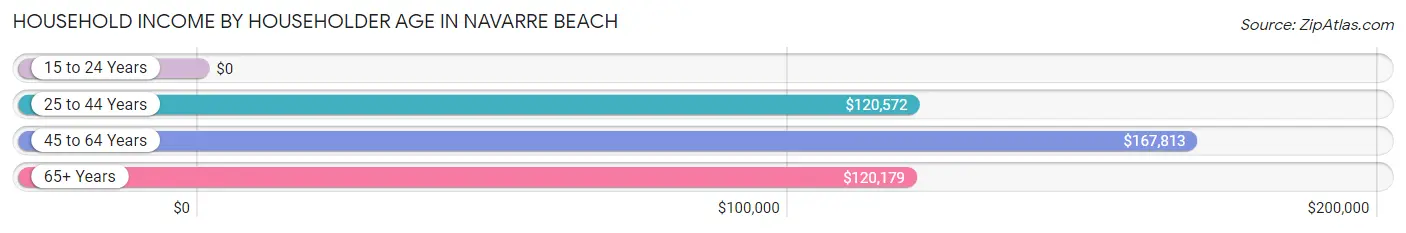
| Income Bracket | # Households | Median Income |
| 15 to 24 Years | 0 (0.0%) | $0 |
| 25 to 44 Years | 256 (32.7%) | $120,572 |
| 45 to 64 Years | 229 (29.2%) | $167,813 |
| 65+ Years | 299 (38.1%) | $120,179 |
| Total | 784 (100.0%) | $121,266 |
Poverty in Navarre Beach
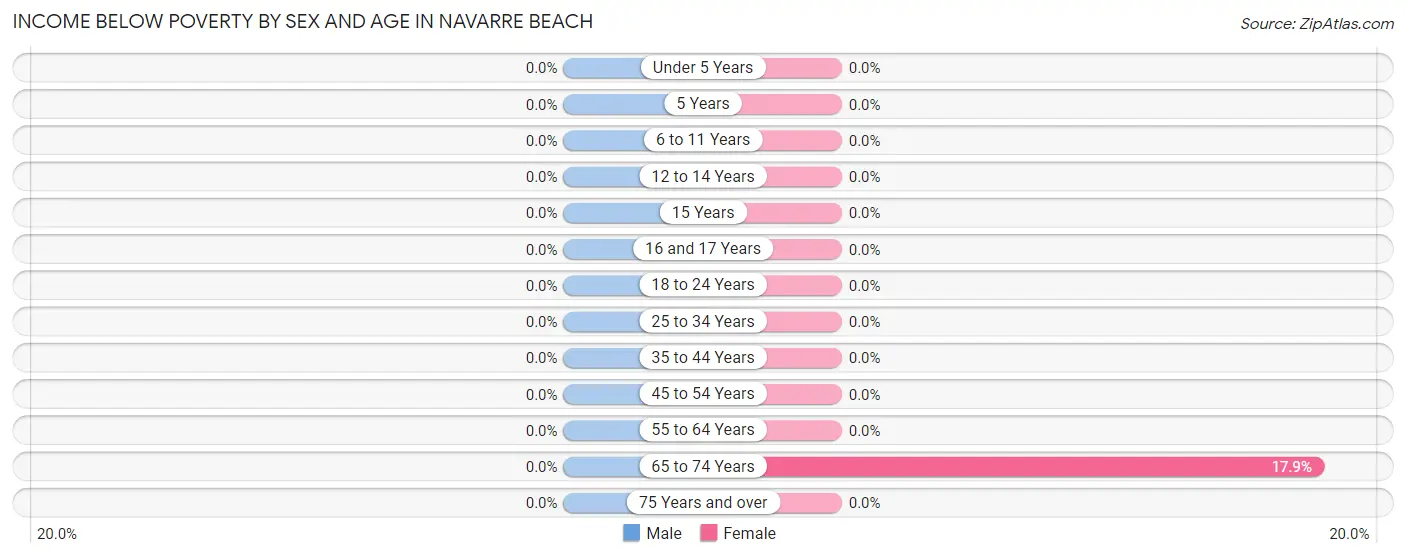
Income Below Poverty by Sex and Age in Navarre Beach
| Age Bracket | Male | Female |
| Under 5 Years | 0 (0.0%) | 0 (0.0%) |
| 5 Years | 0 (0.0%) | 0 (0.0%) |
| 6 to 11 Years | 0 (0.0%) | 0 (0.0%) |
| 12 to 14 Years | 0 (0.0%) | 0 (0.0%) |
| 15 Years | 0 (0.0%) | 0 (0.0%) |
| 16 and 17 Years | 0 (0.0%) | 0 (0.0%) |
| 18 to 24 Years | 0 (0.0%) | 0 (0.0%) |
| 25 to 34 Years | 0 (0.0%) | 0 (0.0%) |
| 35 to 44 Years | 0 (0.0%) | 0 (0.0%) |
| 45 to 54 Years | 0 (0.0%) | 0 (0.0%) |
| 55 to 64 Years | 0 (0.0%) | 0 (0.0%) |
| 65 to 74 Years | 0 (0.0%) | 17 (17.9%) |
| 75 Years and over | 0 (0.0%) | 0 (0.0%) |
| Total | 0 (0.0%) | 17 (2.0%) |
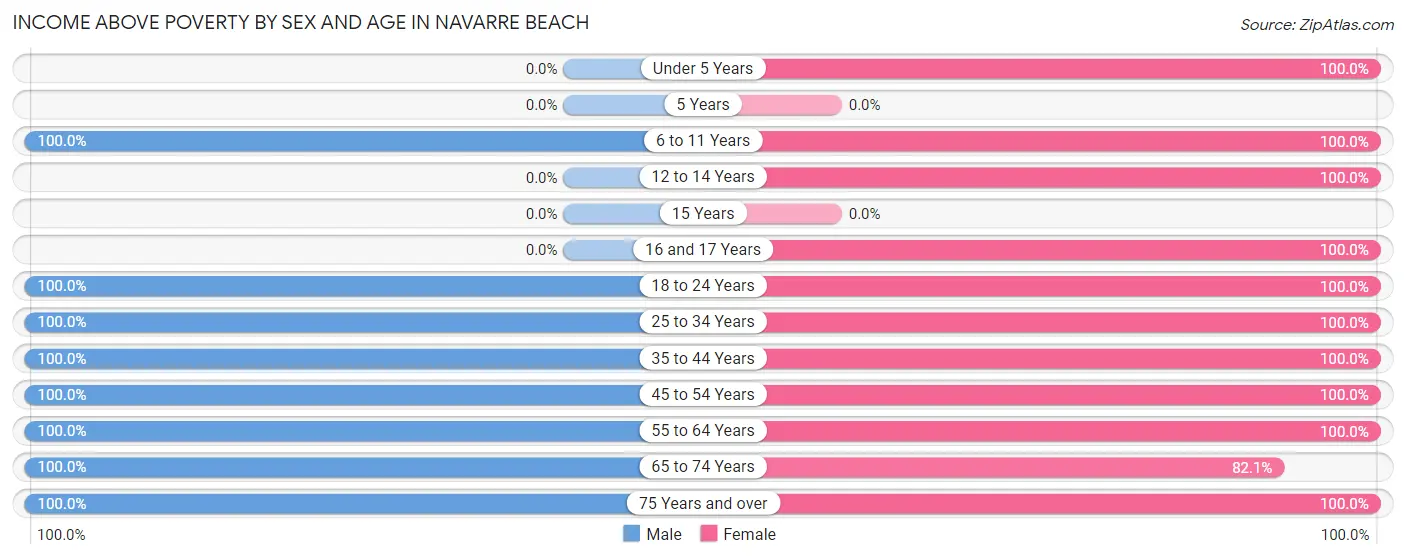
Income Above Poverty by Sex and Age in Navarre Beach
According to the poverty statistics in Navarre Beach, males aged 6 to 11 years and females aged under 5 years are the age groups that are most secure financially, with 100.0% of males and 100.0% of females in these age groups living above the poverty line.
| Age Bracket | Male | Female |
| Under 5 Years | 0 (0.0%) | 31 (100.0%) |
| 5 Years | 0 (0.0%) | 0 (0.0%) |
| 6 to 11 Years | 14 (100.0%) | 19 (100.0%) |
| 12 to 14 Years | 0 (0.0%) | 10 (100.0%) |
| 15 Years | 0 (0.0%) | 0 (0.0%) |
| 16 and 17 Years | 0 (0.0%) | 7 (100.0%) |
| 18 to 24 Years | 11 (100.0%) | 94 (100.0%) |
| 25 to 34 Years | 45 (100.0%) | 31 (100.0%) |
| 35 to 44 Years | 184 (100.0%) | 194 (100.0%) |
| 45 to 54 Years | 39 (100.0%) | 85 (100.0%) |
| 55 to 64 Years | 163 (100.0%) | 262 (100.0%) |
| 65 to 74 Years | 218 (100.0%) | 78 (82.1%) |
| 75 Years and over | 35 (100.0%) | 25 (100.0%) |
| Total | 709 (100.0%) | 836 (98.0%) |
Income Below Poverty Among Married-Couple Families in Navarre Beach
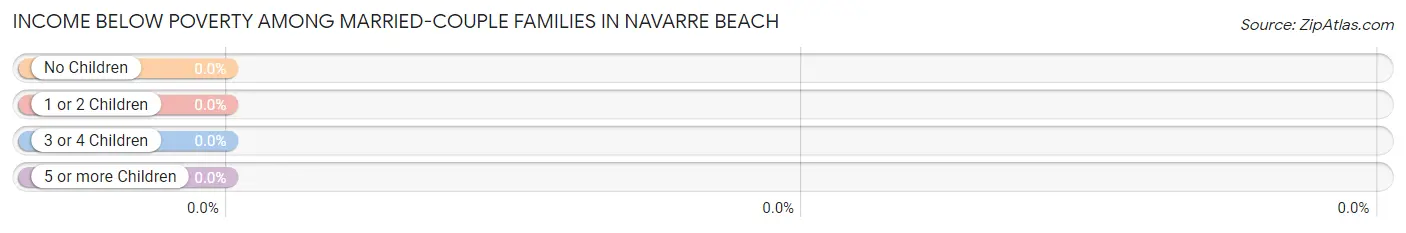
| Children | Above Poverty | Below Poverty |
| No Children | 579 (100.0%) | 0 (0.0%) |
| 1 or 2 Children | 22 (100.0%) | 0 (0.0%) |
| 3 or 4 Children | 14 (100.0%) | 0 (0.0%) |
| 5 or more Children | 0 (0.0%) | 0 (0.0%) |
| Total | 615 (100.0%) | 0 (0.0%) |
Income Below Poverty Among Single-Parent Households in Navarre Beach
| Children | Single Father | Single Mother |
| No Children | 0 (0.0%) | 0 (0.0%) |
| 1 or 2 Children | 0 (0.0%) | 0 (0.0%) |
| 3 or 4 Children | 0 (0.0%) | 0 (0.0%) |
| 5 or more Children | 0 (0.0%) | 0 (0.0%) |
| Total | 0 (0.0%) | 0 (0.0%) |
Income Below Poverty Among Married-Couple vs Single-Parent Households in Navarre Beach
| Children | Married-Couple Families | Single-Parent Households |
| No Children | 0 (0.0%) | 0 (0.0%) |
| 1 or 2 Children | 0 (0.0%) | 0 (0.0%) |
| 3 or 4 Children | 0 (0.0%) | 0 (0.0%) |
| 5 or more Children | 0 (0.0%) | 0 (0.0%) |
| Total | 0 (0.0%) | 0 (0.0%) |
Employment Characteristics in Navarre Beach
Employment by Class of Employer in Navarre Beach
Among the 876 employed individuals in Navarre Beach, private company employees (593 | 67.7%), self-employed (incorporated) (164 | 18.7%), and self-employed (not incorporated) (73 | 8.3%) make up the most common classes of employment.
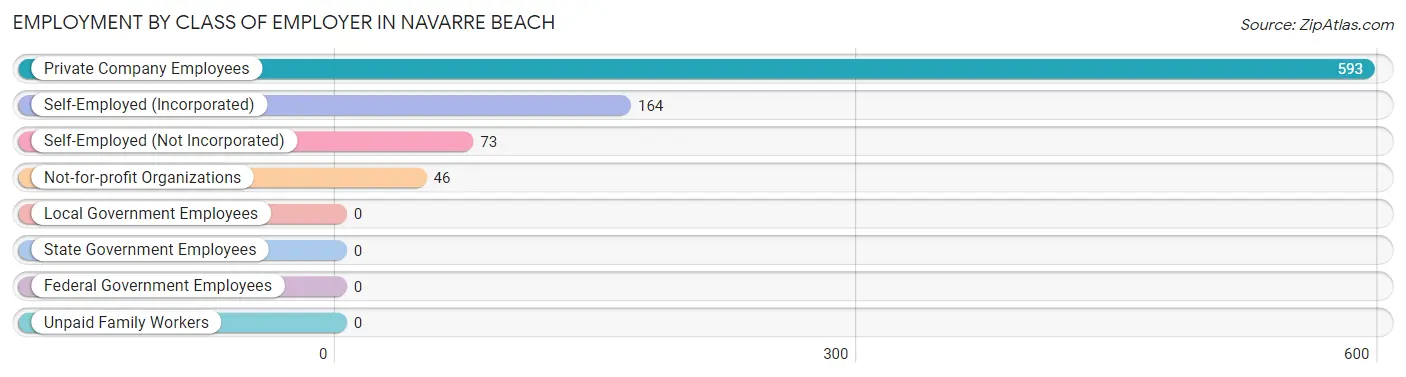
| Employer Class | # Employees | % Employees |
| Private Company Employees | 593 | 67.7% |
| Self-Employed (Incorporated) | 164 | 18.7% |
| Self-Employed (Not Incorporated) | 73 | 8.3% |
| Not-for-profit Organizations | 46 | 5.2% |
| Local Government Employees | 0 | 0.0% |
| State Government Employees | 0 | 0.0% |
| Federal Government Employees | 0 | 0.0% |
| Unpaid Family Workers | 0 | 0.0% |
| Total | 876 | 100.0% |
Employment Status by Age in Navarre Beach
According to the labor force statistics for Navarre Beach, out of the total population over 16 years of age (1,488), 61.7% or 918 individuals are in the labor force, with 4.6% or 42 of them unemployed. The age group with the highest labor force participation rate is 20 to 24 years, with 100.0% or 105 individuals in the labor force. Within the labor force, the 65 to 74 years age range has the highest percentage of unemployed individuals, with 21.7% or 20 of them being unemployed.
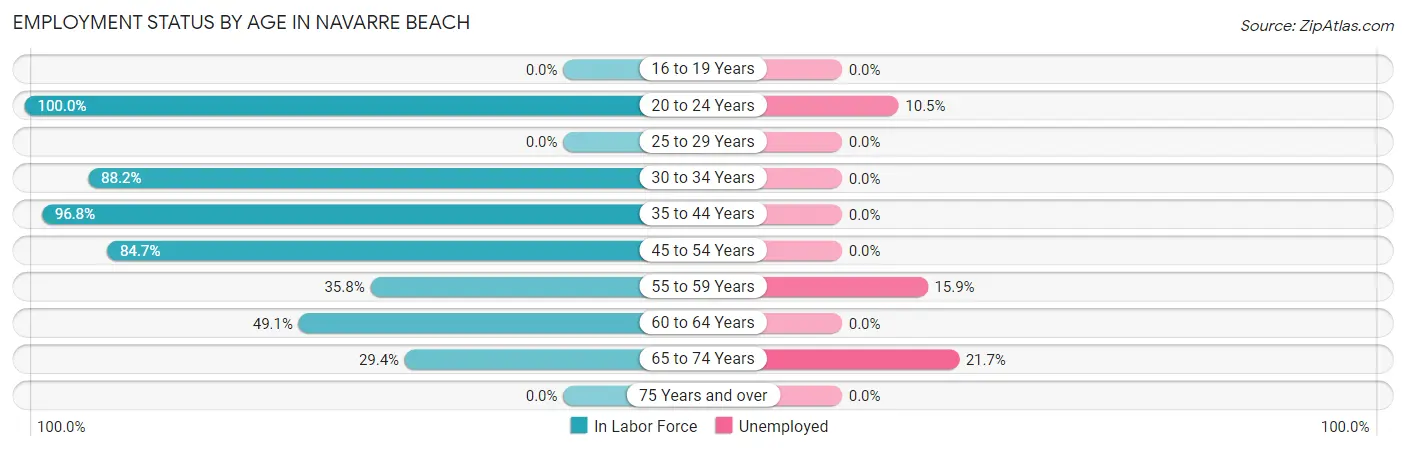
| Age Bracket | In Labor Force | Unemployed |
| 16 to 19 Years | 0 (0.0%) | 0 (0.0%) |
| 20 to 24 Years | 105 (100.0%) | 11 (10.5%) |
| 25 to 29 Years | 0 (0.0%) | 0 (0.0%) |
| 30 to 34 Years | 67 (88.2%) | 0 (0.0%) |
| 35 to 44 Years | 366 (96.8%) | 0 (0.0%) |
| 45 to 54 Years | 105 (84.7%) | 0 (0.0%) |
| 55 to 59 Years | 69 (35.8%) | 11 (15.9%) |
| 60 to 64 Years | 114 (49.1%) | 0 (0.0%) |
| 65 to 74 Years | 92 (29.4%) | 20 (21.7%) |
| 75 Years and over | 0 (0.0%) | 0 (0.0%) |
| Total | 918 (61.7%) | 42 (4.6%) |
Employment Status by Educational Attainment in Navarre Beach
According to labor force statistics for Navarre Beach, 71.9% of individuals (721) out of the total population between 25 and 64 years of age (1,003) are in the labor force, with 1.5% or 11 of them being unemployed. The group with the highest labor force participation rate are those with the educational attainment of bachelor's degree or higher, with 76.8% or 358 individuals in the labor force. Within the labor force, individuals with bachelor's degree or higher education have the highest percentage of unemployment, with 3.1% or 11 of them being unemployed.
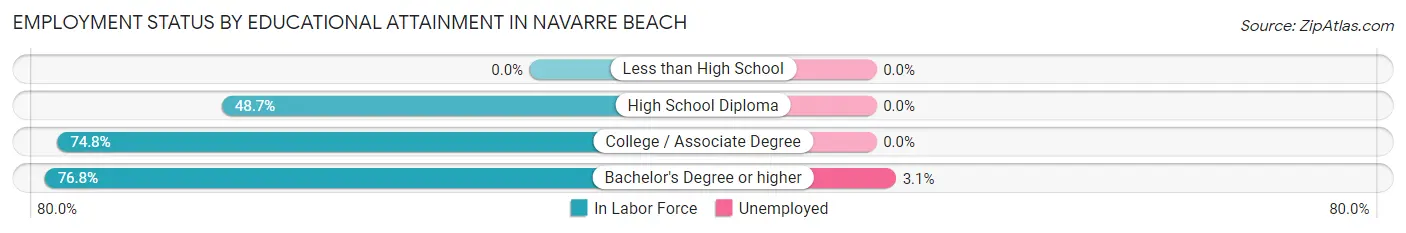
| Educational Attainment | In Labor Force | Unemployed |
| Less than High School | 0 (0.0%) | 0 (0.0%) |
| High School Diploma | 55 (48.7%) | 0 (0.0%) |
| College / Associate Degree | 308 (74.8%) | 0 (0.0%) |
| Bachelor's Degree or higher | 358 (76.8%) | 14 (3.1%) |
| Total | 721 (71.9%) | 15 (1.5%) |
Employment Occupations by Sex in Navarre Beach
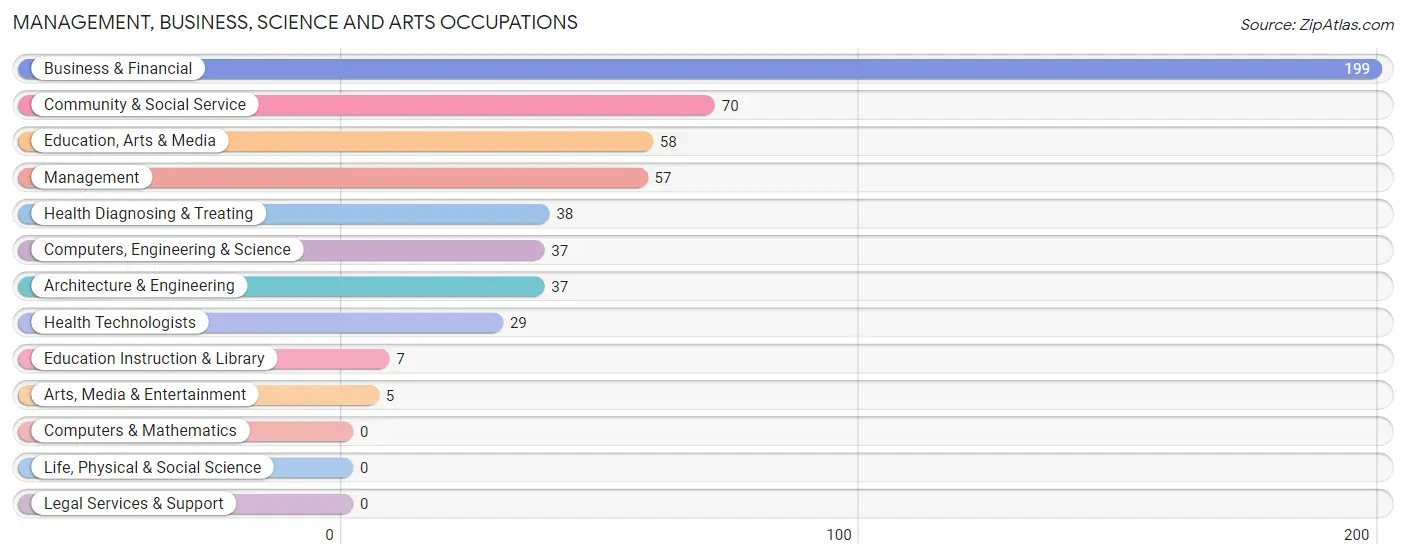
Management, Business, Science and Arts Occupations
The most common Management, Business, Science and Arts occupations in Navarre Beach are Business & Financial (199 | 22.7%), Community & Social Service (70 | 8.0%), Education, Arts & Media (58 | 6.6%), Management (57 | 6.5%), and Health Diagnosing & Treating (38 | 4.3%).
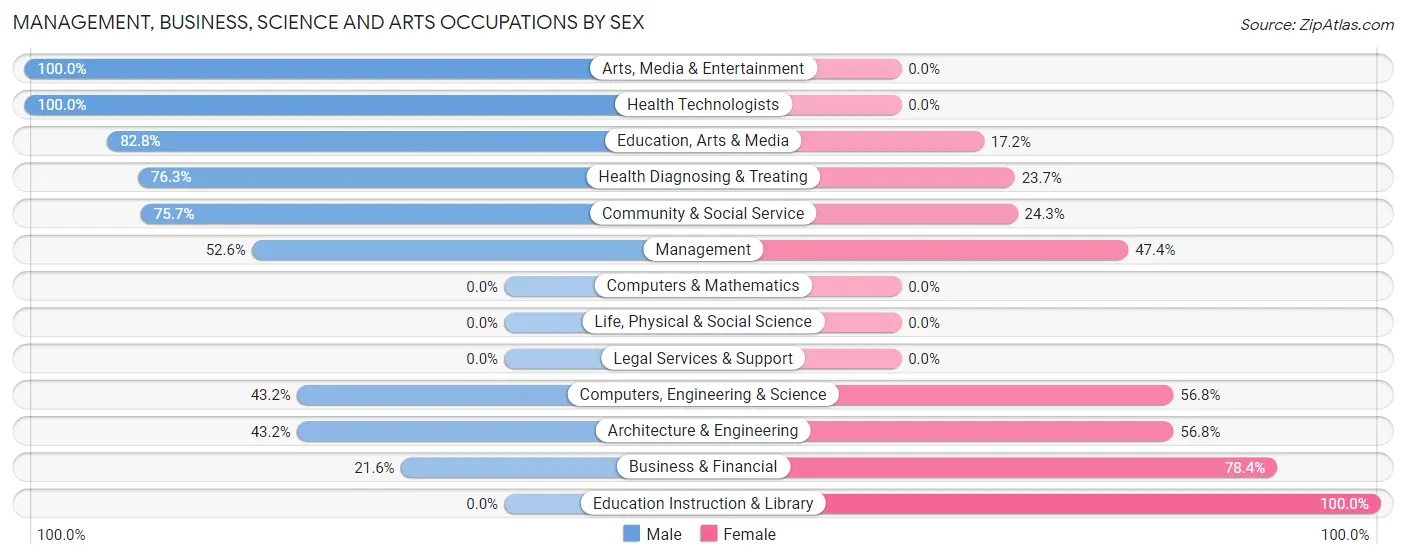
Management, Business, Science and Arts Occupations by Sex
Within the Management, Business, Science and Arts occupations in Navarre Beach, the most male-oriented occupations are Arts, Media & Entertainment (100.0%), Health Technologists (100.0%), and Education, Arts & Media (82.8%), while the most female-oriented occupations are Education Instruction & Library (100.0%), Business & Financial (78.4%), and Computers, Engineering & Science (56.8%).
| Occupation | Male | Female |
| Management | 30 (52.6%) | 27 (47.4%) |
| Business & Financial | 43 (21.6%) | 156 (78.4%) |
| Computers, Engineering & Science | 16 (43.2%) | 21 (56.8%) |
| Computers & Mathematics | 0 (0.0%) | 0 (0.0%) |
| Architecture & Engineering | 16 (43.2%) | 21 (56.8%) |
| Life, Physical & Social Science | 0 (0.0%) | 0 (0.0%) |
| Community & Social Service | 53 (75.7%) | 17 (24.3%) |
| Education, Arts & Media | 48 (82.8%) | 10 (17.2%) |
| Legal Services & Support | 0 (0.0%) | 0 (0.0%) |
| Education Instruction & Library | 0 (0.0%) | 7 (100.0%) |
| Arts, Media & Entertainment | 5 (100.0%) | 0 (0.0%) |
| Health Diagnosing & Treating | 29 (76.3%) | 9 (23.7%) |
| Health Technologists | 29 (100.0%) | 0 (0.0%) |
| Total (Category) | 171 (42.6%) | 230 (57.4%) |
| Total (Overall) | 403 (46.0%) | 473 (54.0%) |
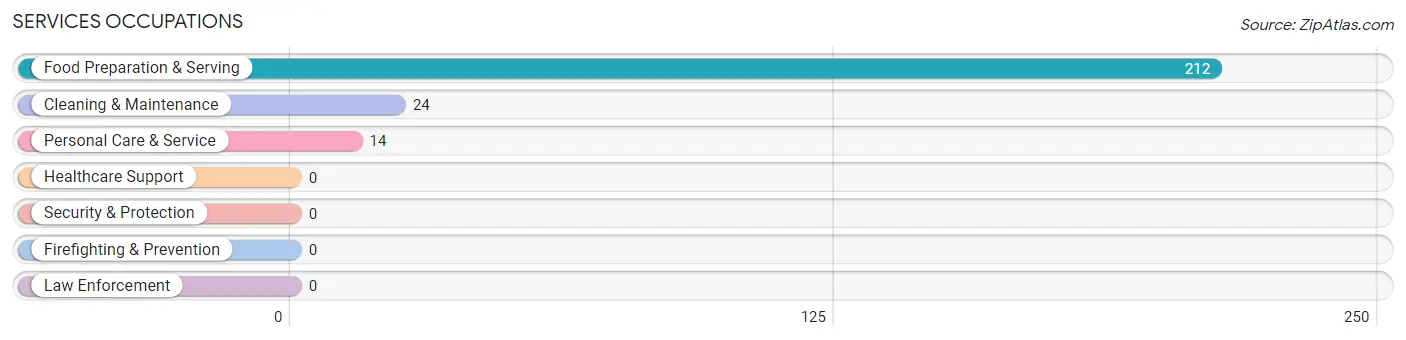
Services Occupations
The most common Services occupations in Navarre Beach are Food Preparation & Serving (212 | 24.2%), Cleaning & Maintenance (24 | 2.7%), and Personal Care & Service (14 | 1.6%).
Services Occupations by Sex
Within the Services occupations in Navarre Beach, the most male-oriented occupations are Cleaning & Maintenance (100.0%), and Food Preparation & Serving (59.4%), while the most female-oriented occupations are Personal Care & Service (100.0%), and Food Preparation & Serving (40.6%).
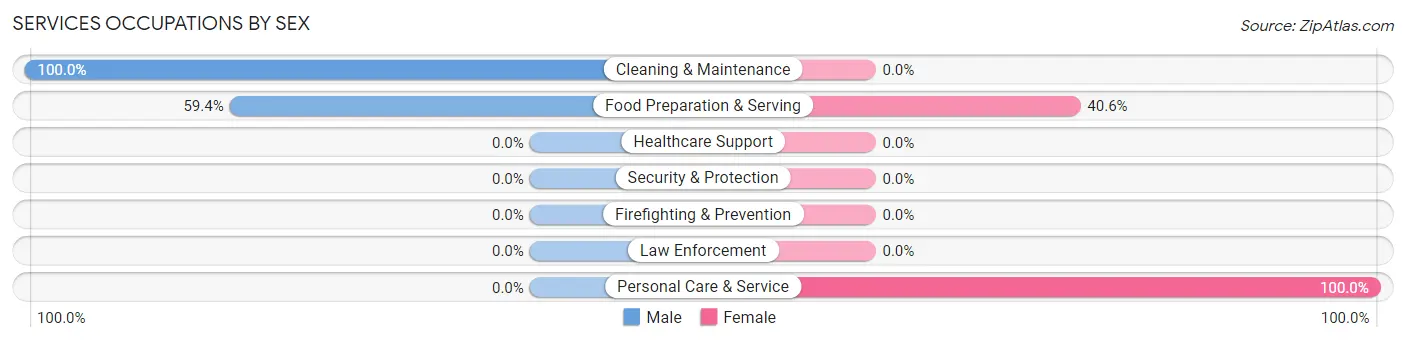
| Occupation | Male | Female |
| Healthcare Support | 0 (0.0%) | 0 (0.0%) |
| Security & Protection | 0 (0.0%) | 0 (0.0%) |
| Firefighting & Prevention | 0 (0.0%) | 0 (0.0%) |
| Law Enforcement | 0 (0.0%) | 0 (0.0%) |
| Food Preparation & Serving | 126 (59.4%) | 86 (40.6%) |
| Cleaning & Maintenance | 24 (100.0%) | 0 (0.0%) |
| Personal Care & Service | 0 (0.0%) | 14 (100.0%) |
| Total (Category) | 150 (60.0%) | 100 (40.0%) |
| Total (Overall) | 403 (46.0%) | 473 (54.0%) |
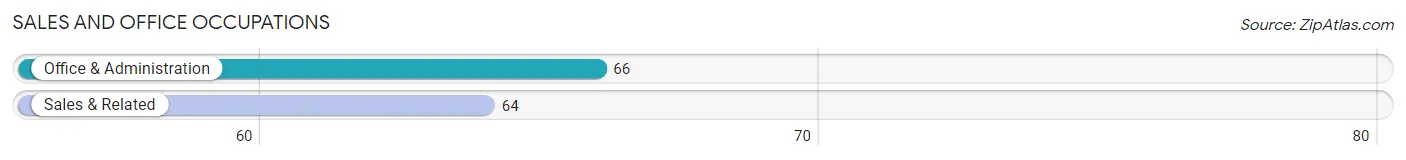
Sales and Office Occupations
The most common Sales and Office occupations in Navarre Beach are Office & Administration (66 | 7.5%), and Sales & Related (64 | 7.3%).
Sales and Office Occupations by Sex
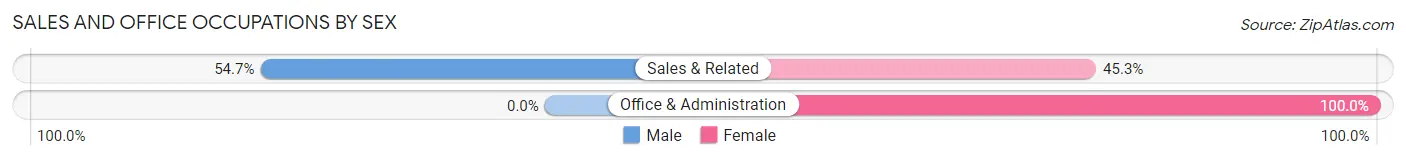
| Occupation | Male | Female |
| Sales & Related | 35 (54.7%) | 29 (45.3%) |
| Office & Administration | 0 (0.0%) | 66 (100.0%) |
| Total (Category) | 35 (26.9%) | 95 (73.1%) |
| Total (Overall) | 403 (46.0%) | 473 (54.0%) |
Natural Resources, Construction and Maintenance Occupations
The most common Natural Resources, Construction and Maintenance occupations in Navarre Beach are , and Construction & Extraction (9 | 1.0%).
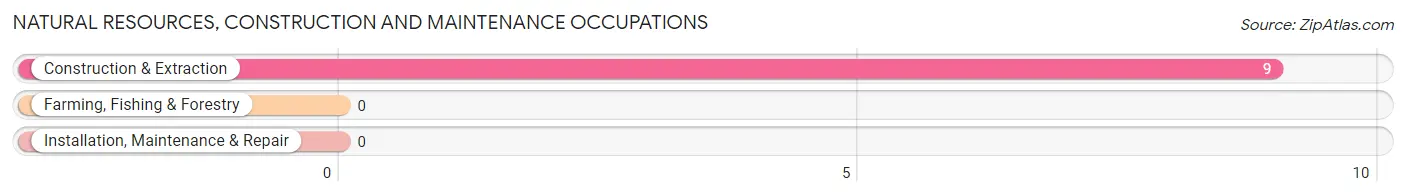
Natural Resources, Construction and Maintenance Occupations by Sex
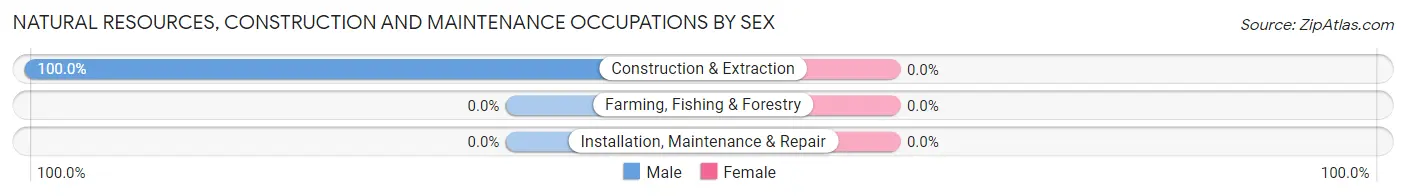
| Occupation | Male | Female |
| Farming, Fishing & Forestry | 0 (0.0%) | 0 (0.0%) |
| Construction & Extraction | 9 (100.0%) | 0 (0.0%) |
| Installation, Maintenance & Repair | 0 (0.0%) | 0 (0.0%) |
| Total (Category) | 9 (100.0%) | 0 (0.0%) |
| Total (Overall) | 403 (46.0%) | 473 (54.0%) |
Production, Transportation and Moving Occupations
The most common Production, Transportation and Moving occupations in Navarre Beach are Transportation (71 | 8.1%), and Material Moving (15 | 1.7%).
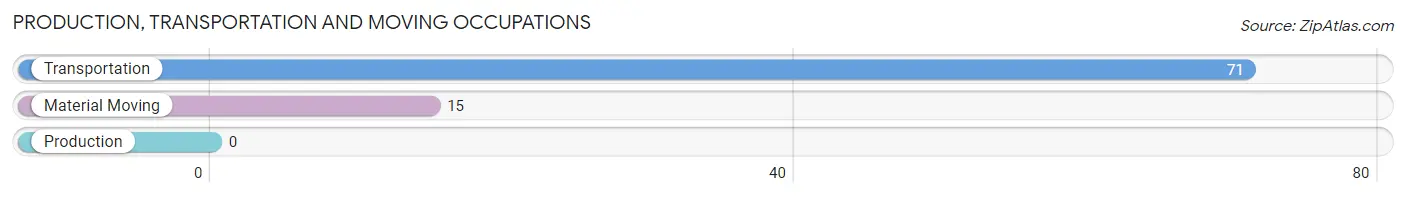
Production, Transportation and Moving Occupations by Sex
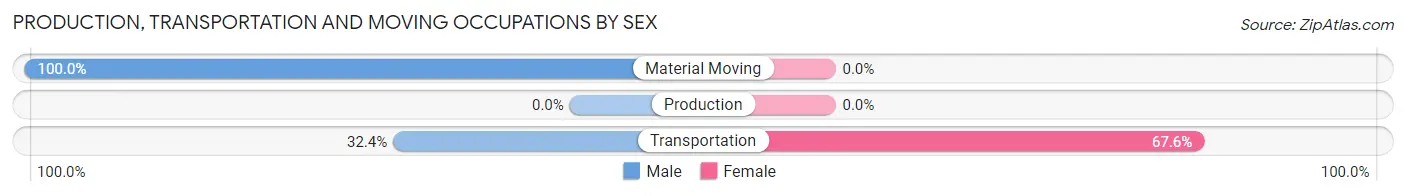
| Occupation | Male | Female |
| Production | 0 (0.0%) | 0 (0.0%) |
| Transportation | 23 (32.4%) | 48 (67.6%) |
| Material Moving | 15 (100.0%) | 0 (0.0%) |
| Total (Category) | 38 (44.2%) | 48 (55.8%) |
| Total (Overall) | 403 (46.0%) | 473 (54.0%) |
Employment Industries by Sex in Navarre Beach
Employment Industries in Navarre Beach
The major employment industries in Navarre Beach include Accommodation & Food Services (220 | 25.1%), Professional & Scientific (217 | 24.8%), Transportation & Warehousing (99 | 11.3%), Health Care & Social Assistance (58 | 6.6%), and Wholesale Trade (45 | 5.1%).
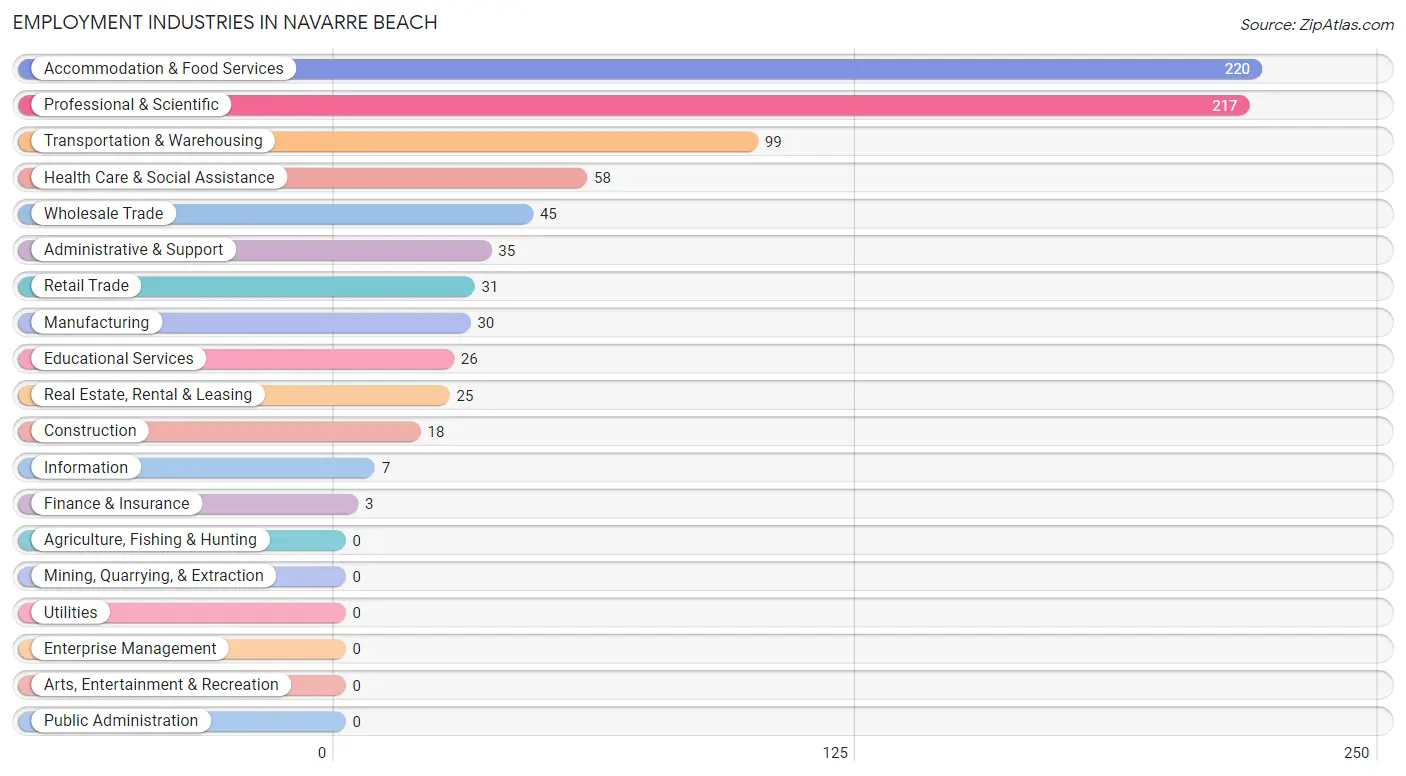
Employment Industries by Sex in Navarre Beach
The Navarre Beach industries that see more men than women are Information (100.0%), Manufacturing (76.7%), and Wholesale Trade (73.3%), whereas the industries that tend to have a higher number of women are Finance & Insurance (100.0%), Professional & Scientific (85.7%), and Transportation & Warehousing (69.7%).
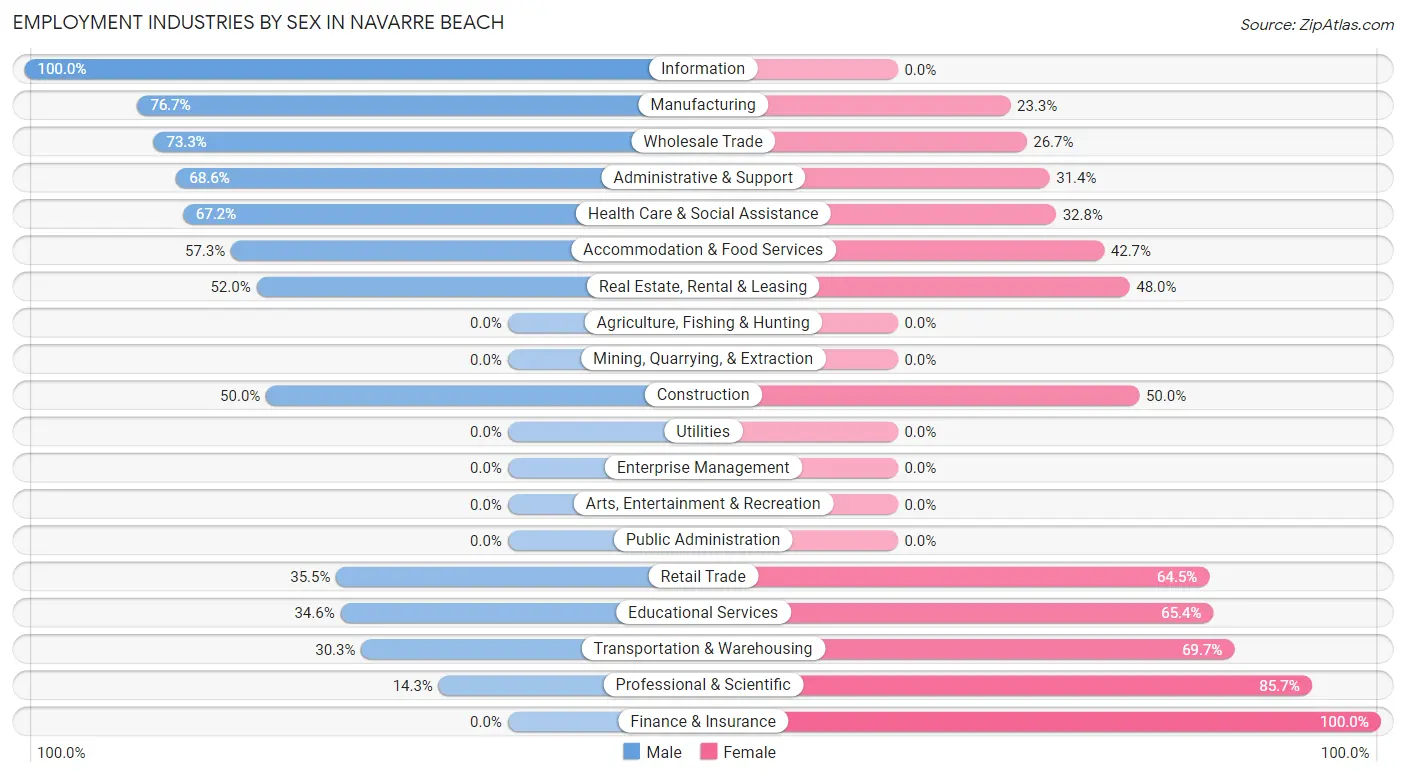
| Industry | Male | Female |
| Agriculture, Fishing & Hunting | 0 (0.0%) | 0 (0.0%) |
| Mining, Quarrying, & Extraction | 0 (0.0%) | 0 (0.0%) |
| Construction | 9 (50.0%) | 9 (50.0%) |
| Manufacturing | 23 (76.7%) | 7 (23.3%) |
| Wholesale Trade | 33 (73.3%) | 12 (26.7%) |
| Retail Trade | 11 (35.5%) | 20 (64.5%) |
| Transportation & Warehousing | 30 (30.3%) | 69 (69.7%) |
| Utilities | 0 (0.0%) | 0 (0.0%) |
| Information | 7 (100.0%) | 0 (0.0%) |
| Finance & Insurance | 0 (0.0%) | 3 (100.0%) |
| Real Estate, Rental & Leasing | 13 (52.0%) | 12 (48.0%) |
| Professional & Scientific | 31 (14.3%) | 186 (85.7%) |
| Enterprise Management | 0 (0.0%) | 0 (0.0%) |
| Administrative & Support | 24 (68.6%) | 11 (31.4%) |
| Educational Services | 9 (34.6%) | 17 (65.4%) |
| Health Care & Social Assistance | 39 (67.2%) | 19 (32.8%) |
| Arts, Entertainment & Recreation | 0 (0.0%) | 0 (0.0%) |
| Accommodation & Food Services | 126 (57.3%) | 94 (42.7%) |
| Public Administration | 0 (0.0%) | 0 (0.0%) |
| Total | 403 (46.0%) | 473 (54.0%) |
Education in Navarre Beach
School Enrollment in Navarre Beach
The most common levels of schooling among the 147 students in Navarre Beach are college / undergraduate (97 | 66.0%), elementary school (28 | 19.1%), and middle school (15 | 10.2%).
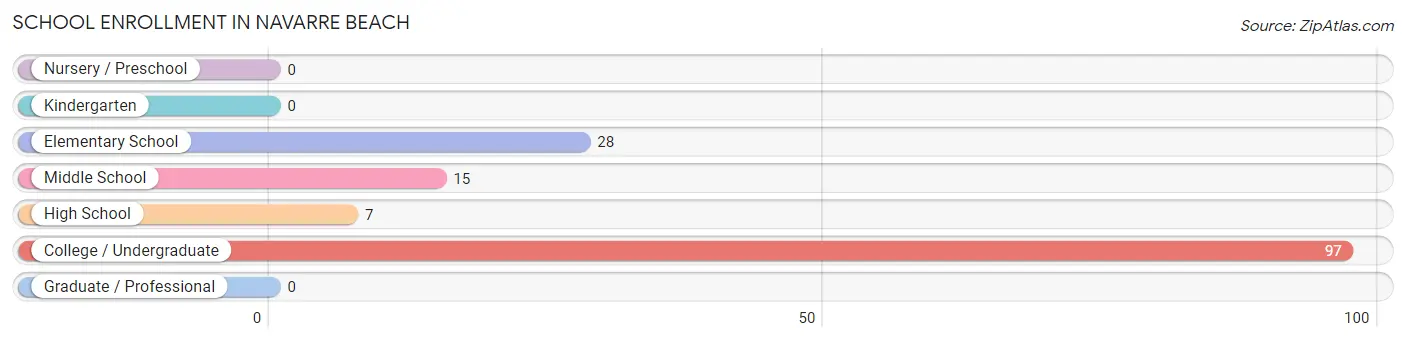
| School Level | # Students | % Students |
| Nursery / Preschool | 0 | 0.0% |
| Kindergarten | 0 | 0.0% |
| Elementary School | 28 | 19.1% |
| Middle School | 15 | 10.2% |
| High School | 7 | 4.8% |
| College / Undergraduate | 97 | 66.0% |
| Graduate / Professional | 0 | 0.0% |
| Total | 147 | 100.0% |
School Enrollment by Age by Funding Source in Navarre Beach
Out of a total of 147 students who are enrolled in schools in Navarre Beach, 97 (66.0%) attend a private institution, while the remaining 50 (34.0%) are enrolled in public schools. The age group of 20 to 24 year olds has the highest likelihood of being enrolled in private schools, with 97 (100.0% in the age bracket) enrolled. Conversely, the age group of 5 to 9 year old has the lowest likelihood of being enrolled in a private school, with 14 (100.0% in the age bracket) attending a public institution.
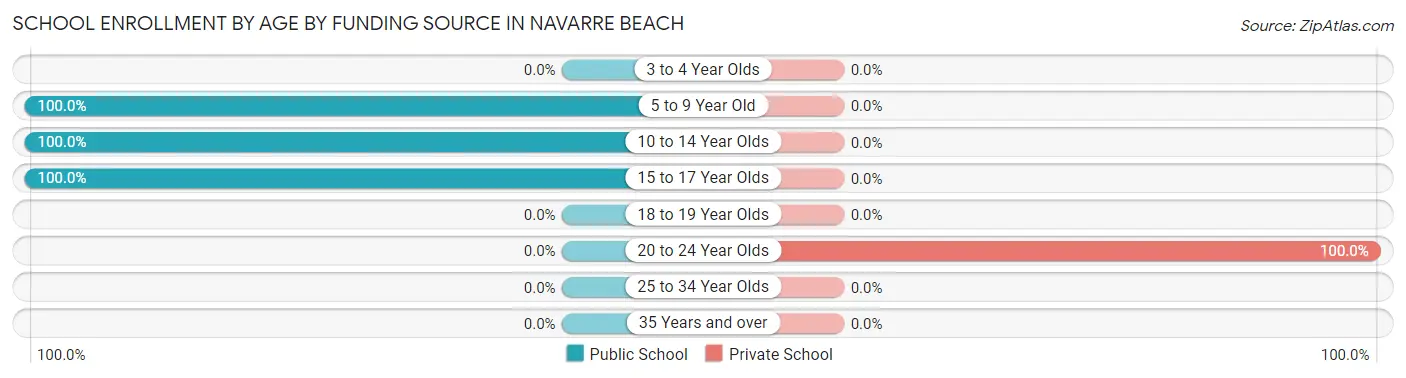
| Age Bracket | Public School | Private School |
| 3 to 4 Year Olds | 0 (0.0%) | 0 (0.0%) |
| 5 to 9 Year Old | 14 (100.0%) | 0 (0.0%) |
| 10 to 14 Year Olds | 29 (100.0%) | 0 (0.0%) |
| 15 to 17 Year Olds | 7 (100.0%) | 0 (0.0%) |
| 18 to 19 Year Olds | 0 (0.0%) | 0 (0.0%) |
| 20 to 24 Year Olds | 0 (0.0%) | 97 (100.0%) |
| 25 to 34 Year Olds | 0 (0.0%) | 0 (0.0%) |
| 35 Years and over | 0 (0.0%) | 0 (0.0%) |
| Total | 50 (34.0%) | 97 (66.0%) |
Educational Attainment by Field of Study in Navarre Beach
Business (158 | 21.7%), computers & mathematics (153 | 21.0%), physical & health sciences (102 | 14.0%), engineering (88 | 12.1%), and social sciences (67 | 9.2%) are the most common fields of study among 727 individuals in Navarre Beach who have obtained a bachelor's degree or higher.
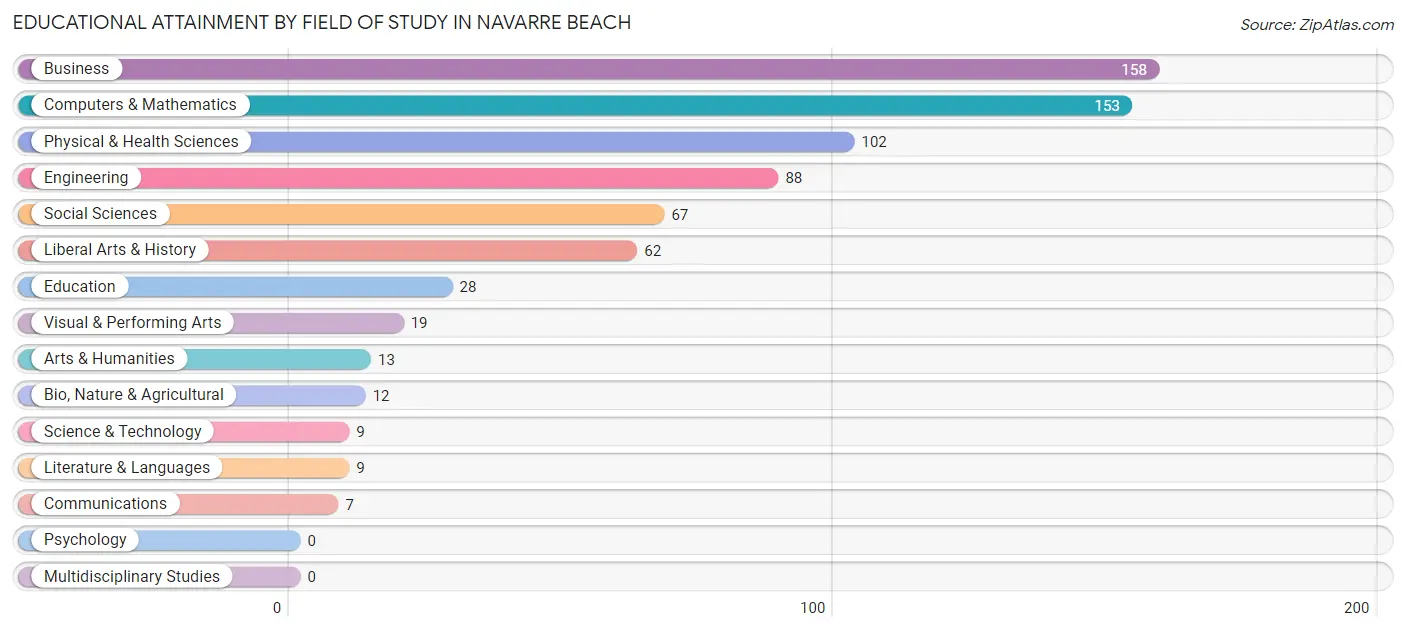
| Field of Study | # Graduates | % Graduates |
| Computers & Mathematics | 153 | 21.0% |
| Bio, Nature & Agricultural | 12 | 1.7% |
| Physical & Health Sciences | 102 | 14.0% |
| Psychology | 0 | 0.0% |
| Social Sciences | 67 | 9.2% |
| Engineering | 88 | 12.1% |
| Multidisciplinary Studies | 0 | 0.0% |
| Science & Technology | 9 | 1.2% |
| Business | 158 | 21.7% |
| Education | 28 | 3.8% |
| Literature & Languages | 9 | 1.2% |
| Liberal Arts & History | 62 | 8.5% |
| Visual & Performing Arts | 19 | 2.6% |
| Communications | 7 | 1.0% |
| Arts & Humanities | 13 | 1.8% |
| Total | 727 | 100.0% |
Transportation & Commute in Navarre Beach
Vehicle Availability by Sex in Navarre Beach
The most prevalent vehicle ownership categories in Navarre Beach are males with 2 vehicles (189, accounting for 46.9%) and females with 2 vehicles (180, making up 40.0%).
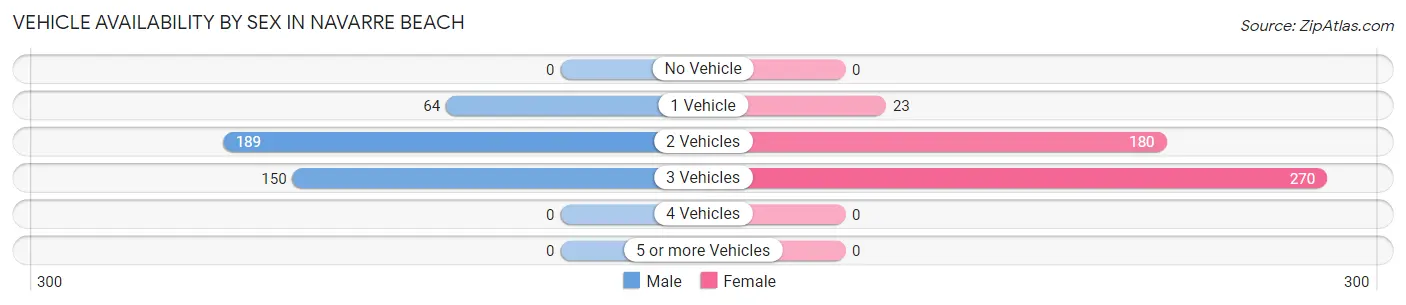
| Vehicles Available | Male | Female |
| No Vehicle | 0 (0.0%) | 0 (0.0%) |
| 1 Vehicle | 64 (15.9%) | 23 (4.9%) |
| 2 Vehicles | 189 (46.9%) | 180 (38.1%) |
| 3 Vehicles | 150 (37.2%) | 270 (57.1%) |
| 4 Vehicles | 0 (0.0%) | 0 (0.0%) |
| 5 or more Vehicles | 0 (0.0%) | 0 (0.0%) |
| Total | 403 (100.0%) | 473 (100.0%) |
Commute Time in Navarre Beach
The most frequently occuring commute durations in Navarre Beach are 45 to 59 minutes (277 commuters, 35.3%), less than 5 minutes (212 commuters, 27.0%), and 60 to 89 minutes (96 commuters, 12.2%).
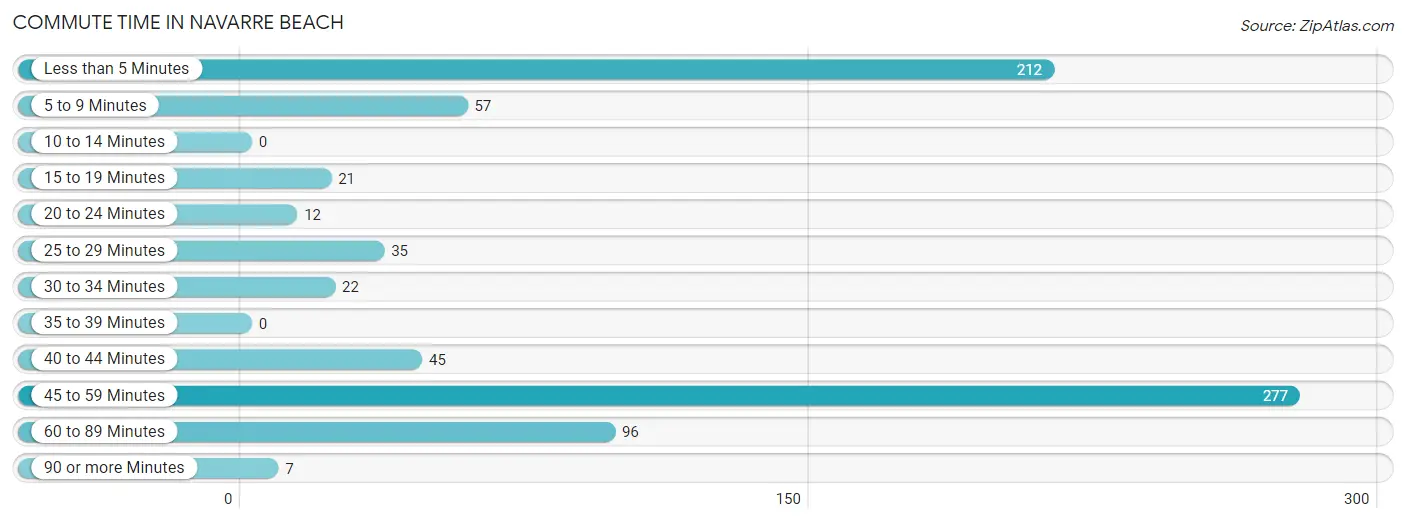
| Commute Time | # Commuters | % Commuters |
| Less than 5 Minutes | 212 | 27.0% |
| 5 to 9 Minutes | 57 | 7.3% |
| 10 to 14 Minutes | 0 | 0.0% |
| 15 to 19 Minutes | 21 | 2.7% |
| 20 to 24 Minutes | 12 | 1.5% |
| 25 to 29 Minutes | 35 | 4.5% |
| 30 to 34 Minutes | 22 | 2.8% |
| 35 to 39 Minutes | 0 | 0.0% |
| 40 to 44 Minutes | 45 | 5.7% |
| 45 to 59 Minutes | 277 | 35.3% |
| 60 to 89 Minutes | 96 | 12.2% |
| 90 or more Minutes | 7 | 0.9% |
Commute Time by Sex in Navarre Beach
The most common commute times in Navarre Beach are less than 5 minutes (126 commuters, 36.4%) for males and 45 to 59 minutes (226 commuters, 51.6%) for females.
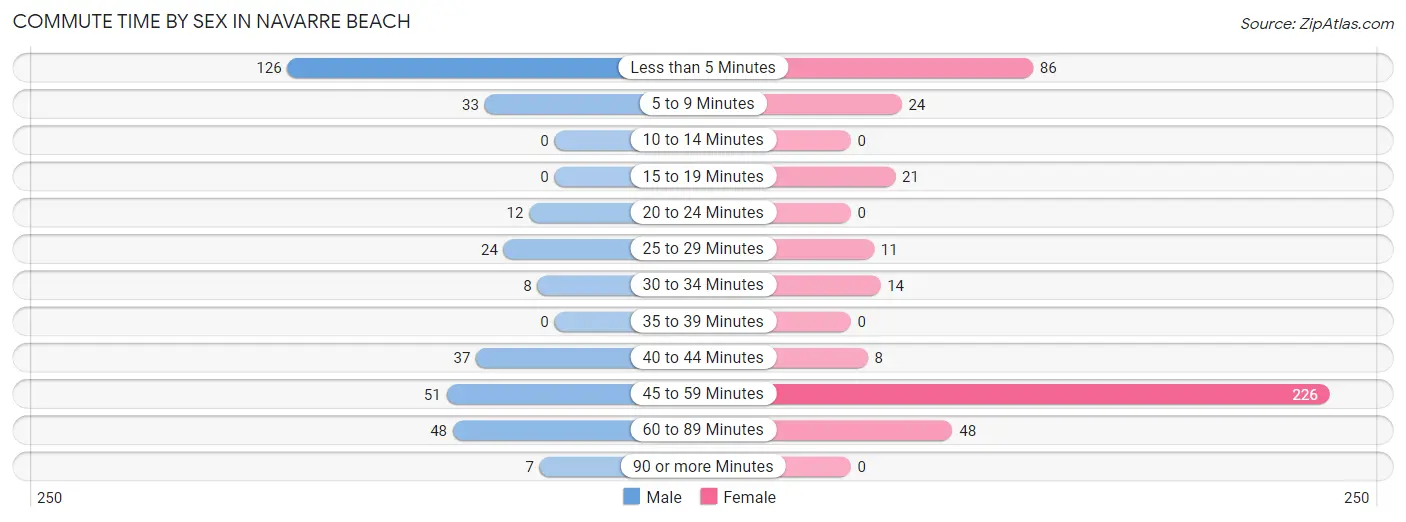
| Commute Time | Male | Female |
| Less than 5 Minutes | 126 (36.4%) | 86 (19.6%) |
| 5 to 9 Minutes | 33 (9.5%) | 24 (5.5%) |
| 10 to 14 Minutes | 0 (0.0%) | 0 (0.0%) |
| 15 to 19 Minutes | 0 (0.0%) | 21 (4.8%) |
| 20 to 24 Minutes | 12 (3.5%) | 0 (0.0%) |
| 25 to 29 Minutes | 24 (6.9%) | 11 (2.5%) |
| 30 to 34 Minutes | 8 (2.3%) | 14 (3.2%) |
| 35 to 39 Minutes | 0 (0.0%) | 0 (0.0%) |
| 40 to 44 Minutes | 37 (10.7%) | 8 (1.8%) |
| 45 to 59 Minutes | 51 (14.7%) | 226 (51.6%) |
| 60 to 89 Minutes | 48 (13.9%) | 48 (11.0%) |
| 90 or more Minutes | 7 (2.0%) | 0 (0.0%) |
Time of Departure to Work by Sex in Navarre Beach
The most frequent times of departure to work in Navarre Beach are 11:00 AM to 11:59 AM (126, 36.4%) for males and 7:30 AM to 7:59 AM (153, 34.9%) for females.
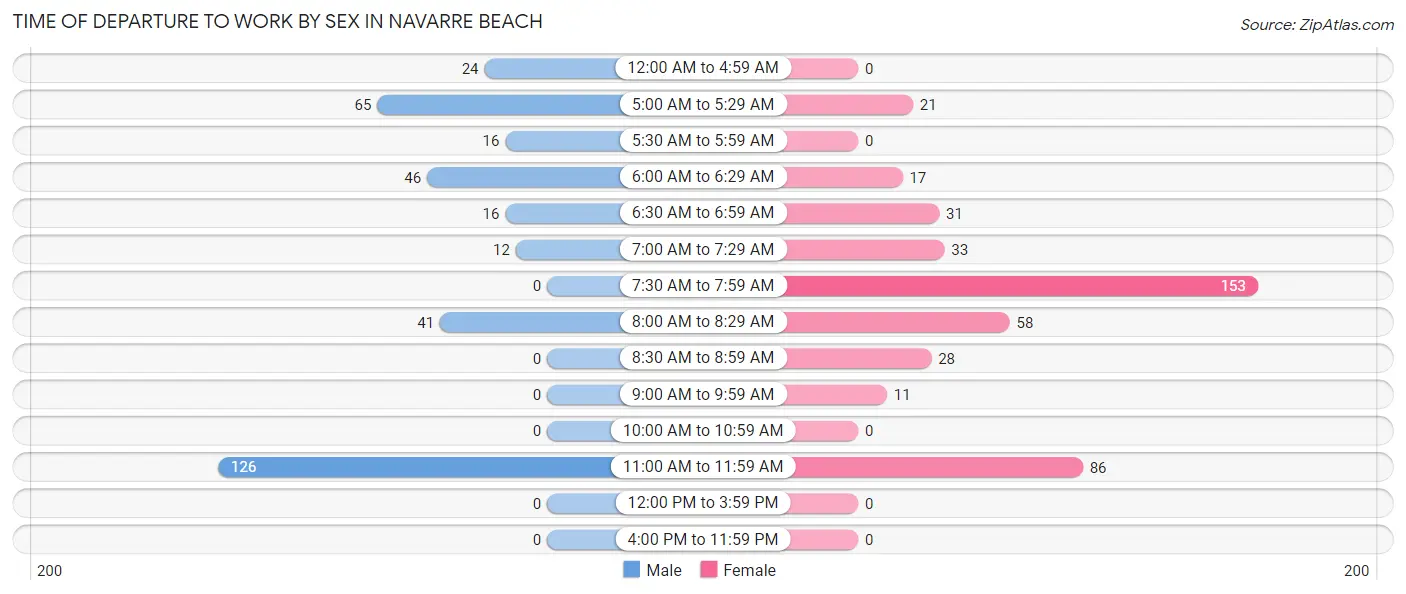
| Time of Departure | Male | Female |
| 12:00 AM to 4:59 AM | 24 (6.9%) | 0 (0.0%) |
| 5:00 AM to 5:29 AM | 65 (18.8%) | 21 (4.8%) |
| 5:30 AM to 5:59 AM | 16 (4.6%) | 0 (0.0%) |
| 6:00 AM to 6:29 AM | 46 (13.3%) | 17 (3.9%) |
| 6:30 AM to 6:59 AM | 16 (4.6%) | 31 (7.1%) |
| 7:00 AM to 7:29 AM | 12 (3.5%) | 33 (7.5%) |
| 7:30 AM to 7:59 AM | 0 (0.0%) | 153 (34.9%) |
| 8:00 AM to 8:29 AM | 41 (11.8%) | 58 (13.2%) |
| 8:30 AM to 8:59 AM | 0 (0.0%) | 28 (6.4%) |
| 9:00 AM to 9:59 AM | 0 (0.0%) | 11 (2.5%) |
| 10:00 AM to 10:59 AM | 0 (0.0%) | 0 (0.0%) |
| 11:00 AM to 11:59 AM | 126 (36.4%) | 86 (19.6%) |
| 12:00 PM to 3:59 PM | 0 (0.0%) | 0 (0.0%) |
| 4:00 PM to 11:59 PM | 0 (0.0%) | 0 (0.0%) |
| Total | 346 (100.0%) | 438 (100.0%) |
Housing Occupancy in Navarre Beach
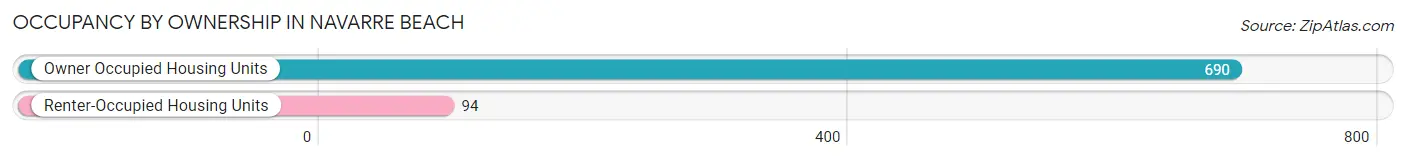
Occupancy by Ownership in Navarre Beach
Of the total 784 dwellings in Navarre Beach, owner-occupied units account for 690 (88.0%), while renter-occupied units make up 94 (12.0%).
| Occupancy | # Housing Units | % Housing Units |
| Owner Occupied Housing Units | 690 | 88.0% |
| Renter-Occupied Housing Units | 94 | 12.0% |
| Total Occupied Housing Units | 784 | 100.0% |
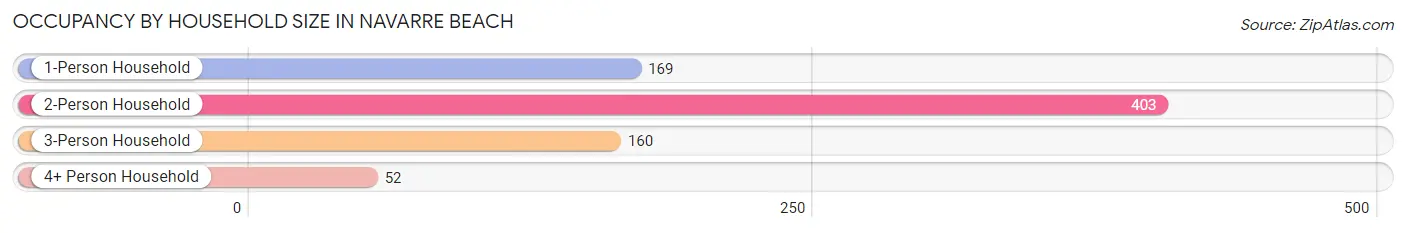
Occupancy by Household Size in Navarre Beach
| Household Size | # Housing Units | % Housing Units |
| 1-Person Household | 169 | 21.6% |
| 2-Person Household | 403 | 51.4% |
| 3-Person Household | 160 | 20.4% |
| 4+ Person Household | 52 | 6.6% |
| Total Housing Units | 784 | 100.0% |
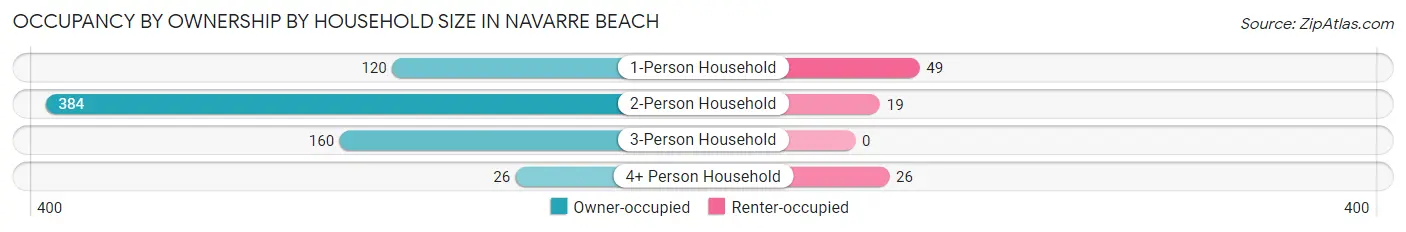
Occupancy by Ownership by Household Size in Navarre Beach
| Household Size | Owner-occupied | Renter-occupied |
| 1-Person Household | 120 (71.0%) | 49 (29.0%) |
| 2-Person Household | 384 (95.3%) | 19 (4.7%) |
| 3-Person Household | 160 (100.0%) | 0 (0.0%) |
| 4+ Person Household | 26 (50.0%) | 26 (50.0%) |
| Total Housing Units | 690 (88.0%) | 94 (12.0%) |
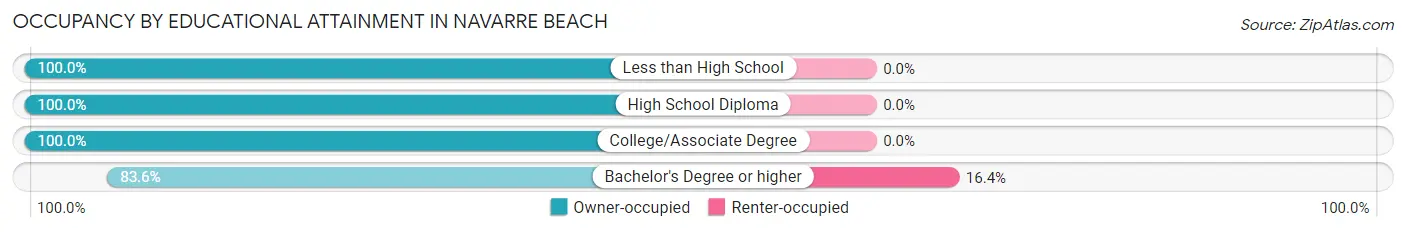
Occupancy by Educational Attainment in Navarre Beach
| Household Size | Owner-occupied | Renter-occupied |
| Less than High School | 17 (100.0%) | 0 (0.0%) |
| High School Diploma | 68 (100.0%) | 0 (0.0%) |
| College/Associate Degree | 126 (100.0%) | 0 (0.0%) |
| Bachelor's Degree or higher | 479 (83.6%) | 94 (16.4%) |
Occupancy by Age of Householder in Navarre Beach
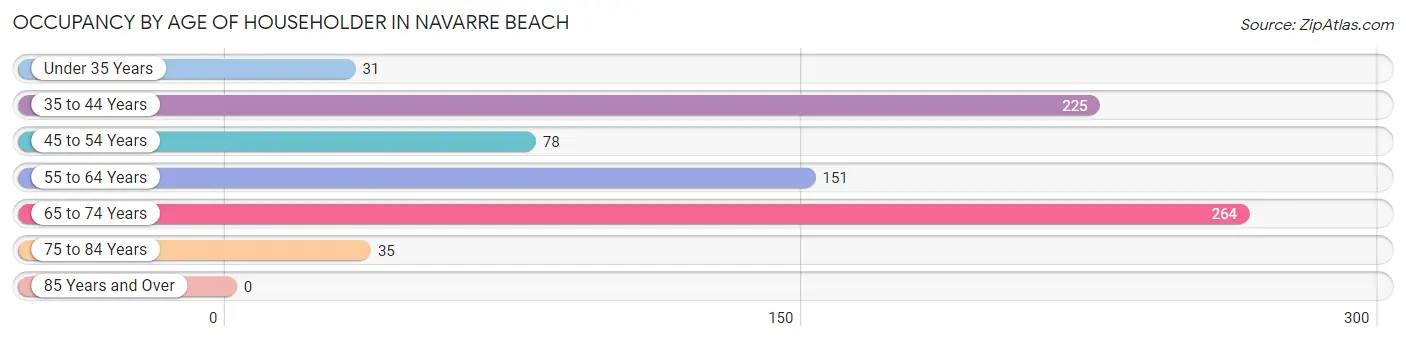
| Age Bracket | # Households | % Households |
| Under 35 Years | 31 | 4.0% |
| 35 to 44 Years | 225 | 28.7% |
| 45 to 54 Years | 78 | 10.0% |
| 55 to 64 Years | 151 | 19.3% |
| 65 to 74 Years | 264 | 33.7% |
| 75 to 84 Years | 35 | 4.5% |
| 85 Years and Over | 0 | 0.0% |
| Total | 784 | 100.0% |
Housing Finances in Navarre Beach
Median Income by Occupancy in Navarre Beach
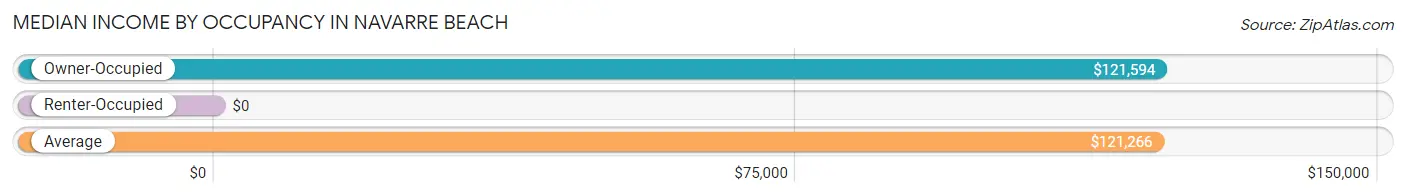
| Occupancy Type | # Households | Median Income |
| Owner-Occupied | 690 (88.0%) | $121,594 |
| Renter-Occupied | 94 (12.0%) | $0 |
| Average | 784 (100.0%) | $121,266 |
Occupancy by Householder Income Bracket in Navarre Beach
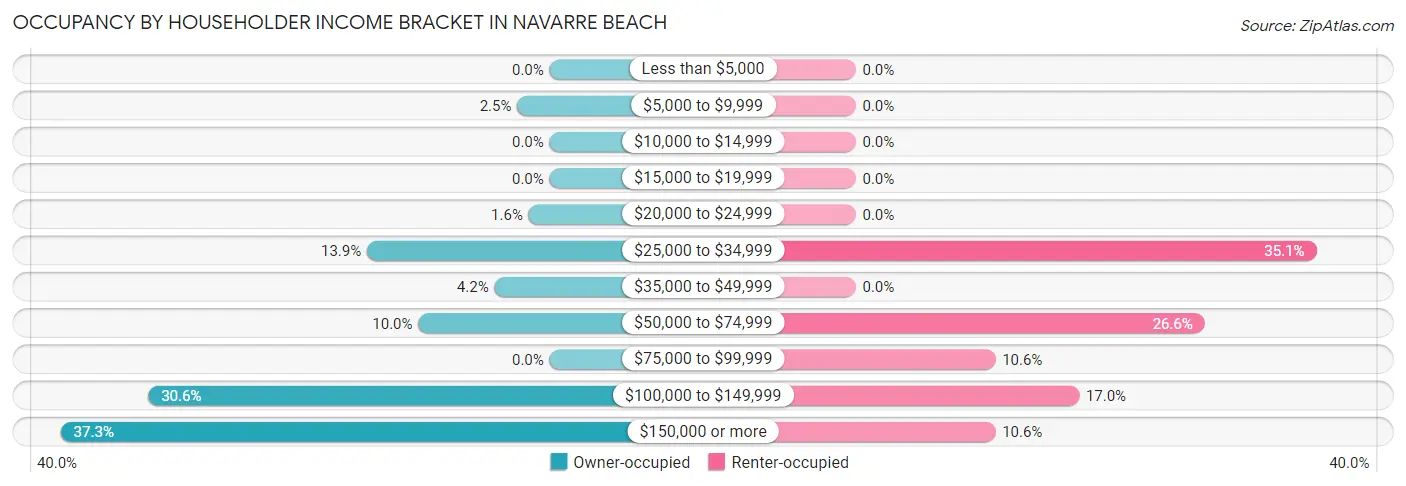
| Income Bracket | Owner-occupied | Renter-occupied |
| Less than $5,000 | 0 (0.0%) | 0 (0.0%) |
| $5,000 to $9,999 | 17 (2.5%) | 0 (0.0%) |
| $10,000 to $14,999 | 0 (0.0%) | 0 (0.0%) |
| $15,000 to $19,999 | 0 (0.0%) | 0 (0.0%) |
| $20,000 to $24,999 | 11 (1.6%) | 0 (0.0%) |
| $25,000 to $34,999 | 96 (13.9%) | 33 (35.1%) |
| $35,000 to $49,999 | 29 (4.2%) | 0 (0.0%) |
| $50,000 to $74,999 | 69 (10.0%) | 25 (26.6%) |
| $75,000 to $99,999 | 0 (0.0%) | 10 (10.6%) |
| $100,000 to $149,999 | 211 (30.6%) | 16 (17.0%) |
| $150,000 or more | 257 (37.2%) | 10 (10.6%) |
| Total | 690 (100.0%) | 94 (100.0%) |
Monthly Housing Cost Tiers in Navarre Beach
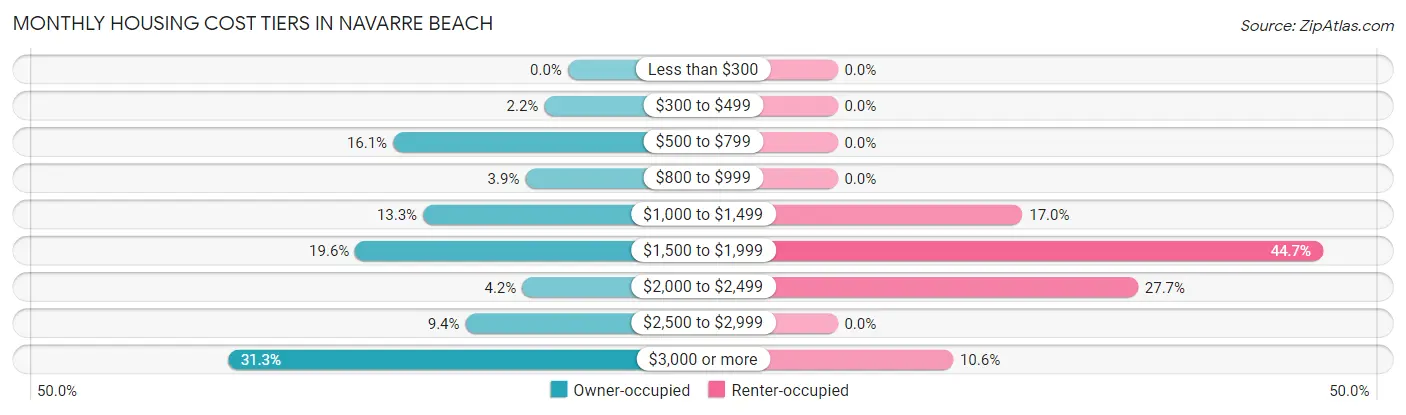
| Monthly Cost | Owner-occupied | Renter-occupied |
| Less than $300 | 0 (0.0%) | 0 (0.0%) |
| $300 to $499 | 15 (2.2%) | 0 (0.0%) |
| $500 to $799 | 111 (16.1%) | 0 (0.0%) |
| $800 to $999 | 27 (3.9%) | 0 (0.0%) |
| $1,000 to $1,499 | 92 (13.3%) | 16 (17.0%) |
| $1,500 to $1,999 | 135 (19.6%) | 42 (44.7%) |
| $2,000 to $2,499 | 29 (4.2%) | 26 (27.7%) |
| $2,500 to $2,999 | 65 (9.4%) | 0 (0.0%) |
| $3,000 or more | 216 (31.3%) | 10 (10.6%) |
| Total | 690 (100.0%) | 94 (100.0%) |
Physical Housing Characteristics in Navarre Beach
Housing Structures in Navarre Beach
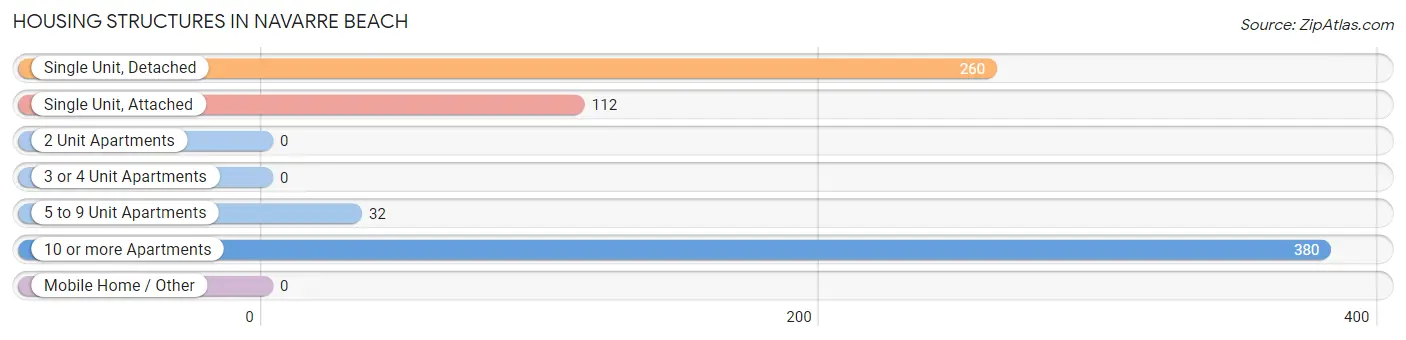
| Structure Type | # Housing Units | % Housing Units |
| Single Unit, Detached | 260 | 33.2% |
| Single Unit, Attached | 112 | 14.3% |
| 2 Unit Apartments | 0 | 0.0% |
| 3 or 4 Unit Apartments | 0 | 0.0% |
| 5 to 9 Unit Apartments | 32 | 4.1% |
| 10 or more Apartments | 380 | 48.5% |
| Mobile Home / Other | 0 | 0.0% |
| Total | 784 | 100.0% |
Housing Structures by Occupancy in Navarre Beach
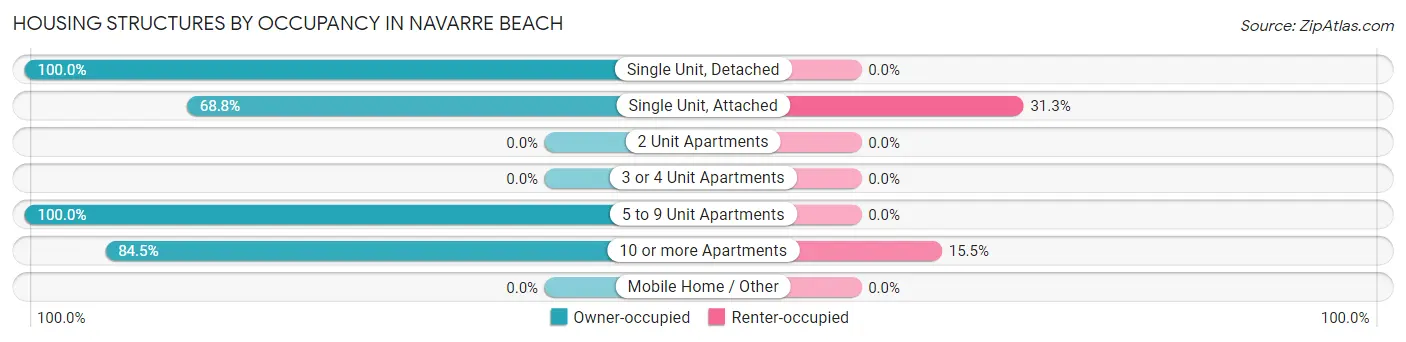
| Structure Type | Owner-occupied | Renter-occupied |
| Single Unit, Detached | 260 (100.0%) | 0 (0.0%) |
| Single Unit, Attached | 77 (68.8%) | 35 (31.2%) |
| 2 Unit Apartments | 0 (0.0%) | 0 (0.0%) |
| 3 or 4 Unit Apartments | 0 (0.0%) | 0 (0.0%) |
| 5 to 9 Unit Apartments | 32 (100.0%) | 0 (0.0%) |
| 10 or more Apartments | 321 (84.5%) | 59 (15.5%) |
| Mobile Home / Other | 0 (0.0%) | 0 (0.0%) |
| Total | 690 (88.0%) | 94 (12.0%) |
Housing Structures by Number of Rooms in Navarre Beach
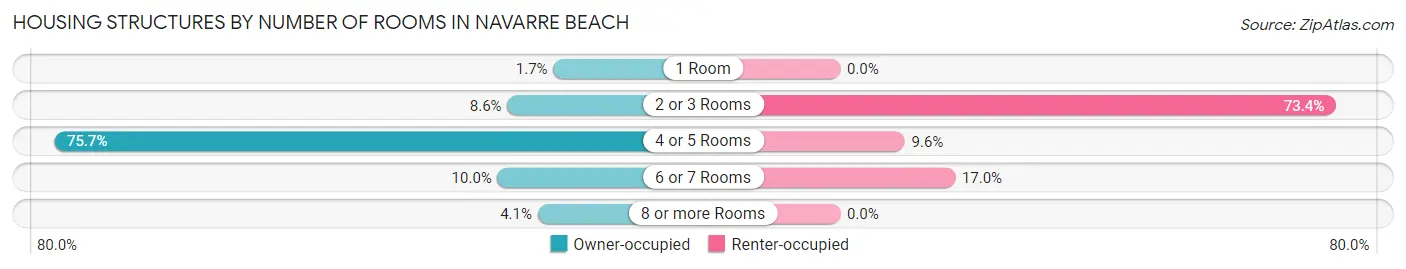
| Number of Rooms | Owner-occupied | Renter-occupied |
| 1 Room | 12 (1.7%) | 0 (0.0%) |
| 2 or 3 Rooms | 59 (8.6%) | 69 (73.4%) |
| 4 or 5 Rooms | 522 (75.6%) | 9 (9.6%) |
| 6 or 7 Rooms | 69 (10.0%) | 16 (17.0%) |
| 8 or more Rooms | 28 (4.1%) | 0 (0.0%) |
| Total | 690 (100.0%) | 94 (100.0%) |
Housing Structure by Heating Type in Navarre Beach
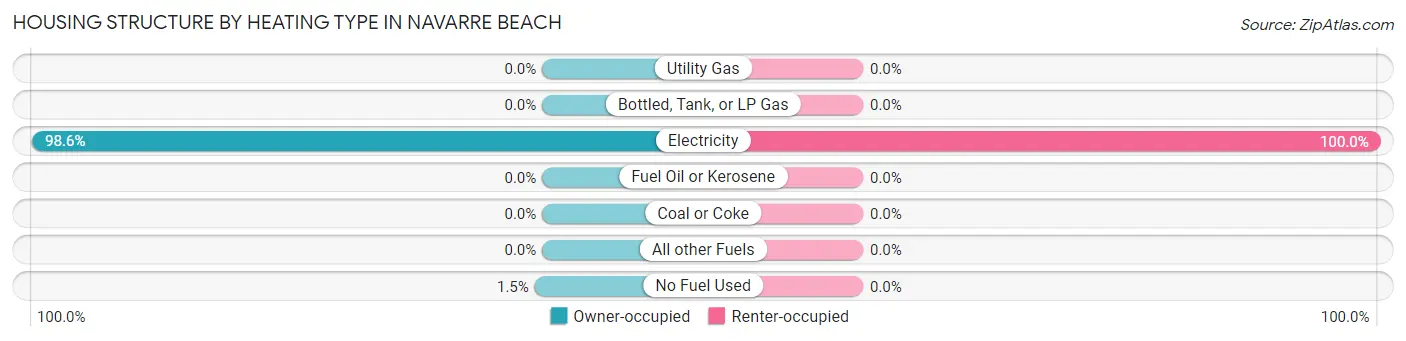
| Heating Type | Owner-occupied | Renter-occupied |
| Utility Gas | 0 (0.0%) | 0 (0.0%) |
| Bottled, Tank, or LP Gas | 0 (0.0%) | 0 (0.0%) |
| Electricity | 680 (98.6%) | 94 (100.0%) |
| Fuel Oil or Kerosene | 0 (0.0%) | 0 (0.0%) |
| Coal or Coke | 0 (0.0%) | 0 (0.0%) |
| All other Fuels | 0 (0.0%) | 0 (0.0%) |
| No Fuel Used | 10 (1.5%) | 0 (0.0%) |
| Total | 690 (100.0%) | 94 (100.0%) |
Household Vehicle Usage in Navarre Beach
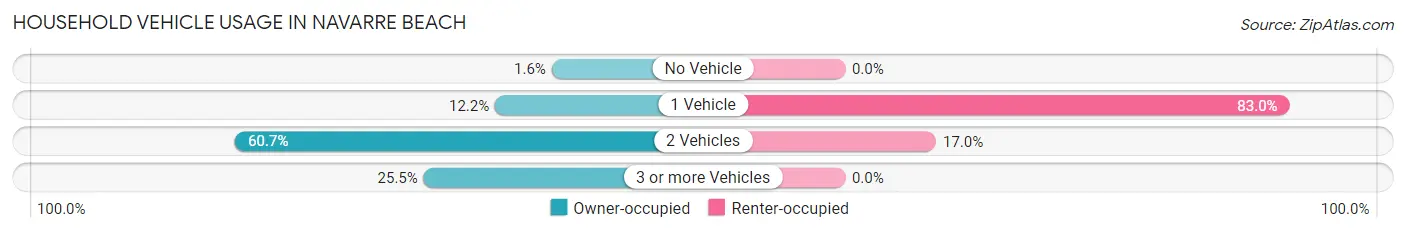
| Vehicles per Household | Owner-occupied | Renter-occupied |
| No Vehicle | 11 (1.6%) | 0 (0.0%) |
| 1 Vehicle | 84 (12.2%) | 78 (83.0%) |
| 2 Vehicles | 419 (60.7%) | 16 (17.0%) |
| 3 or more Vehicles | 176 (25.5%) | 0 (0.0%) |
| Total | 690 (100.0%) | 94 (100.0%) |
Real Estate & Mortgages in Navarre Beach
Real Estate and Mortgage Overview in Navarre Beach
| Characteristic | Without Mortgage | With Mortgage |
| Housing Units | 268 | 422 |
| Median Property Value | $604,700 | $610,100 |
| Median Household Income | - | - |
| Monthly Housing Costs | $1,208 | $216 |
| Real Estate Taxes | $3,279 | $21 |
Property Value by Mortgage Status in Navarre Beach
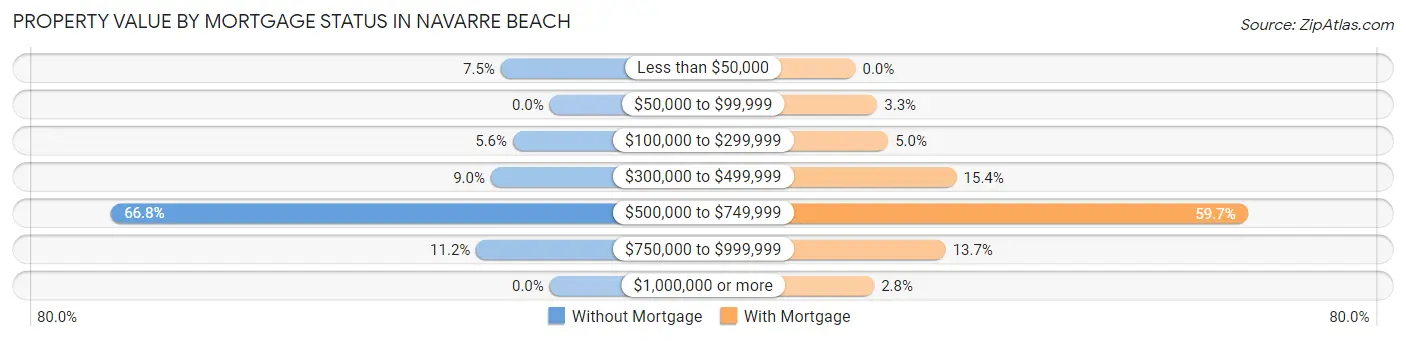
| Property Value | Without Mortgage | With Mortgage |
| Less than $50,000 | 20 (7.5%) | 0 (0.0%) |
| $50,000 to $99,999 | 0 (0.0%) | 14 (3.3%) |
| $100,000 to $299,999 | 15 (5.6%) | 21 (5.0%) |
| $300,000 to $499,999 | 24 (9.0%) | 65 (15.4%) |
| $500,000 to $749,999 | 179 (66.8%) | 252 (59.7%) |
| $750,000 to $999,999 | 30 (11.2%) | 58 (13.7%) |
| $1,000,000 or more | 0 (0.0%) | 12 (2.8%) |
| Total | 268 (100.0%) | 422 (100.0%) |
Household Income by Mortgage Status in Navarre Beach
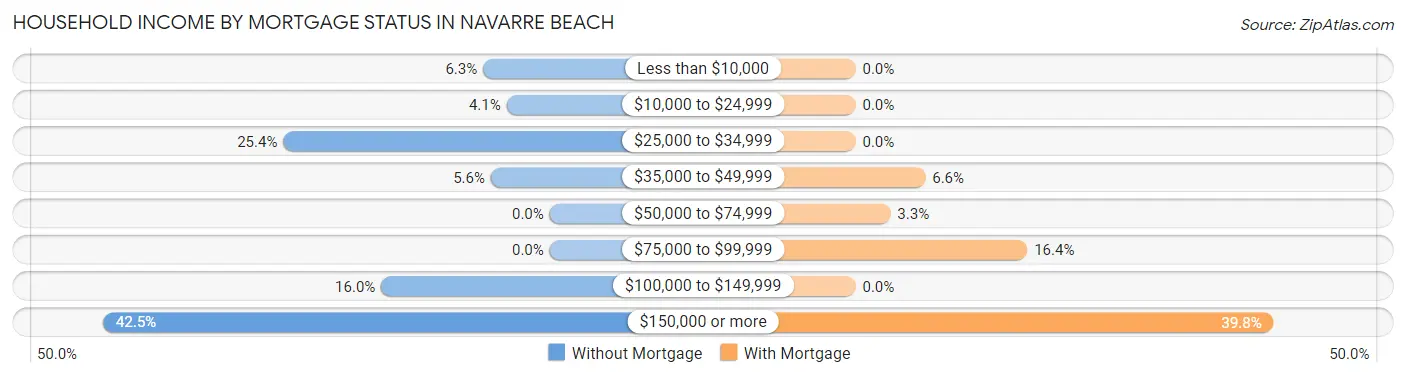
| Household Income | Without Mortgage | With Mortgage |
| Less than $10,000 | 17 (6.3%) | 0 (0.0%) |
| $10,000 to $24,999 | 11 (4.1%) | 0 (0.0%) |
| $25,000 to $34,999 | 68 (25.4%) | 0 (0.0%) |
| $35,000 to $49,999 | 15 (5.6%) | 28 (6.6%) |
| $50,000 to $74,999 | 0 (0.0%) | 14 (3.3%) |
| $75,000 to $99,999 | 0 (0.0%) | 69 (16.4%) |
| $100,000 to $149,999 | 43 (16.0%) | 0 (0.0%) |
| $150,000 or more | 114 (42.5%) | 168 (39.8%) |
| Total | 268 (100.0%) | 422 (100.0%) |
Property Value to Household Income Ratio in Navarre Beach
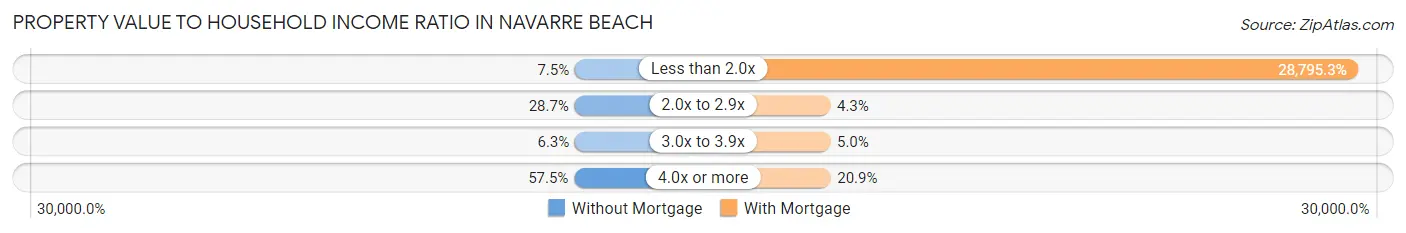
| Value-to-Income Ratio | Without Mortgage | With Mortgage |
| Less than 2.0x | 20 (7.5%) | 121,516 (28,795.3%) |
| 2.0x to 2.9x | 77 (28.7%) | 18 (4.3%) |
| 3.0x to 3.9x | 17 (6.3%) | 21 (5.0%) |
| 4.0x or more | 154 (57.5%) | 88 (20.8%) |
| Total | 268 (100.0%) | 422 (100.0%) |
Real Estate Taxes by Mortgage Status in Navarre Beach
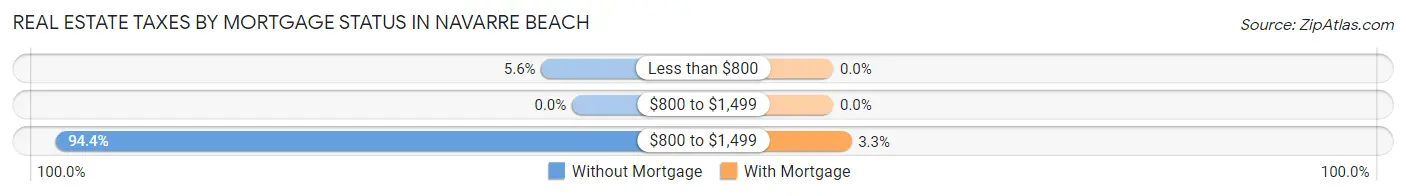
| Property Taxes | Without Mortgage | With Mortgage |
| Less than $800 | 15 (5.6%) | 0 (0.0%) |
| $800 to $1,499 | 0 (0.0%) | 0 (0.0%) |
| $800 to $1,499 | 253 (94.4%) | 14 (3.3%) |
| Total | 268 (100.0%) | 422 (100.0%) |
Health & Disability in Navarre Beach
Health Insurance Coverage by Age in Navarre Beach
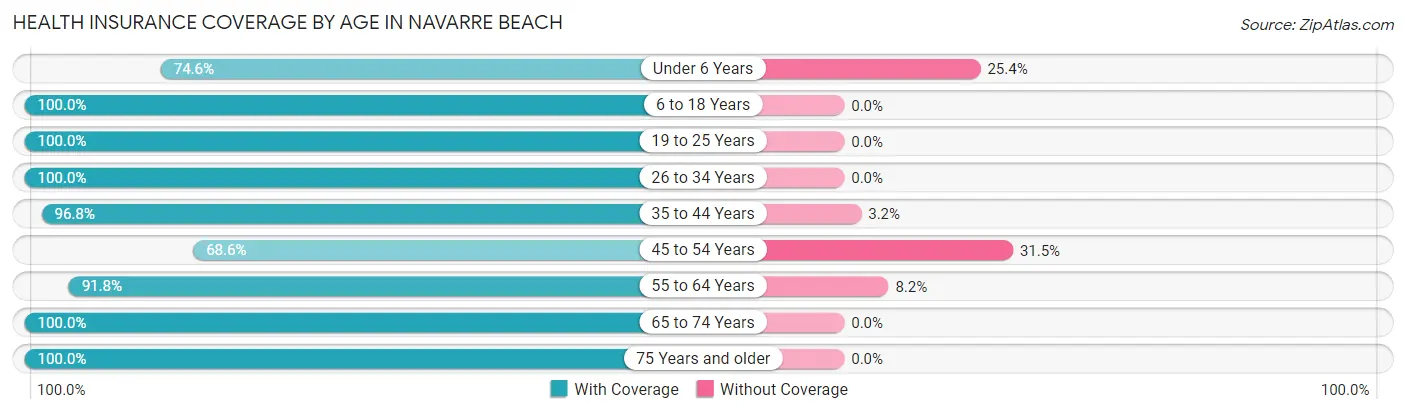
| Age Bracket | With Coverage | Without Coverage |
| Under 6 Years | 47 (74.6%) | 16 (25.4%) |
| 6 to 18 Years | 50 (100.0%) | 0 (0.0%) |
| 19 to 25 Years | 105 (100.0%) | 0 (0.0%) |
| 26 to 34 Years | 76 (100.0%) | 0 (0.0%) |
| 35 to 44 Years | 366 (96.8%) | 12 (3.2%) |
| 45 to 54 Years | 85 (68.5%) | 39 (31.5%) |
| 55 to 64 Years | 390 (91.8%) | 35 (8.2%) |
| 65 to 74 Years | 313 (100.0%) | 0 (0.0%) |
| 75 Years and older | 60 (100.0%) | 0 (0.0%) |
| Total | 1,492 (93.6%) | 102 (6.4%) |
Health Insurance Coverage by Citizenship Status in Navarre Beach
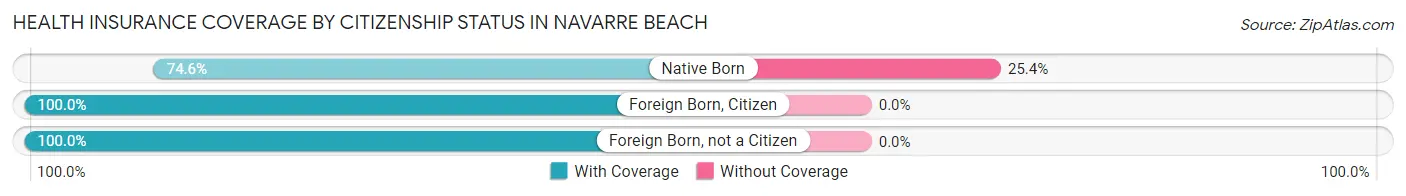
| Citizenship Status | With Coverage | Without Coverage |
| Native Born | 47 (74.6%) | 16 (25.4%) |
| Foreign Born, Citizen | 50 (100.0%) | 0 (0.0%) |
| Foreign Born, not a Citizen | 105 (100.0%) | 0 (0.0%) |
Health Insurance Coverage by Household Income in Navarre Beach
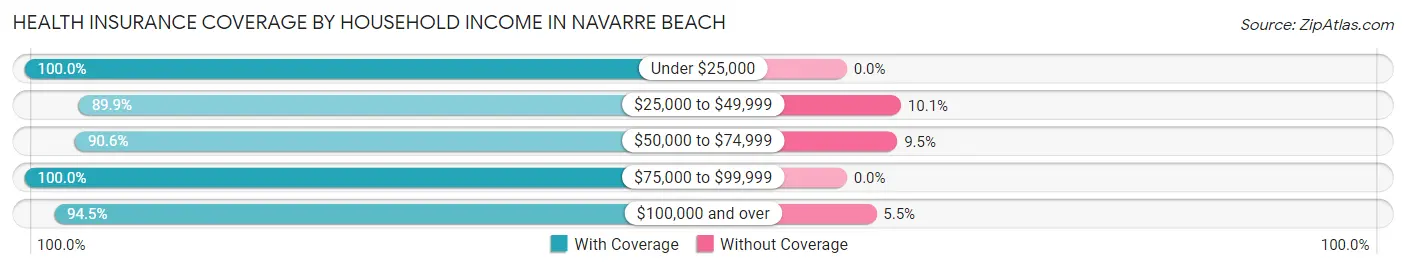
| Household Income | With Coverage | Without Coverage |
| Under $25,000 | 28 (100.0%) | 0 (0.0%) |
| $25,000 to $49,999 | 248 (89.9%) | 28 (10.1%) |
| $50,000 to $74,999 | 115 (90.5%) | 12 (9.5%) |
| $75,000 to $99,999 | 42 (100.0%) | 0 (0.0%) |
| $100,000 and over | 1,059 (94.5%) | 62 (5.5%) |
Public vs Private Health Insurance Coverage by Age in Navarre Beach
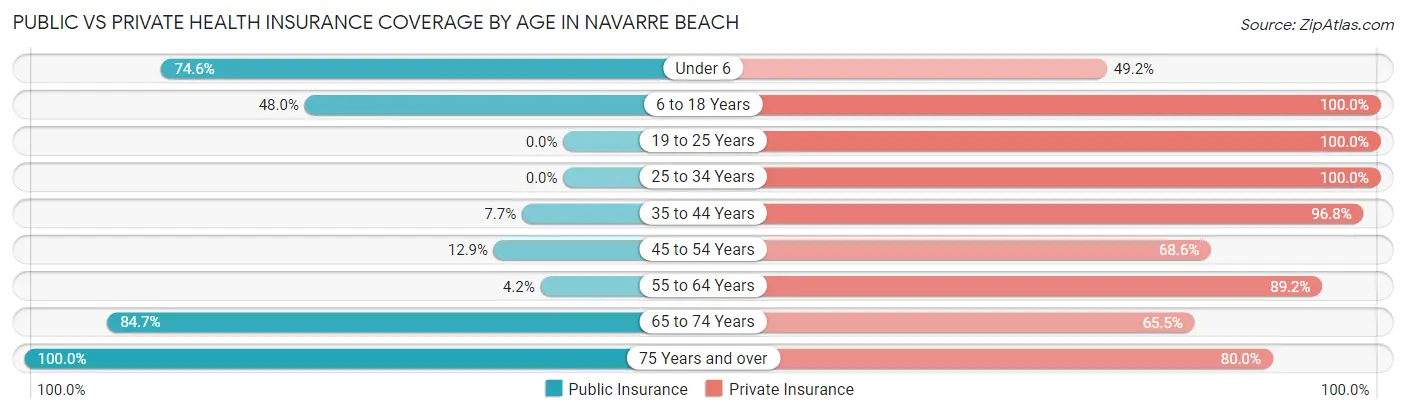
| Age Bracket | Public Insurance | Private Insurance |
| Under 6 | 47 (74.6%) | 31 (49.2%) |
| 6 to 18 Years | 24 (48.0%) | 50 (100.0%) |
| 19 to 25 Years | 0 (0.0%) | 105 (100.0%) |
| 25 to 34 Years | 0 (0.0%) | 76 (100.0%) |
| 35 to 44 Years | 29 (7.7%) | 366 (96.8%) |
| 45 to 54 Years | 16 (12.9%) | 85 (68.5%) |
| 55 to 64 Years | 18 (4.2%) | 379 (89.2%) |
| 65 to 74 Years | 265 (84.7%) | 205 (65.5%) |
| 75 Years and over | 60 (100.0%) | 48 (80.0%) |
| Total | 459 (28.8%) | 1,345 (84.4%) |
Disability Status by Sex by Age in Navarre Beach
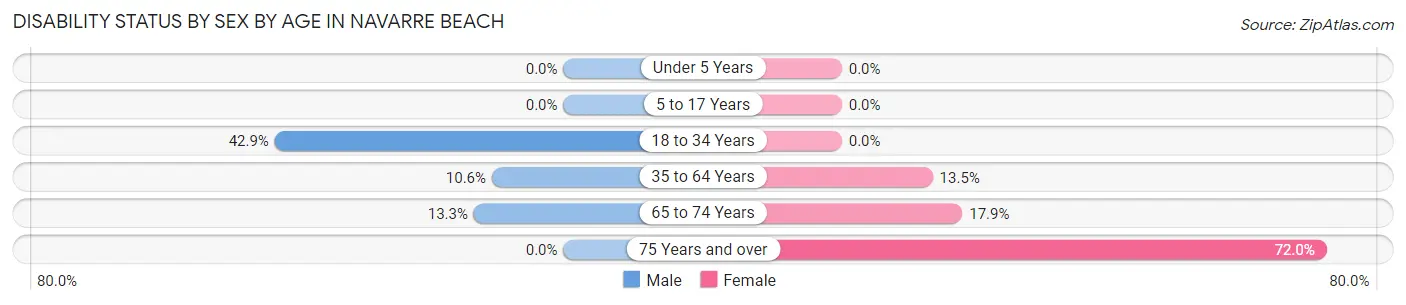
| Age Bracket | Male | Female |
| Under 5 Years | 0 (0.0%) | 0 (0.0%) |
| 5 to 17 Years | 0 (0.0%) | 0 (0.0%) |
| 18 to 34 Years | 24 (42.9%) | 0 (0.0%) |
| 35 to 64 Years | 41 (10.6%) | 73 (13.5%) |
| 65 to 74 Years | 29 (13.3%) | 17 (17.9%) |
| 75 Years and over | 0 (0.0%) | 18 (72.0%) |
Disability Class by Sex by Age in Navarre Beach
Disability Class: Hearing Difficulty
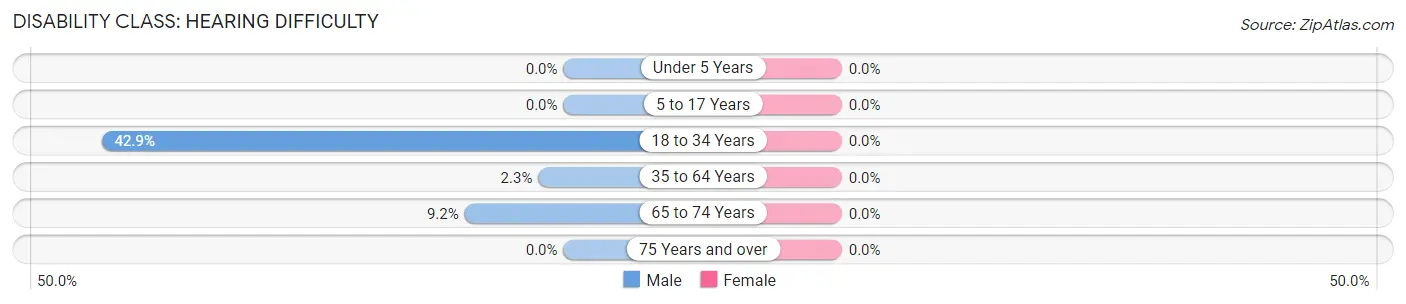
| Age Bracket | Male | Female |
| Under 5 Years | 0 (0.0%) | 0 (0.0%) |
| 5 to 17 Years | 0 (0.0%) | 0 (0.0%) |
| 18 to 34 Years | 24 (42.9%) | 0 (0.0%) |
| 35 to 64 Years | 9 (2.3%) | 0 (0.0%) |
| 65 to 74 Years | 20 (9.2%) | 0 (0.0%) |
| 75 Years and over | 0 (0.0%) | 0 (0.0%) |
Disability Class: Vision Difficulty
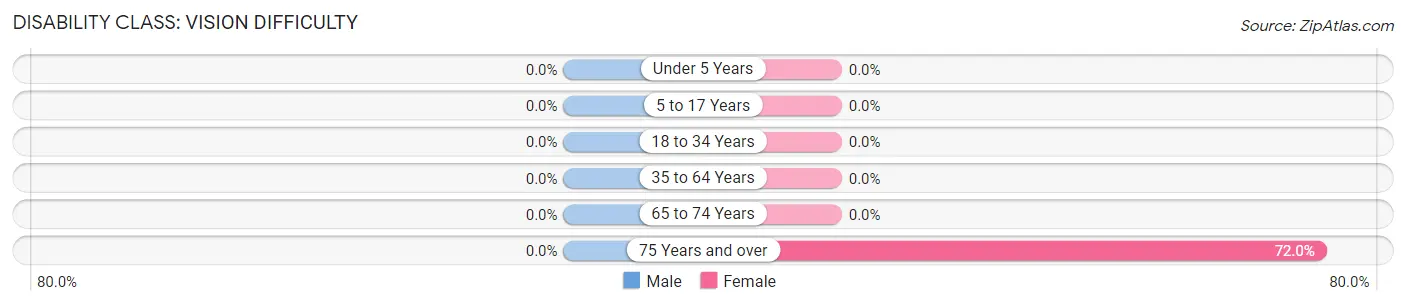
| Age Bracket | Male | Female |
| Under 5 Years | 0 (0.0%) | 0 (0.0%) |
| 5 to 17 Years | 0 (0.0%) | 0 (0.0%) |
| 18 to 34 Years | 0 (0.0%) | 0 (0.0%) |
| 35 to 64 Years | 0 (0.0%) | 0 (0.0%) |
| 65 to 74 Years | 0 (0.0%) | 0 (0.0%) |
| 75 Years and over | 0 (0.0%) | 18 (72.0%) |
Disability Class: Cognitive Difficulty
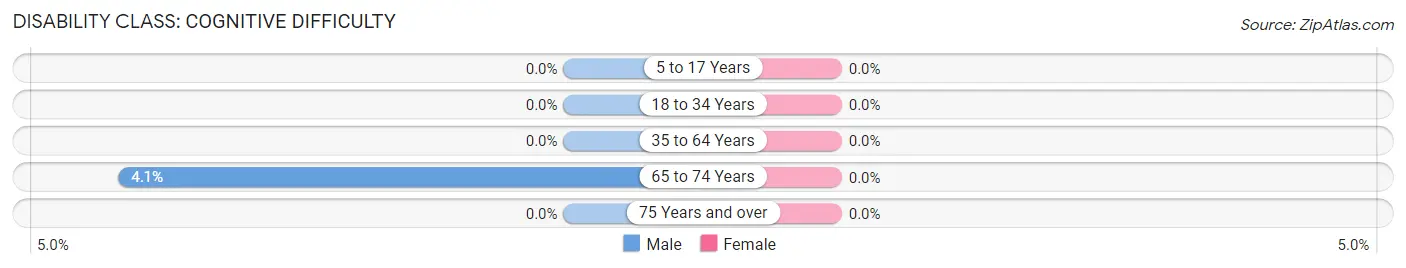
| Age Bracket | Male | Female |
| 5 to 17 Years | 0 (0.0%) | 0 (0.0%) |
| 18 to 34 Years | 0 (0.0%) | 0 (0.0%) |
| 35 to 64 Years | 0 (0.0%) | 0 (0.0%) |
| 65 to 74 Years | 9 (4.1%) | 0 (0.0%) |
| 75 Years and over | 0 (0.0%) | 0 (0.0%) |
Disability Class: Ambulatory Difficulty
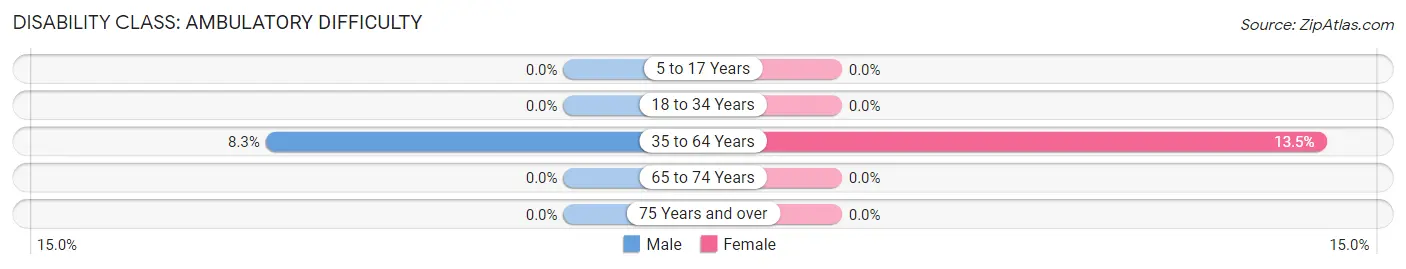
| Age Bracket | Male | Female |
| 5 to 17 Years | 0 (0.0%) | 0 (0.0%) |
| 18 to 34 Years | 0 (0.0%) | 0 (0.0%) |
| 35 to 64 Years | 32 (8.3%) | 73 (13.5%) |
| 65 to 74 Years | 0 (0.0%) | 0 (0.0%) |
| 75 Years and over | 0 (0.0%) | 0 (0.0%) |
Disability Class: Self-Care Difficulty
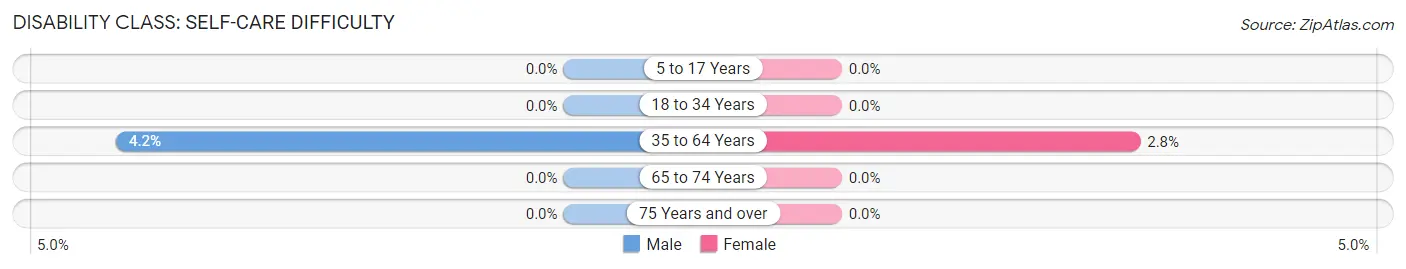
| Age Bracket | Male | Female |
| 5 to 17 Years | 0 (0.0%) | 0 (0.0%) |
| 18 to 34 Years | 0 (0.0%) | 0 (0.0%) |
| 35 to 64 Years | 16 (4.2%) | 15 (2.8%) |
| 65 to 74 Years | 0 (0.0%) | 0 (0.0%) |
| 75 Years and over | 0 (0.0%) | 0 (0.0%) |
Technology Access in Navarre Beach
Computing Device Access in Navarre Beach
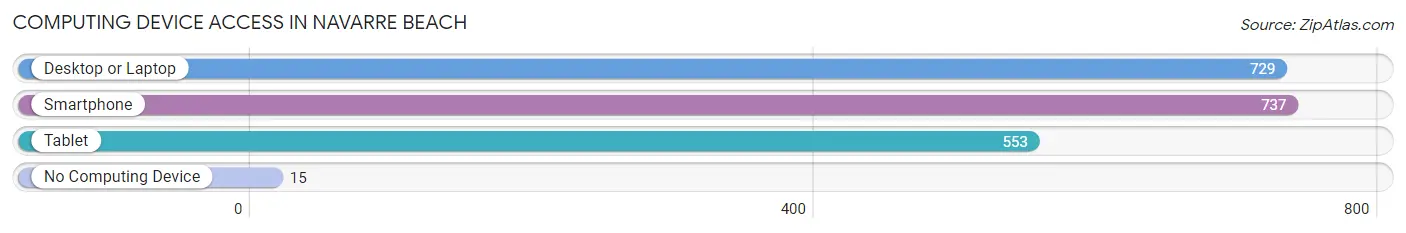
| Device Type | # Households | % Households |
| Desktop or Laptop | 729 | 93.0% |
| Smartphone | 737 | 94.0% |
| Tablet | 553 | 70.5% |
| No Computing Device | 15 | 1.9% |
| Total | 784 | 100.0% |
Internet Access in Navarre Beach
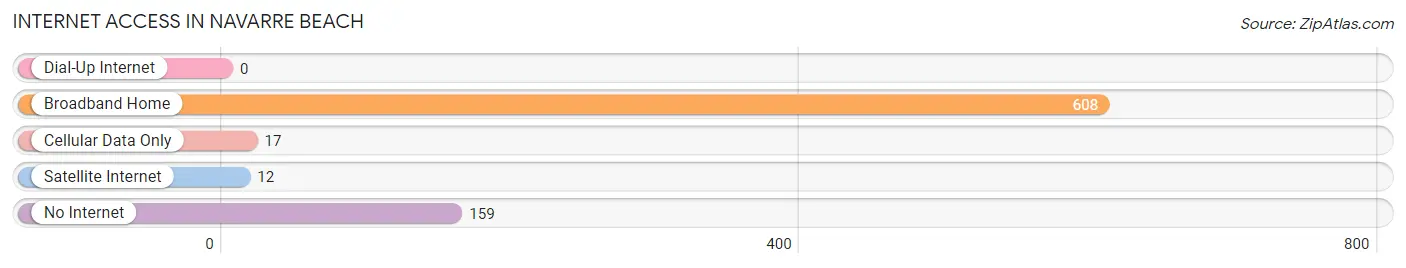
| Internet Type | # Households | % Households |
| Dial-Up Internet | 0 | 0.0% |
| Broadband Home | 608 | 77.5% |
| Cellular Data Only | 17 | 2.2% |
| Satellite Internet | 12 | 1.5% |
| No Internet | 159 | 20.3% |
| Total | 784 | 100.0% |
Navarre Beach Summary
Navarre Beach is a small barrier island located in the Florida Panhandle, just east of Pensacola. It is part of Santa Rosa County and is bordered by the Gulf of Mexico to the south and the Santa Rosa Sound to the north. The island is approximately seven miles long and one mile wide, and is connected to the mainland by a bridge.
History
Navarre Beach has a long and varied history. The island was first inhabited by Native Americans, who used it as a fishing and hunting ground. In the early 1800s, the island was used as a base for the US Navy during the War of 1812. In the late 1800s, the island was used as a quarantine station for immigrants coming to the United States.
In the early 1900s, the island was developed as a resort destination. The first hotel was built in 1912, and the island quickly became a popular destination for tourists. In the 1950s, the island was developed further, with the construction of a bridge connecting it to the mainland.
Geography
Navarre Beach is located in the Florida Panhandle, just east of Pensacola. It is part of Santa Rosa County and is bordered by the Gulf of Mexico to the south and the Santa Rosa Sound to the north. The island is approximately seven miles long and one mile wide, and is connected to the mainland by a bridge.
The island is composed of white sand beaches, dunes, and wetlands. The beaches are popular for swimming, sunbathing, and fishing. The wetlands are home to a variety of wildlife, including birds, turtles, and dolphins.
Economy
Navarre Beach is a popular tourist destination, and the economy is largely based on tourism. The island is home to several hotels, restaurants, and shops, as well as a variety of recreational activities. The island is also home to a number of charter fishing boats, which offer deep-sea fishing trips.
Demographics
As of the 2010 census, the population of Navarre Beach was 2,419. The population is largely composed of retirees and seasonal visitors. The median age is 47.7, and the median household income is $50,945. The majority of the population is white (93.3%), followed by Hispanic (3.2%), African American (2.2%), and Asian (1.3%).
Navarre Beach is a popular tourist destination, and the population increases significantly during the summer months. The island is also home to a number of military personnel, as it is located near several military bases.
Common Questions
What is the Total Population of Navarre Beach?
Total Population of Navarre Beach is 1,594.
What is the Total Male Population of Navarre Beach?
Total Male Population of Navarre Beach is 709.
What is the Total Female Population of Navarre Beach?
Total Female Population of Navarre Beach is 885.
What is the Ratio of Males per 100 Females in Navarre Beach?
There are 80.11 Males per 100 Females in Navarre Beach.
What is the Ratio of Females per 100 Males in Navarre Beach?
There are 124.82 Females per 100 Males in Navarre Beach.
What is the Median Population Age in Navarre Beach?
Median Population Age in Navarre Beach is 55.1 Years.
What is the Average Family Size in Navarre Beach
Average Family Size in Navarre Beach is 2.3 People.
What is the Average Household Size in Navarre Beach
Average Household Size in Navarre Beach is 2.0 People.
What is Per Capita Income in Navarre Beach?
Per Capita income in Navarre Beach is $57,196.
What is the Median Family Income in Navarre Beach?
Median Family Income in Navarre Beach is $130,550.
What is the Median Household income in Navarre Beach?
Median Household Income in Navarre Beach is $121,266.
What is Inequality or Gini Index in Navarre Beach?
Inequality or Gini Index in Navarre Beach is 0.33.
How Large is the Labor Force in Navarre Beach?
There are 918 People in the Labor Forcein in Navarre Beach.
What is the Percentage of People in the Labor Force in Navarre Beach?
61.7% of People are in the Labor Force in Navarre Beach.
What is the Unemployment Rate in Navarre Beach?
Unemployment Rate in Navarre Beach is 4.6%.