Mount Plymouth, FL
Mount Plymouth Map
Mount Plymouth Overview
4,798
TOTAL POPULATION
2,484
MALE POPULATION
2,314
FEMALE POPULATION
107.35
MALES / 100 FEMALES
93.16
FEMALES / 100 MALES
37.3
MEDIAN AGE
2.9
AVG FAMILY SIZE
2.7
AVG HOUSEHOLD SIZE
$35,554
PER CAPITA INCOME
$86,413
AVG FAMILY INCOME
$83,633
AVG HOUSEHOLD INCOME
30.8%
WAGE / INCOME GAP [ % ]
69.2¢/ $1
WAGE / INCOME GAP [ $ ]
0.36
INEQUALITY / GINI INDEX
2,823
LABOR FORCE [ PEOPLE ]
70.9%
PERCENT IN LABOR FORCE
2.4%
UNEMPLOYMENT RATE
Mount Plymouth Area Codes
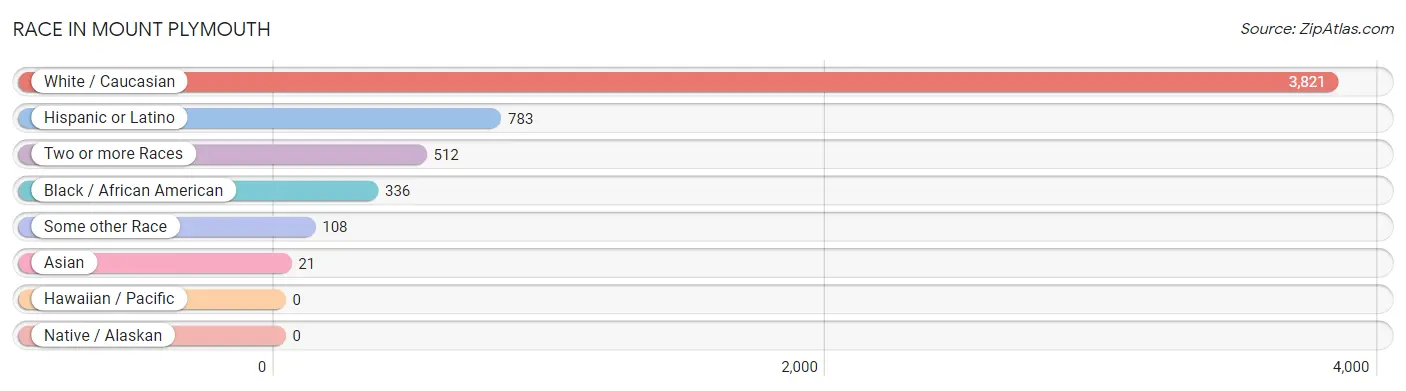
Race in Mount Plymouth
The most populous races in Mount Plymouth are White / Caucasian (3,821 | 79.6%), Hispanic or Latino (783 | 16.3%), and Two or more Races (512 | 10.7%).
| Race | # Population | % Population |
| Asian | 21 | 0.4% |
| Black / African American | 336 | 7.0% |
| Hawaiian / Pacific | 0 | 0.0% |
| Hispanic or Latino | 783 | 16.3% |
| Native / Alaskan | 0 | 0.0% |
| White / Caucasian | 3,821 | 79.6% |
| Two or more Races | 512 | 10.7% |
| Some other Race | 108 | 2.2% |
| Total | 4,798 | 100.0% |
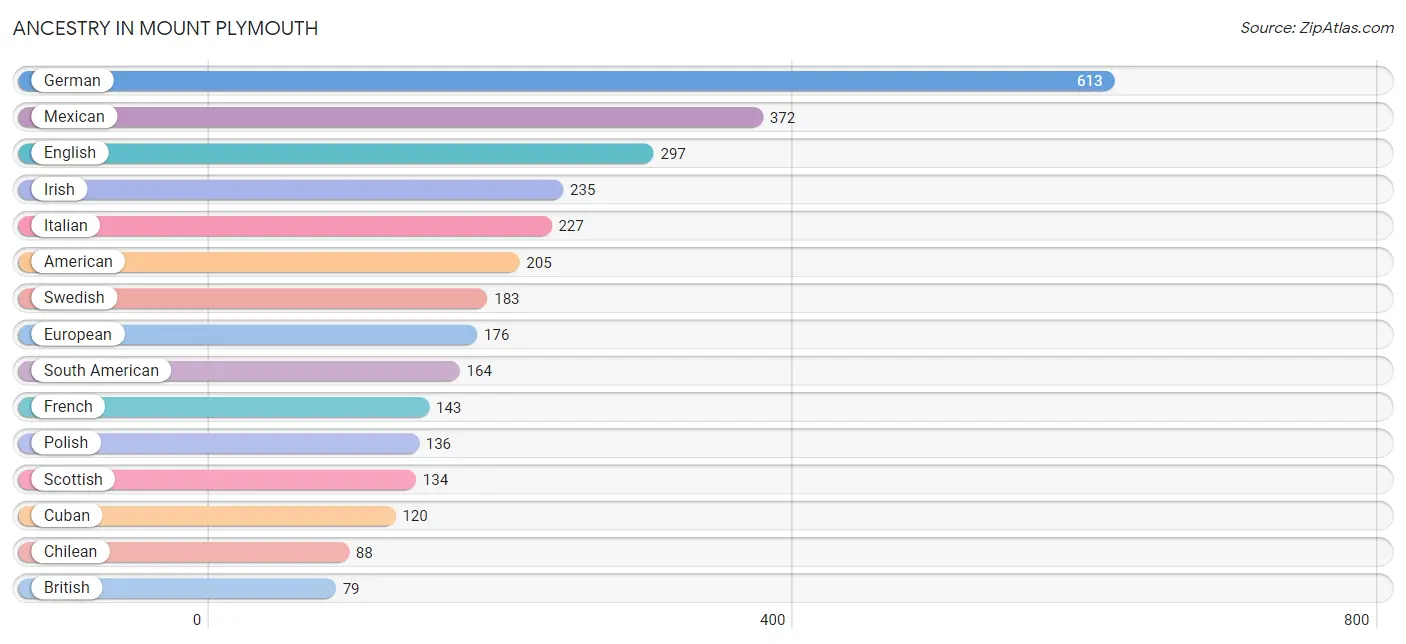
Ancestry in Mount Plymouth
The most populous ancestries reported in Mount Plymouth are German (613 | 12.8%), Mexican (372 | 7.7%), English (297 | 6.2%), Irish (235 | 4.9%), and Italian (227 | 4.7%), together accounting for 36.3% of all Mount Plymouth residents.
| Ancestry | # Population | % Population |
| American | 205 | 4.3% |
| Argentinean | 76 | 1.6% |
| Bhutanese | 57 | 1.2% |
| British | 79 | 1.7% |
| Central American | 19 | 0.4% |
| Chilean | 88 | 1.8% |
| Cuban | 120 | 2.5% |
| Dutch | 36 | 0.7% |
| English | 297 | 6.2% |
| European | 176 | 3.7% |
| French | 143 | 3.0% |
| French Canadian | 4 | 0.1% |
| German | 613 | 12.8% |
| Greek | 32 | 0.7% |
| Honduran | 19 | 0.4% |
| Hungarian | 43 | 0.9% |
| Irish | 235 | 4.9% |
| Italian | 227 | 4.7% |
| Korean | 18 | 0.4% |
| Mexican | 372 | 7.7% |
| Pakistani | 12 | 0.3% |
| Polish | 136 | 2.8% |
| Puerto Rican | 75 | 1.6% |
| Scotch-Irish | 55 | 1.1% |
| Scottish | 134 | 2.8% |
| Slovak | 6 | 0.1% |
| South American | 164 | 3.4% |
| Swedish | 183 | 3.8% |
| Swiss | 11 | 0.2% | View All 29 Rows |
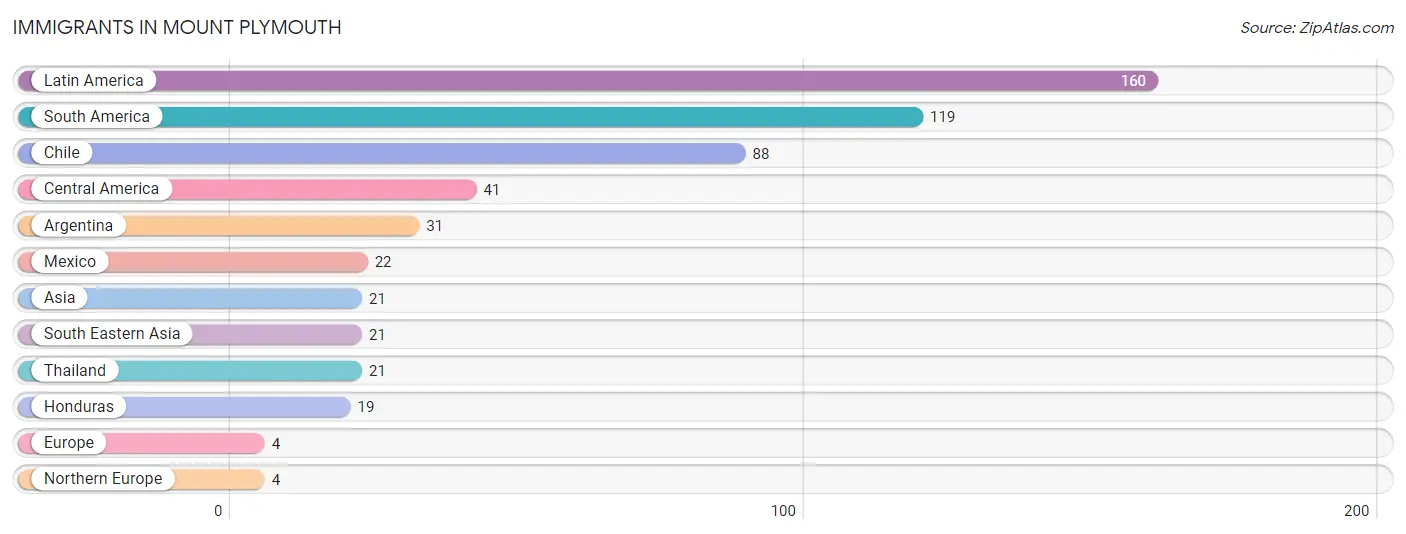
Immigrants in Mount Plymouth
The most numerous immigrant groups reported in Mount Plymouth came from Latin America (160 | 3.3%), South America (119 | 2.5%), Chile (88 | 1.8%), Central America (41 | 0.9%), and Argentina (31 | 0.6%), together accounting for 9.1% of all Mount Plymouth residents.
| Immigration Origin | # Population | % Population |
| Argentina | 31 | 0.6% |
| Asia | 21 | 0.4% |
| Central America | 41 | 0.9% |
| Chile | 88 | 1.8% |
| Europe | 4 | 0.1% |
| Honduras | 19 | 0.4% |
| Latin America | 160 | 3.3% |
| Mexico | 22 | 0.5% |
| Northern Europe | 4 | 0.1% |
| South America | 119 | 2.5% |
| South Eastern Asia | 21 | 0.4% |
| Thailand | 21 | 0.4% | View All 12 Rows |
Sex and Age in Mount Plymouth
Sex and Age in Mount Plymouth
The most populous age groups in Mount Plymouth are 30 to 34 Years (349 | 14.1%) for men and 25 to 29 Years (299 | 12.9%) for women.
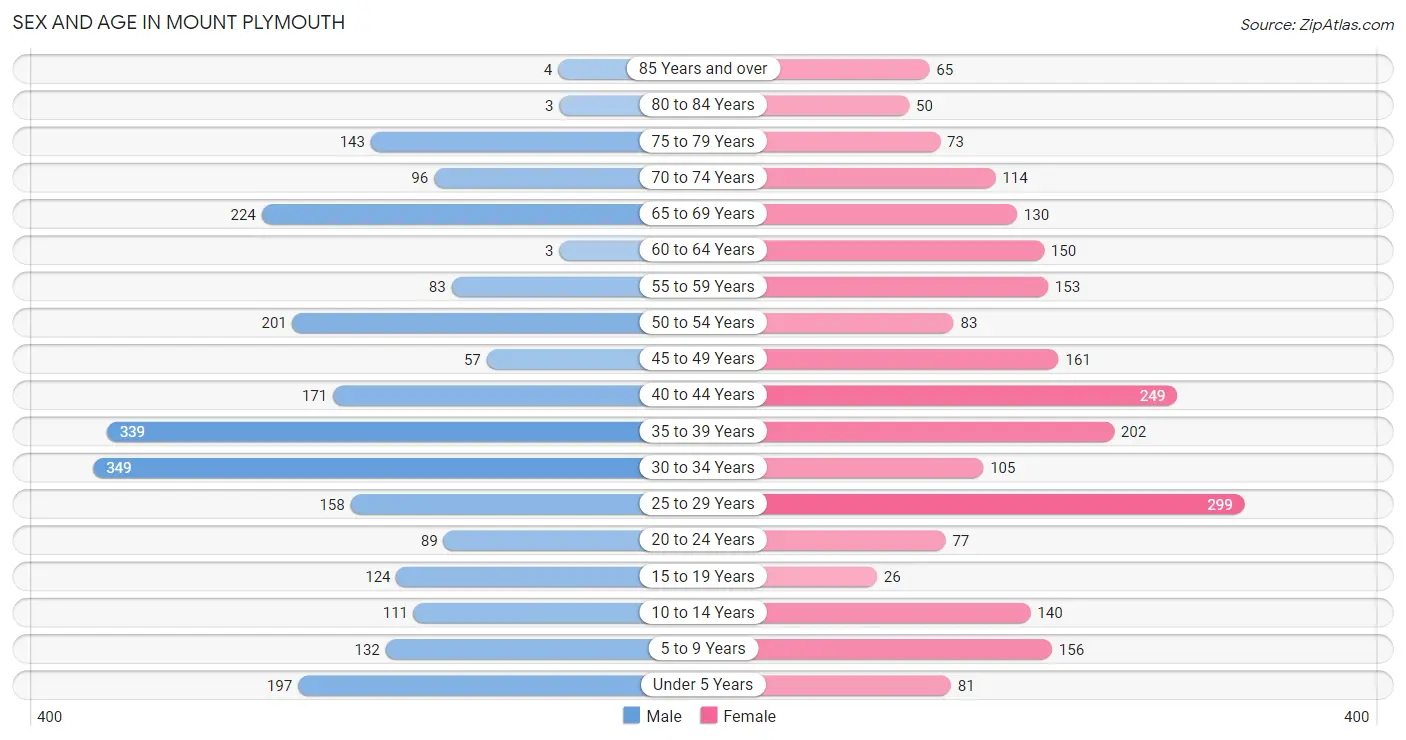
| Age Bracket | Male | Female |
| Under 5 Years | 197 (7.9%) | 81 (3.5%) |
| 5 to 9 Years | 132 (5.3%) | 156 (6.7%) |
| 10 to 14 Years | 111 (4.5%) | 140 (6.0%) |
| 15 to 19 Years | 124 (5.0%) | 26 (1.1%) |
| 20 to 24 Years | 89 (3.6%) | 77 (3.3%) |
| 25 to 29 Years | 158 (6.4%) | 299 (12.9%) |
| 30 to 34 Years | 349 (14.1%) | 105 (4.5%) |
| 35 to 39 Years | 339 (13.7%) | 202 (8.7%) |
| 40 to 44 Years | 171 (6.9%) | 249 (10.8%) |
| 45 to 49 Years | 57 (2.3%) | 161 (7.0%) |
| 50 to 54 Years | 201 (8.1%) | 83 (3.6%) |
| 55 to 59 Years | 83 (3.3%) | 153 (6.6%) |
| 60 to 64 Years | 3 (0.1%) | 150 (6.5%) |
| 65 to 69 Years | 224 (9.0%) | 130 (5.6%) |
| 70 to 74 Years | 96 (3.9%) | 114 (4.9%) |
| 75 to 79 Years | 143 (5.8%) | 73 (3.2%) |
| 80 to 84 Years | 3 (0.1%) | 50 (2.2%) |
| 85 Years and over | 4 (0.2%) | 65 (2.8%) |
| Total | 2,484 (100.0%) | 2,314 (100.0%) |
Families and Households in Mount Plymouth
Median Family Size in Mount Plymouth
The median family size in Mount Plymouth is 2.86 persons per family, with single female/mother families (172 | 13.0%) accounting for the largest median family size of 3.28 persons per family. On the other hand, married-couple families (993 | 74.8%) represent the smallest median family size with 2.73 persons per family.
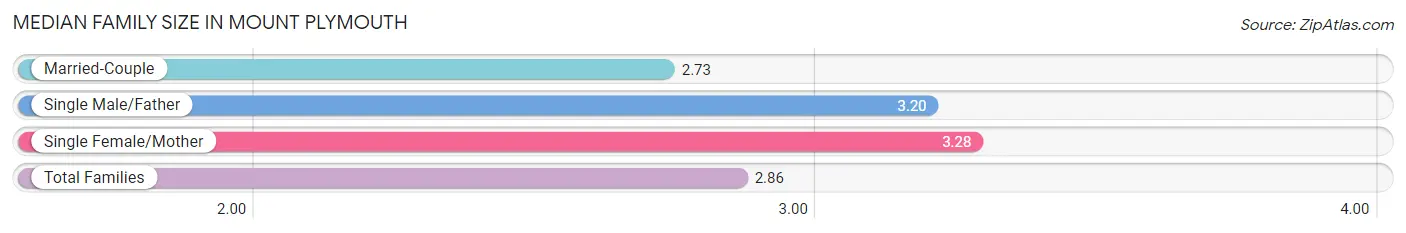
| Family Type | # Families | Family Size |
| Married-Couple | 993 (74.8%) | 2.73 |
| Single Male/Father | 163 (12.3%) | 3.20 |
| Single Female/Mother | 172 (13.0%) | 3.28 |
| Total Families | 1,328 (100.0%) | 2.86 |
Median Household Size in Mount Plymouth
The median household size in Mount Plymouth is 2.66 persons per household, with single male/father households (163 | 9.0%) accounting for the largest median household size of 4.15 persons per household. non-family households (478 | 26.5%) represent the smallest median household size with 1.42 persons per household.
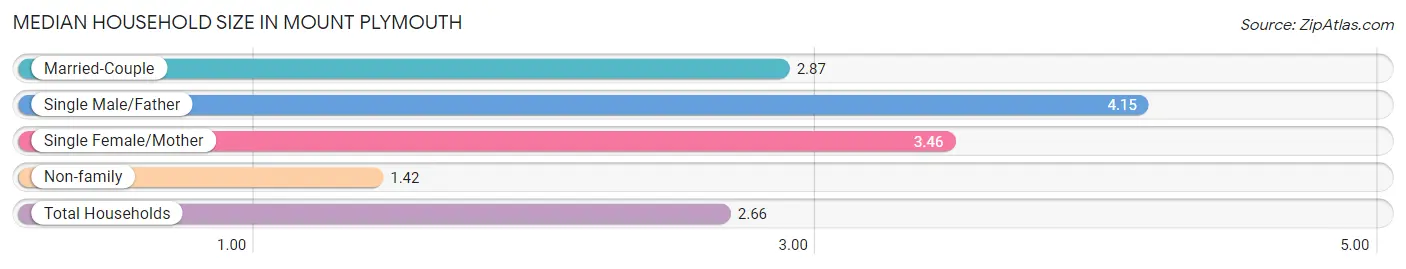
| Household Type | # Households | Household Size |
| Married-Couple | 993 (55.0%) | 2.87 |
| Single Male/Father | 163 (9.0%) | 4.15 |
| Single Female/Mother | 172 (9.5%) | 3.46 |
| Non-family | 478 (26.5%) | 1.42 |
| Total Households | 1,806 (100.0%) | 2.66 |
Household Size by Marriage Status in Mount Plymouth
Out of a total of 1,806 households in Mount Plymouth, 1,328 (73.5%) are family households, while 478 (26.5%) are nonfamily households. The most numerous type of family households are 3-person households, comprising 615, and the most common type of nonfamily households are 1-person households, comprising 280.
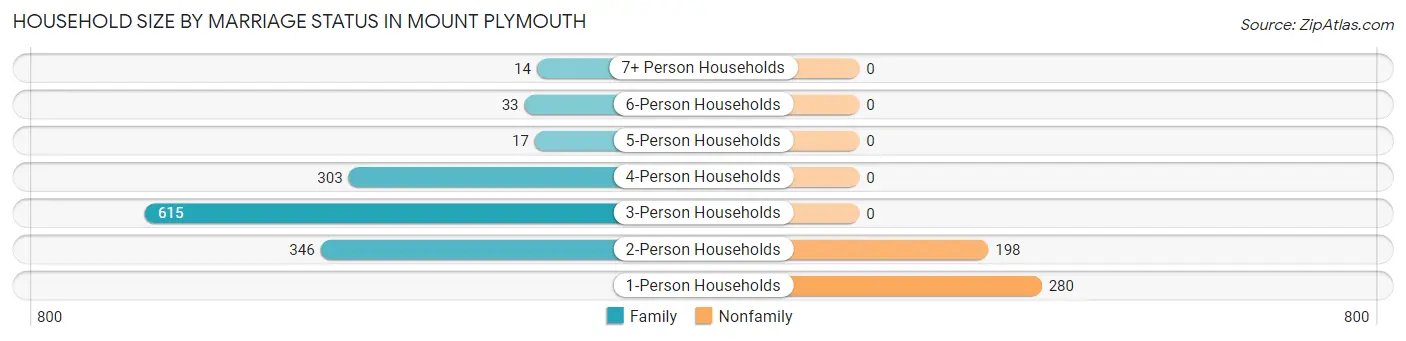
| Household Size | Family Households | Nonfamily Households |
| 1-Person Households | - | 280 (15.5%) |
| 2-Person Households | 346 (19.2%) | 198 (11.0%) |
| 3-Person Households | 615 (34.1%) | 0 (0.0%) |
| 4-Person Households | 303 (16.8%) | 0 (0.0%) |
| 5-Person Households | 17 (0.9%) | 0 (0.0%) |
| 6-Person Households | 33 (1.8%) | 0 (0.0%) |
| 7+ Person Households | 14 (0.8%) | 0 (0.0%) |
| Total | 1,328 (73.5%) | 478 (26.5%) |
Female Fertility in Mount Plymouth
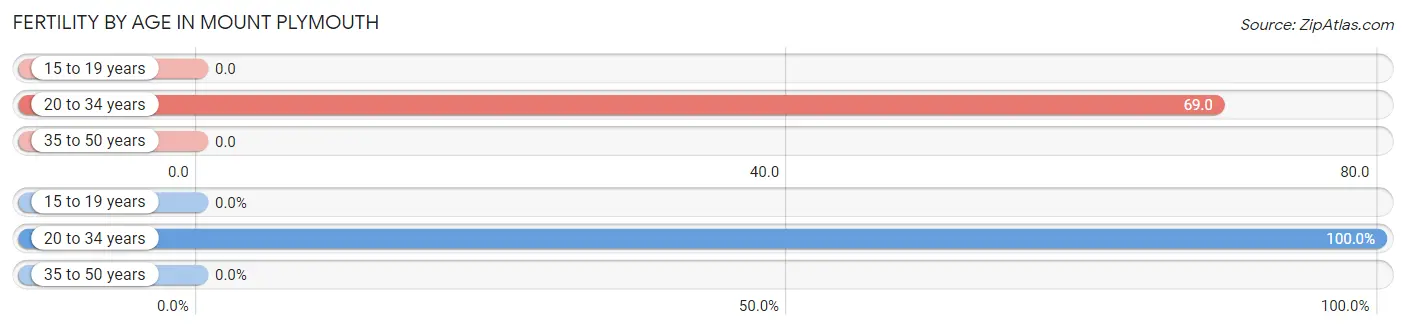
Fertility by Age in Mount Plymouth
Average fertility rate in Mount Plymouth is 29.0 births per 1,000 women. Women in the age bracket of 20 to 34 years have the highest fertility rate with 69.0 births per 1,000 women. Women in the age bracket of 20 to 34 years acount for 100.0% of all women with births.
| Age Bracket | Women with Births | Births / 1,000 Women |
| 15 to 19 years | 0 (0.0%) | 0.0 |
| 20 to 34 years | 33 (100.0%) | 69.0 |
| 35 to 50 years | 0 (0.0%) | 0.0 |
| Total | 33 (100.0%) | 29.0 |
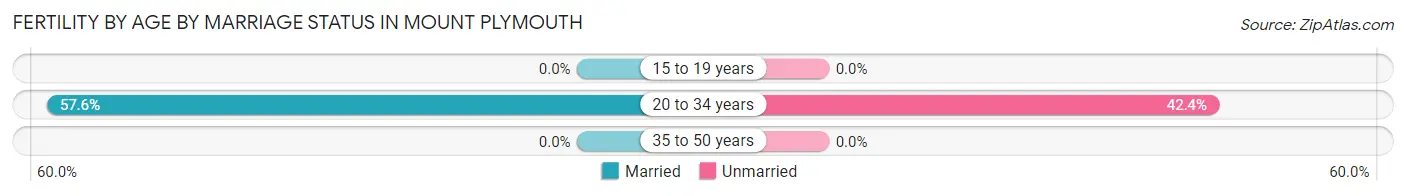
Fertility by Age by Marriage Status in Mount Plymouth
57.6% of women with births (33) in Mount Plymouth are married. The highest percentage of unmarried women with births falls into 20 to 34 years age bracket with 42.4% of them unmarried at the time of birth, while the lowest percentage of unmarried women with births belong to 20 to 34 years age bracket with 42.4% of them unmarried.
| Age Bracket | Married | Unmarried |
| 15 to 19 years | 0 (0.0%) | 0 (0.0%) |
| 20 to 34 years | 19 (57.6%) | 14 (42.4%) |
| 35 to 50 years | 0 (0.0%) | 0 (0.0%) |
| Total | 19 (57.6%) | 14 (42.4%) |
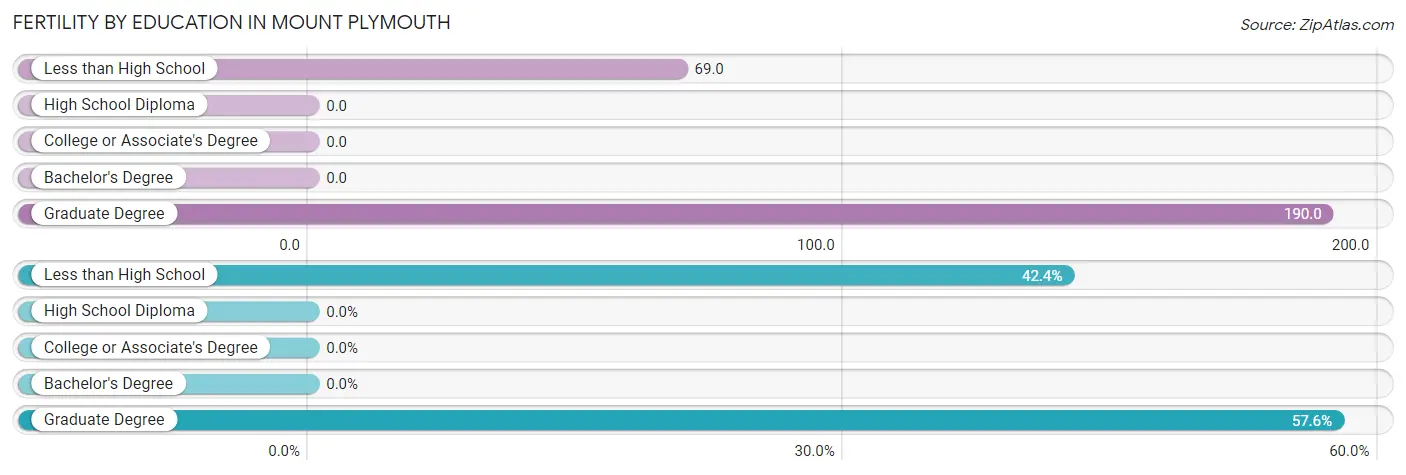
Fertility by Education in Mount Plymouth
| Educational Attainment | Women with Births | Births / 1,000 Women |
| Less than High School | 14 (42.4%) | 69.0 |
| High School Diploma | 0 (0.0%) | 0.0 |
| College or Associate's Degree | 0 (0.0%) | 0.0 |
| Bachelor's Degree | 0 (0.0%) | 0.0 |
| Graduate Degree | 19 (57.6%) | 190.0 |
| Total | 33 (100.0%) | 29.0 |
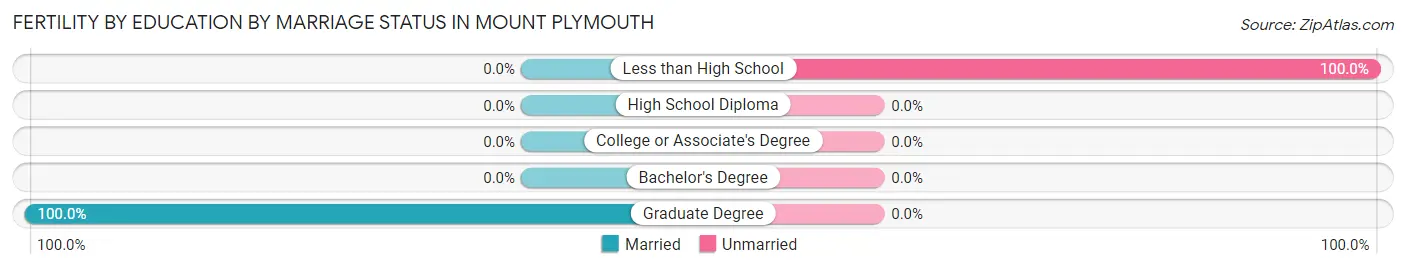
Fertility by Education by Marriage Status in Mount Plymouth
42.4% of women with births in Mount Plymouth are unmarried. Women with the educational attainment of graduate degree are most likely to be married with 100.0% of them married at childbirth, while women with the educational attainment of less than high school are least likely to be married with 100.0% of them unmarried at childbirth.
| Educational Attainment | Married | Unmarried |
| Less than High School | 0 (0.0%) | 14 (100.0%) |
| High School Diploma | 0 (0.0%) | 0 (0.0%) |
| College or Associate's Degree | 0 (0.0%) | 0 (0.0%) |
| Bachelor's Degree | 0 (0.0%) | 0 (0.0%) |
| Graduate Degree | 19 (100.0%) | 0 (0.0%) |
| Total | 19 (57.6%) | 14 (42.4%) |
Income in Mount Plymouth
Income Overview in Mount Plymouth
Per Capita Income in Mount Plymouth is $35,554, while median incomes of families and households are $86,413 and $83,633 respectively.
| Characteristic | Number | Measure |
| Per Capita Income | 4,798 | $35,554 |
| Median Family Income | 1,328 | $86,413 |
| Mean Family Income | 1,328 | $99,407 |
| Median Household Income | 1,806 | $83,633 |
| Mean Household Income | 1,806 | $95,194 |
| Income Deficit | 1,328 | $0 |
| Wage / Income Gap (%) | 4,798 | 30.77% |
| Wage / Income Gap ($) | 4,798 | 69.23¢ per $1 |
| Gini / Inequality Index | 4,798 | 0.36 |
Earnings by Sex in Mount Plymouth
Average Earnings in Mount Plymouth are $46,329, $54,211 for men and $37,531 for women, a difference of 30.8%.
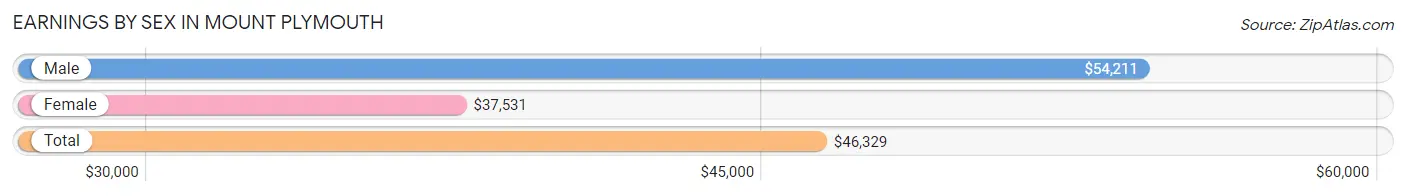
| Sex | Number | Average Earnings |
| Male | 1,604 (56.1%) | $54,211 |
| Female | 1,255 (43.9%) | $37,531 |
| Total | 2,859 (100.0%) | $46,329 |
Earnings by Sex by Income Bracket in Mount Plymouth
The most common earnings brackets in Mount Plymouth are $75,000 to $99,999 for men (273 | 17.0%) and $35,000 to $39,999 for women (198 | 15.8%).
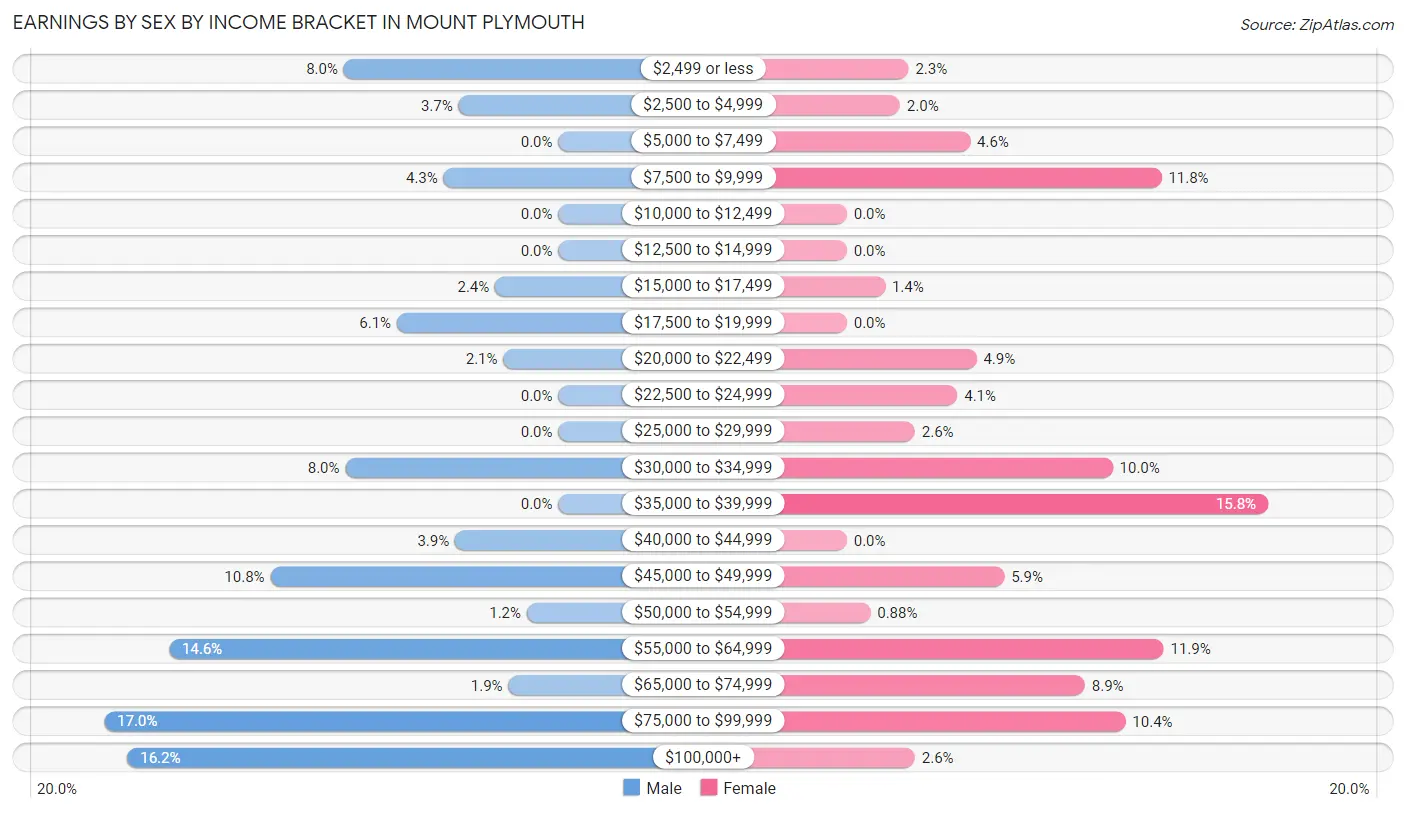
| Income | Male | Female |
| $2,499 or less | 129 (8.0%) | 29 (2.3%) |
| $2,500 to $4,999 | 60 (3.7%) | 25 (2.0%) |
| $5,000 to $7,499 | 0 (0.0%) | 58 (4.6%) |
| $7,500 to $9,999 | 69 (4.3%) | 148 (11.8%) |
| $10,000 to $12,499 | 0 (0.0%) | 0 (0.0%) |
| $12,500 to $14,999 | 0 (0.0%) | 0 (0.0%) |
| $15,000 to $17,499 | 38 (2.4%) | 18 (1.4%) |
| $17,500 to $19,999 | 97 (6.0%) | 0 (0.0%) |
| $20,000 to $22,499 | 33 (2.1%) | 61 (4.9%) |
| $22,500 to $24,999 | 0 (0.0%) | 52 (4.1%) |
| $25,000 to $29,999 | 0 (0.0%) | 32 (2.5%) |
| $30,000 to $34,999 | 128 (8.0%) | 125 (10.0%) |
| $35,000 to $39,999 | 0 (0.0%) | 198 (15.8%) |
| $40,000 to $44,999 | 62 (3.9%) | 0 (0.0%) |
| $45,000 to $49,999 | 173 (10.8%) | 74 (5.9%) |
| $50,000 to $54,999 | 19 (1.2%) | 11 (0.9%) |
| $55,000 to $64,999 | 234 (14.6%) | 149 (11.9%) |
| $65,000 to $74,999 | 30 (1.9%) | 112 (8.9%) |
| $75,000 to $99,999 | 273 (17.0%) | 131 (10.4%) |
| $100,000+ | 259 (16.2%) | 32 (2.5%) |
| Total | 1,604 (100.0%) | 1,255 (100.0%) |
Earnings by Sex by Educational Attainment in Mount Plymouth
Average earnings in Mount Plymouth are $58,712 for men and $38,115 for women, a difference of 35.1%. Men with an educational attainment of graduate degree enjoy the highest average annual earnings of $147,105, while those with high school diploma education earn the least with $41,554. Women with an educational attainment of bachelor's degree earn the most with the average annual earnings of $63,578, while those with college or associate's degree education have the smallest earnings of $32,500.
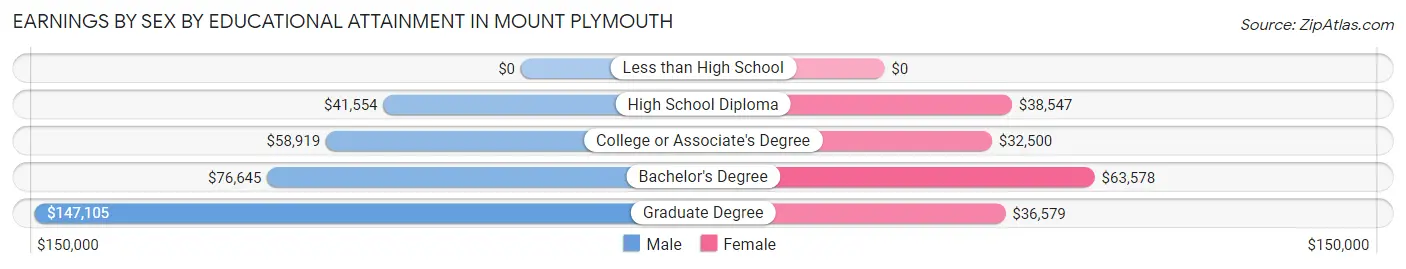
| Educational Attainment | Male Income | Female Income |
| Less than High School | - | - |
| High School Diploma | $41,554 | $38,547 |
| College or Associate's Degree | $58,919 | $32,500 |
| Bachelor's Degree | $76,645 | $63,578 |
| Graduate Degree | $147,105 | $36,579 |
| Total | $58,712 | $38,115 |
Family Income in Mount Plymouth
Family Income Brackets in Mount Plymouth
According to the Mount Plymouth family income data, there are 320 families falling into the $100,000 to $149,999 income range, which is the most common income bracket and makes up 24.1% of all families.
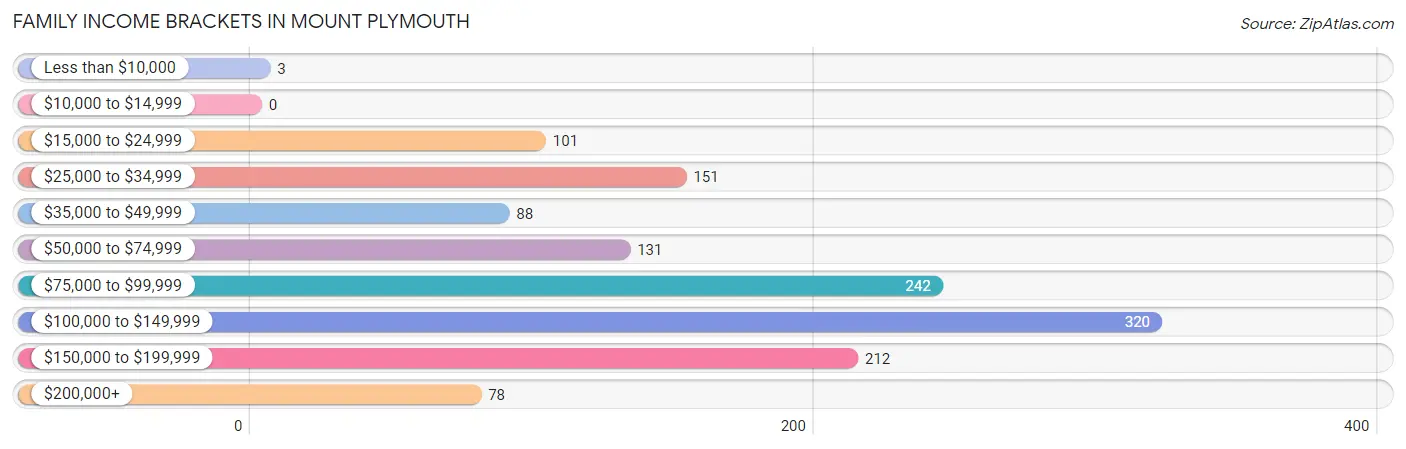
| Income Bracket | # Families | % Families |
| Less than $10,000 | 3 | 0.2% |
| $10,000 to $14,999 | 0 | 0.0% |
| $15,000 to $24,999 | 101 | 7.6% |
| $25,000 to $34,999 | 151 | 11.4% |
| $35,000 to $49,999 | 88 | 6.6% |
| $50,000 to $74,999 | 131 | 9.9% |
| $75,000 to $99,999 | 242 | 18.2% |
| $100,000 to $149,999 | 320 | 24.1% |
| $150,000 to $199,999 | 212 | 16.0% |
| $200,000+ | 78 | 5.9% |
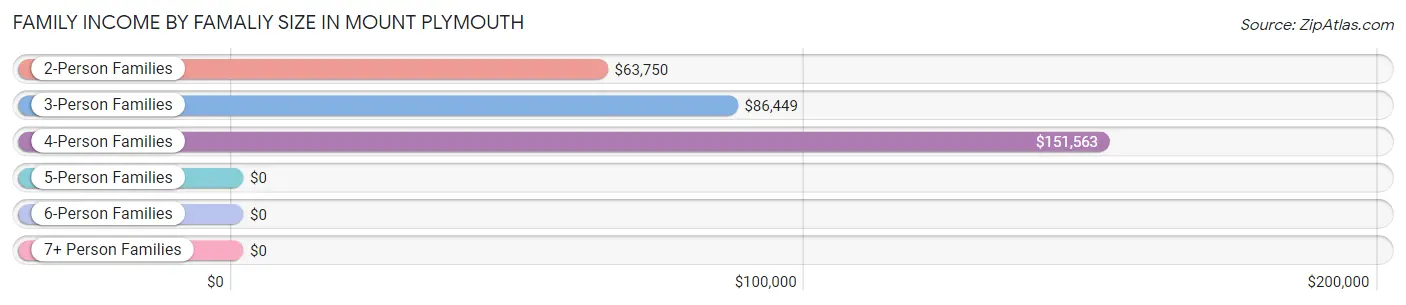
Family Income by Famaliy Size in Mount Plymouth
4-person families (262 | 19.7%) account for the highest median family income in Mount Plymouth with $151,563 per family, while 4-person families (262 | 19.7%) have the highest median income of $37,891 per family member.
| Income Bracket | # Families | Median Income |
| 2-Person Families | 567 (42.7%) | $63,750 |
| 3-Person Families | 444 (33.4%) | $86,449 |
| 4-Person Families | 262 (19.7%) | $151,563 |
| 5-Person Families | 41 (3.1%) | $0 |
| 6-Person Families | 0 (0.0%) | $0 |
| 7+ Person Families | 14 (1.1%) | $0 |
| Total | 1,328 (100.0%) | $86,413 |
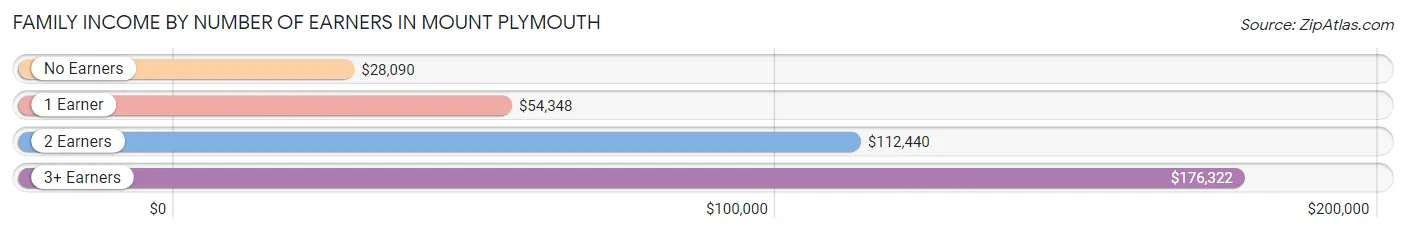
Family Income by Number of Earners in Mount Plymouth
The median family income in Mount Plymouth is $86,413, with families comprising 3+ earners (192) having the highest median family income of $176,322, while families with no earners (226) have the lowest median family income of $28,090, accounting for 14.5% and 17.0% of families, respectively.
| Number of Earners | # Families | Median Income |
| No Earners | 226 (17.0%) | $28,090 |
| 1 Earner | 234 (17.6%) | $54,348 |
| 2 Earners | 676 (50.9%) | $112,440 |
| 3+ Earners | 192 (14.5%) | $176,322 |
| Total | 1,328 (100.0%) | $86,413 |
Household Income in Mount Plymouth
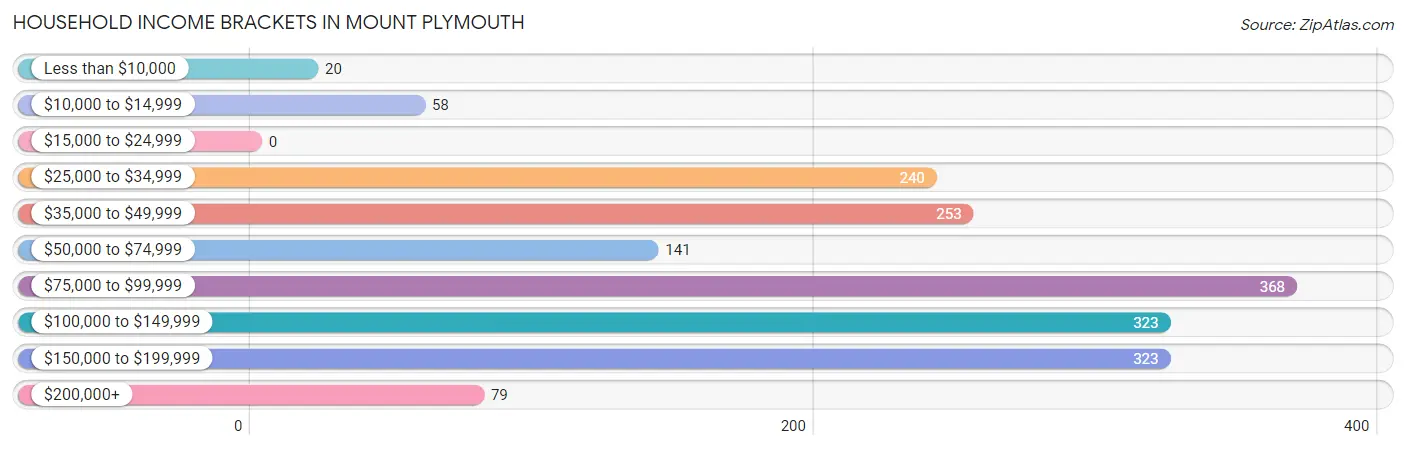
Household Income Brackets in Mount Plymouth
With 368 households falling in the category, the $75,000 to $99,999 income range is the most frequent in Mount Plymouth, accounting for 20.4% of all households.
| Income Bracket | # Households | % Households |
| Less than $10,000 | 20 | 1.1% |
| $10,000 to $14,999 | 58 | 3.2% |
| $15,000 to $24,999 | 0 | 0.0% |
| $25,000 to $34,999 | 240 | 13.3% |
| $35,000 to $49,999 | 253 | 14.0% |
| $50,000 to $74,999 | 141 | 7.8% |
| $75,000 to $99,999 | 368 | 20.4% |
| $100,000 to $149,999 | 323 | 17.9% |
| $150,000 to $199,999 | 323 | 17.9% |
| $200,000+ | 79 | 4.4% |
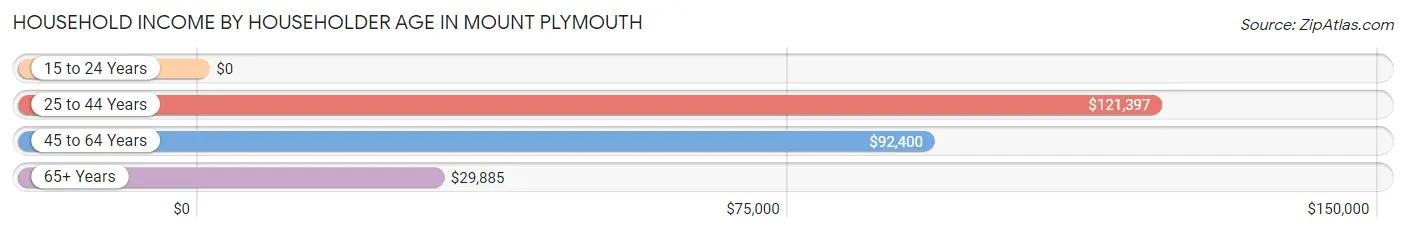
Household Income by Householder Age in Mount Plymouth
The median household income in Mount Plymouth is $83,633, with the highest median household income of $121,397 found in the 25 to 44 years age bracket for the primary householder. A total of 759 households (42.0%) fall into this category. Meanwhile, the 15 to 24 years age bracket for the primary householder has the lowest median household income of $0, with 51 households (2.8%) in this group.
| Income Bracket | # Households | Median Income |
| 15 to 24 Years | 51 (2.8%) | $0 |
| 25 to 44 Years | 759 (42.0%) | $121,397 |
| 45 to 64 Years | 522 (28.9%) | $92,400 |
| 65+ Years | 474 (26.3%) | $29,885 |
| Total | 1,806 (100.0%) | $83,633 |
Poverty in Mount Plymouth
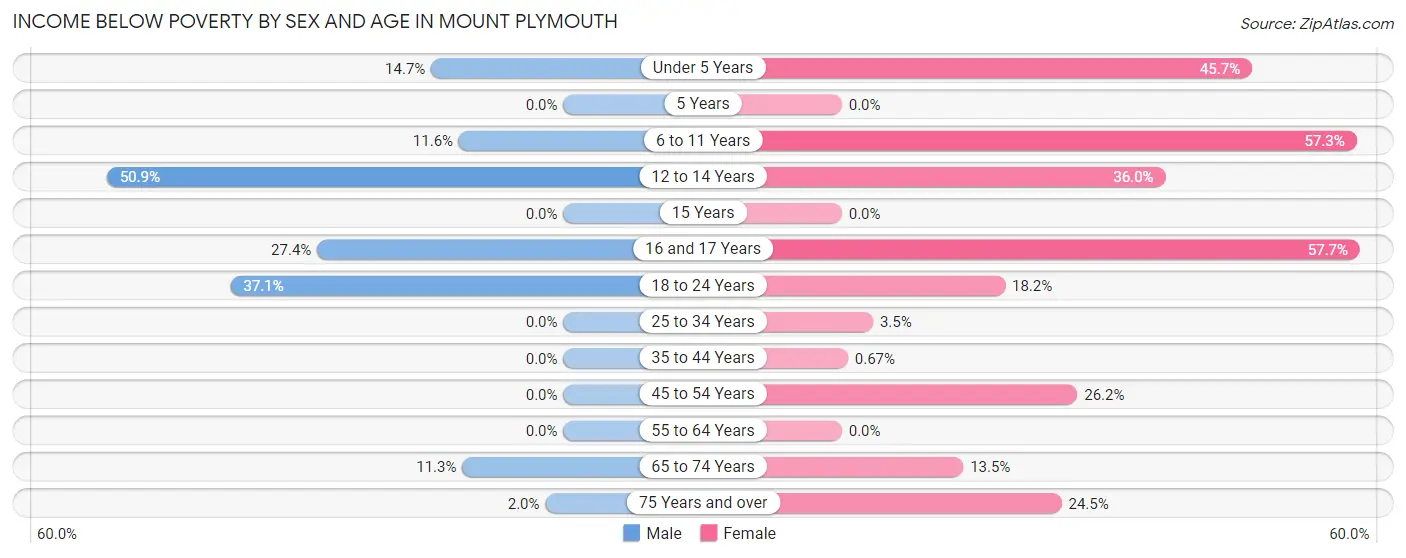
Income Below Poverty by Sex and Age in Mount Plymouth
With 7.2% poverty level for males and 15.2% for females among the residents of Mount Plymouth, 12 to 14 year old males and 16 and 17 year old females are the most vulnerable to poverty, with 30 males (50.8%) and 15 females (57.7%) in their respective age groups living below the poverty level.
| Age Bracket | Male | Female |
| Under 5 Years | 29 (14.7%) | 37 (45.7%) |
| 5 Years | 0 (0.0%) | 0 (0.0%) |
| 6 to 11 Years | 15 (11.6%) | 86 (57.3%) |
| 12 to 14 Years | 30 (50.8%) | 40 (36.0%) |
| 15 Years | 0 (0.0%) | 0 (0.0%) |
| 16 and 17 Years | 34 (27.4%) | 15 (57.7%) |
| 18 to 24 Years | 33 (37.1%) | 14 (18.2%) |
| 25 to 34 Years | 0 (0.0%) | 14 (3.5%) |
| 35 to 44 Years | 0 (0.0%) | 3 (0.7%) |
| 45 to 54 Years | 0 (0.0%) | 64 (26.2%) |
| 55 to 64 Years | 0 (0.0%) | 0 (0.0%) |
| 65 to 74 Years | 36 (11.3%) | 33 (13.5%) |
| 75 Years and over | 3 (2.0%) | 46 (24.5%) |
| Total | 180 (7.2%) | 352 (15.2%) |
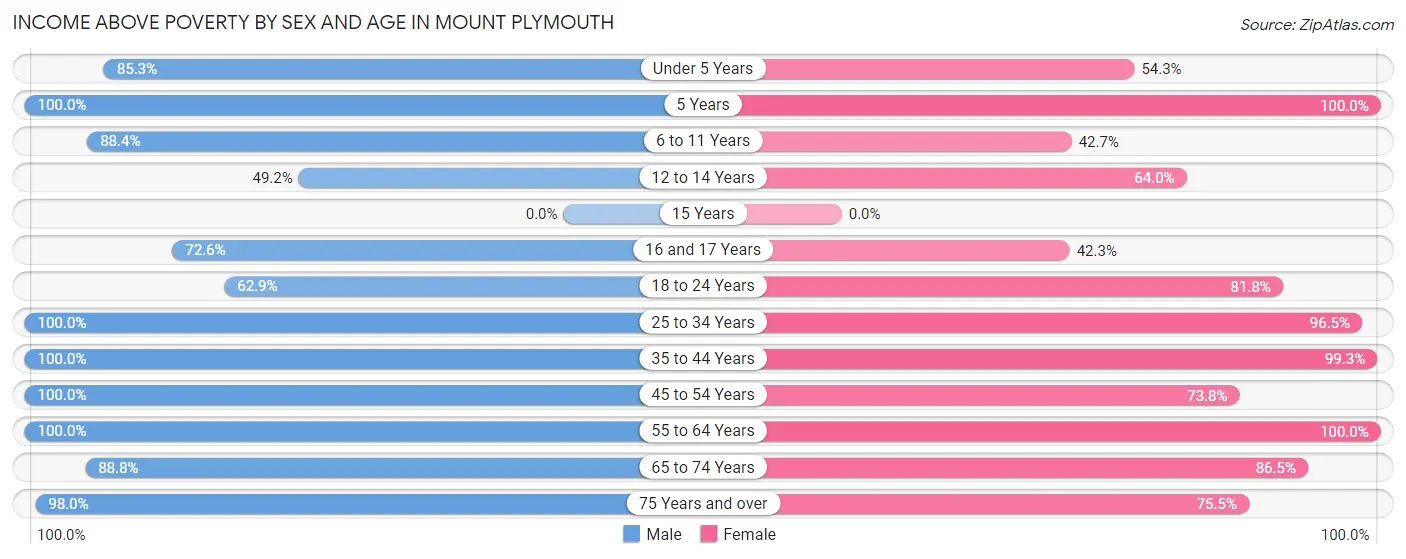
Income Above Poverty by Sex and Age in Mount Plymouth
According to the poverty statistics in Mount Plymouth, males aged 5 years and females aged 5 years are the age groups that are most secure financially, with 100.0% of males and 100.0% of females in these age groups living above the poverty line.
| Age Bracket | Male | Female |
| Under 5 Years | 168 (85.3%) | 44 (54.3%) |
| 5 Years | 55 (100.0%) | 35 (100.0%) |
| 6 to 11 Years | 114 (88.4%) | 64 (42.7%) |
| 12 to 14 Years | 29 (49.1%) | 71 (64.0%) |
| 15 Years | 0 (0.0%) | 0 (0.0%) |
| 16 and 17 Years | 90 (72.6%) | 11 (42.3%) |
| 18 to 24 Years | 56 (62.9%) | 63 (81.8%) |
| 25 to 34 Years | 507 (100.0%) | 390 (96.5%) |
| 35 to 44 Years | 510 (100.0%) | 448 (99.3%) |
| 45 to 54 Years | 258 (100.0%) | 180 (73.8%) |
| 55 to 64 Years | 86 (100.0%) | 303 (100.0%) |
| 65 to 74 Years | 284 (88.7%) | 211 (86.5%) |
| 75 Years and over | 147 (98.0%) | 142 (75.5%) |
| Total | 2,304 (92.7%) | 1,962 (84.8%) |
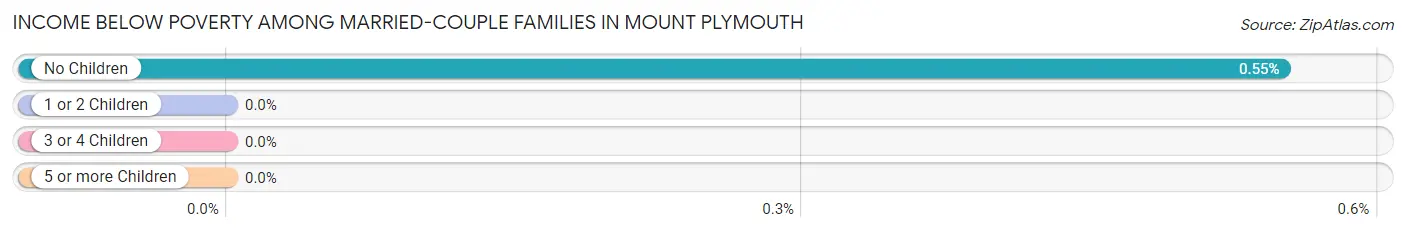
Income Below Poverty Among Married-Couple Families in Mount Plymouth
The poverty statistics for married-couple families in Mount Plymouth show that 0.3% or 3 of the total 993 families live below the poverty line. Families with no children have the highest poverty rate of 0.5%, comprising of 3 families. On the other hand, families with 1 or 2 children have the lowest poverty rate of 0.0%, which includes 0 families.
| Children | Above Poverty | Below Poverty |
| No Children | 546 (99.5%) | 3 (0.5%) |
| 1 or 2 Children | 436 (100.0%) | 0 (0.0%) |
| 3 or 4 Children | 8 (100.0%) | 0 (0.0%) |
| 5 or more Children | 0 (0.0%) | 0 (0.0%) |
| Total | 990 (99.7%) | 3 (0.3%) |
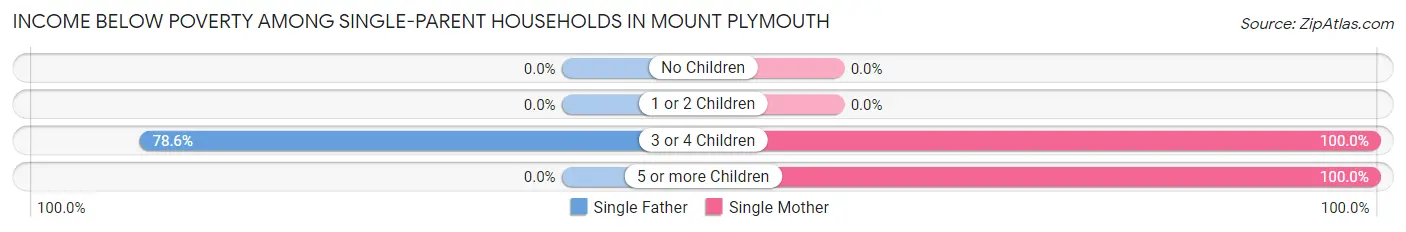
Income Below Poverty Among Single-Parent Households in Mount Plymouth
According to the poverty data in Mount Plymouth, 20.3% or 33 single-father households and 30.2% or 52 single-mother households are living below the poverty line. Among single-father households, those with 3 or 4 children have the highest poverty rate, with 33 households (78.6%) experiencing poverty. Likewise, among single-mother households, those with 3 or 4 children have the highest poverty rate, with 38 households (100.0%) falling below the poverty line.
| Children | Single Father | Single Mother |
| No Children | 0 (0.0%) | 0 (0.0%) |
| 1 or 2 Children | 0 (0.0%) | 0 (0.0%) |
| 3 or 4 Children | 33 (78.6%) | 38 (100.0%) |
| 5 or more Children | 0 (0.0%) | 14 (100.0%) |
| Total | 33 (20.3%) | 52 (30.2%) |
Income Below Poverty Among Married-Couple vs Single-Parent Households in Mount Plymouth
The poverty data for Mount Plymouth shows that 3 of the married-couple family households (0.3%) and 85 of the single-parent households (25.4%) are living below the poverty level. Within the married-couple family households, those with no children have the highest poverty rate, with 3 households (0.5%) falling below the poverty line. Among the single-parent households, those with 5 or more children have the highest poverty rate, with 14 household (100.0%) living below poverty.
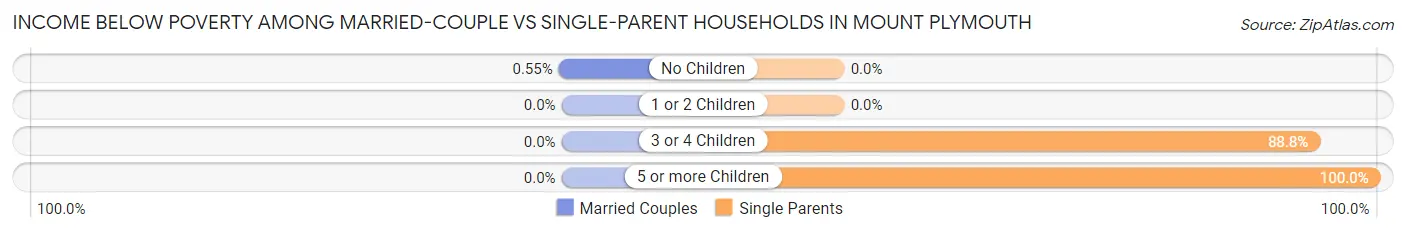
| Children | Married-Couple Families | Single-Parent Households |
| No Children | 3 (0.5%) | 0 (0.0%) |
| 1 or 2 Children | 0 (0.0%) | 0 (0.0%) |
| 3 or 4 Children | 0 (0.0%) | 71 (88.7%) |
| 5 or more Children | 0 (0.0%) | 14 (100.0%) |
| Total | 3 (0.3%) | 85 (25.4%) |
Employment Characteristics in Mount Plymouth
Employment by Class of Employer in Mount Plymouth
Among the 2,629 employed individuals in Mount Plymouth, private company employees (1,854 | 70.5%), local government employees (419 | 15.9%), and self-employed (not incorporated) (211 | 8.0%) make up the most common classes of employment.
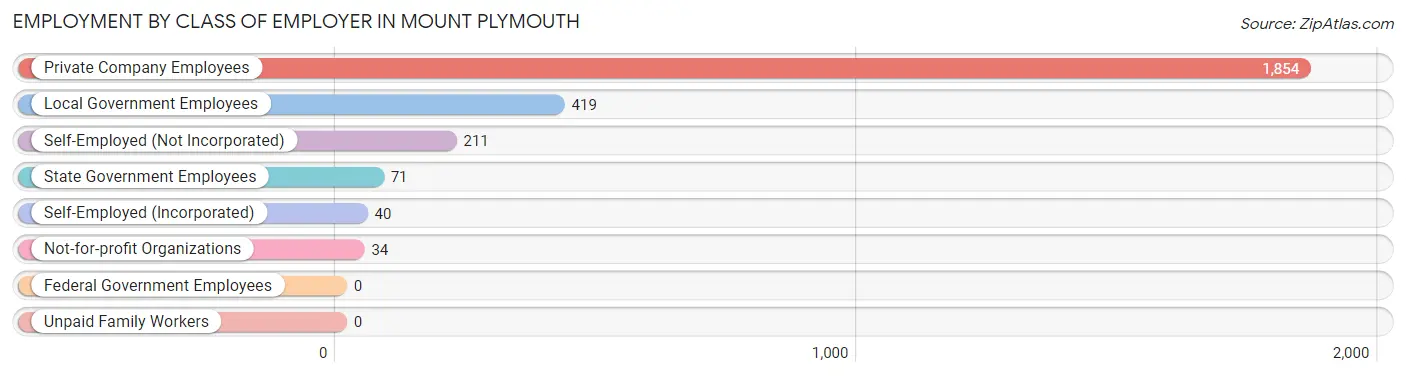
| Employer Class | # Employees | % Employees |
| Private Company Employees | 1,854 | 70.5% |
| Self-Employed (Incorporated) | 40 | 1.5% |
| Self-Employed (Not Incorporated) | 211 | 8.0% |
| Not-for-profit Organizations | 34 | 1.3% |
| Local Government Employees | 419 | 15.9% |
| State Government Employees | 71 | 2.7% |
| Federal Government Employees | 0 | 0.0% |
| Unpaid Family Workers | 0 | 0.0% |
| Total | 2,629 | 100.0% |
Employment Status by Age in Mount Plymouth
According to the labor force statistics for Mount Plymouth, out of the total population over 16 years of age (3,981), 70.9% or 2,823 individuals are in the labor force, with 2.4% or 68 of them unemployed. The age group with the highest labor force participation rate is 20 to 24 years, with 100.0% or 166 individuals in the labor force. Within the labor force, the 20 to 24 years age range has the highest percentage of unemployed individuals, with 18.7% or 31 of them being unemployed.
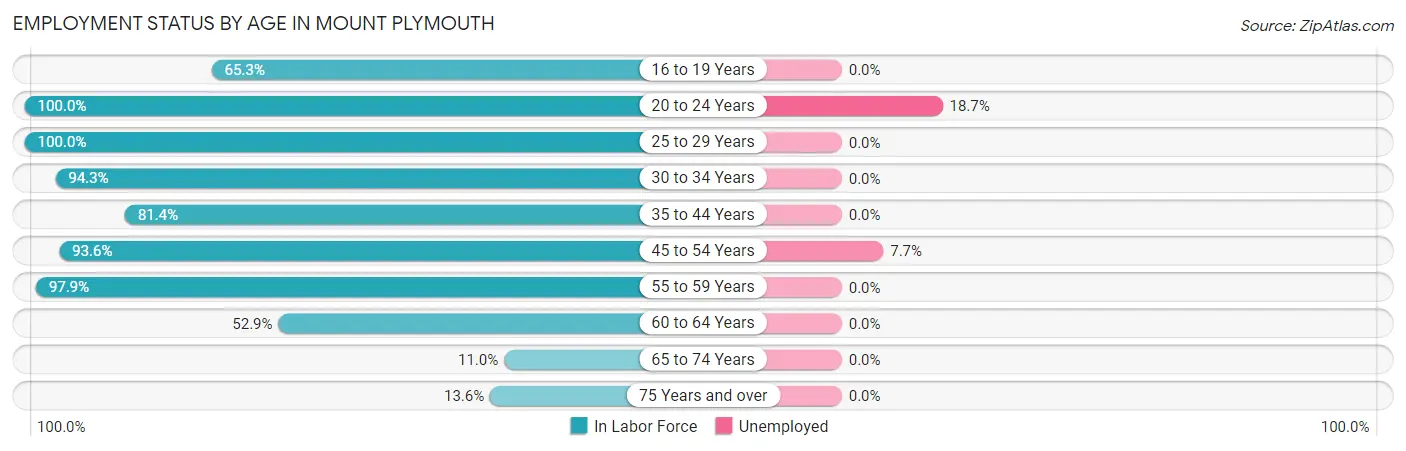
| Age Bracket | In Labor Force | Unemployed |
| 16 to 19 Years | 98 (65.3%) | 0 (0.0%) |
| 20 to 24 Years | 166 (100.0%) | 31 (18.7%) |
| 25 to 29 Years | 457 (100.0%) | 0 (0.0%) |
| 30 to 34 Years | 428 (94.3%) | 0 (0.0%) |
| 35 to 44 Years | 782 (81.4%) | 0 (0.0%) |
| 45 to 54 Years | 470 (93.6%) | 36 (7.7%) |
| 55 to 59 Years | 231 (97.9%) | 0 (0.0%) |
| 60 to 64 Years | 81 (52.9%) | 0 (0.0%) |
| 65 to 74 Years | 62 (11.0%) | 0 (0.0%) |
| 75 Years and over | 46 (13.6%) | 0 (0.0%) |
| Total | 2,823 (70.9%) | 68 (2.4%) |
Employment Status by Educational Attainment in Mount Plymouth
According to labor force statistics for Mount Plymouth, 88.6% of individuals (2,448) out of the total population between 25 and 64 years of age (2,763) are in the labor force, with 1.5% or 37 of them being unemployed. The group with the highest labor force participation rate are those with the educational attainment of college / associate degree, with 97.4% or 1,411 individuals in the labor force. Within the labor force, individuals with college / associate degree education have the highest percentage of unemployment, with 2.6% or 37 of them being unemployed.
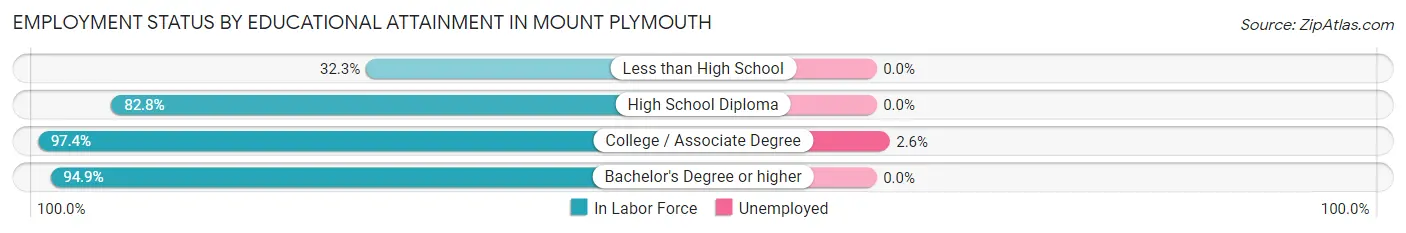
| Educational Attainment | In Labor Force | Unemployed |
| Less than High School | 71 (32.3%) | 0 (0.0%) |
| High School Diploma | 485 (82.8%) | 0 (0.0%) |
| College / Associate Degree | 1,411 (97.4%) | 38 (2.6%) |
| Bachelor's Degree or higher | 482 (94.9%) | 0 (0.0%) |
| Total | 2,448 (88.6%) | 41 (1.5%) |
Employment Occupations by Sex in Mount Plymouth
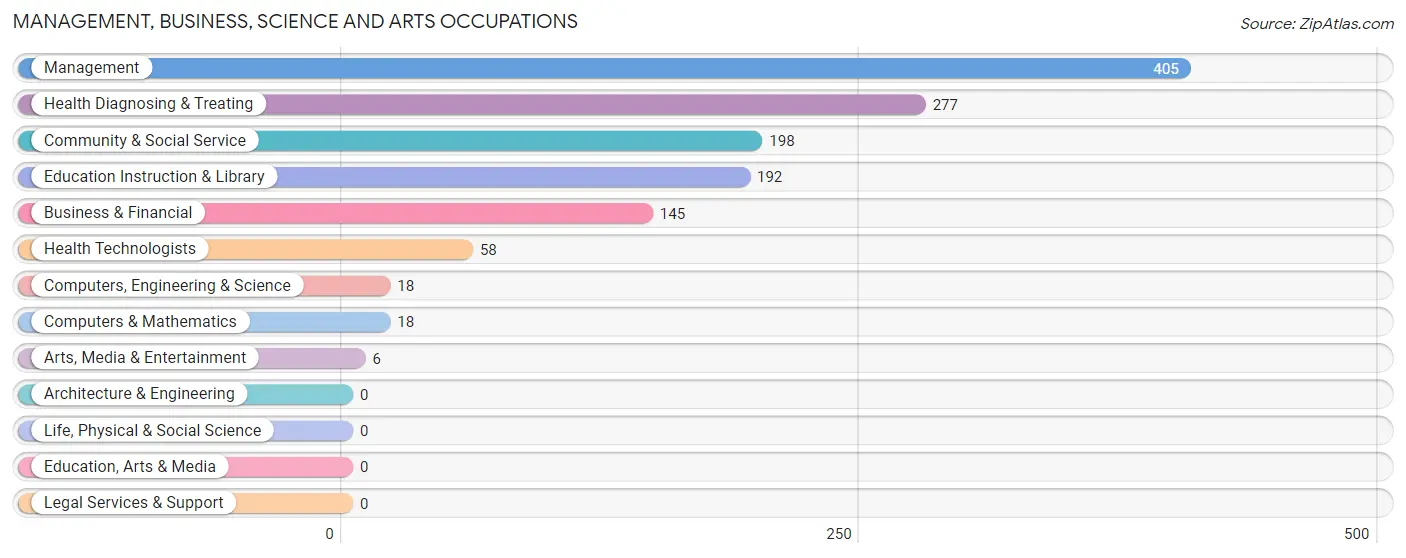
Management, Business, Science and Arts Occupations
The most common Management, Business, Science and Arts occupations in Mount Plymouth are Management (405 | 14.7%), Health Diagnosing & Treating (277 | 10.1%), Community & Social Service (198 | 7.2%), Education Instruction & Library (192 | 7.0%), and Business & Financial (145 | 5.3%).
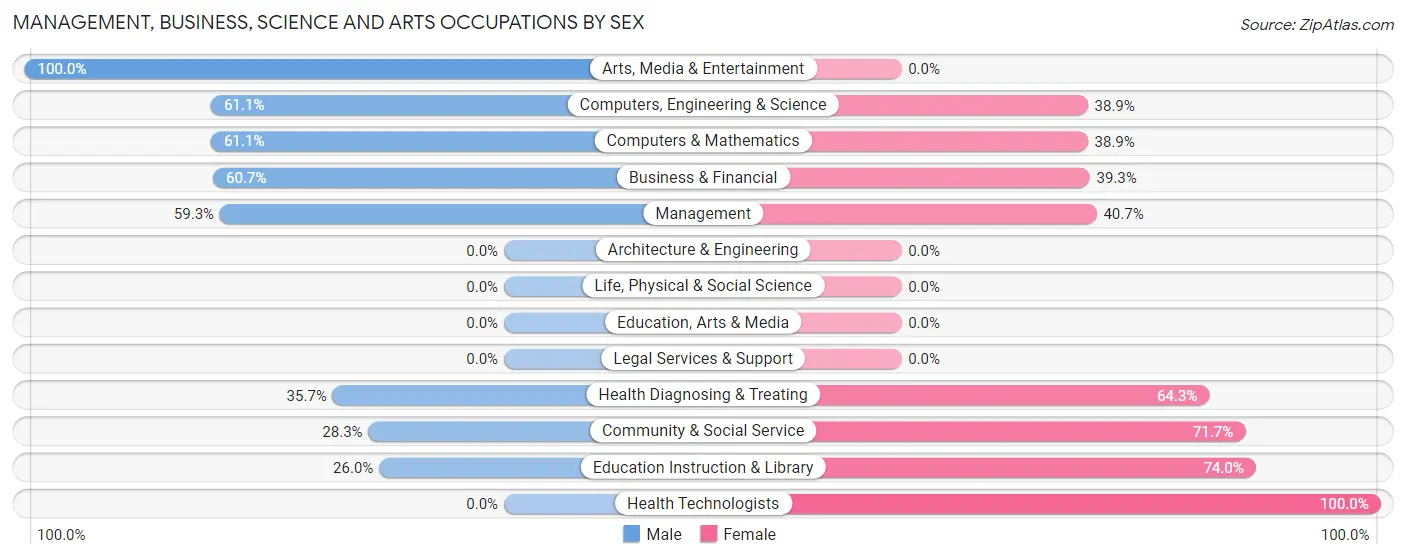
Management, Business, Science and Arts Occupations by Sex
Within the Management, Business, Science and Arts occupations in Mount Plymouth, the most male-oriented occupations are Arts, Media & Entertainment (100.0%), Computers, Engineering & Science (61.1%), and Computers & Mathematics (61.1%), while the most female-oriented occupations are Health Technologists (100.0%), Education Instruction & Library (74.0%), and Community & Social Service (71.7%).
| Occupation | Male | Female |
| Management | 240 (59.3%) | 165 (40.7%) |
| Business & Financial | 88 (60.7%) | 57 (39.3%) |
| Computers, Engineering & Science | 11 (61.1%) | 7 (38.9%) |
| Computers & Mathematics | 11 (61.1%) | 7 (38.9%) |
| Architecture & Engineering | 0 (0.0%) | 0 (0.0%) |
| Life, Physical & Social Science | 0 (0.0%) | 0 (0.0%) |
| Community & Social Service | 56 (28.3%) | 142 (71.7%) |
| Education, Arts & Media | 0 (0.0%) | 0 (0.0%) |
| Legal Services & Support | 0 (0.0%) | 0 (0.0%) |
| Education Instruction & Library | 50 (26.0%) | 142 (74.0%) |
| Arts, Media & Entertainment | 6 (100.0%) | 0 (0.0%) |
| Health Diagnosing & Treating | 99 (35.7%) | 178 (64.3%) |
| Health Technologists | 0 (0.0%) | 58 (100.0%) |
| Total (Category) | 494 (47.4%) | 549 (52.6%) |
| Total (Overall) | 1,499 (54.4%) | 1,255 (45.6%) |
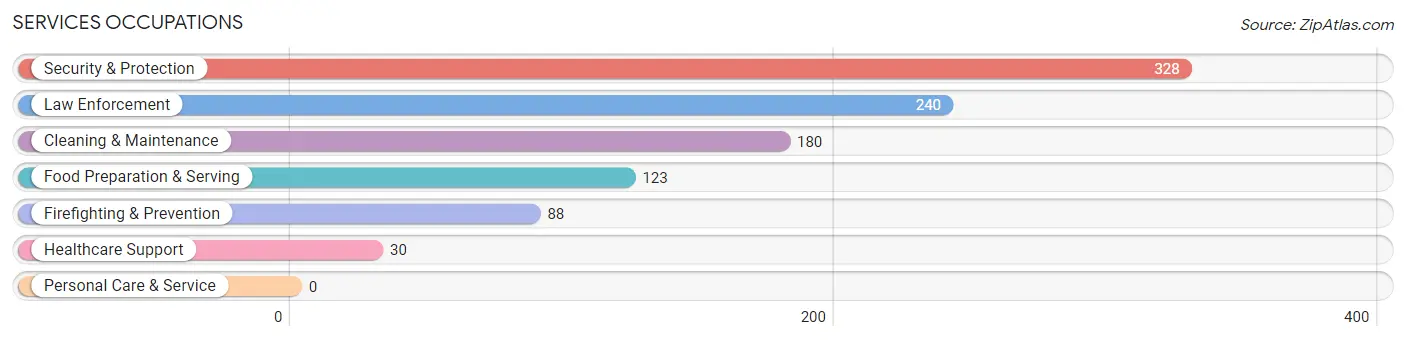
Services Occupations
The most common Services occupations in Mount Plymouth are Security & Protection (328 | 11.9%), Law Enforcement (240 | 8.7%), Cleaning & Maintenance (180 | 6.5%), Food Preparation & Serving (123 | 4.5%), and Firefighting & Prevention (88 | 3.2%).
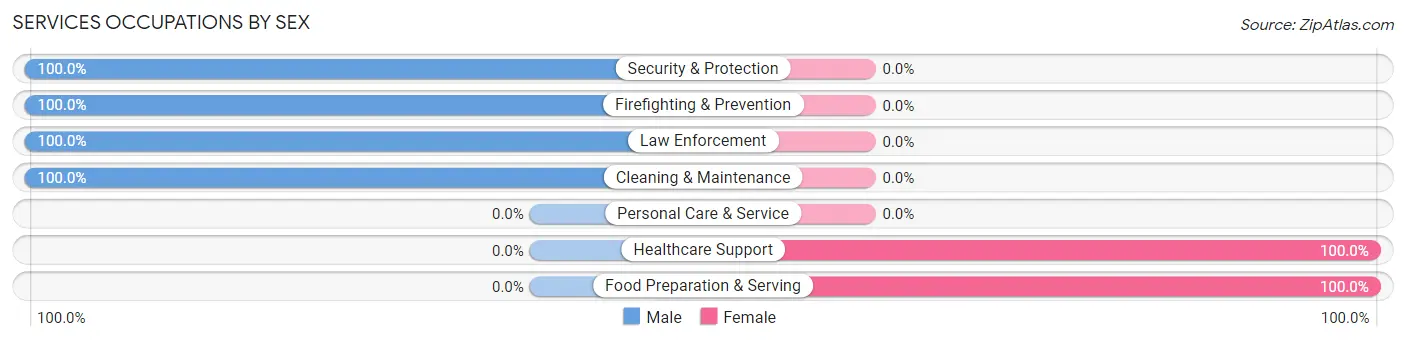
Services Occupations by Sex
Within the Services occupations in Mount Plymouth, the most male-oriented occupations are Security & Protection (100.0%), Firefighting & Prevention (100.0%), and Law Enforcement (100.0%), while the most female-oriented occupations are Healthcare Support (100.0%), and Food Preparation & Serving (100.0%).
| Occupation | Male | Female |
| Healthcare Support | 0 (0.0%) | 30 (100.0%) |
| Security & Protection | 328 (100.0%) | 0 (0.0%) |
| Firefighting & Prevention | 88 (100.0%) | 0 (0.0%) |
| Law Enforcement | 240 (100.0%) | 0 (0.0%) |
| Food Preparation & Serving | 0 (0.0%) | 123 (100.0%) |
| Cleaning & Maintenance | 180 (100.0%) | 0 (0.0%) |
| Personal Care & Service | 0 (0.0%) | 0 (0.0%) |
| Total (Category) | 508 (76.8%) | 153 (23.2%) |
| Total (Overall) | 1,499 (54.4%) | 1,255 (45.6%) |
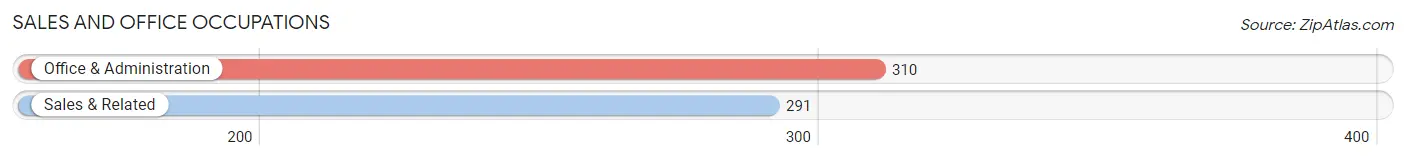
Sales and Office Occupations
The most common Sales and Office occupations in Mount Plymouth are Office & Administration (310 | 11.3%), and Sales & Related (291 | 10.6%).
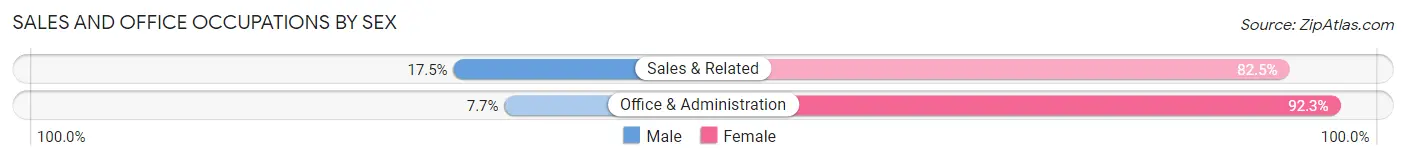
Sales and Office Occupations by Sex
| Occupation | Male | Female |
| Sales & Related | 51 (17.5%) | 240 (82.5%) |
| Office & Administration | 24 (7.7%) | 286 (92.3%) |
| Total (Category) | 75 (12.5%) | 526 (87.5%) |
| Total (Overall) | 1,499 (54.4%) | 1,255 (45.6%) |
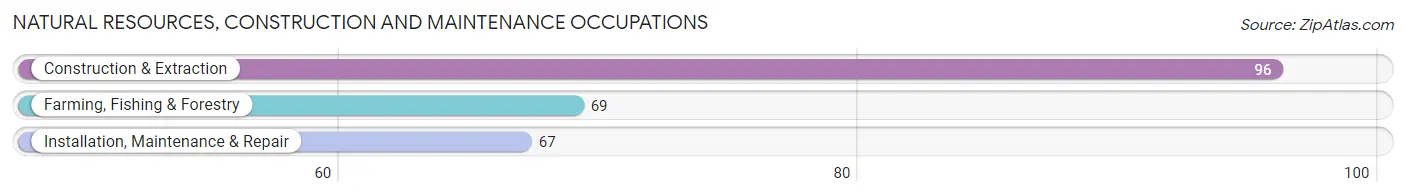
Natural Resources, Construction and Maintenance Occupations
The most common Natural Resources, Construction and Maintenance occupations in Mount Plymouth are Construction & Extraction (96 | 3.5%), Farming, Fishing & Forestry (69 | 2.5%), and Installation, Maintenance & Repair (67 | 2.4%).
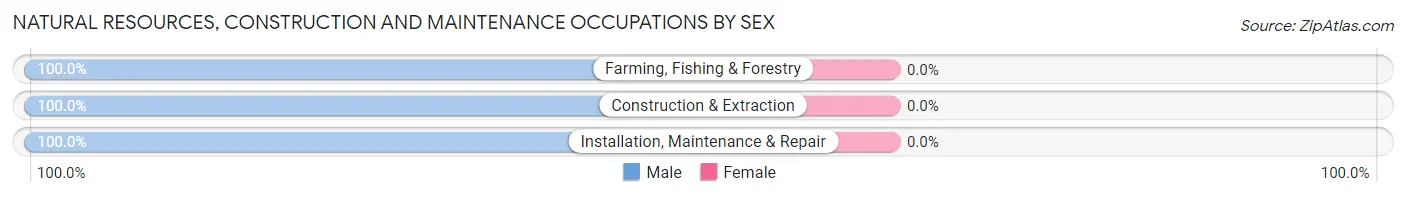
Natural Resources, Construction and Maintenance Occupations by Sex
| Occupation | Male | Female |
| Farming, Fishing & Forestry | 69 (100.0%) | 0 (0.0%) |
| Construction & Extraction | 96 (100.0%) | 0 (0.0%) |
| Installation, Maintenance & Repair | 67 (100.0%) | 0 (0.0%) |
| Total (Category) | 232 (100.0%) | 0 (0.0%) |
| Total (Overall) | 1,499 (54.4%) | 1,255 (45.6%) |
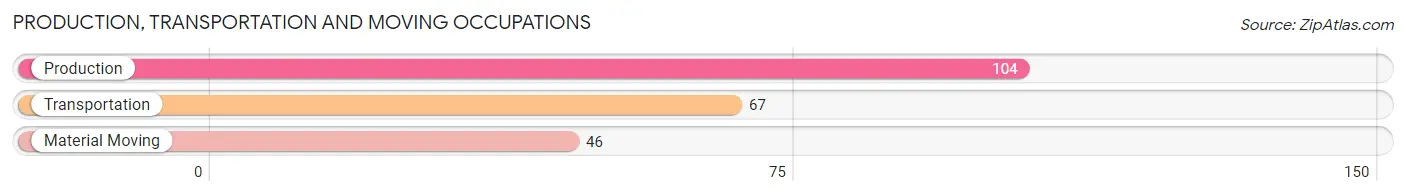
Production, Transportation and Moving Occupations
The most common Production, Transportation and Moving occupations in Mount Plymouth are Production (104 | 3.8%), Transportation (67 | 2.4%), and Material Moving (46 | 1.7%).
Production, Transportation and Moving Occupations by Sex
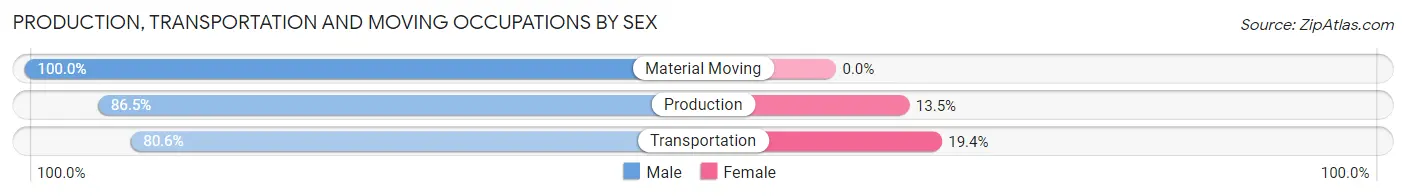
| Occupation | Male | Female |
| Production | 90 (86.5%) | 14 (13.5%) |
| Transportation | 54 (80.6%) | 13 (19.4%) |
| Material Moving | 46 (100.0%) | 0 (0.0%) |
| Total (Category) | 190 (87.6%) | 27 (12.4%) |
| Total (Overall) | 1,499 (54.4%) | 1,255 (45.6%) |
Employment Industries by Sex in Mount Plymouth
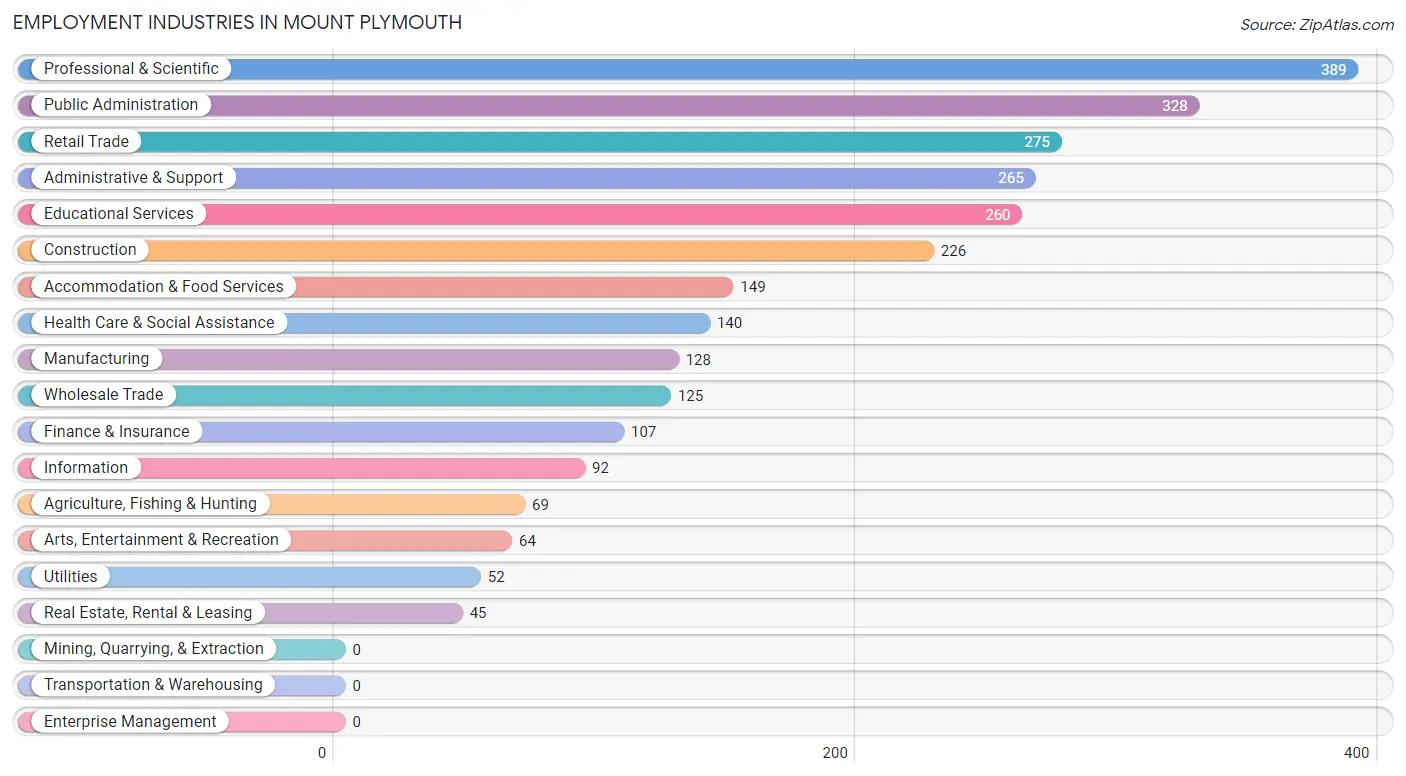
Employment Industries in Mount Plymouth
The major employment industries in Mount Plymouth include Professional & Scientific (389 | 14.1%), Public Administration (328 | 11.9%), Retail Trade (275 | 10.0%), Administrative & Support (265 | 9.6%), and Educational Services (260 | 9.4%).
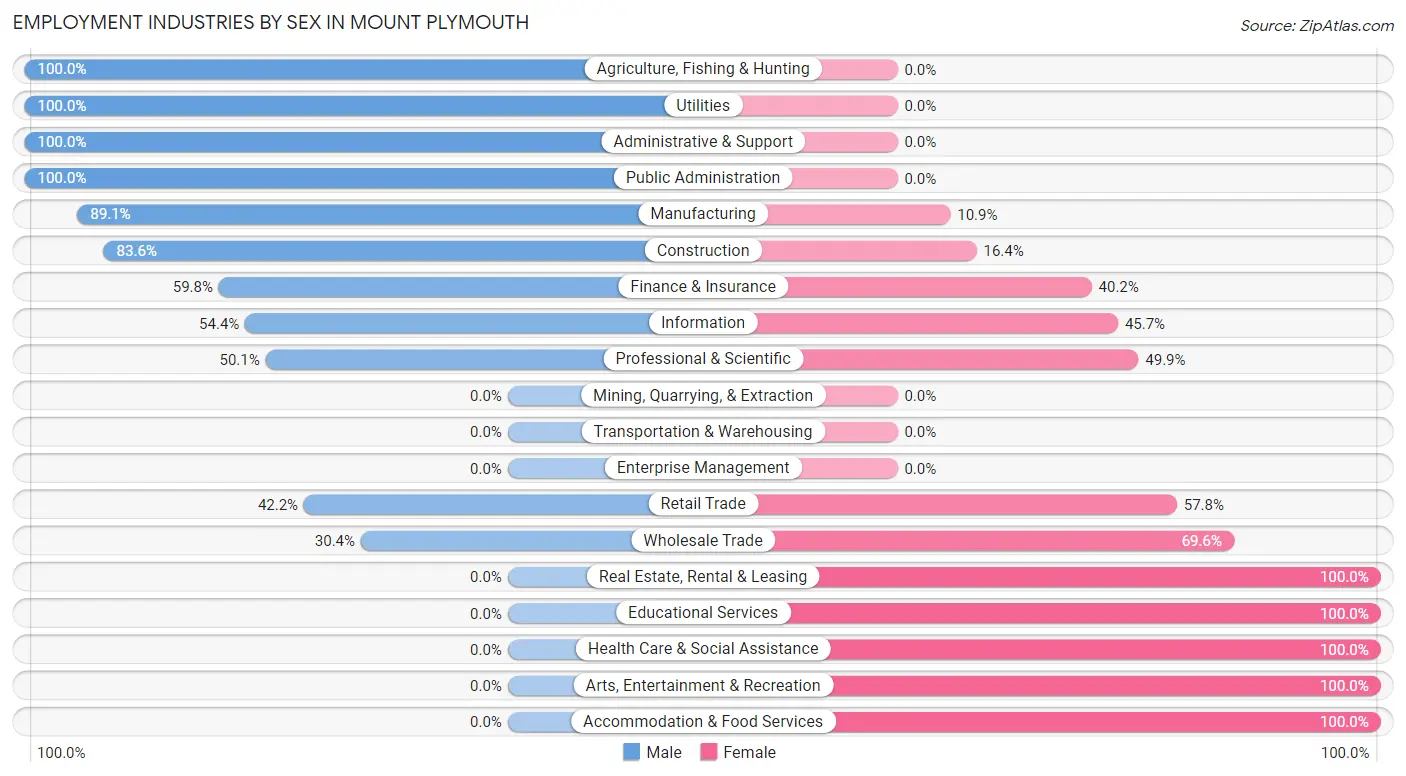
Employment Industries by Sex in Mount Plymouth
The Mount Plymouth industries that see more men than women are Agriculture, Fishing & Hunting (100.0%), Utilities (100.0%), and Administrative & Support (100.0%), whereas the industries that tend to have a higher number of women are Real Estate, Rental & Leasing (100.0%), Educational Services (100.0%), and Health Care & Social Assistance (100.0%).
| Industry | Male | Female |
| Agriculture, Fishing & Hunting | 69 (100.0%) | 0 (0.0%) |
| Mining, Quarrying, & Extraction | 0 (0.0%) | 0 (0.0%) |
| Construction | 189 (83.6%) | 37 (16.4%) |
| Manufacturing | 114 (89.1%) | 14 (10.9%) |
| Wholesale Trade | 38 (30.4%) | 87 (69.6%) |
| Retail Trade | 116 (42.2%) | 159 (57.8%) |
| Transportation & Warehousing | 0 (0.0%) | 0 (0.0%) |
| Utilities | 52 (100.0%) | 0 (0.0%) |
| Information | 50 (54.3%) | 42 (45.7%) |
| Finance & Insurance | 64 (59.8%) | 43 (40.2%) |
| Real Estate, Rental & Leasing | 0 (0.0%) | 45 (100.0%) |
| Professional & Scientific | 195 (50.1%) | 194 (49.9%) |
| Enterprise Management | 0 (0.0%) | 0 (0.0%) |
| Administrative & Support | 265 (100.0%) | 0 (0.0%) |
| Educational Services | 0 (0.0%) | 260 (100.0%) |
| Health Care & Social Assistance | 0 (0.0%) | 140 (100.0%) |
| Arts, Entertainment & Recreation | 0 (0.0%) | 64 (100.0%) |
| Accommodation & Food Services | 0 (0.0%) | 149 (100.0%) |
| Public Administration | 328 (100.0%) | 0 (0.0%) |
| Total | 1,499 (54.4%) | 1,255 (45.6%) |
Education in Mount Plymouth
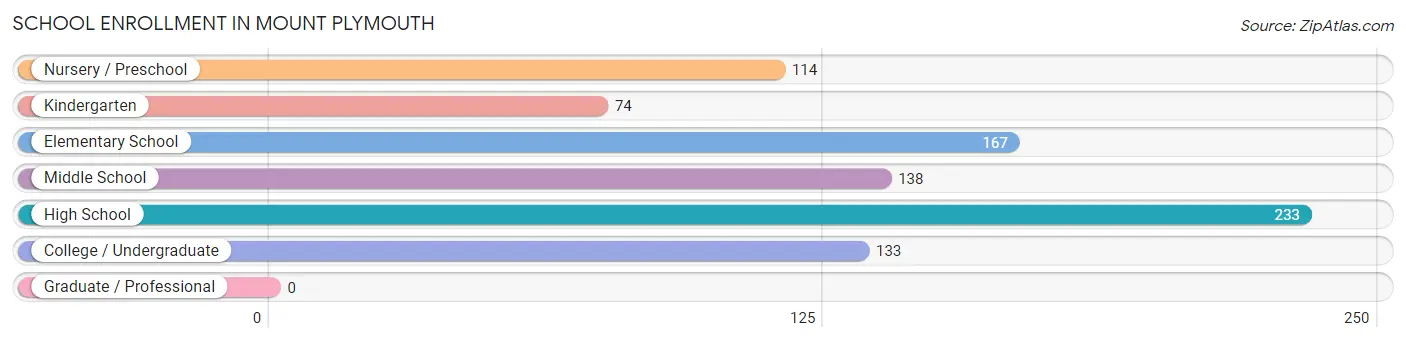
School Enrollment in Mount Plymouth
The most common levels of schooling among the 859 students in Mount Plymouth are high school (233 | 27.1%), elementary school (167 | 19.4%), and middle school (138 | 16.1%).
| School Level | # Students | % Students |
| Nursery / Preschool | 114 | 13.3% |
| Kindergarten | 74 | 8.6% |
| Elementary School | 167 | 19.4% |
| Middle School | 138 | 16.1% |
| High School | 233 | 27.1% |
| College / Undergraduate | 133 | 15.5% |
| Graduate / Professional | 0 | 0.0% |
| Total | 859 | 100.0% |
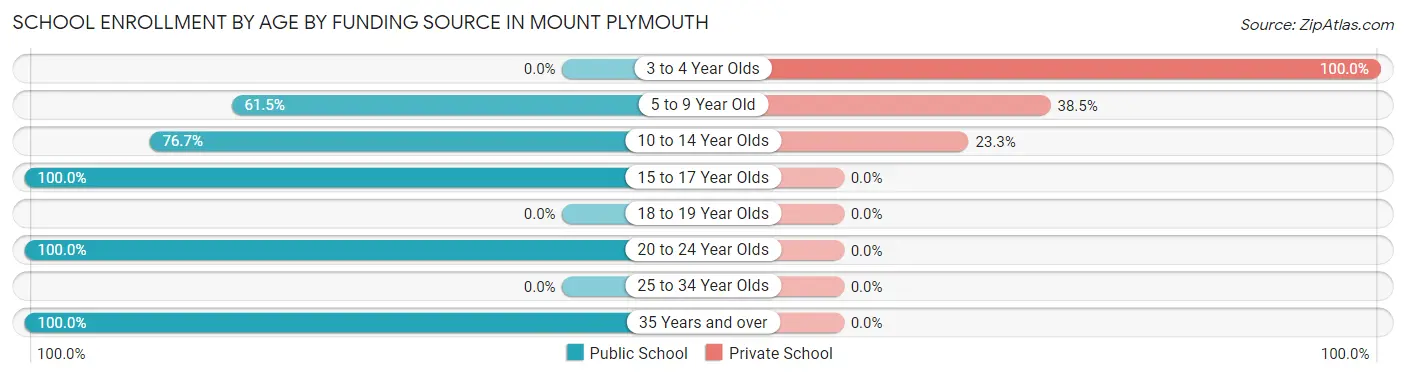
School Enrollment by Age by Funding Source in Mount Plymouth
Out of a total of 859 students who are enrolled in schools in Mount Plymouth, 211 (24.6%) attend a private institution, while the remaining 648 (75.4%) are enrolled in public schools. The age group of 3 to 4 year olds has the highest likelihood of being enrolled in private schools, with 43 (100.0% in the age bracket) enrolled. Conversely, the age group of 15 to 17 year olds has the lowest likelihood of being enrolled in a private school, with 150 (100.0% in the age bracket) attending a public institution.
| Age Bracket | Public School | Private School |
| 3 to 4 Year Olds | 0 (0.0%) | 43 (100.0%) |
| 5 to 9 Year Old | 177 (61.5%) | 111 (38.5%) |
| 10 to 14 Year Olds | 188 (76.7%) | 57 (23.3%) |
| 15 to 17 Year Olds | 150 (100.0%) | 0 (0.0%) |
| 18 to 19 Year Olds | 0 (0.0%) | 0 (0.0%) |
| 20 to 24 Year Olds | 76 (100.0%) | 0 (0.0%) |
| 25 to 34 Year Olds | 0 (0.0%) | 0 (0.0%) |
| 35 Years and over | 57 (100.0%) | 0 (0.0%) |
| Total | 648 (75.4%) | 211 (24.6%) |
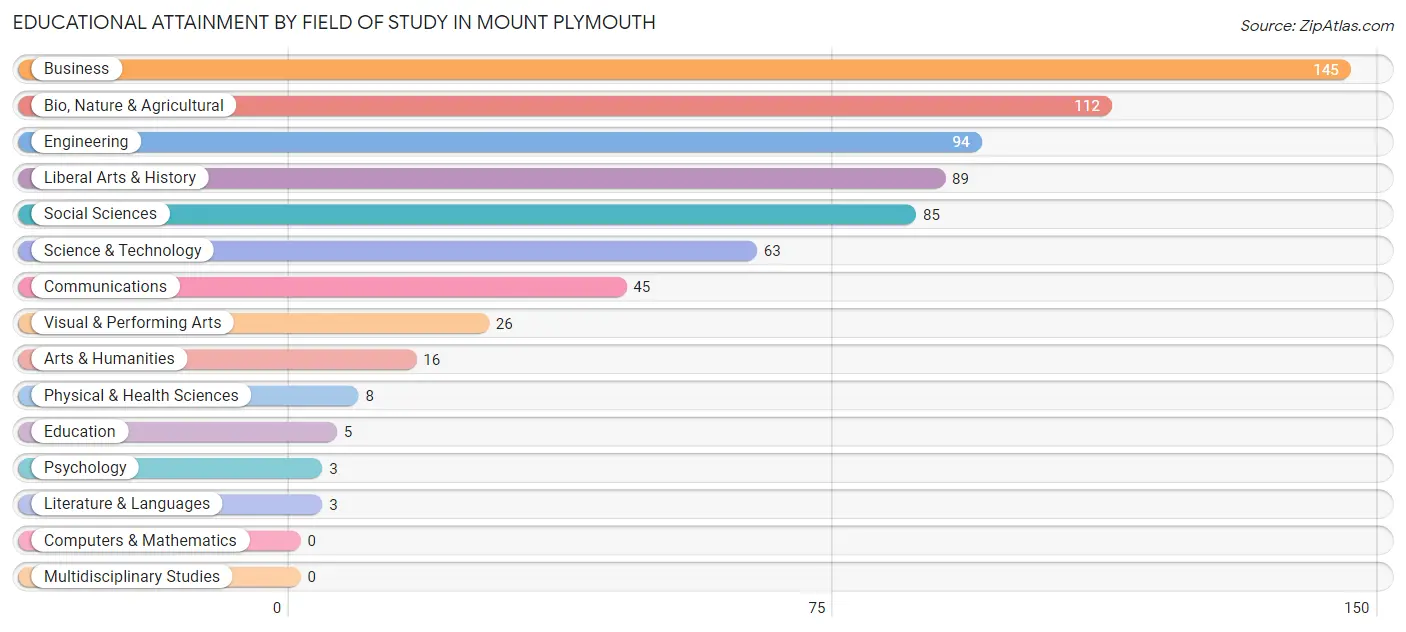
Educational Attainment by Field of Study in Mount Plymouth
Business (145 | 20.9%), bio, nature & agricultural (112 | 16.1%), engineering (94 | 13.5%), liberal arts & history (89 | 12.8%), and social sciences (85 | 12.2%) are the most common fields of study among 694 individuals in Mount Plymouth who have obtained a bachelor's degree or higher.
| Field of Study | # Graduates | % Graduates |
| Computers & Mathematics | 0 | 0.0% |
| Bio, Nature & Agricultural | 112 | 16.1% |
| Physical & Health Sciences | 8 | 1.1% |
| Psychology | 3 | 0.4% |
| Social Sciences | 85 | 12.2% |
| Engineering | 94 | 13.5% |
| Multidisciplinary Studies | 0 | 0.0% |
| Science & Technology | 63 | 9.1% |
| Business | 145 | 20.9% |
| Education | 5 | 0.7% |
| Literature & Languages | 3 | 0.4% |
| Liberal Arts & History | 89 | 12.8% |
| Visual & Performing Arts | 26 | 3.7% |
| Communications | 45 | 6.5% |
| Arts & Humanities | 16 | 2.3% |
| Total | 694 | 100.0% |
Transportation & Commute in Mount Plymouth
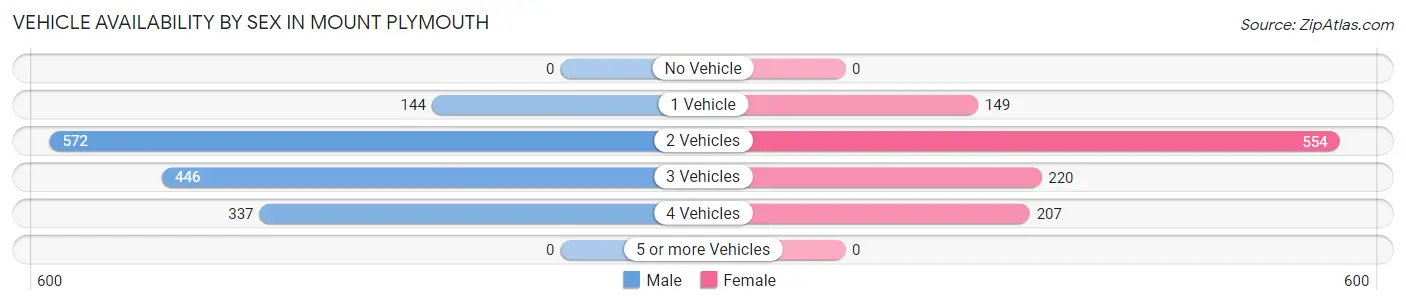
Vehicle Availability by Sex in Mount Plymouth
The most prevalent vehicle ownership categories in Mount Plymouth are males with 2 vehicles (572, accounting for 38.2%) and females with 2 vehicles (554, making up 50.6%).
| Vehicles Available | Male | Female |
| No Vehicle | 0 (0.0%) | 0 (0.0%) |
| 1 Vehicle | 144 (9.6%) | 149 (13.2%) |
| 2 Vehicles | 572 (38.2%) | 554 (49.0%) |
| 3 Vehicles | 446 (29.7%) | 220 (19.5%) |
| 4 Vehicles | 337 (22.5%) | 207 (18.3%) |
| 5 or more Vehicles | 0 (0.0%) | 0 (0.0%) |
| Total | 1,499 (100.0%) | 1,130 (100.0%) |
Commute Time in Mount Plymouth
The most frequently occuring commute durations in Mount Plymouth are 30 to 34 minutes (501 commuters, 21.2%), 45 to 59 minutes (355 commuters, 15.0%), and 20 to 24 minutes (340 commuters, 14.4%).
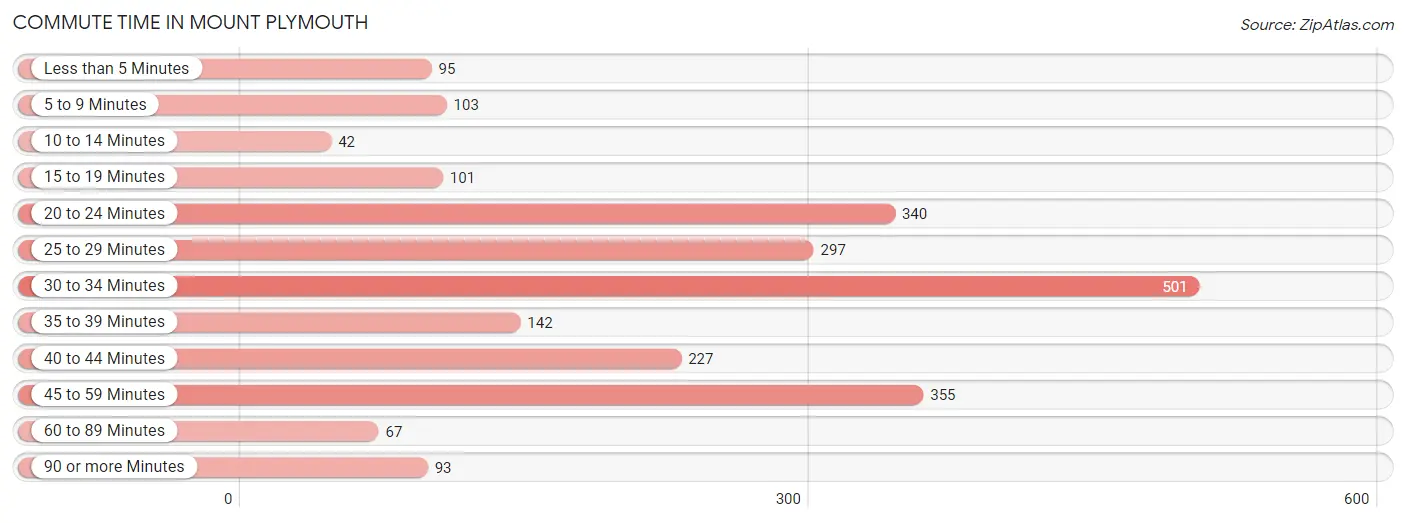
| Commute Time | # Commuters | % Commuters |
| Less than 5 Minutes | 95 | 4.0% |
| 5 to 9 Minutes | 103 | 4.4% |
| 10 to 14 Minutes | 42 | 1.8% |
| 15 to 19 Minutes | 101 | 4.3% |
| 20 to 24 Minutes | 340 | 14.4% |
| 25 to 29 Minutes | 297 | 12.6% |
| 30 to 34 Minutes | 501 | 21.2% |
| 35 to 39 Minutes | 142 | 6.0% |
| 40 to 44 Minutes | 227 | 9.6% |
| 45 to 59 Minutes | 355 | 15.0% |
| 60 to 89 Minutes | 67 | 2.8% |
| 90 or more Minutes | 93 | 3.9% |
Commute Time by Sex in Mount Plymouth
The most common commute times in Mount Plymouth are 30 to 34 minutes (350 commuters, 24.0%) for males and 20 to 24 minutes (270 commuters, 29.9%) for females.
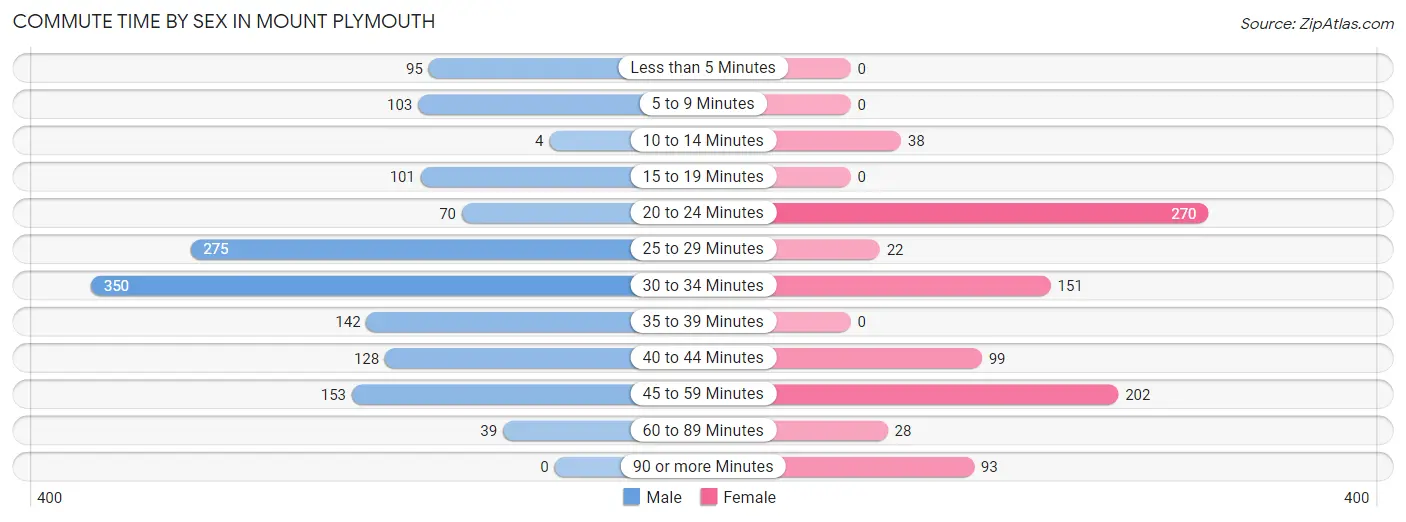
| Commute Time | Male | Female |
| Less than 5 Minutes | 95 (6.5%) | 0 (0.0%) |
| 5 to 9 Minutes | 103 (7.0%) | 0 (0.0%) |
| 10 to 14 Minutes | 4 (0.3%) | 38 (4.2%) |
| 15 to 19 Minutes | 101 (6.9%) | 0 (0.0%) |
| 20 to 24 Minutes | 70 (4.8%) | 270 (29.9%) |
| 25 to 29 Minutes | 275 (18.8%) | 22 (2.4%) |
| 30 to 34 Minutes | 350 (24.0%) | 151 (16.7%) |
| 35 to 39 Minutes | 142 (9.7%) | 0 (0.0%) |
| 40 to 44 Minutes | 128 (8.8%) | 99 (11.0%) |
| 45 to 59 Minutes | 153 (10.5%) | 202 (22.4%) |
| 60 to 89 Minutes | 39 (2.7%) | 28 (3.1%) |
| 90 or more Minutes | 0 (0.0%) | 93 (10.3%) |
Time of Departure to Work by Sex in Mount Plymouth
The most frequent times of departure to work in Mount Plymouth are 4:00 PM to 11:59 PM (336, 23.0%) for males and 7:00 AM to 7:29 AM (157, 17.4%) for females.
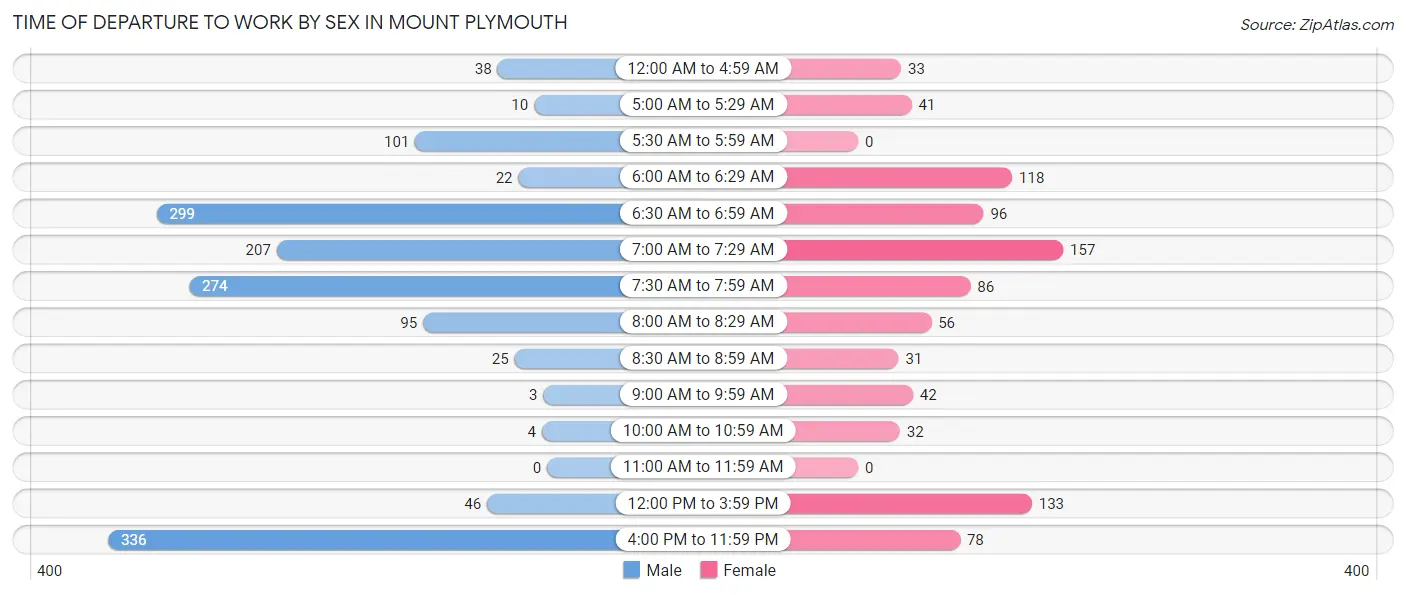
| Time of Departure | Male | Female |
| 12:00 AM to 4:59 AM | 38 (2.6%) | 33 (3.6%) |
| 5:00 AM to 5:29 AM | 10 (0.7%) | 41 (4.5%) |
| 5:30 AM to 5:59 AM | 101 (6.9%) | 0 (0.0%) |
| 6:00 AM to 6:29 AM | 22 (1.5%) | 118 (13.1%) |
| 6:30 AM to 6:59 AM | 299 (20.5%) | 96 (10.6%) |
| 7:00 AM to 7:29 AM | 207 (14.2%) | 157 (17.4%) |
| 7:30 AM to 7:59 AM | 274 (18.8%) | 86 (9.5%) |
| 8:00 AM to 8:29 AM | 95 (6.5%) | 56 (6.2%) |
| 8:30 AM to 8:59 AM | 25 (1.7%) | 31 (3.4%) |
| 9:00 AM to 9:59 AM | 3 (0.2%) | 42 (4.6%) |
| 10:00 AM to 10:59 AM | 4 (0.3%) | 32 (3.5%) |
| 11:00 AM to 11:59 AM | 0 (0.0%) | 0 (0.0%) |
| 12:00 PM to 3:59 PM | 46 (3.2%) | 133 (14.7%) |
| 4:00 PM to 11:59 PM | 336 (23.0%) | 78 (8.6%) |
| Total | 1,460 (100.0%) | 903 (100.0%) |
Housing Occupancy in Mount Plymouth
Occupancy by Ownership in Mount Plymouth
Of the total 1,806 dwellings in Mount Plymouth, owner-occupied units account for 1,629 (90.2%), while renter-occupied units make up 177 (9.8%).
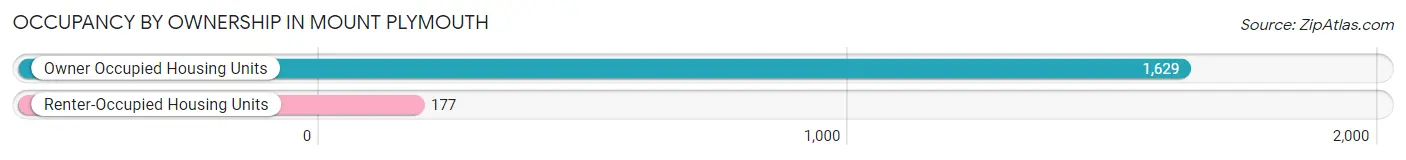
| Occupancy | # Housing Units | % Housing Units |
| Owner Occupied Housing Units | 1,629 | 90.2% |
| Renter-Occupied Housing Units | 177 | 9.8% |
| Total Occupied Housing Units | 1,806 | 100.0% |
Occupancy by Household Size in Mount Plymouth
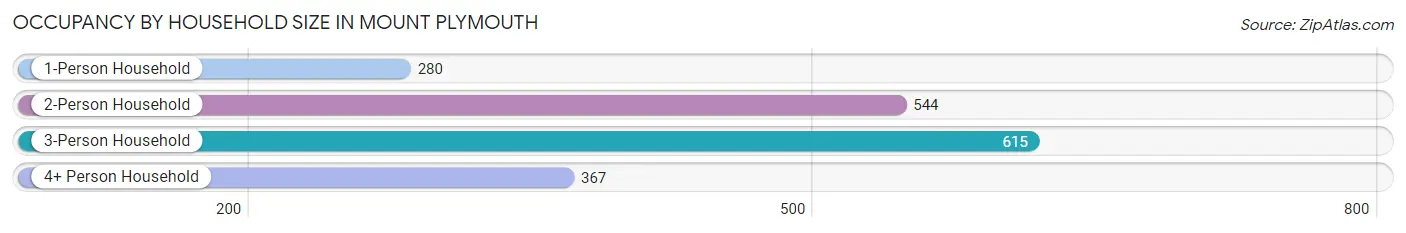
| Household Size | # Housing Units | % Housing Units |
| 1-Person Household | 280 | 15.5% |
| 2-Person Household | 544 | 30.1% |
| 3-Person Household | 615 | 34.1% |
| 4+ Person Household | 367 | 20.3% |
| Total Housing Units | 1,806 | 100.0% |
Occupancy by Ownership by Household Size in Mount Plymouth
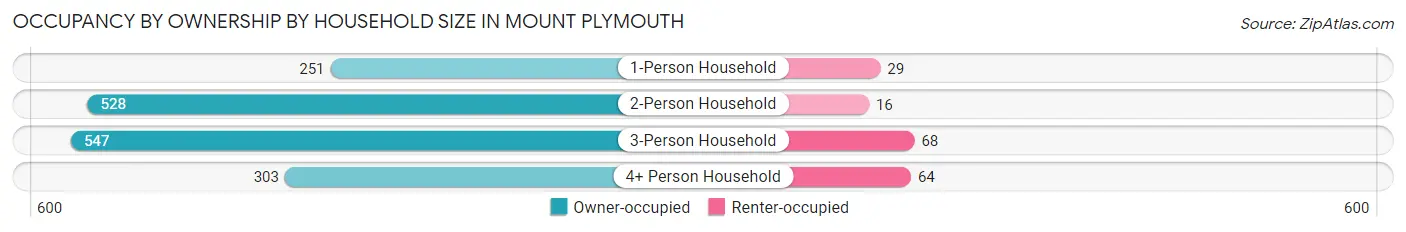
| Household Size | Owner-occupied | Renter-occupied |
| 1-Person Household | 251 (89.6%) | 29 (10.4%) |
| 2-Person Household | 528 (97.1%) | 16 (2.9%) |
| 3-Person Household | 547 (88.9%) | 68 (11.1%) |
| 4+ Person Household | 303 (82.6%) | 64 (17.4%) |
| Total Housing Units | 1,629 (90.2%) | 177 (9.8%) |
Occupancy by Educational Attainment in Mount Plymouth
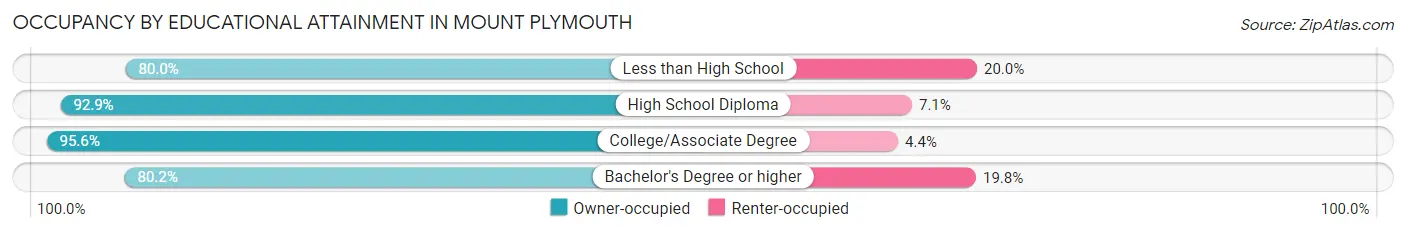
| Household Size | Owner-occupied | Renter-occupied |
| Less than High School | 132 (80.0%) | 33 (20.0%) |
| High School Diploma | 209 (92.9%) | 16 (7.1%) |
| College/Associate Degree | 944 (95.6%) | 43 (4.4%) |
| Bachelor's Degree or higher | 344 (80.2%) | 85 (19.8%) |
Occupancy by Age of Householder in Mount Plymouth
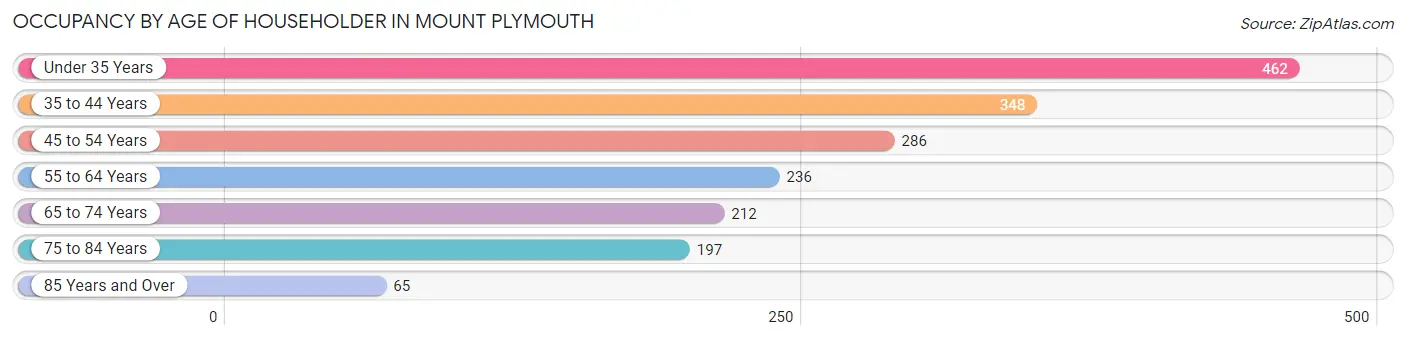
| Age Bracket | # Households | % Households |
| Under 35 Years | 462 | 25.6% |
| 35 to 44 Years | 348 | 19.3% |
| 45 to 54 Years | 286 | 15.8% |
| 55 to 64 Years | 236 | 13.1% |
| 65 to 74 Years | 212 | 11.7% |
| 75 to 84 Years | 197 | 10.9% |
| 85 Years and Over | 65 | 3.6% |
| Total | 1,806 | 100.0% |
Housing Finances in Mount Plymouth
Median Income by Occupancy in Mount Plymouth
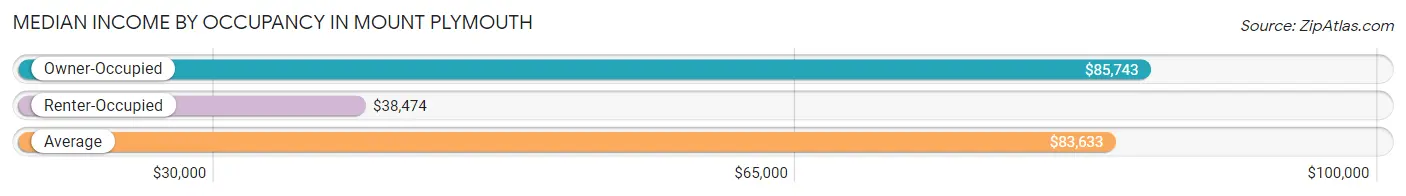
| Occupancy Type | # Households | Median Income |
| Owner-Occupied | 1,629 (90.2%) | $85,743 |
| Renter-Occupied | 177 (9.8%) | $38,474 |
| Average | 1,806 (100.0%) | $83,633 |
Occupancy by Householder Income Bracket in Mount Plymouth
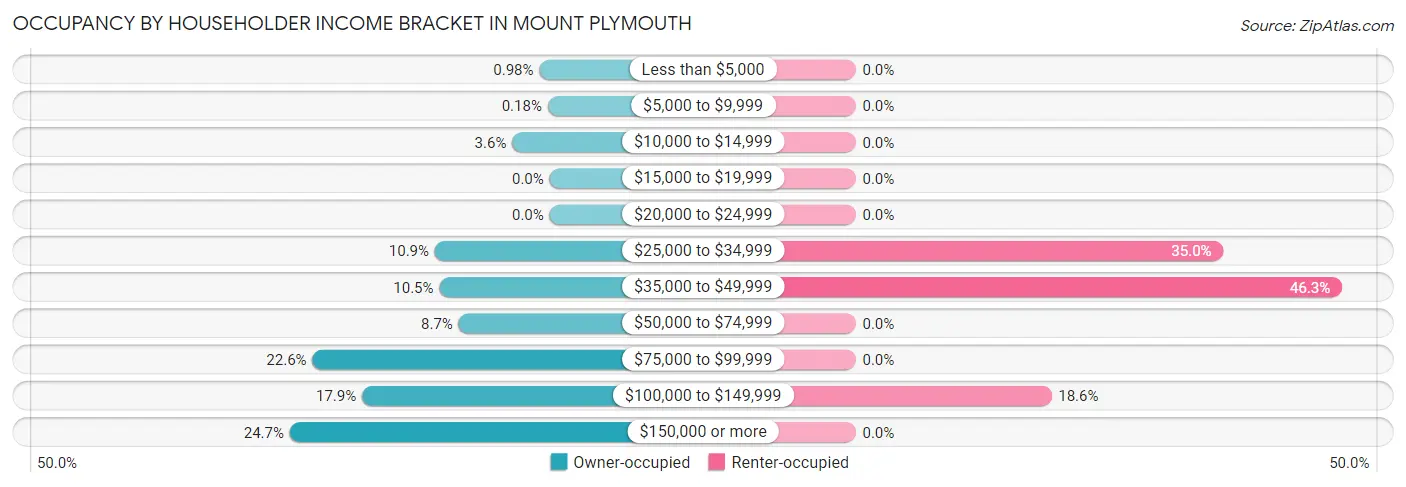
| Income Bracket | Owner-occupied | Renter-occupied |
| Less than $5,000 | 16 (1.0%) | 0 (0.0%) |
| $5,000 to $9,999 | 3 (0.2%) | 0 (0.0%) |
| $10,000 to $14,999 | 58 (3.6%) | 0 (0.0%) |
| $15,000 to $19,999 | 0 (0.0%) | 0 (0.0%) |
| $20,000 to $24,999 | 0 (0.0%) | 0 (0.0%) |
| $25,000 to $34,999 | 178 (10.9%) | 62 (35.0%) |
| $35,000 to $49,999 | 171 (10.5%) | 82 (46.3%) |
| $50,000 to $74,999 | 141 (8.7%) | 0 (0.0%) |
| $75,000 to $99,999 | 368 (22.6%) | 0 (0.0%) |
| $100,000 to $149,999 | 291 (17.9%) | 33 (18.6%) |
| $150,000 or more | 403 (24.7%) | 0 (0.0%) |
| Total | 1,629 (100.0%) | 177 (100.0%) |
Monthly Housing Cost Tiers in Mount Plymouth
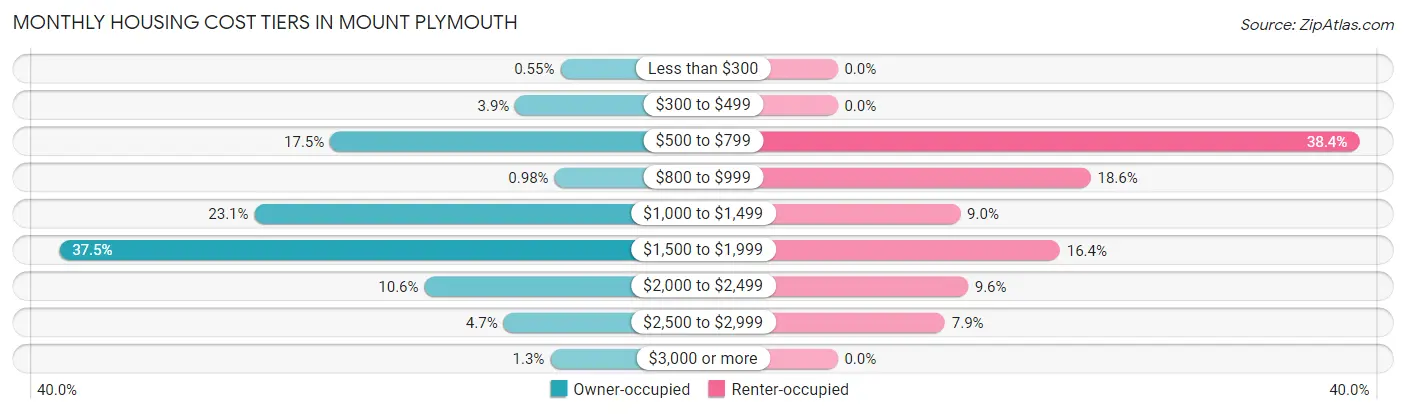
| Monthly Cost | Owner-occupied | Renter-occupied |
| Less than $300 | 9 (0.5%) | 0 (0.0%) |
| $300 to $499 | 63 (3.9%) | 0 (0.0%) |
| $500 to $799 | 285 (17.5%) | 68 (38.4%) |
| $800 to $999 | 16 (1.0%) | 33 (18.6%) |
| $1,000 to $1,499 | 376 (23.1%) | 16 (9.0%) |
| $1,500 to $1,999 | 610 (37.4%) | 29 (16.4%) |
| $2,000 to $2,499 | 172 (10.6%) | 17 (9.6%) |
| $2,500 to $2,999 | 77 (4.7%) | 14 (7.9%) |
| $3,000 or more | 21 (1.3%) | 0 (0.0%) |
| Total | 1,629 (100.0%) | 177 (100.0%) |
Physical Housing Characteristics in Mount Plymouth
Housing Structures in Mount Plymouth
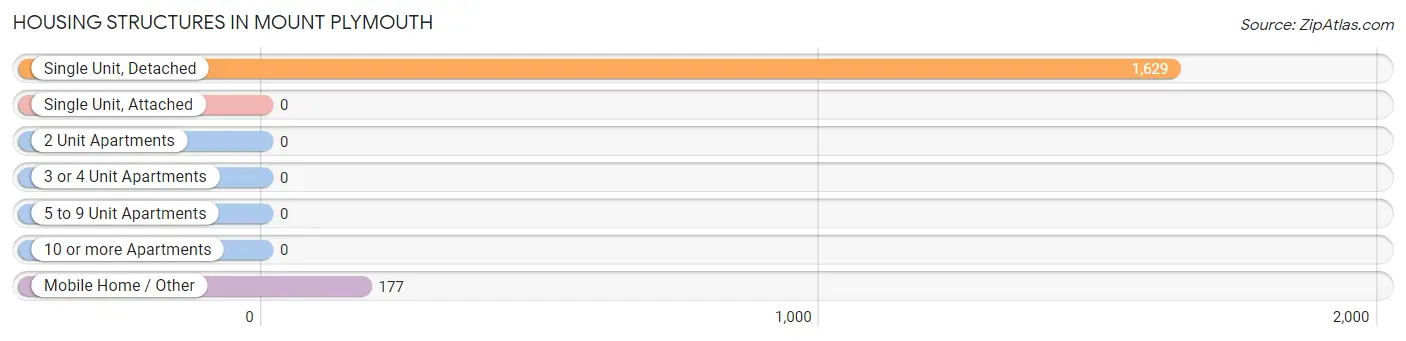
| Structure Type | # Housing Units | % Housing Units |
| Single Unit, Detached | 1,629 | 90.2% |
| Single Unit, Attached | 0 | 0.0% |
| 2 Unit Apartments | 0 | 0.0% |
| 3 or 4 Unit Apartments | 0 | 0.0% |
| 5 to 9 Unit Apartments | 0 | 0.0% |
| 10 or more Apartments | 0 | 0.0% |
| Mobile Home / Other | 177 | 9.8% |
| Total | 1,806 | 100.0% |
Housing Structures by Occupancy in Mount Plymouth
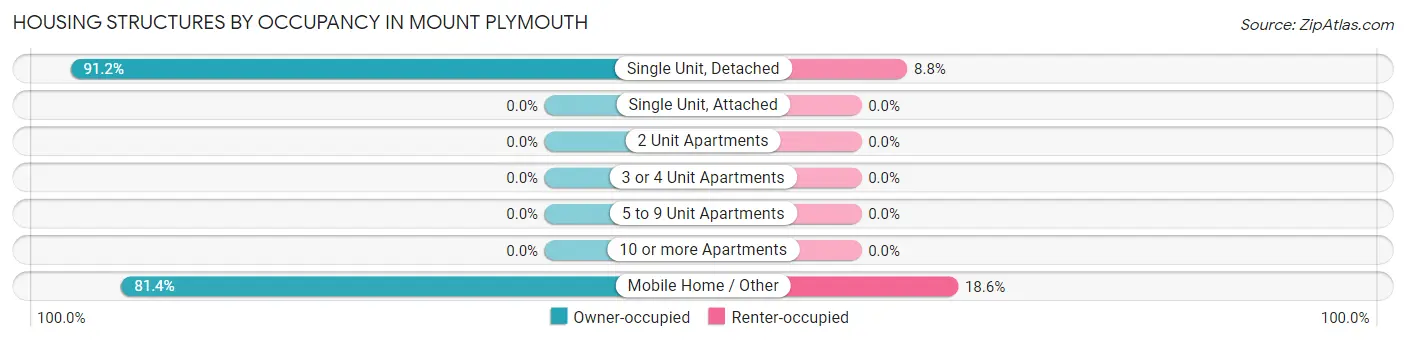
| Structure Type | Owner-occupied | Renter-occupied |
| Single Unit, Detached | 1,485 (91.2%) | 144 (8.8%) |
| Single Unit, Attached | 0 (0.0%) | 0 (0.0%) |
| 2 Unit Apartments | 0 (0.0%) | 0 (0.0%) |
| 3 or 4 Unit Apartments | 0 (0.0%) | 0 (0.0%) |
| 5 to 9 Unit Apartments | 0 (0.0%) | 0 (0.0%) |
| 10 or more Apartments | 0 (0.0%) | 0 (0.0%) |
| Mobile Home / Other | 144 (81.4%) | 33 (18.6%) |
| Total | 1,629 (90.2%) | 177 (9.8%) |
Housing Structures by Number of Rooms in Mount Plymouth
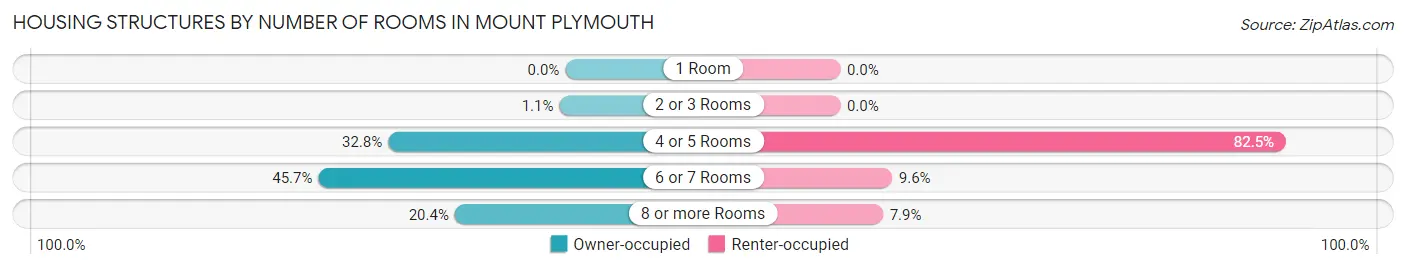
| Number of Rooms | Owner-occupied | Renter-occupied |
| 1 Room | 0 (0.0%) | 0 (0.0%) |
| 2 or 3 Rooms | 18 (1.1%) | 0 (0.0%) |
| 4 or 5 Rooms | 534 (32.8%) | 146 (82.5%) |
| 6 or 7 Rooms | 744 (45.7%) | 17 (9.6%) |
| 8 or more Rooms | 333 (20.4%) | 14 (7.9%) |
| Total | 1,629 (100.0%) | 177 (100.0%) |
Housing Structure by Heating Type in Mount Plymouth
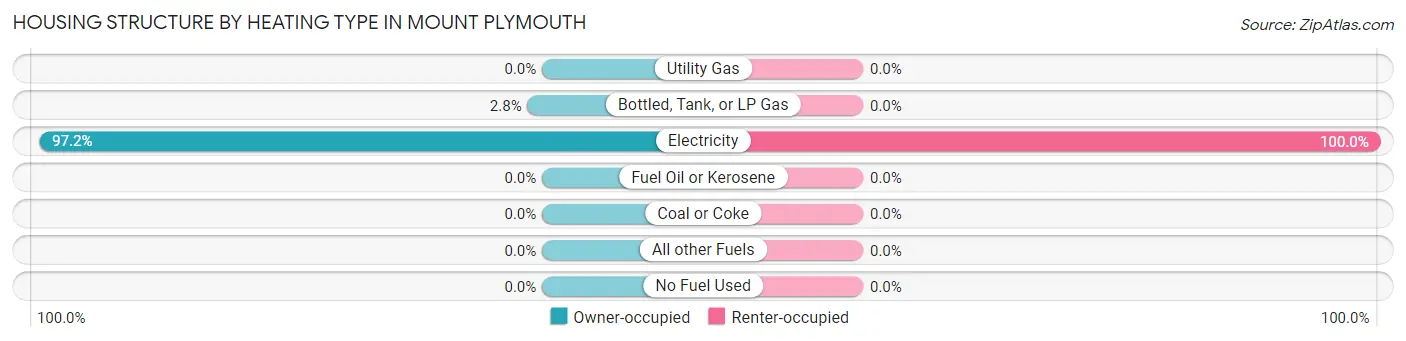
| Heating Type | Owner-occupied | Renter-occupied |
| Utility Gas | 0 (0.0%) | 0 (0.0%) |
| Bottled, Tank, or LP Gas | 46 (2.8%) | 0 (0.0%) |
| Electricity | 1,583 (97.2%) | 177 (100.0%) |
| Fuel Oil or Kerosene | 0 (0.0%) | 0 (0.0%) |
| Coal or Coke | 0 (0.0%) | 0 (0.0%) |
| All other Fuels | 0 (0.0%) | 0 (0.0%) |
| No Fuel Used | 0 (0.0%) | 0 (0.0%) |
| Total | 1,629 (100.0%) | 177 (100.0%) |
Household Vehicle Usage in Mount Plymouth
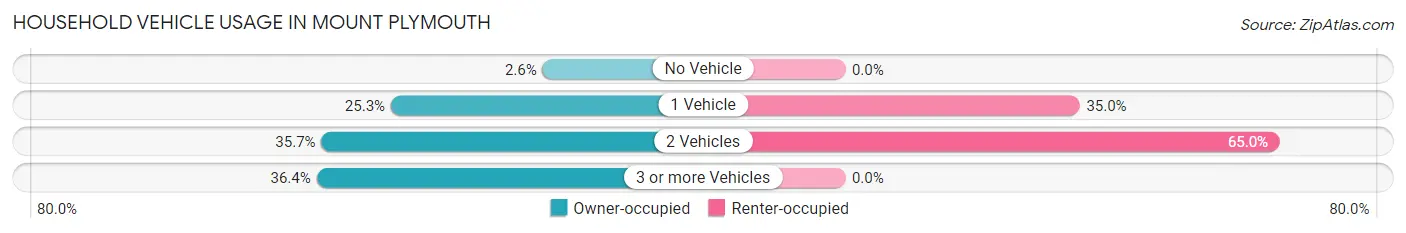
| Vehicles per Household | Owner-occupied | Renter-occupied |
| No Vehicle | 43 (2.6%) | 0 (0.0%) |
| 1 Vehicle | 412 (25.3%) | 62 (35.0%) |
| 2 Vehicles | 581 (35.7%) | 115 (65.0%) |
| 3 or more Vehicles | 593 (36.4%) | 0 (0.0%) |
| Total | 1,629 (100.0%) | 177 (100.0%) |
Real Estate & Mortgages in Mount Plymouth
Real Estate and Mortgage Overview in Mount Plymouth
| Characteristic | Without Mortgage | With Mortgage |
| Housing Units | 290 | 1,339 |
| Median Property Value | $326,900 | $281,700 |
| Median Household Income | $38,852 | $379 |
| Monthly Housing Costs | $574 | $21 |
| Real Estate Taxes | $4,250 | $97 |
Property Value by Mortgage Status in Mount Plymouth
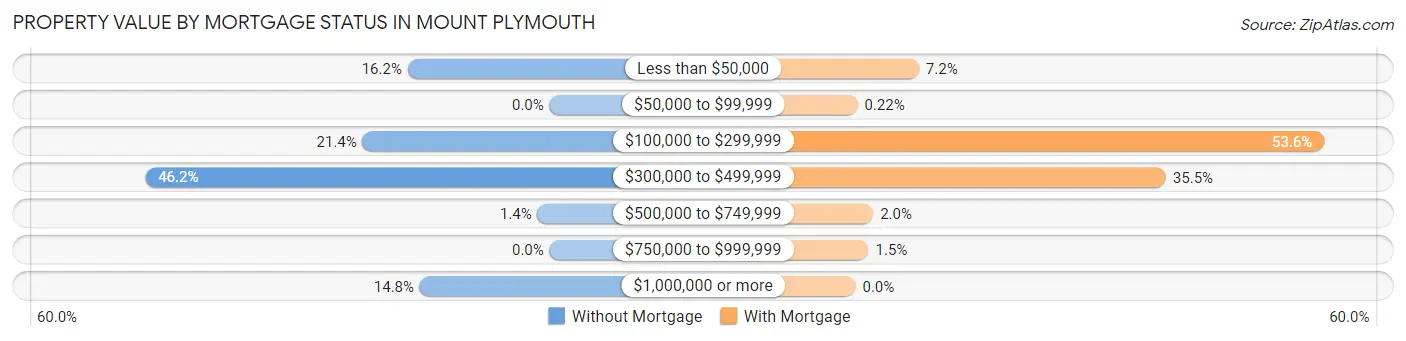
| Property Value | Without Mortgage | With Mortgage |
| Less than $50,000 | 47 (16.2%) | 97 (7.2%) |
| $50,000 to $99,999 | 0 (0.0%) | 3 (0.2%) |
| $100,000 to $299,999 | 62 (21.4%) | 717 (53.5%) |
| $300,000 to $499,999 | 134 (46.2%) | 475 (35.5%) |
| $500,000 to $749,999 | 4 (1.4%) | 27 (2.0%) |
| $750,000 to $999,999 | 0 (0.0%) | 20 (1.5%) |
| $1,000,000 or more | 43 (14.8%) | 0 (0.0%) |
| Total | 290 (100.0%) | 1,339 (100.0%) |
Household Income by Mortgage Status in Mount Plymouth
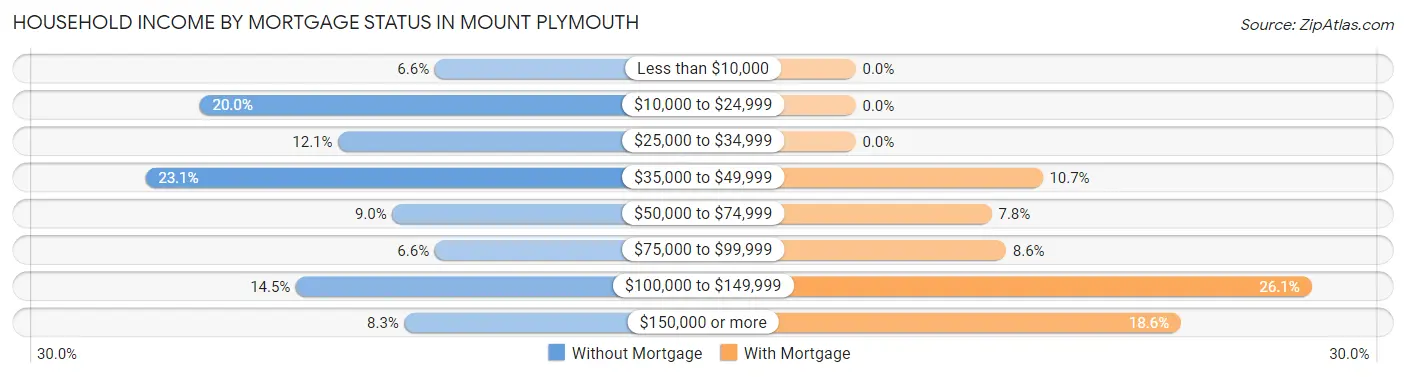
| Household Income | Without Mortgage | With Mortgage |
| Less than $10,000 | 19 (6.6%) | 0 (0.0%) |
| $10,000 to $24,999 | 58 (20.0%) | 0 (0.0%) |
| $25,000 to $34,999 | 35 (12.1%) | 0 (0.0%) |
| $35,000 to $49,999 | 67 (23.1%) | 143 (10.7%) |
| $50,000 to $74,999 | 26 (9.0%) | 104 (7.8%) |
| $75,000 to $99,999 | 19 (6.6%) | 115 (8.6%) |
| $100,000 to $149,999 | 42 (14.5%) | 349 (26.1%) |
| $150,000 or more | 24 (8.3%) | 249 (18.6%) |
| Total | 290 (100.0%) | 1,339 (100.0%) |
Property Value to Household Income Ratio in Mount Plymouth
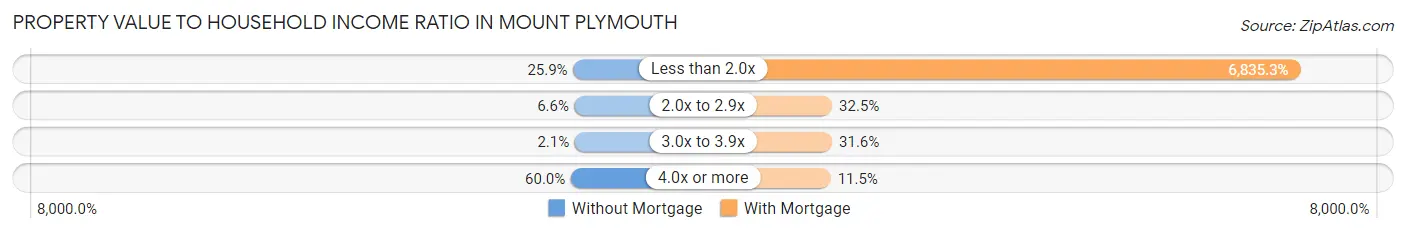
| Value-to-Income Ratio | Without Mortgage | With Mortgage |
| Less than 2.0x | 75 (25.9%) | 91,525 (6,835.3%) |
| 2.0x to 2.9x | 19 (6.6%) | 435 (32.5%) |
| 3.0x to 3.9x | 6 (2.1%) | 423 (31.6%) |
| 4.0x or more | 174 (60.0%) | 154 (11.5%) |
| Total | 290 (100.0%) | 1,339 (100.0%) |
Real Estate Taxes by Mortgage Status in Mount Plymouth
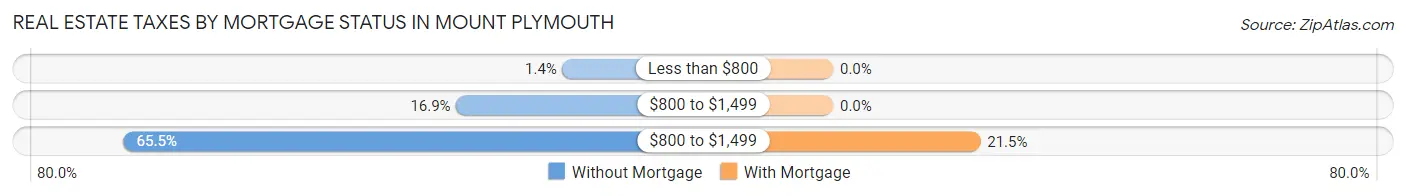
| Property Taxes | Without Mortgage | With Mortgage |
| Less than $800 | 4 (1.4%) | 0 (0.0%) |
| $800 to $1,499 | 49 (16.9%) | 0 (0.0%) |
| $800 to $1,499 | 190 (65.5%) | 288 (21.5%) |
| Total | 290 (100.0%) | 1,339 (100.0%) |
Health & Disability in Mount Plymouth
Health Insurance Coverage by Age in Mount Plymouth
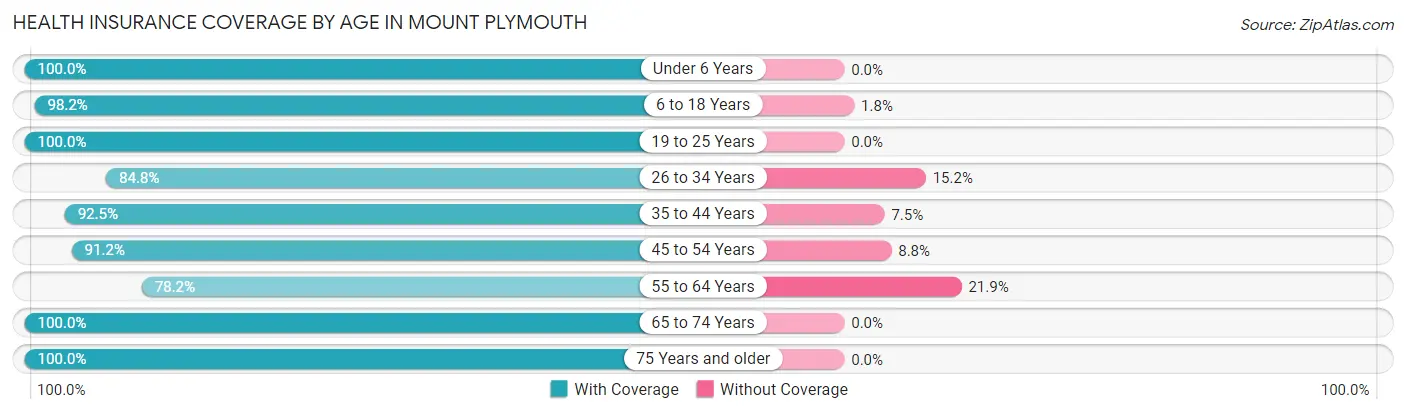
| Age Bracket | With Coverage | Without Coverage |
| Under 6 Years | 368 (100.0%) | 0 (0.0%) |
| 6 to 18 Years | 588 (98.2%) | 11 (1.8%) |
| 19 to 25 Years | 208 (100.0%) | 0 (0.0%) |
| 26 to 34 Years | 737 (84.8%) | 132 (15.2%) |
| 35 to 44 Years | 889 (92.5%) | 72 (7.5%) |
| 45 to 54 Years | 458 (91.2%) | 44 (8.8%) |
| 55 to 64 Years | 304 (78.1%) | 85 (21.8%) |
| 65 to 74 Years | 564 (100.0%) | 0 (0.0%) |
| 75 Years and older | 338 (100.0%) | 0 (0.0%) |
| Total | 4,454 (92.8%) | 344 (7.2%) |
Health Insurance Coverage by Citizenship Status in Mount Plymouth
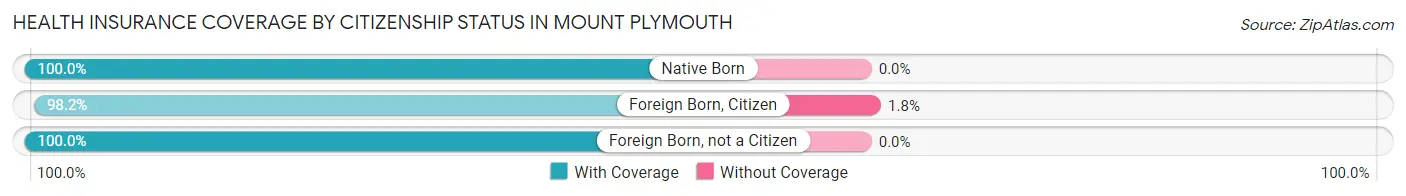
| Citizenship Status | With Coverage | Without Coverage |
| Native Born | 368 (100.0%) | 0 (0.0%) |
| Foreign Born, Citizen | 588 (98.2%) | 11 (1.8%) |
| Foreign Born, not a Citizen | 208 (100.0%) | 0 (0.0%) |
Health Insurance Coverage by Household Income in Mount Plymouth
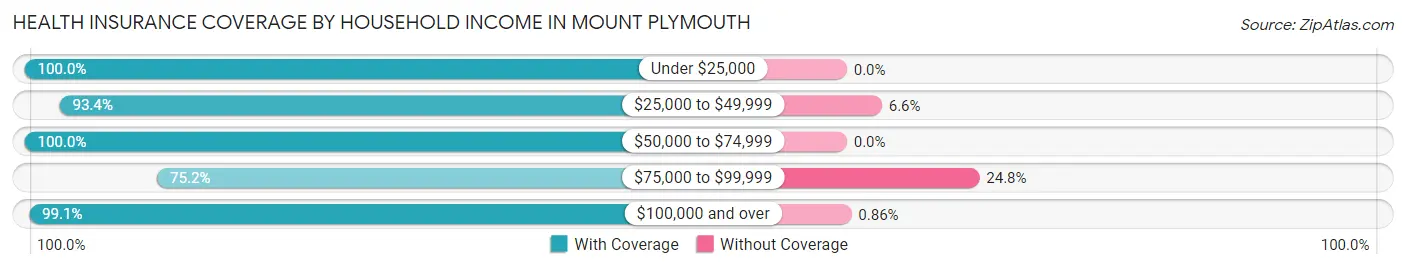
| Household Income | With Coverage | Without Coverage |
| Under $25,000 | 80 (100.0%) | 0 (0.0%) |
| $25,000 to $49,999 | 1,225 (93.4%) | 86 (6.6%) |
| $50,000 to $74,999 | 236 (100.0%) | 0 (0.0%) |
| $75,000 to $99,999 | 723 (75.2%) | 239 (24.8%) |
| $100,000 and over | 2,190 (99.1%) | 19 (0.9%) |
Public vs Private Health Insurance Coverage by Age in Mount Plymouth
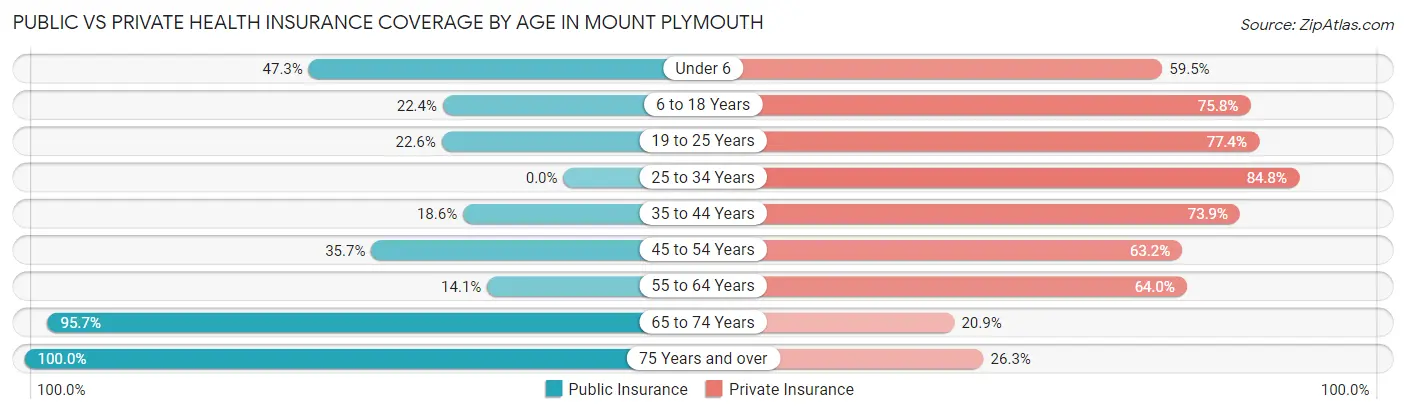
| Age Bracket | Public Insurance | Private Insurance |
| Under 6 | 174 (47.3%) | 219 (59.5%) |
| 6 to 18 Years | 134 (22.4%) | 454 (75.8%) |
| 19 to 25 Years | 47 (22.6%) | 161 (77.4%) |
| 25 to 34 Years | 0 (0.0%) | 737 (84.8%) |
| 35 to 44 Years | 179 (18.6%) | 710 (73.9%) |
| 45 to 54 Years | 179 (35.7%) | 317 (63.1%) |
| 55 to 64 Years | 55 (14.1%) | 249 (64.0%) |
| 65 to 74 Years | 540 (95.7%) | 118 (20.9%) |
| 75 Years and over | 338 (100.0%) | 89 (26.3%) |
| Total | 1,646 (34.3%) | 3,054 (63.6%) |
Disability Status by Sex by Age in Mount Plymouth
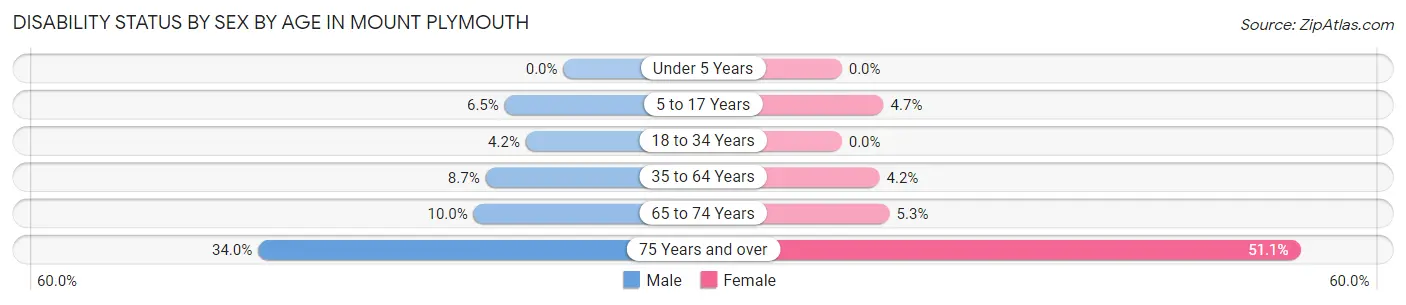
| Age Bracket | Male | Female |
| Under 5 Years | 0 (0.0%) | 0 (0.0%) |
| 5 to 17 Years | 24 (6.5%) | 15 (4.7%) |
| 18 to 34 Years | 25 (4.2%) | 0 (0.0%) |
| 35 to 64 Years | 74 (8.7%) | 42 (4.2%) |
| 65 to 74 Years | 32 (10.0%) | 13 (5.3%) |
| 75 Years and over | 51 (34.0%) | 96 (51.1%) |
Disability Class by Sex by Age in Mount Plymouth
Disability Class: Hearing Difficulty
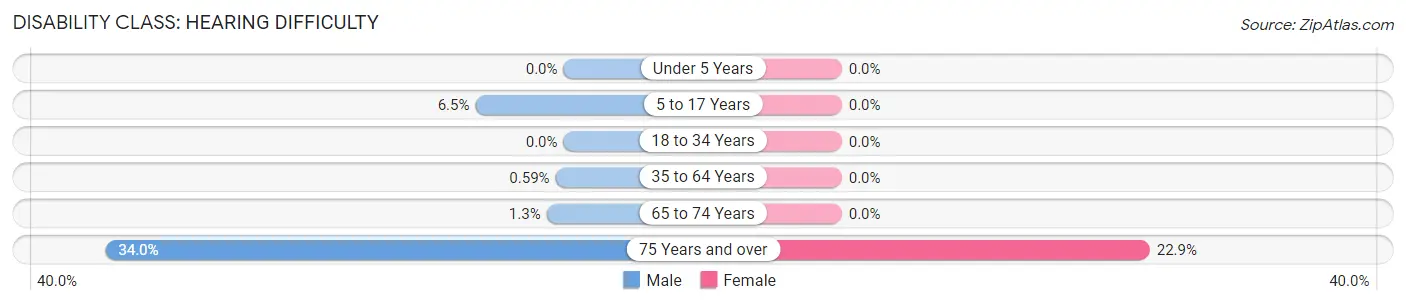
| Age Bracket | Male | Female |
| Under 5 Years | 0 (0.0%) | 0 (0.0%) |
| 5 to 17 Years | 24 (6.5%) | 0 (0.0%) |
| 18 to 34 Years | 0 (0.0%) | 0 (0.0%) |
| 35 to 64 Years | 5 (0.6%) | 0 (0.0%) |
| 65 to 74 Years | 4 (1.3%) | 0 (0.0%) |
| 75 Years and over | 51 (34.0%) | 43 (22.9%) |
Disability Class: Vision Difficulty
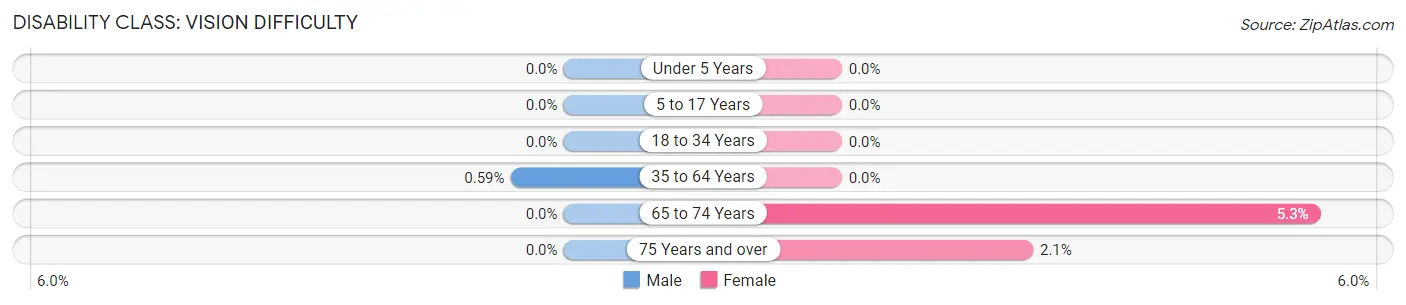
| Age Bracket | Male | Female |
| Under 5 Years | 0 (0.0%) | 0 (0.0%) |
| 5 to 17 Years | 0 (0.0%) | 0 (0.0%) |
| 18 to 34 Years | 0 (0.0%) | 0 (0.0%) |
| 35 to 64 Years | 5 (0.6%) | 0 (0.0%) |
| 65 to 74 Years | 0 (0.0%) | 13 (5.3%) |
| 75 Years and over | 0 (0.0%) | 4 (2.1%) |
Disability Class: Cognitive Difficulty
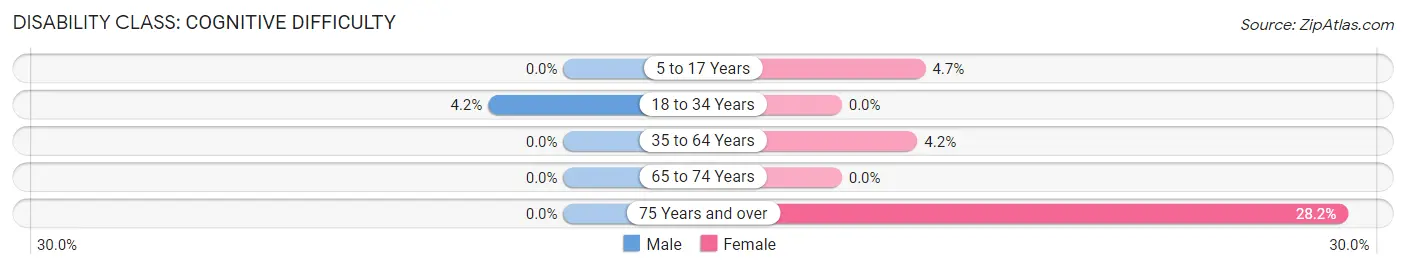
| Age Bracket | Male | Female |
| 5 to 17 Years | 0 (0.0%) | 15 (4.7%) |
| 18 to 34 Years | 25 (4.2%) | 0 (0.0%) |
| 35 to 64 Years | 0 (0.0%) | 42 (4.2%) |
| 65 to 74 Years | 0 (0.0%) | 0 (0.0%) |
| 75 Years and over | 0 (0.0%) | 53 (28.2%) |
Disability Class: Ambulatory Difficulty
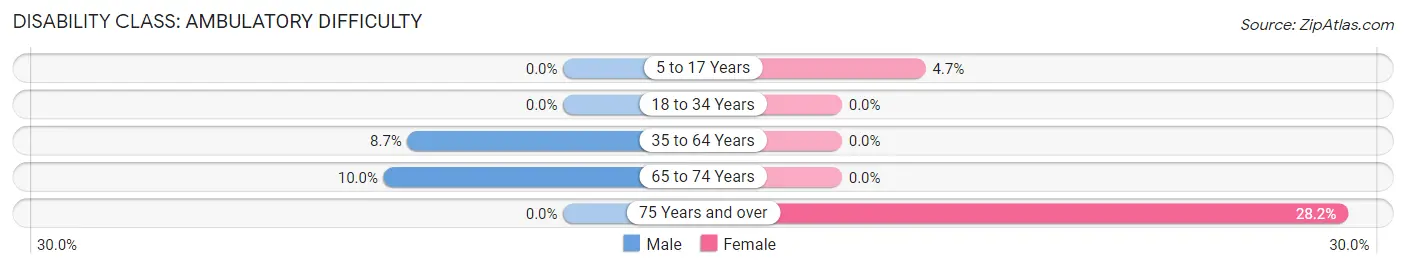
| Age Bracket | Male | Female |
| 5 to 17 Years | 0 (0.0%) | 15 (4.7%) |
| 18 to 34 Years | 0 (0.0%) | 0 (0.0%) |
| 35 to 64 Years | 74 (8.7%) | 0 (0.0%) |
| 65 to 74 Years | 32 (10.0%) | 0 (0.0%) |
| 75 Years and over | 0 (0.0%) | 53 (28.2%) |
Disability Class: Self-Care Difficulty
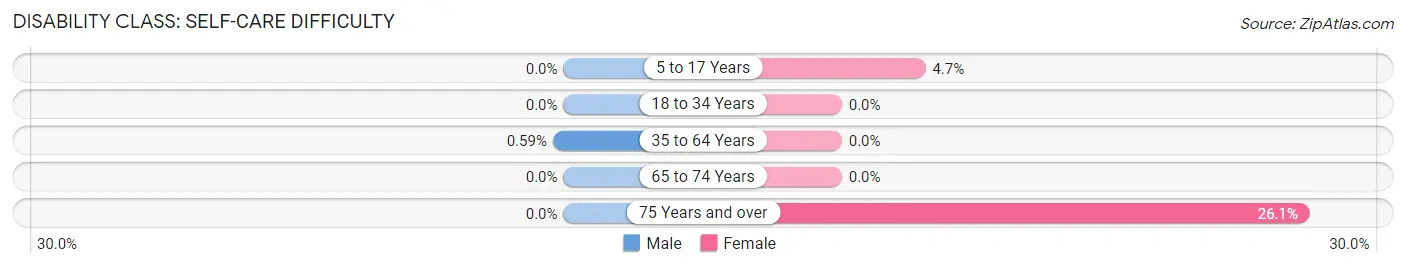
| Age Bracket | Male | Female |
| 5 to 17 Years | 0 (0.0%) | 15 (4.7%) |
| 18 to 34 Years | 0 (0.0%) | 0 (0.0%) |
| 35 to 64 Years | 5 (0.6%) | 0 (0.0%) |
| 65 to 74 Years | 0 (0.0%) | 0 (0.0%) |
| 75 Years and over | 0 (0.0%) | 49 (26.1%) |
Technology Access in Mount Plymouth
Computing Device Access in Mount Plymouth
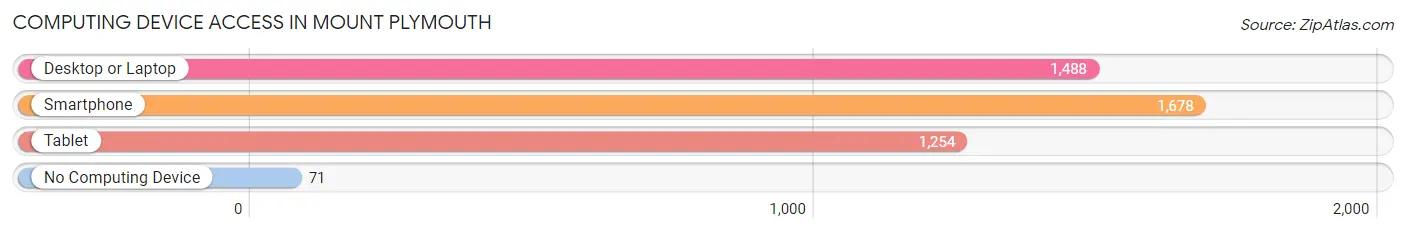
| Device Type | # Households | % Households |
| Desktop or Laptop | 1,488 | 82.4% |
| Smartphone | 1,678 | 92.9% |
| Tablet | 1,254 | 69.4% |
| No Computing Device | 71 | 3.9% |
| Total | 1,806 | 100.0% |
Internet Access in Mount Plymouth
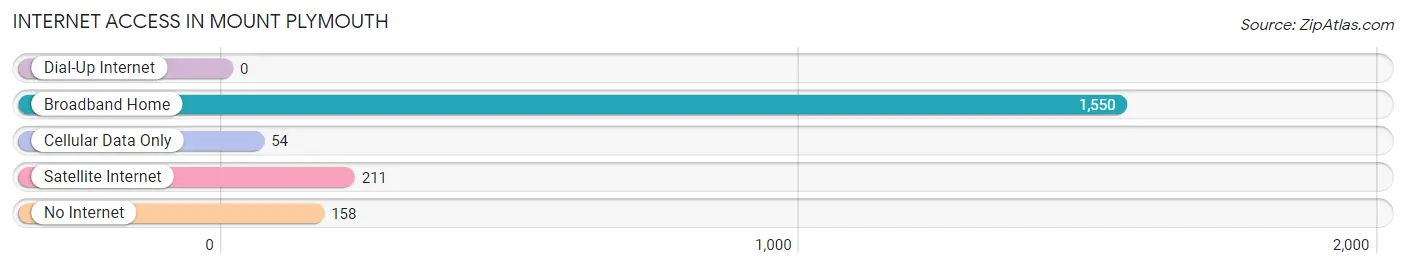
| Internet Type | # Households | % Households |
| Dial-Up Internet | 0 | 0.0% |
| Broadband Home | 1,550 | 85.8% |
| Cellular Data Only | 54 | 3.0% |
| Satellite Internet | 211 | 11.7% |
| No Internet | 158 | 8.7% |
| Total | 1,806 | 100.0% |
Mount Plymouth Summary
Plymouth, Florida is a small town located in Washington County, in the panhandle of Florida. It is situated on the banks of the Choctawhatchee River, and is part of the Chipley Micropolitan Statistical Area. The town was founded in 1845, and has a population of just over 1,000 people.
History
Plymouth was founded in 1845 by a group of settlers from Georgia and Alabama. The town was named after Plymouth, Massachusetts, and was originally a trading post for the local Native American tribes. The town was incorporated in 1887, and the first post office was established in 1891.
In the early 1900s, the town was a major center for the timber industry, and the local economy was largely based on the production of lumber. The town also had a thriving agricultural industry, and was home to several cotton gins and sawmills.
In the 1950s, the town began to decline as the timber industry moved away from the area. The town was also affected by the Great Depression, and many of the businesses in the area closed.
Geography
Plymouth is located in Washington County, in the panhandle of Florida. It is situated on the banks of the Choctawhatchee River, and is part of the Chipley Micropolitan Statistical Area. The town is located about 25 miles south of the Alabama border, and about 50 miles east of the Mississippi border.
The town has a total area of 1.2 square miles, all of which is land. The town is located in a humid subtropical climate zone, and has hot, humid summers and mild winters.
Economy
The economy of Plymouth is largely based on agriculture and tourism. The town is home to several farms, and the local economy is supported by the production of cotton, corn, soybeans, and other crops. The town is also home to several tourist attractions, including the Choctawhatchee River, which is popular for fishing and boating.
The town is also home to several small businesses, including restaurants, retail stores, and other services. The town is also home to a few manufacturing companies, which produce a variety of products, including furniture, clothing, and other items.
Demographics
As of the 2010 census, the population of Plymouth was 1,072. The racial makeup of the town was 94.3% White, 3.2% African American, 0.3% Native American, 0.2% Asian, 0.1% Pacific Islander, 0.7% from other races, and 1.3% from two or more races. Hispanic or Latino of any race were 2.2% of the population.
The median household income in Plymouth was $30,938, and the median family income was $37,500. The per capita income for the town was $15,945. About 17.2% of the population was below the poverty line.
Common Questions
What is the Total Population of Mount Plymouth?
Total Population of Mount Plymouth is 4,798.
What is the Total Male Population of Mount Plymouth?
Total Male Population of Mount Plymouth is 2,484.
What is the Total Female Population of Mount Plymouth?
Total Female Population of Mount Plymouth is 2,314.
What is the Ratio of Males per 100 Females in Mount Plymouth?
There are 107.35 Males per 100 Females in Mount Plymouth.
What is the Ratio of Females per 100 Males in Mount Plymouth?
There are 93.16 Females per 100 Males in Mount Plymouth.
What is the Median Population Age in Mount Plymouth?
Median Population Age in Mount Plymouth is 37.3 Years.
What is the Average Family Size in Mount Plymouth
Average Family Size in Mount Plymouth is 2.9 People.
What is the Average Household Size in Mount Plymouth
Average Household Size in Mount Plymouth is 2.7 People.
What is Per Capita Income in Mount Plymouth?
Per Capita income in Mount Plymouth is $35,554.
What is the Median Family Income in Mount Plymouth?
Median Family Income in Mount Plymouth is $86,413.
What is the Median Household income in Mount Plymouth?
Median Household Income in Mount Plymouth is $83,633.
What is Income or Wage Gap in Mount Plymouth?
Income or Wage Gap in Mount Plymouth is 30.8%.
Women in Mount Plymouth earn 69.2 cents for every dollar earned by a man.
What is Inequality or Gini Index in Mount Plymouth?
Inequality or Gini Index in Mount Plymouth is 0.36.
How Large is the Labor Force in Mount Plymouth?
There are 2,823 People in the Labor Forcein in Mount Plymouth.
What is the Percentage of People in the Labor Force in Mount Plymouth?
70.9% of People are in the Labor Force in Mount Plymouth.
What is the Unemployment Rate in Mount Plymouth?
Unemployment Rate in Mount Plymouth is 2.4%.