Medulla, FL
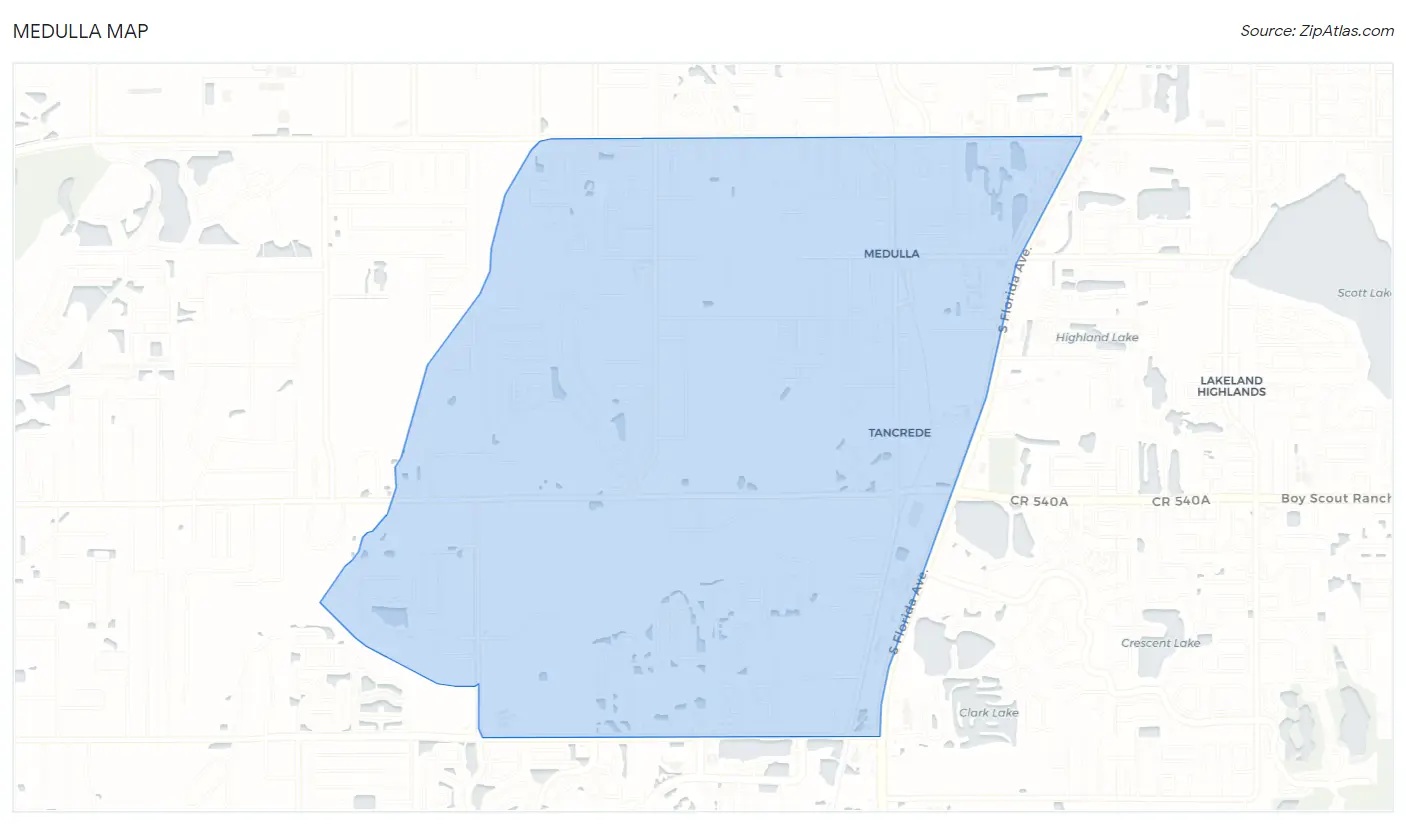
Medulla Map
Medulla Overview
11,355
TOTAL POPULATION
5,747
MALE POPULATION
5,608
FEMALE POPULATION
102.48
MALES / 100 FEMALES
97.58
FEMALES / 100 MALES
36.8
MEDIAN AGE
3.2
AVG FAMILY SIZE
2.8
AVG HOUSEHOLD SIZE
$34,009
PER CAPITA INCOME
$86,987
AVG FAMILY INCOME
$72,639
AVG HOUSEHOLD INCOME
20.1%
WAGE / INCOME GAP [ % ]
79.9¢/ $1
WAGE / INCOME GAP [ $ ]
0.42
INEQUALITY / GINI INDEX
5,769
LABOR FORCE [ PEOPLE ]
62.7%
PERCENT IN LABOR FORCE
2.9%
UNEMPLOYMENT RATE
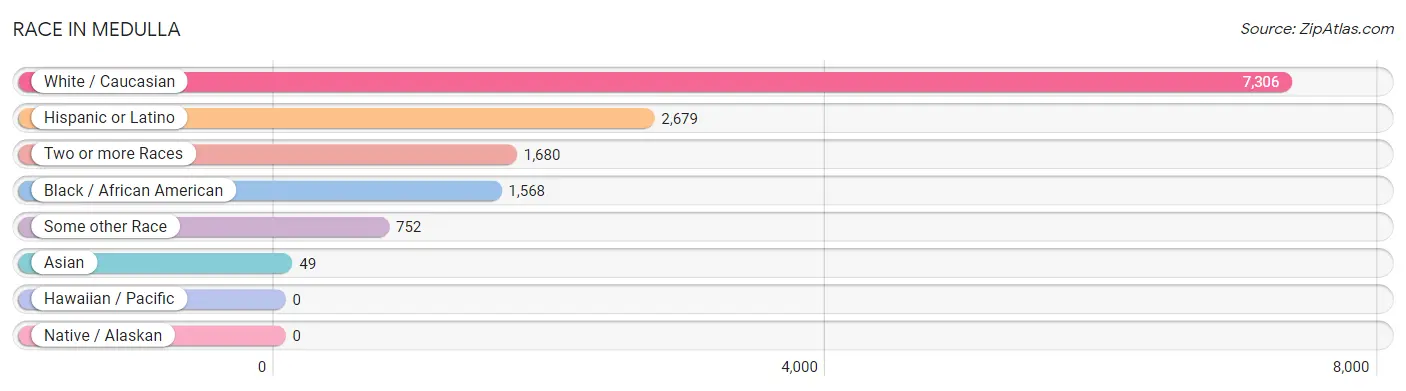
Race in Medulla
The most populous races in Medulla are White / Caucasian (7,306 | 64.3%), Hispanic or Latino (2,679 | 23.6%), and Two or more Races (1,680 | 14.8%).
| Race | # Population | % Population |
| Asian | 49 | 0.4% |
| Black / African American | 1,568 | 13.8% |
| Hawaiian / Pacific | 0 | 0.0% |
| Hispanic or Latino | 2,679 | 23.6% |
| Native / Alaskan | 0 | 0.0% |
| White / Caucasian | 7,306 | 64.3% |
| Two or more Races | 1,680 | 14.8% |
| Some other Race | 752 | 6.6% |
| Total | 11,355 | 100.0% |
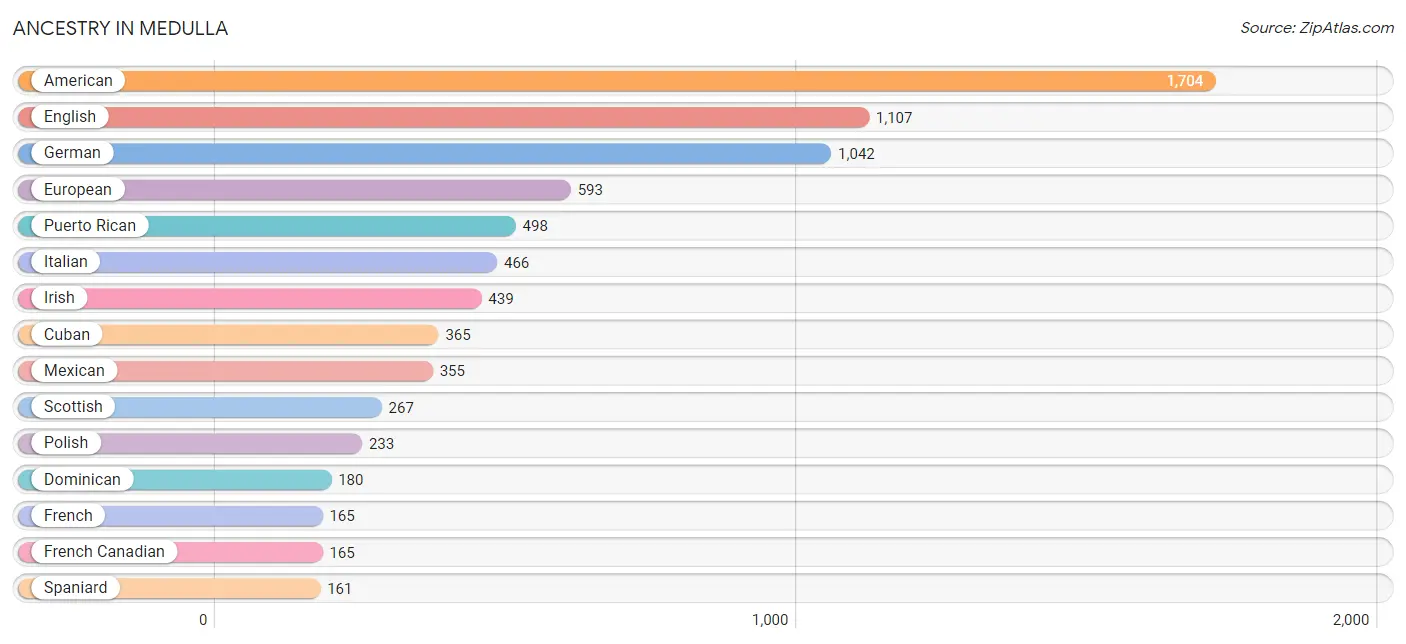
Ancestry in Medulla
The most populous ancestries reported in Medulla are American (1,704 | 15.0%), English (1,107 | 9.8%), German (1,042 | 9.2%), European (593 | 5.2%), and Puerto Rican (498 | 4.4%), together accounting for 43.6% of all Medulla residents.
| Ancestry | # Population | % Population |
| African | 29 | 0.3% |
| American | 1,704 | 15.0% |
| Arab | 15 | 0.1% |
| Brazilian | 59 | 0.5% |
| British | 69 | 0.6% |
| Canadian | 47 | 0.4% |
| Central American | 92 | 0.8% |
| Cherokee | 41 | 0.4% |
| Colombian | 63 | 0.5% |
| Costa Rican | 7 | 0.1% |
| Croatian | 41 | 0.4% |
| Cuban | 365 | 3.2% |
| Czech | 9 | 0.1% |
| Danish | 8 | 0.1% |
| Dominican | 180 | 1.6% |
| Dutch | 134 | 1.2% |
| Eastern European | 3 | 0.0% |
| Ecuadorian | 32 | 0.3% |
| English | 1,107 | 9.8% |
| European | 593 | 5.2% |
| Filipino | 12 | 0.1% |
| French | 165 | 1.5% |
| French Canadian | 165 | 1.5% |
| German | 1,042 | 9.2% |
| Greek | 53 | 0.5% |
| Guatemalan | 40 | 0.4% |
| Haitian | 101 | 0.9% |
| Honduran | 14 | 0.1% |
| Hungarian | 81 | 0.7% |
| Indian (Asian) | 37 | 0.3% |
| Indonesian | 28 | 0.3% |
| Irish | 439 | 3.9% |
| Italian | 466 | 4.1% |
| Korean | 40 | 0.4% |
| Lebanese | 15 | 0.1% |
| Lithuanian | 9 | 0.1% |
| Mexican | 355 | 3.1% |
| Mongolian | 31 | 0.3% |
| Northern European | 4 | 0.0% |
| Norwegian | 9 | 0.1% |
| Polish | 233 | 2.1% |
| Portuguese | 25 | 0.2% |
| Puerto Rican | 498 | 4.4% |
| Russian | 14 | 0.1% |
| Salvadoran | 31 | 0.3% |
| Scotch-Irish | 93 | 0.8% |
| Scottish | 267 | 2.4% |
| Slovene | 6 | 0.1% |
| South American | 126 | 1.1% |
| Spaniard | 161 | 1.4% |
| Spanish | 16 | 0.1% |
| Subsaharan African | 29 | 0.3% |
| Swedish | 64 | 0.6% |
| Venezuelan | 31 | 0.3% |
| Welsh | 38 | 0.3% |
| West Indian | 47 | 0.4% | View All 56 Rows |
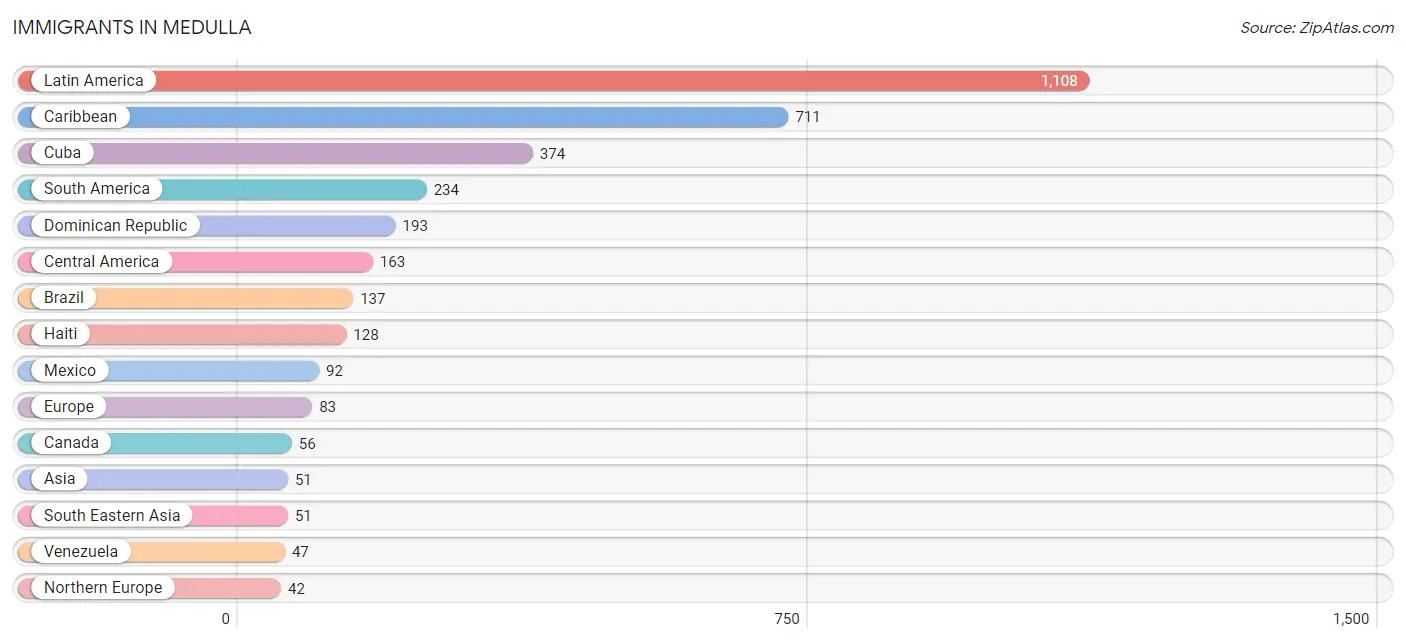
Immigrants in Medulla
The most numerous immigrant groups reported in Medulla came from Latin America (1,108 | 9.8%), Caribbean (711 | 6.3%), Cuba (374 | 3.3%), South America (234 | 2.1%), and Dominican Republic (193 | 1.7%), together accounting for 23.1% of all Medulla residents.
| Immigration Origin | # Population | % Population |
| Africa | 18 | 0.2% |
| Asia | 51 | 0.4% |
| Brazil | 137 | 1.2% |
| Canada | 56 | 0.5% |
| Caribbean | 711 | 6.3% |
| Central America | 163 | 1.4% |
| Colombia | 31 | 0.3% |
| Cuba | 374 | 3.3% |
| Dominican Republic | 193 | 1.7% |
| Eastern Africa | 7 | 0.1% |
| Eastern Europe | 11 | 0.1% |
| El Salvador | 31 | 0.3% |
| England | 33 | 0.3% |
| Europe | 83 | 0.7% |
| Guatemala | 40 | 0.4% |
| Guyana | 19 | 0.2% |
| Haiti | 128 | 1.1% |
| Hungary | 5 | 0.0% |
| Latin America | 1,108 | 9.8% |
| Malaysia | 2 | 0.0% |
| Mexico | 92 | 0.8% |
| Netherlands | 30 | 0.3% |
| Northern Europe | 42 | 0.4% |
| Philippines | 21 | 0.2% |
| Romania | 6 | 0.1% |
| Scotland | 9 | 0.1% |
| South Africa | 11 | 0.1% |
| South America | 234 | 2.1% |
| South Eastern Asia | 51 | 0.4% |
| Trinidad and Tobago | 11 | 0.1% |
| Venezuela | 47 | 0.4% |
| Western Europe | 30 | 0.3% | View All 32 Rows |
Sex and Age in Medulla
Sex and Age in Medulla
The most populous age groups in Medulla are 10 to 14 Years (570 | 9.9%) for men and 15 to 19 Years (539 | 9.6%) for women.
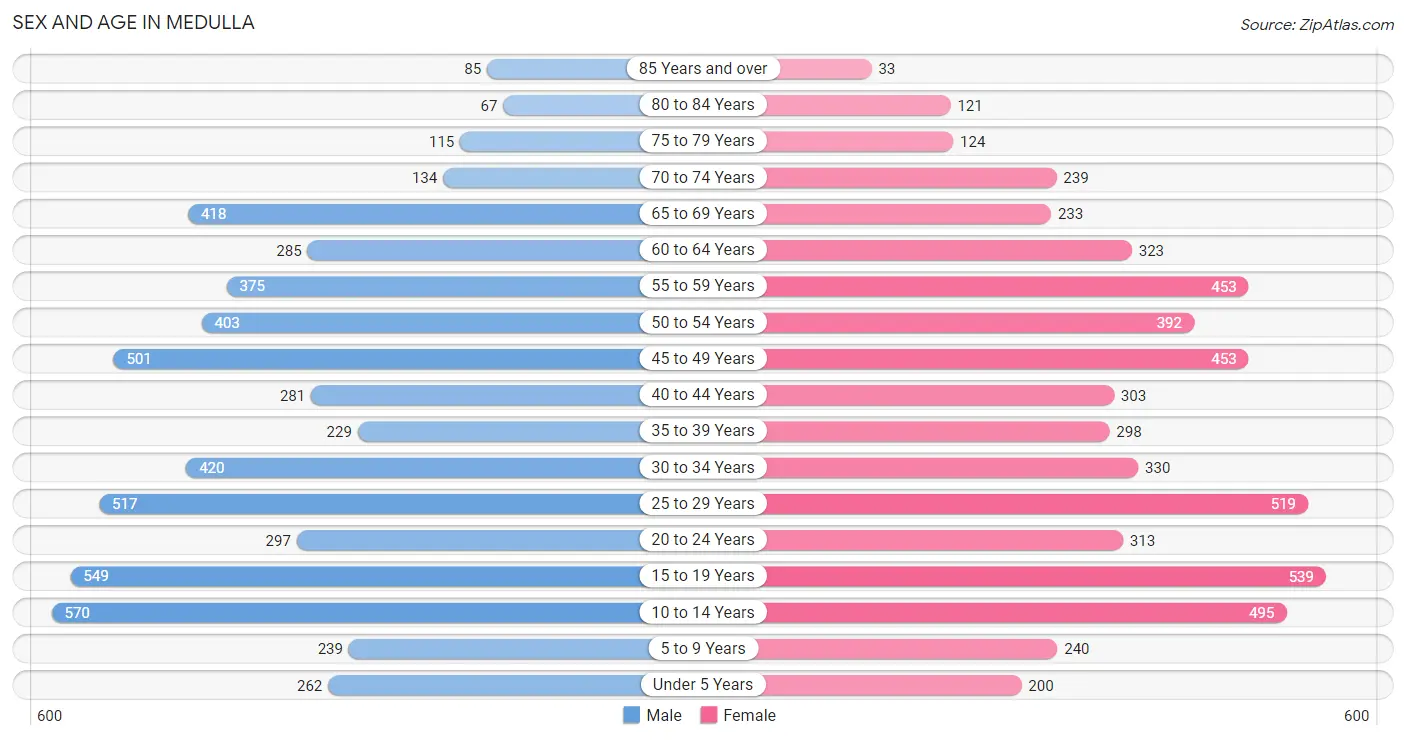
| Age Bracket | Male | Female |
| Under 5 Years | 262 (4.6%) | 200 (3.6%) |
| 5 to 9 Years | 239 (4.2%) | 240 (4.3%) |
| 10 to 14 Years | 570 (9.9%) | 495 (8.8%) |
| 15 to 19 Years | 549 (9.6%) | 539 (9.6%) |
| 20 to 24 Years | 297 (5.2%) | 313 (5.6%) |
| 25 to 29 Years | 517 (9.0%) | 519 (9.2%) |
| 30 to 34 Years | 420 (7.3%) | 330 (5.9%) |
| 35 to 39 Years | 229 (4.0%) | 298 (5.3%) |
| 40 to 44 Years | 281 (4.9%) | 303 (5.4%) |
| 45 to 49 Years | 501 (8.7%) | 453 (8.1%) |
| 50 to 54 Years | 403 (7.0%) | 392 (7.0%) |
| 55 to 59 Years | 375 (6.5%) | 453 (8.1%) |
| 60 to 64 Years | 285 (5.0%) | 323 (5.8%) |
| 65 to 69 Years | 418 (7.3%) | 233 (4.2%) |
| 70 to 74 Years | 134 (2.3%) | 239 (4.3%) |
| 75 to 79 Years | 115 (2.0%) | 124 (2.2%) |
| 80 to 84 Years | 67 (1.2%) | 121 (2.2%) |
| 85 Years and over | 85 (1.5%) | 33 (0.6%) |
| Total | 5,747 (100.0%) | 5,608 (100.0%) |
Families and Households in Medulla
Median Family Size in Medulla
The median family size in Medulla is 3.25 persons per family, with married-couple families (2,292 | 76.8%) accounting for the largest median family size of 3.41 persons per family. On the other hand, single male/father families (126 | 4.2%) represent the smallest median family size with 2.10 persons per family.
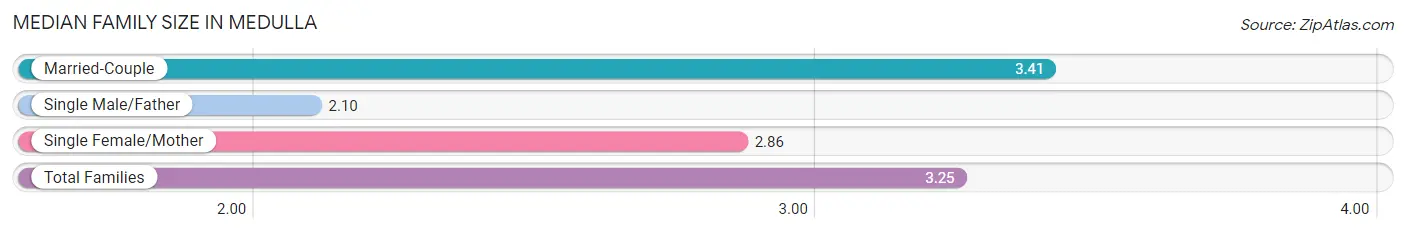
| Family Type | # Families | Family Size |
| Married-Couple | 2,292 (76.8%) | 3.41 |
| Single Male/Father | 126 (4.2%) | 2.10 |
| Single Female/Mother | 568 (19.0%) | 2.86 |
| Total Families | 2,986 (100.0%) | 3.25 |
Median Household Size in Medulla
The median household size in Medulla is 2.79 persons per household, with married-couple households (2,292 | 56.4%) accounting for the largest median household size of 3.43 persons per household. non-family households (1,081 | 26.6%) represent the smallest median household size with 1.39 persons per household.
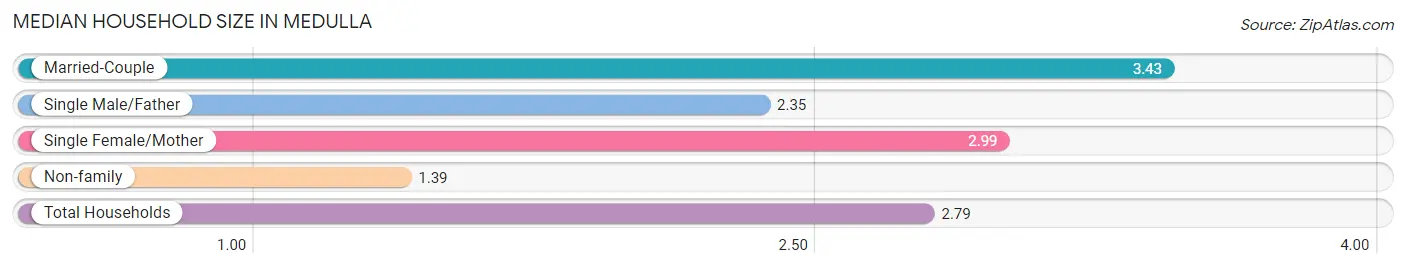
| Household Type | # Households | Household Size |
| Married-Couple | 2,292 (56.4%) | 3.43 |
| Single Male/Father | 126 (3.1%) | 2.35 |
| Single Female/Mother | 568 (14.0%) | 2.99 |
| Non-family | 1,081 (26.6%) | 1.39 |
| Total Households | 4,067 (100.0%) | 2.79 |
Household Size by Marriage Status in Medulla
Out of a total of 4,067 households in Medulla, 2,986 (73.4%) are family households, while 1,081 (26.6%) are nonfamily households. The most numerous type of family households are 2-person households, comprising 1,196, and the most common type of nonfamily households are 1-person households, comprising 792.
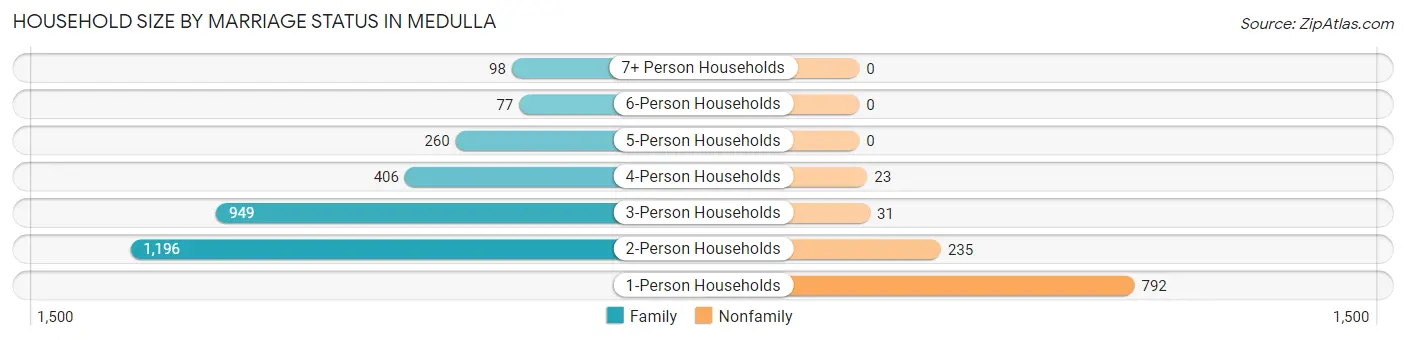
| Household Size | Family Households | Nonfamily Households |
| 1-Person Households | - | 792 (19.5%) |
| 2-Person Households | 1,196 (29.4%) | 235 (5.8%) |
| 3-Person Households | 949 (23.3%) | 31 (0.8%) |
| 4-Person Households | 406 (10.0%) | 23 (0.6%) |
| 5-Person Households | 260 (6.4%) | 0 (0.0%) |
| 6-Person Households | 77 (1.9%) | 0 (0.0%) |
| 7+ Person Households | 98 (2.4%) | 0 (0.0%) |
| Total | 2,986 (73.4%) | 1,081 (26.6%) |
Female Fertility in Medulla
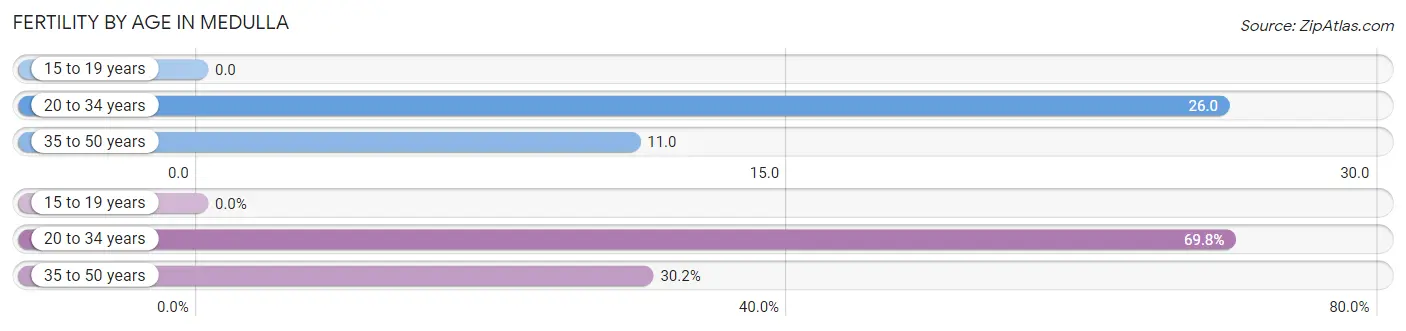
Fertility by Age in Medulla
Average fertility rate in Medulla is 15.0 births per 1,000 women. Women in the age bracket of 20 to 34 years have the highest fertility rate with 26.0 births per 1,000 women. Women in the age bracket of 20 to 34 years acount for 69.8% of all women with births.
| Age Bracket | Women with Births | Births / 1,000 Women |
| 15 to 19 years | 0 (0.0%) | 0.0 |
| 20 to 34 years | 30 (69.8%) | 26.0 |
| 35 to 50 years | 13 (30.2%) | 11.0 |
| Total | 43 (100.0%) | 15.0 |
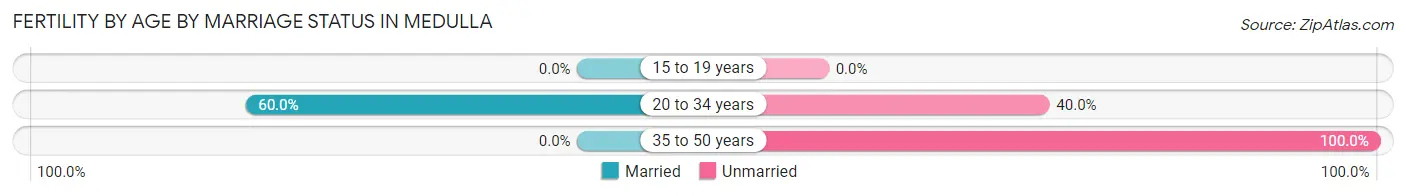
Fertility by Age by Marriage Status in Medulla
41.9% of women with births (43) in Medulla are married. The highest percentage of unmarried women with births falls into 35 to 50 years age bracket with 100.0% of them unmarried at the time of birth, while the lowest percentage of unmarried women with births belong to 20 to 34 years age bracket with 40.0% of them unmarried.
| Age Bracket | Married | Unmarried |
| 15 to 19 years | 0 (0.0%) | 0 (0.0%) |
| 20 to 34 years | 18 (60.0%) | 12 (40.0%) |
| 35 to 50 years | 0 (0.0%) | 13 (100.0%) |
| Total | 18 (41.9%) | 25 (58.1%) |
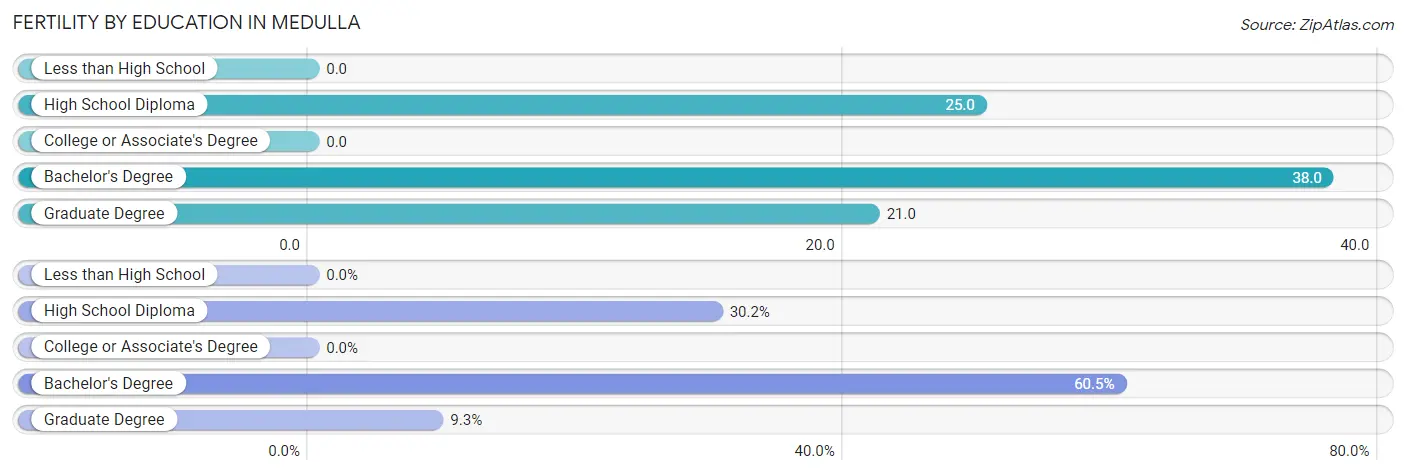
Fertility by Education in Medulla
| Educational Attainment | Women with Births | Births / 1,000 Women |
| Less than High School | 0 (0.0%) | 0.0 |
| High School Diploma | 13 (30.2%) | 25.0 |
| College or Associate's Degree | 0 (0.0%) | 0.0 |
| Bachelor's Degree | 26 (60.5%) | 38.0 |
| Graduate Degree | 4 (9.3%) | 21.0 |
| Total | 43 (100.0%) | 15.0 |
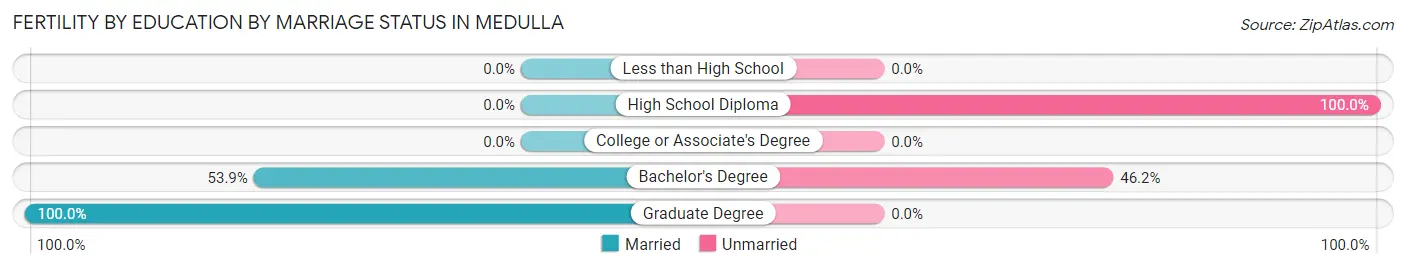
Fertility by Education by Marriage Status in Medulla
58.1% of women with births in Medulla are unmarried. Women with the educational attainment of graduate degree are most likely to be married with 100.0% of them married at childbirth, while women with the educational attainment of high school diploma are least likely to be married with 100.0% of them unmarried at childbirth.
| Educational Attainment | Married | Unmarried |
| Less than High School | 0 (0.0%) | 0 (0.0%) |
| High School Diploma | 0 (0.0%) | 13 (100.0%) |
| College or Associate's Degree | 0 (0.0%) | 0 (0.0%) |
| Bachelor's Degree | 14 (53.8%) | 12 (46.2%) |
| Graduate Degree | 4 (100.0%) | 0 (0.0%) |
| Total | 18 (41.9%) | 25 (58.1%) |
Income in Medulla
Income Overview in Medulla
Per Capita Income in Medulla is $34,009, while median incomes of families and households are $86,987 and $72,639 respectively.
| Characteristic | Number | Measure |
| Per Capita Income | 11,355 | $34,009 |
| Median Family Income | 2,986 | $86,987 |
| Mean Family Income | 2,986 | $102,786 |
| Median Household Income | 4,067 | $72,639 |
| Mean Household Income | 4,067 | $91,448 |
| Income Deficit | 2,986 | $0 |
| Wage / Income Gap (%) | 11,355 | 20.07% |
| Wage / Income Gap ($) | 11,355 | 79.93¢ per $1 |
| Gini / Inequality Index | 11,355 | 0.42 |
Earnings by Sex in Medulla
Average Earnings in Medulla are $37,516, $42,301 for men and $33,810 for women, a difference of 20.1%.
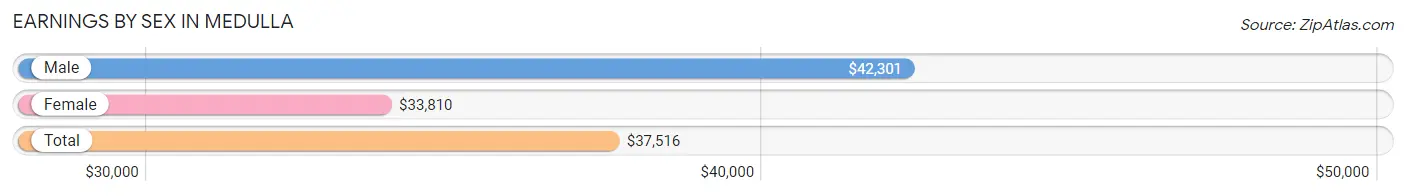
| Sex | Number | Average Earnings |
| Male | 3,279 (56.0%) | $42,301 |
| Female | 2,579 (44.0%) | $33,810 |
| Total | 5,858 (100.0%) | $37,516 |
Earnings by Sex by Income Bracket in Medulla
The most common earnings brackets in Medulla are $100,000+ for men (560 | 17.1%) and $30,000 to $34,999 for women (276 | 10.7%).
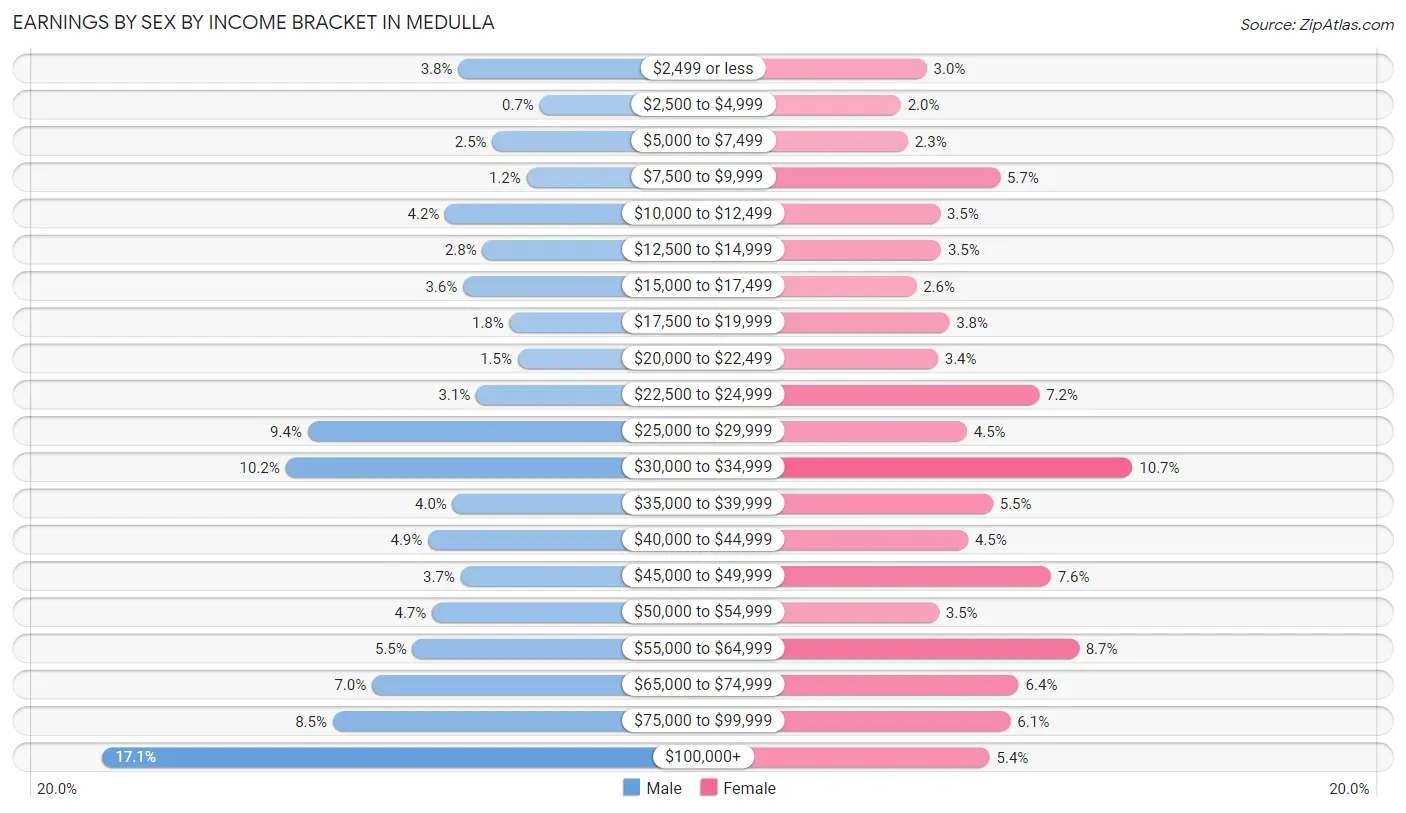
| Income | Male | Female |
| $2,499 or less | 123 (3.7%) | 77 (3.0%) |
| $2,500 to $4,999 | 23 (0.7%) | 52 (2.0%) |
| $5,000 to $7,499 | 81 (2.5%) | 59 (2.3%) |
| $7,500 to $9,999 | 39 (1.2%) | 148 (5.7%) |
| $10,000 to $12,499 | 139 (4.2%) | 90 (3.5%) |
| $12,500 to $14,999 | 93 (2.8%) | 91 (3.5%) |
| $15,000 to $17,499 | 117 (3.6%) | 67 (2.6%) |
| $17,500 to $19,999 | 60 (1.8%) | 99 (3.8%) |
| $20,000 to $22,499 | 50 (1.5%) | 88 (3.4%) |
| $22,500 to $24,999 | 101 (3.1%) | 186 (7.2%) |
| $25,000 to $29,999 | 308 (9.4%) | 116 (4.5%) |
| $30,000 to $34,999 | 335 (10.2%) | 276 (10.7%) |
| $35,000 to $39,999 | 130 (4.0%) | 141 (5.5%) |
| $40,000 to $44,999 | 160 (4.9%) | 117 (4.5%) |
| $45,000 to $49,999 | 120 (3.7%) | 197 (7.6%) |
| $50,000 to $54,999 | 155 (4.7%) | 89 (3.5%) |
| $55,000 to $64,999 | 179 (5.5%) | 224 (8.7%) |
| $65,000 to $74,999 | 229 (7.0%) | 166 (6.4%) |
| $75,000 to $99,999 | 277 (8.5%) | 158 (6.1%) |
| $100,000+ | 560 (17.1%) | 138 (5.3%) |
| Total | 3,279 (100.0%) | 2,579 (100.0%) |
Earnings by Sex by Educational Attainment in Medulla
Average earnings in Medulla are $46,193 for men and $39,837 for women, a difference of 13.8%. Men with an educational attainment of college or associate's degree enjoy the highest average annual earnings of $60,237, while those with less than high school education earn the least with $33,578. Women with an educational attainment of graduate degree earn the most with the average annual earnings of $58,553, while those with high school diploma education have the smallest earnings of $32,000.
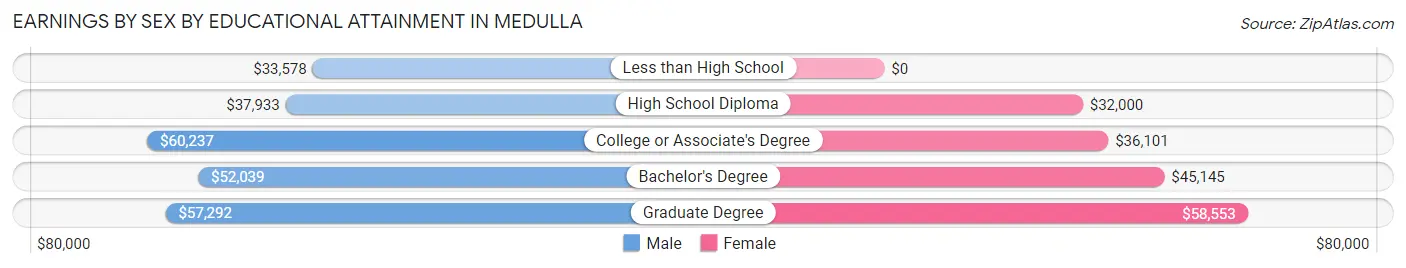
| Educational Attainment | Male Income | Female Income |
| Less than High School | $33,578 | $0 |
| High School Diploma | $37,933 | $32,000 |
| College or Associate's Degree | $60,237 | $36,101 |
| Bachelor's Degree | $52,039 | $45,145 |
| Graduate Degree | $57,292 | $58,553 |
| Total | $46,193 | $39,837 |
Family Income in Medulla
Family Income Brackets in Medulla
According to the Medulla family income data, there are 663 families falling into the $100,000 to $149,999 income range, which is the most common income bracket and makes up 22.2% of all families. Conversely, the $10,000 to $14,999 income bracket is the least frequent group with only 30 families (1.0%) belonging to this category.
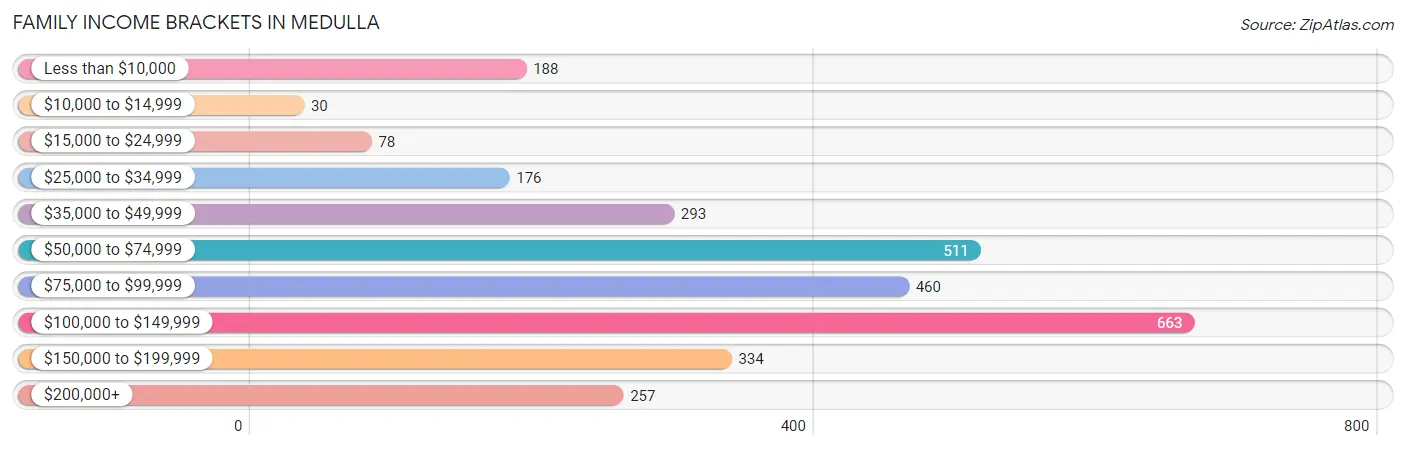
| Income Bracket | # Families | % Families |
| Less than $10,000 | 188 | 6.3% |
| $10,000 to $14,999 | 30 | 1.0% |
| $15,000 to $24,999 | 78 | 2.6% |
| $25,000 to $34,999 | 176 | 5.9% |
| $35,000 to $49,999 | 293 | 9.8% |
| $50,000 to $74,999 | 511 | 17.1% |
| $75,000 to $99,999 | 460 | 15.4% |
| $100,000 to $149,999 | 663 | 22.2% |
| $150,000 to $199,999 | 334 | 11.2% |
| $200,000+ | 257 | 8.6% |
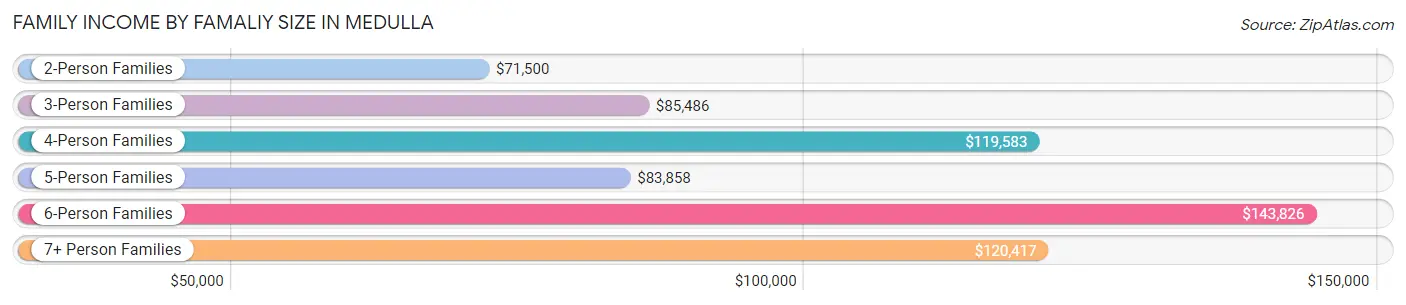
Family Income by Famaliy Size in Medulla
6-person families (71 | 2.4%) account for the highest median family income in Medulla with $143,826 per family, while 2-person families (1,264 | 42.3%) have the highest median income of $35,750 per family member.
| Income Bracket | # Families | Median Income |
| 2-Person Families | 1,264 (42.3%) | $71,500 |
| 3-Person Families | 905 (30.3%) | $85,486 |
| 4-Person Families | 405 (13.6%) | $119,583 |
| 5-Person Families | 248 (8.3%) | $83,858 |
| 6-Person Families | 71 (2.4%) | $143,826 |
| 7+ Person Families | 93 (3.1%) | $120,417 |
| Total | 2,986 (100.0%) | $86,987 |
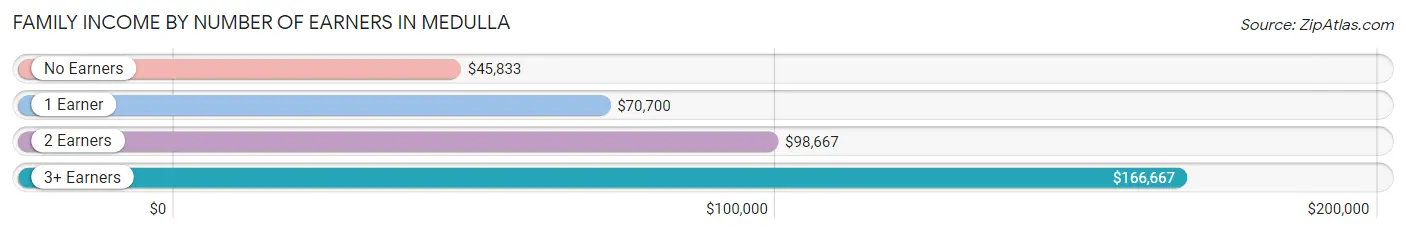
Family Income by Number of Earners in Medulla
The median family income in Medulla is $86,987, with families comprising 3+ earners (288) having the highest median family income of $166,667, while families with no earners (424) have the lowest median family income of $45,833, accounting for 9.7% and 14.2% of families, respectively.
| Number of Earners | # Families | Median Income |
| No Earners | 424 (14.2%) | $45,833 |
| 1 Earner | 1,016 (34.0%) | $70,700 |
| 2 Earners | 1,258 (42.1%) | $98,667 |
| 3+ Earners | 288 (9.7%) | $166,667 |
| Total | 2,986 (100.0%) | $86,987 |
Household Income in Medulla
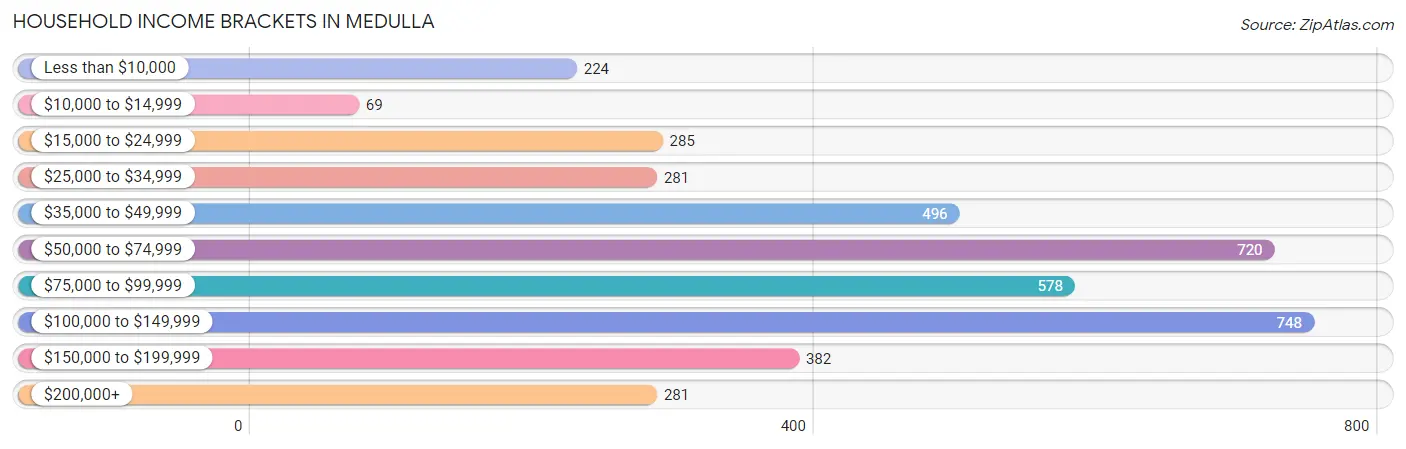
Household Income Brackets in Medulla
With 748 households falling in the category, the $100,000 to $149,999 income range is the most frequent in Medulla, accounting for 18.4% of all households. In contrast, only 69 households (1.7%) fall into the $10,000 to $14,999 income bracket, making it the least populous group.
| Income Bracket | # Households | % Households |
| Less than $10,000 | 224 | 5.5% |
| $10,000 to $14,999 | 69 | 1.7% |
| $15,000 to $24,999 | 285 | 7.0% |
| $25,000 to $34,999 | 281 | 6.9% |
| $35,000 to $49,999 | 496 | 12.2% |
| $50,000 to $74,999 | 720 | 17.7% |
| $75,000 to $99,999 | 578 | 14.2% |
| $100,000 to $149,999 | 748 | 18.4% |
| $150,000 to $199,999 | 382 | 9.4% |
| $200,000+ | 281 | 6.9% |
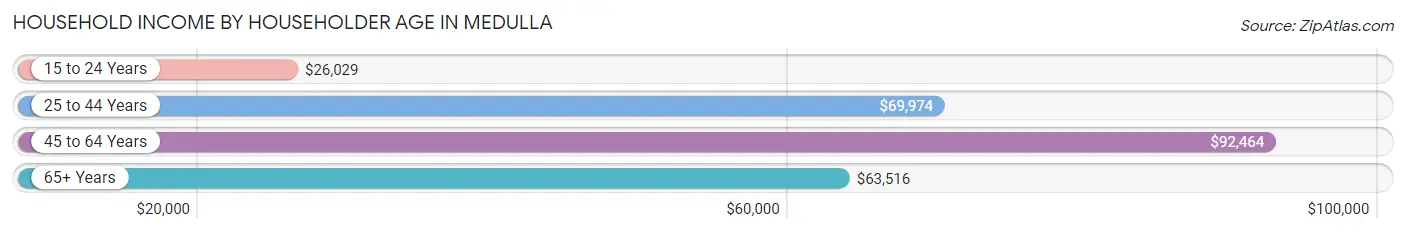
Household Income by Householder Age in Medulla
The median household income in Medulla is $72,639, with the highest median household income of $92,464 found in the 45 to 64 years age bracket for the primary householder. A total of 1,787 households (43.9%) fall into this category. Meanwhile, the 15 to 24 years age bracket for the primary householder has the lowest median household income of $26,029, with 46 households (1.1%) in this group.
| Income Bracket | # Households | Median Income |
| 15 to 24 Years | 46 (1.1%) | $26,029 |
| 25 to 44 Years | 1,243 (30.6%) | $69,974 |
| 45 to 64 Years | 1,787 (43.9%) | $92,464 |
| 65+ Years | 991 (24.4%) | $63,516 |
| Total | 4,067 (100.0%) | $72,639 |
Poverty in Medulla
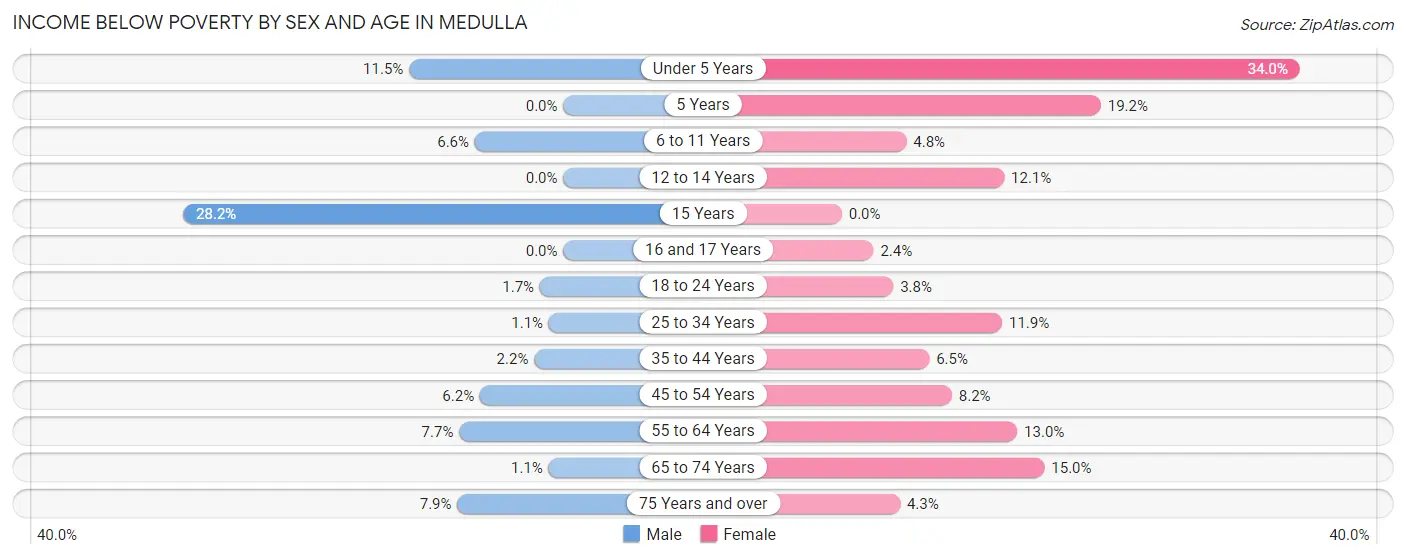
Income Below Poverty by Sex and Age in Medulla
With 4.2% poverty level for males and 9.9% for females among the residents of Medulla, 15 year old males and under 5 year old females are the most vulnerable to poverty, with 24 males (28.2%) and 68 females (34.0%) in their respective age groups living below the poverty level.
| Age Bracket | Male | Female |
| Under 5 Years | 30 (11.5%) | 68 (34.0%) |
| 5 Years | 0 (0.0%) | 10 (19.2%) |
| 6 to 11 Years | 23 (6.6%) | 18 (4.8%) |
| 12 to 14 Years | 0 (0.0%) | 37 (12.0%) |
| 15 Years | 24 (28.2%) | 0 (0.0%) |
| 16 and 17 Years | 0 (0.0%) | 5 (2.4%) |
| 18 to 24 Years | 8 (1.7%) | 22 (3.8%) |
| 25 to 34 Years | 10 (1.1%) | 101 (11.9%) |
| 35 to 44 Years | 11 (2.2%) | 39 (6.5%) |
| 45 to 54 Years | 56 (6.2%) | 69 (8.2%) |
| 55 to 64 Years | 51 (7.7%) | 101 (13.0%) |
| 65 to 74 Years | 6 (1.1%) | 71 (15.0%) |
| 75 Years and over | 21 (7.9%) | 12 (4.3%) |
| Total | 240 (4.2%) | 553 (9.9%) |
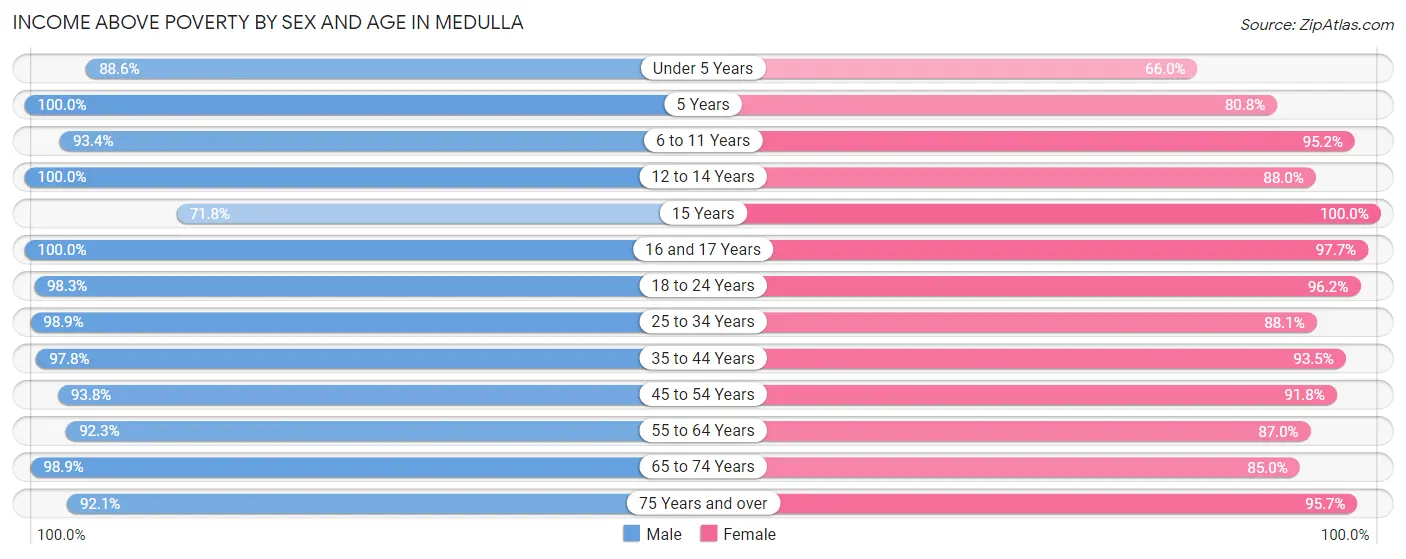
Income Above Poverty by Sex and Age in Medulla
According to the poverty statistics in Medulla, males aged 5 years and females aged 15 years are the age groups that are most secure financially, with 100.0% of males and 100.0% of females in these age groups living above the poverty line.
| Age Bracket | Male | Female |
| Under 5 Years | 232 (88.5%) | 132 (66.0%) |
| 5 Years | 23 (100.0%) | 42 (80.8%) |
| 6 to 11 Years | 327 (93.4%) | 358 (95.2%) |
| 12 to 14 Years | 406 (100.0%) | 270 (87.9%) |
| 15 Years | 61 (71.8%) | 63 (100.0%) |
| 16 and 17 Years | 300 (100.0%) | 208 (97.7%) |
| 18 to 24 Years | 453 (98.3%) | 554 (96.2%) |
| 25 to 34 Years | 927 (98.9%) | 748 (88.1%) |
| 35 to 44 Years | 499 (97.8%) | 562 (93.5%) |
| 45 to 54 Years | 848 (93.8%) | 776 (91.8%) |
| 55 to 64 Years | 609 (92.3%) | 675 (87.0%) |
| 65 to 74 Years | 546 (98.9%) | 401 (85.0%) |
| 75 Years and over | 246 (92.1%) | 266 (95.7%) |
| Total | 5,477 (95.8%) | 5,055 (90.1%) |
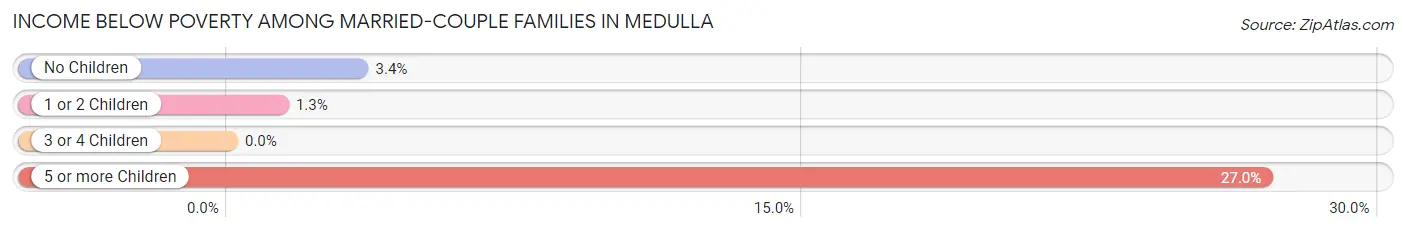
Income Below Poverty Among Married-Couple Families in Medulla
The poverty statistics for married-couple families in Medulla show that 2.9% or 66 of the total 2,292 families live below the poverty line. Families with 5 or more children have the highest poverty rate of 27.0%, comprising of 10 families. On the other hand, families with 3 or 4 children have the lowest poverty rate of 0.0%, which includes 0 families.
| Children | Above Poverty | Below Poverty |
| No Children | 1,303 (96.6%) | 46 (3.4%) |
| 1 or 2 Children | 743 (98.7%) | 10 (1.3%) |
| 3 or 4 Children | 153 (100.0%) | 0 (0.0%) |
| 5 or more Children | 27 (73.0%) | 10 (27.0%) |
| Total | 2,226 (97.1%) | 66 (2.9%) |
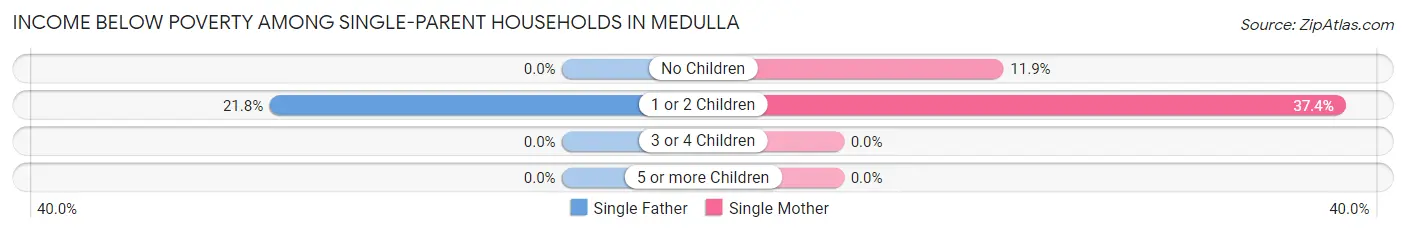
Income Below Poverty Among Single-Parent Households in Medulla
According to the poverty data in Medulla, 13.5% or 17 single-father households and 27.1% or 154 single-mother households are living below the poverty line. Among single-father households, those with 1 or 2 children have the highest poverty rate, with 17 households (21.8%) experiencing poverty. Likewise, among single-mother households, those with 1 or 2 children have the highest poverty rate, with 129 households (37.4%) falling below the poverty line.
| Children | Single Father | Single Mother |
| No Children | 0 (0.0%) | 25 (11.9%) |
| 1 or 2 Children | 17 (21.8%) | 129 (37.4%) |
| 3 or 4 Children | 0 (0.0%) | 0 (0.0%) |
| 5 or more Children | 0 (0.0%) | 0 (0.0%) |
| Total | 17 (13.5%) | 154 (27.1%) |
Income Below Poverty Among Married-Couple vs Single-Parent Households in Medulla
The poverty data for Medulla shows that 66 of the married-couple family households (2.9%) and 171 of the single-parent households (24.6%) are living below the poverty level. Within the married-couple family households, those with 5 or more children have the highest poverty rate, with 10 households (27.0%) falling below the poverty line. Among the single-parent households, those with 1 or 2 children have the highest poverty rate, with 146 household (34.5%) living below poverty.
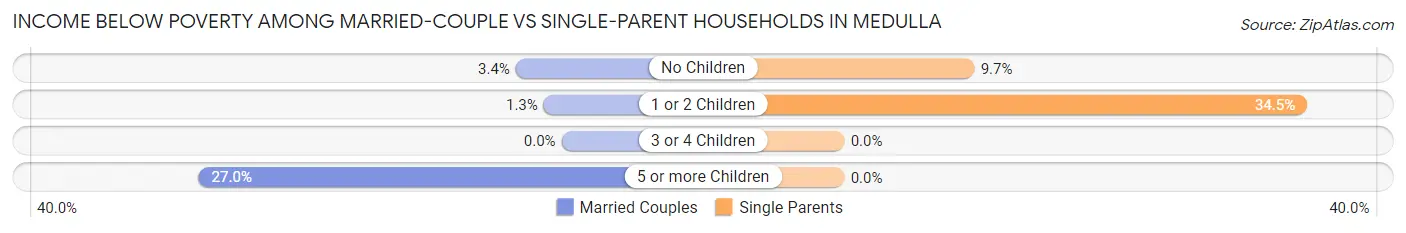
| Children | Married-Couple Families | Single-Parent Households |
| No Children | 46 (3.4%) | 25 (9.7%) |
| 1 or 2 Children | 10 (1.3%) | 146 (34.5%) |
| 3 or 4 Children | 0 (0.0%) | 0 (0.0%) |
| 5 or more Children | 10 (27.0%) | 0 (0.0%) |
| Total | 66 (2.9%) | 171 (24.6%) |
Employment Characteristics in Medulla
Employment by Class of Employer in Medulla
Among the 5,494 employed individuals in Medulla, private company employees (3,844 | 70.0%), not-for-profit organizations (525 | 9.6%), and local government employees (437 | 8.0%) make up the most common classes of employment.
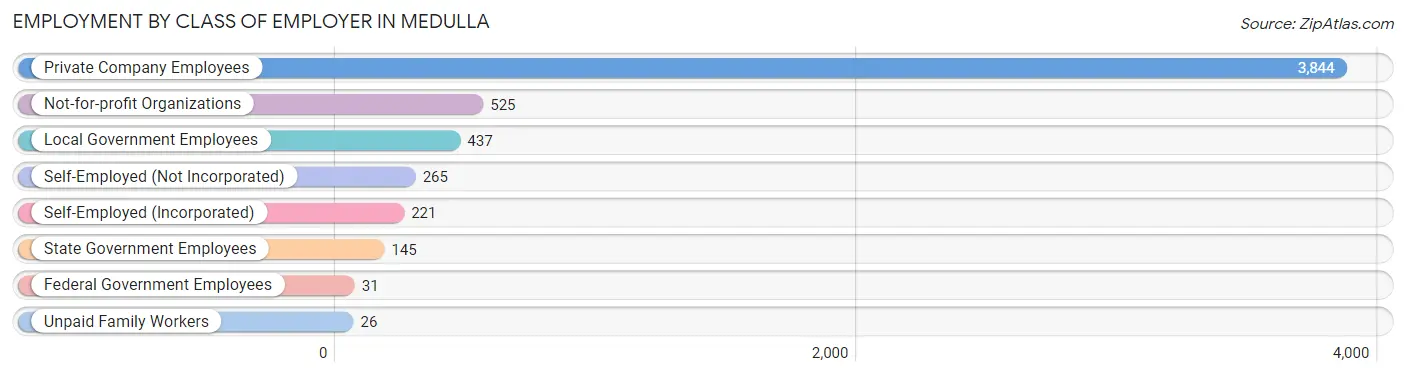
| Employer Class | # Employees | % Employees |
| Private Company Employees | 3,844 | 70.0% |
| Self-Employed (Incorporated) | 221 | 4.0% |
| Self-Employed (Not Incorporated) | 265 | 4.8% |
| Not-for-profit Organizations | 525 | 9.6% |
| Local Government Employees | 437 | 8.0% |
| State Government Employees | 145 | 2.6% |
| Federal Government Employees | 31 | 0.6% |
| Unpaid Family Workers | 26 | 0.5% |
| Total | 5,494 | 100.0% |
Employment Status by Age in Medulla
According to the labor force statistics for Medulla, out of the total population over 16 years of age (9,201), 62.7% or 5,769 individuals are in the labor force, with 2.9% or 167 of them unemployed. The age group with the highest labor force participation rate is 35 to 44 years, with 88.9% or 988 individuals in the labor force. Within the labor force, the 16 to 19 years age range has the highest percentage of unemployed individuals, with 10.4% or 19 of them being unemployed.
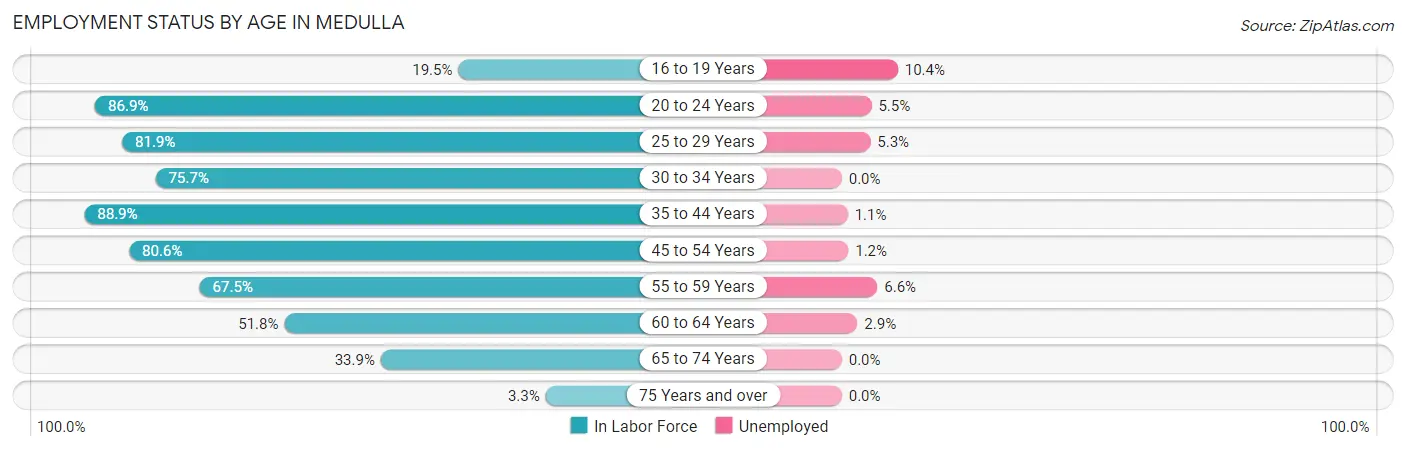
| Age Bracket | In Labor Force | Unemployed |
| 16 to 19 Years | 183 (19.5%) | 19 (10.4%) |
| 20 to 24 Years | 530 (86.9%) | 29 (5.5%) |
| 25 to 29 Years | 848 (81.9%) | 45 (5.3%) |
| 30 to 34 Years | 568 (75.7%) | 0 (0.0%) |
| 35 to 44 Years | 988 (88.9%) | 11 (1.1%) |
| 45 to 54 Years | 1,410 (80.6%) | 17 (1.2%) |
| 55 to 59 Years | 559 (67.5%) | 37 (6.6%) |
| 60 to 64 Years | 315 (51.8%) | 9 (2.9%) |
| 65 to 74 Years | 347 (33.9%) | 0 (0.0%) |
| 75 Years and over | 18 (3.3%) | 0 (0.0%) |
| Total | 5,769 (62.7%) | 167 (2.9%) |
Employment Status by Educational Attainment in Medulla
According to labor force statistics for Medulla, 77.1% of individuals (4,689) out of the total population between 25 and 64 years of age (6,082) are in the labor force, with 2.5% or 117 of them being unemployed. The group with the highest labor force participation rate are those with the educational attainment of bachelor's degree or higher, with 90.0% or 1,698 individuals in the labor force. Within the labor force, individuals with college / associate degree education have the highest percentage of unemployment, with 3.2% or 56 of them being unemployed.
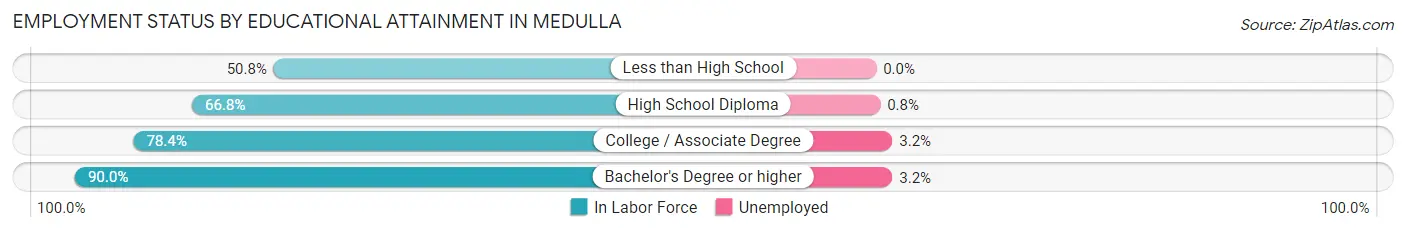
| Educational Attainment | In Labor Force | Unemployed |
| Less than High School | 227 (50.8%) | 0 (0.0%) |
| High School Diploma | 1,007 (66.8%) | 12 (0.8%) |
| College / Associate Degree | 1,757 (78.4%) | 72 (3.2%) |
| Bachelor's Degree or higher | 1,698 (90.0%) | 60 (3.2%) |
| Total | 4,689 (77.1%) | 152 (2.5%) |
Employment Occupations by Sex in Medulla
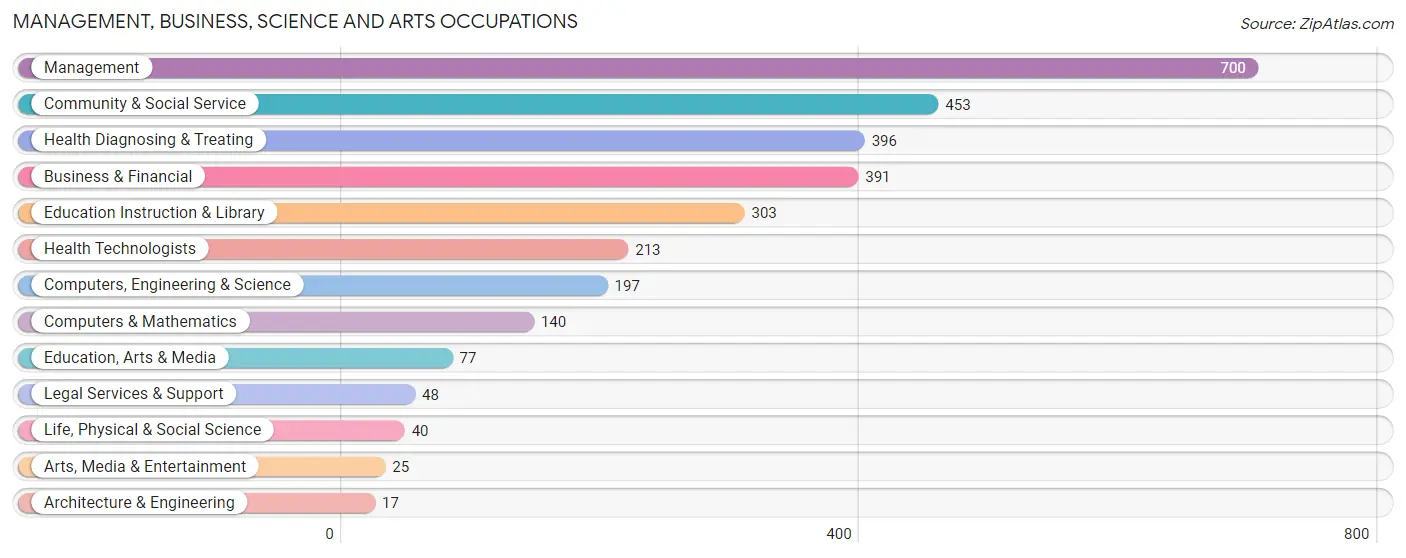
Management, Business, Science and Arts Occupations
The most common Management, Business, Science and Arts occupations in Medulla are Management (700 | 12.5%), Community & Social Service (453 | 8.1%), Health Diagnosing & Treating (396 | 7.1%), Business & Financial (391 | 7.0%), and Education Instruction & Library (303 | 5.4%).
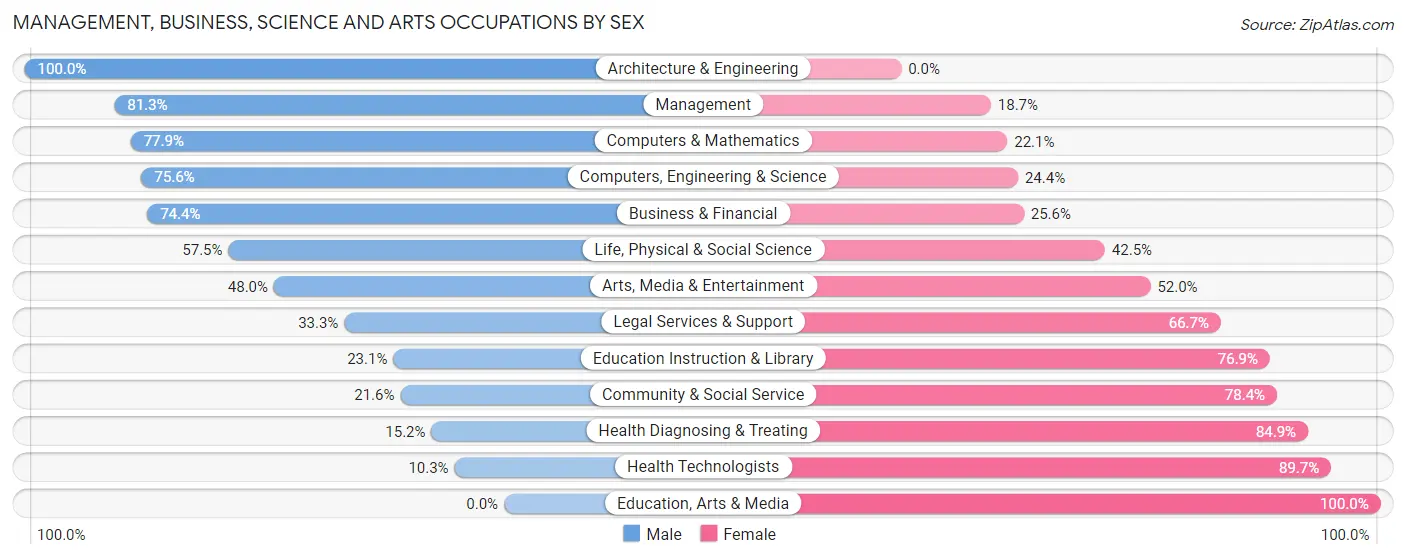
Management, Business, Science and Arts Occupations by Sex
Within the Management, Business, Science and Arts occupations in Medulla, the most male-oriented occupations are Architecture & Engineering (100.0%), Management (81.3%), and Computers & Mathematics (77.9%), while the most female-oriented occupations are Education, Arts & Media (100.0%), Health Technologists (89.7%), and Health Diagnosing & Treating (84.9%).
| Occupation | Male | Female |
| Management | 569 (81.3%) | 131 (18.7%) |
| Business & Financial | 291 (74.4%) | 100 (25.6%) |
| Computers, Engineering & Science | 149 (75.6%) | 48 (24.4%) |
| Computers & Mathematics | 109 (77.9%) | 31 (22.1%) |
| Architecture & Engineering | 17 (100.0%) | 0 (0.0%) |
| Life, Physical & Social Science | 23 (57.5%) | 17 (42.5%) |
| Community & Social Service | 98 (21.6%) | 355 (78.4%) |
| Education, Arts & Media | 0 (0.0%) | 77 (100.0%) |
| Legal Services & Support | 16 (33.3%) | 32 (66.7%) |
| Education Instruction & Library | 70 (23.1%) | 233 (76.9%) |
| Arts, Media & Entertainment | 12 (48.0%) | 13 (52.0%) |
| Health Diagnosing & Treating | 60 (15.1%) | 336 (84.9%) |
| Health Technologists | 22 (10.3%) | 191 (89.7%) |
| Total (Category) | 1,167 (54.6%) | 970 (45.4%) |
| Total (Overall) | 3,142 (56.1%) | 2,456 (43.9%) |
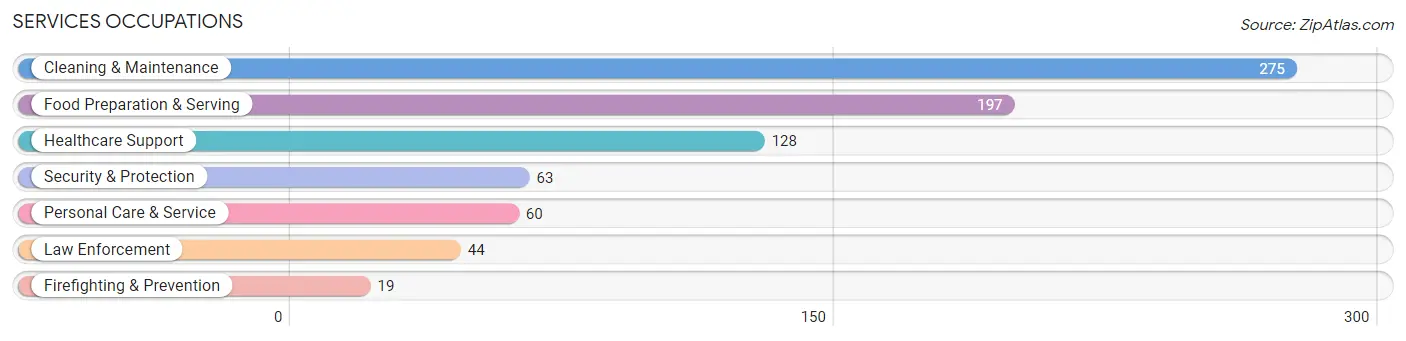
Services Occupations
The most common Services occupations in Medulla are Cleaning & Maintenance (275 | 4.9%), Food Preparation & Serving (197 | 3.5%), Healthcare Support (128 | 2.3%), Security & Protection (63 | 1.1%), and Personal Care & Service (60 | 1.1%).
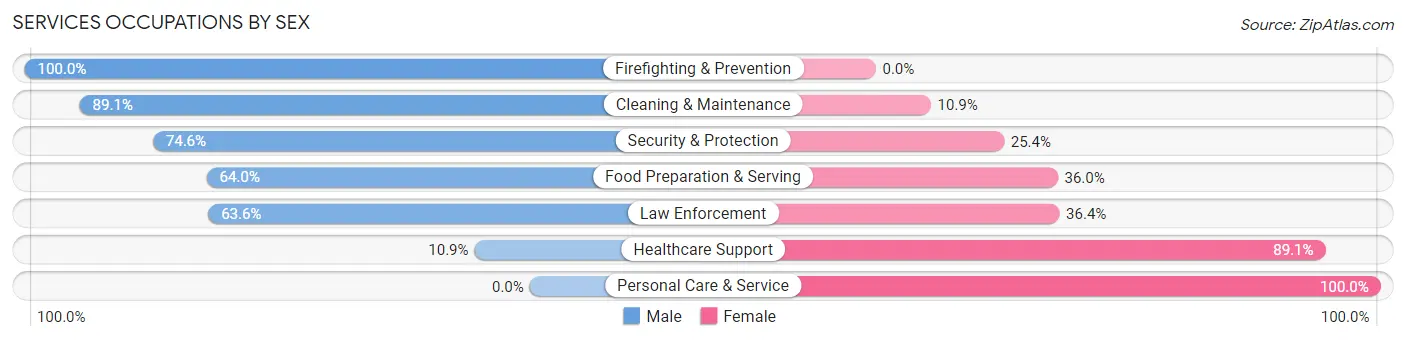
Services Occupations by Sex
Within the Services occupations in Medulla, the most male-oriented occupations are Firefighting & Prevention (100.0%), Cleaning & Maintenance (89.1%), and Security & Protection (74.6%), while the most female-oriented occupations are Personal Care & Service (100.0%), Healthcare Support (89.1%), and Law Enforcement (36.4%).
| Occupation | Male | Female |
| Healthcare Support | 14 (10.9%) | 114 (89.1%) |
| Security & Protection | 47 (74.6%) | 16 (25.4%) |
| Firefighting & Prevention | 19 (100.0%) | 0 (0.0%) |
| Law Enforcement | 28 (63.6%) | 16 (36.4%) |
| Food Preparation & Serving | 126 (64.0%) | 71 (36.0%) |
| Cleaning & Maintenance | 245 (89.1%) | 30 (10.9%) |
| Personal Care & Service | 0 (0.0%) | 60 (100.0%) |
| Total (Category) | 432 (59.8%) | 291 (40.3%) |
| Total (Overall) | 3,142 (56.1%) | 2,456 (43.9%) |
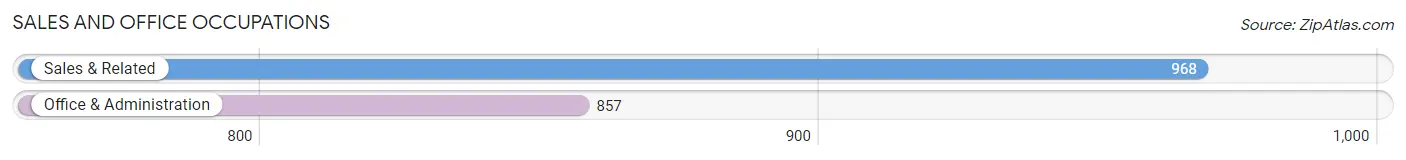
Sales and Office Occupations
The most common Sales and Office occupations in Medulla are Sales & Related (968 | 17.3%), and Office & Administration (857 | 15.3%).
Sales and Office Occupations by Sex
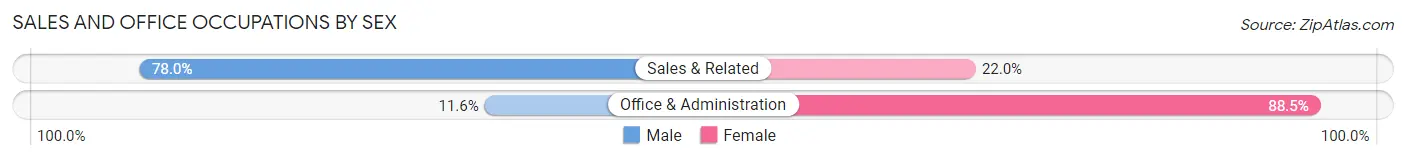
| Occupation | Male | Female |
| Sales & Related | 755 (78.0%) | 213 (22.0%) |
| Office & Administration | 99 (11.6%) | 758 (88.4%) |
| Total (Category) | 854 (46.8%) | 971 (53.2%) |
| Total (Overall) | 3,142 (56.1%) | 2,456 (43.9%) |
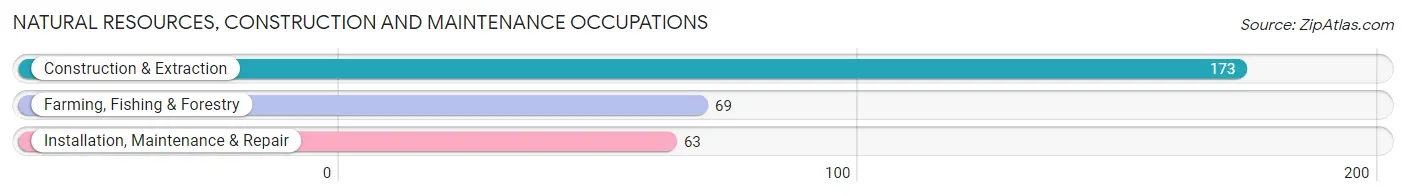
Natural Resources, Construction and Maintenance Occupations
The most common Natural Resources, Construction and Maintenance occupations in Medulla are Construction & Extraction (173 | 3.1%), Farming, Fishing & Forestry (69 | 1.2%), and Installation, Maintenance & Repair (63 | 1.1%).
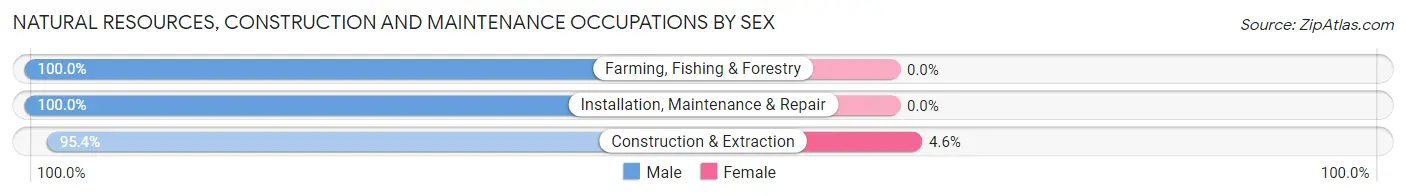
Natural Resources, Construction and Maintenance Occupations by Sex
| Occupation | Male | Female |
| Farming, Fishing & Forestry | 69 (100.0%) | 0 (0.0%) |
| Construction & Extraction | 165 (95.4%) | 8 (4.6%) |
| Installation, Maintenance & Repair | 63 (100.0%) | 0 (0.0%) |
| Total (Category) | 297 (97.4%) | 8 (2.6%) |
| Total (Overall) | 3,142 (56.1%) | 2,456 (43.9%) |
Production, Transportation and Moving Occupations
The most common Production, Transportation and Moving occupations in Medulla are Material Moving (312 | 5.6%), Production (160 | 2.9%), and Transportation (136 | 2.4%).
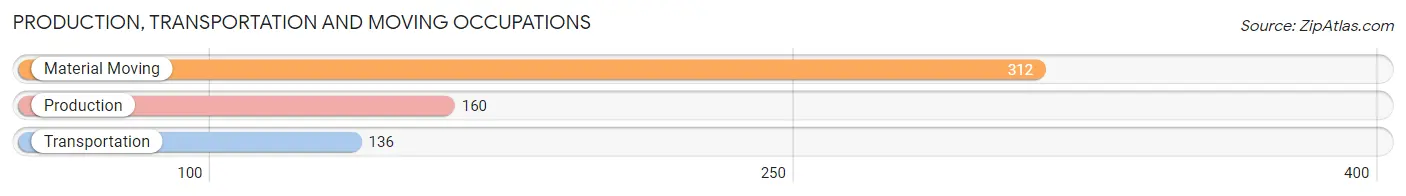
Production, Transportation and Moving Occupations by Sex
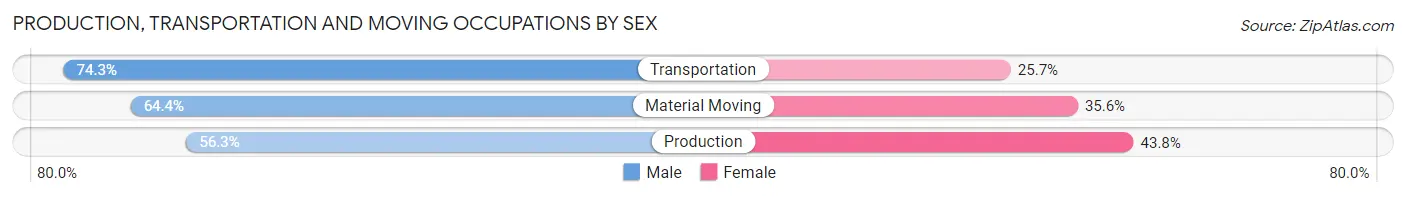
| Occupation | Male | Female |
| Production | 90 (56.2%) | 70 (43.8%) |
| Transportation | 101 (74.3%) | 35 (25.7%) |
| Material Moving | 201 (64.4%) | 111 (35.6%) |
| Total (Category) | 392 (64.5%) | 216 (35.5%) |
| Total (Overall) | 3,142 (56.1%) | 2,456 (43.9%) |
Employment Industries by Sex in Medulla
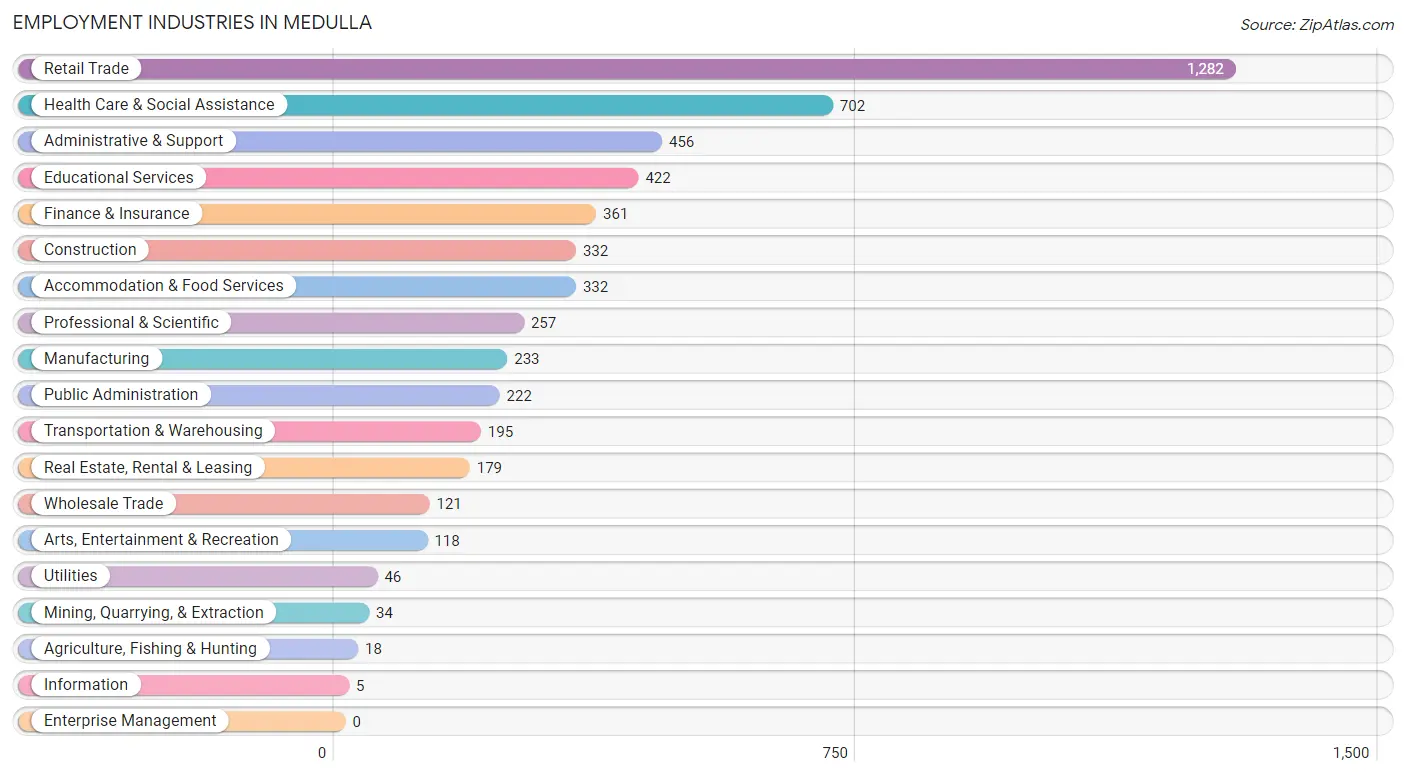
Employment Industries in Medulla
The major employment industries in Medulla include Retail Trade (1,282 | 22.9%), Health Care & Social Assistance (702 | 12.5%), Administrative & Support (456 | 8.2%), Educational Services (422 | 7.5%), and Finance & Insurance (361 | 6.5%).
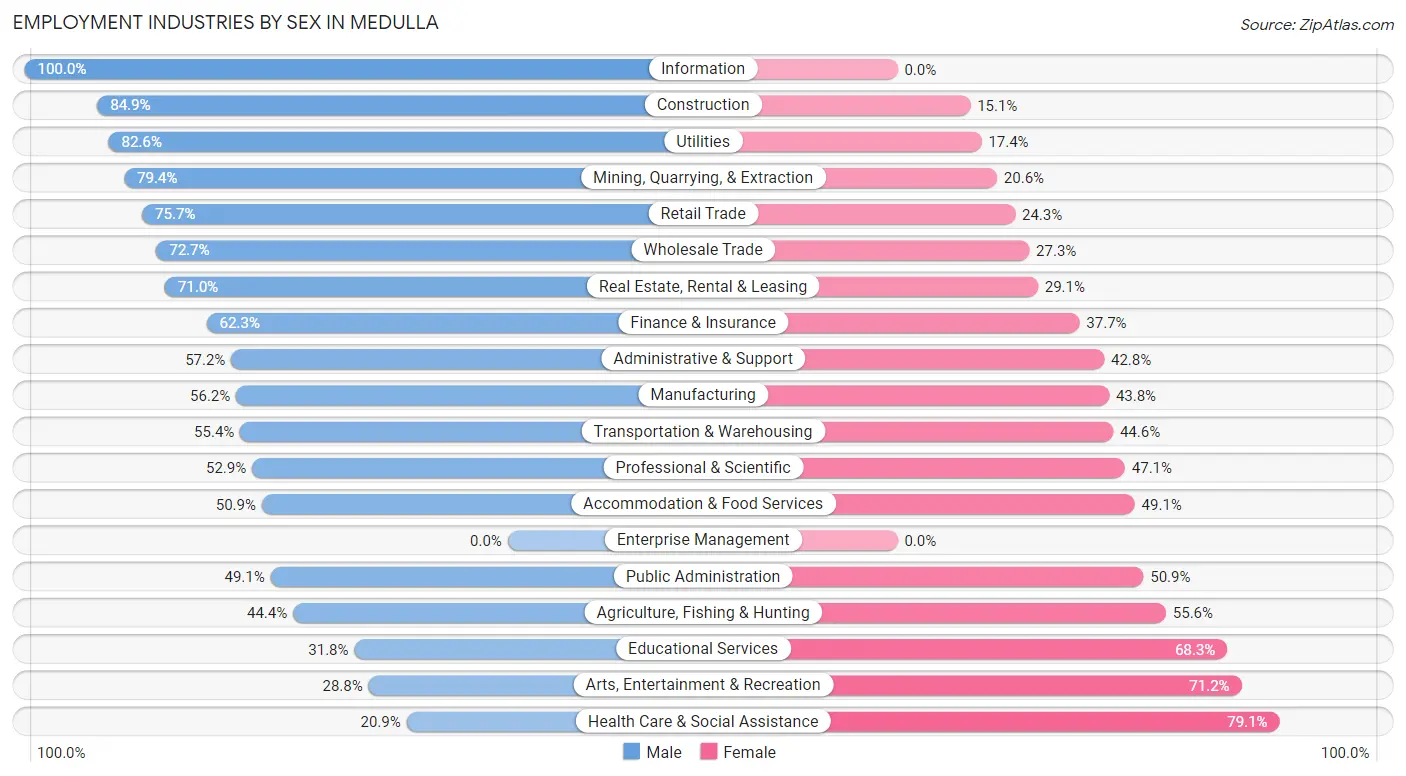
Employment Industries by Sex in Medulla
The Medulla industries that see more men than women are Information (100.0%), Construction (84.9%), and Utilities (82.6%), whereas the industries that tend to have a higher number of women are Health Care & Social Assistance (79.1%), Arts, Entertainment & Recreation (71.2%), and Educational Services (68.2%).
| Industry | Male | Female |
| Agriculture, Fishing & Hunting | 8 (44.4%) | 10 (55.6%) |
| Mining, Quarrying, & Extraction | 27 (79.4%) | 7 (20.6%) |
| Construction | 282 (84.9%) | 50 (15.1%) |
| Manufacturing | 131 (56.2%) | 102 (43.8%) |
| Wholesale Trade | 88 (72.7%) | 33 (27.3%) |
| Retail Trade | 970 (75.7%) | 312 (24.3%) |
| Transportation & Warehousing | 108 (55.4%) | 87 (44.6%) |
| Utilities | 38 (82.6%) | 8 (17.4%) |
| Information | 5 (100.0%) | 0 (0.0%) |
| Finance & Insurance | 225 (62.3%) | 136 (37.7%) |
| Real Estate, Rental & Leasing | 127 (71.0%) | 52 (29.0%) |
| Professional & Scientific | 136 (52.9%) | 121 (47.1%) |
| Enterprise Management | 0 (0.0%) | 0 (0.0%) |
| Administrative & Support | 261 (57.2%) | 195 (42.8%) |
| Educational Services | 134 (31.8%) | 288 (68.2%) |
| Health Care & Social Assistance | 147 (20.9%) | 555 (79.1%) |
| Arts, Entertainment & Recreation | 34 (28.8%) | 84 (71.2%) |
| Accommodation & Food Services | 169 (50.9%) | 163 (49.1%) |
| Public Administration | 109 (49.1%) | 113 (50.9%) |
| Total | 3,142 (56.1%) | 2,456 (43.9%) |
Education in Medulla
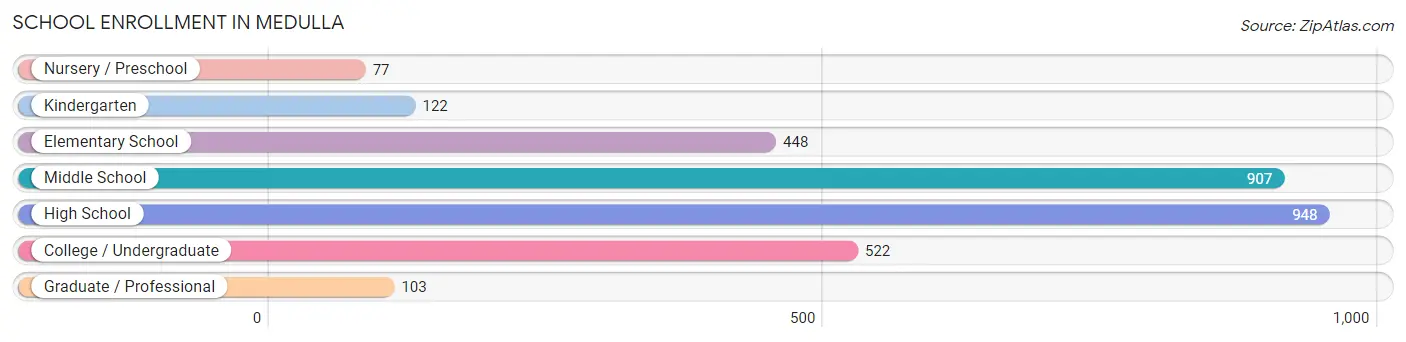
School Enrollment in Medulla
The most common levels of schooling among the 3,127 students in Medulla are high school (948 | 30.3%), middle school (907 | 29.0%), and college / undergraduate (522 | 16.7%).
| School Level | # Students | % Students |
| Nursery / Preschool | 77 | 2.5% |
| Kindergarten | 122 | 3.9% |
| Elementary School | 448 | 14.3% |
| Middle School | 907 | 29.0% |
| High School | 948 | 30.3% |
| College / Undergraduate | 522 | 16.7% |
| Graduate / Professional | 103 | 3.3% |
| Total | 3,127 | 100.0% |
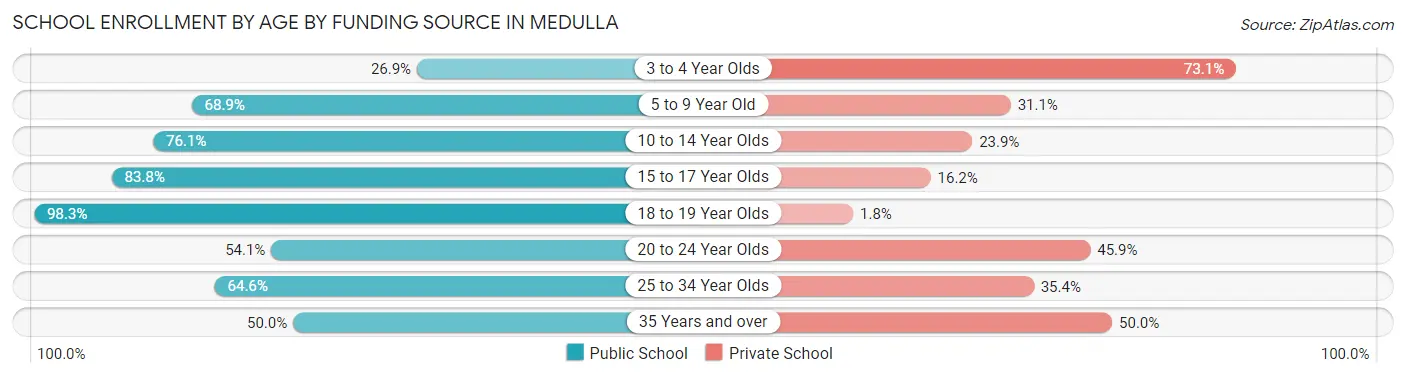
School Enrollment by Age by Funding Source in Medulla
Out of a total of 3,127 students who are enrolled in schools in Medulla, 810 (25.9%) attend a private institution, while the remaining 2,317 (74.1%) are enrolled in public schools. The age group of 3 to 4 year olds has the highest likelihood of being enrolled in private schools, with 38 (73.1% in the age bracket) enrolled. Conversely, the age group of 18 to 19 year olds has the lowest likelihood of being enrolled in a private school, with 281 (98.3% in the age bracket) attending a public institution.
| Age Bracket | Public School | Private School |
| 3 to 4 Year Olds | 14 (26.9%) | 38 (73.1%) |
| 5 to 9 Year Old | 330 (68.9%) | 149 (31.1%) |
| 10 to 14 Year Olds | 810 (76.1%) | 255 (23.9%) |
| 15 to 17 Year Olds | 554 (83.8%) | 107 (16.2%) |
| 18 to 19 Year Olds | 281 (98.3%) | 5 (1.8%) |
| 20 to 24 Year Olds | 166 (54.1%) | 141 (45.9%) |
| 25 to 34 Year Olds | 104 (64.6%) | 57 (35.4%) |
| 35 Years and over | 58 (50.0%) | 58 (50.0%) |
| Total | 2,317 (74.1%) | 810 (25.9%) |
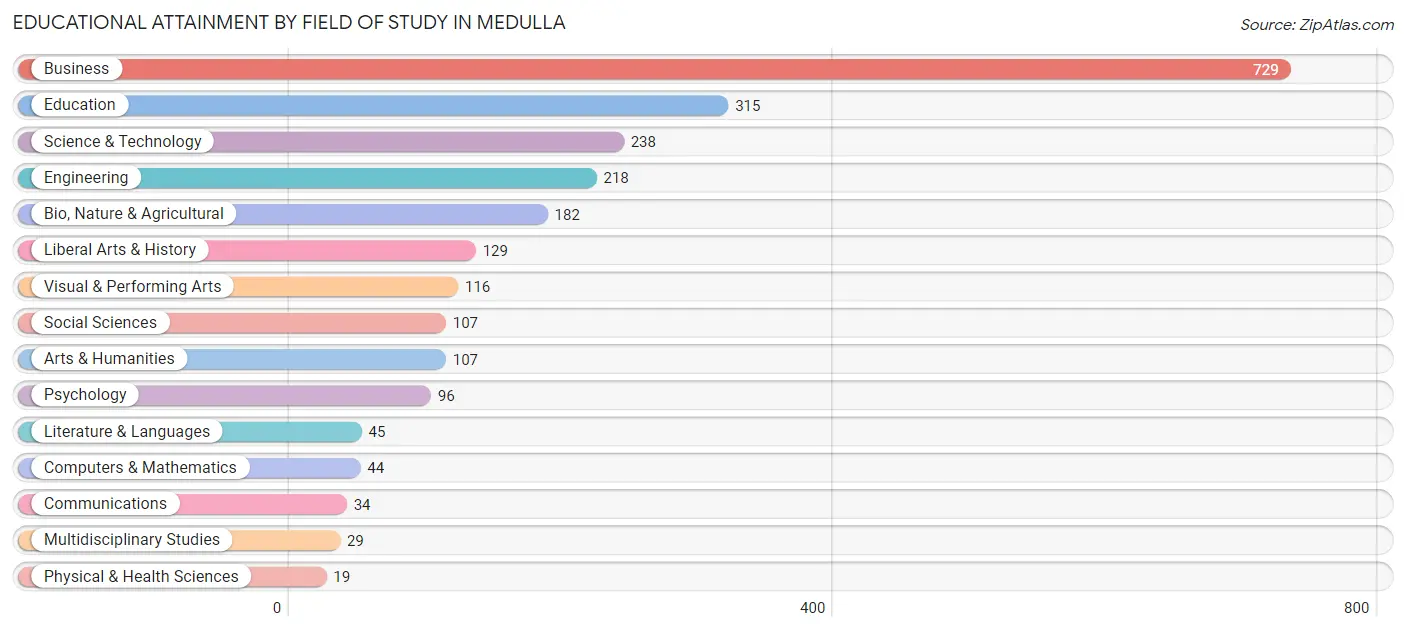
Educational Attainment by Field of Study in Medulla
Business (729 | 30.3%), education (315 | 13.1%), science & technology (238 | 9.9%), engineering (218 | 9.0%), and bio, nature & agricultural (182 | 7.6%) are the most common fields of study among 2,408 individuals in Medulla who have obtained a bachelor's degree or higher.
| Field of Study | # Graduates | % Graduates |
| Computers & Mathematics | 44 | 1.8% |
| Bio, Nature & Agricultural | 182 | 7.6% |
| Physical & Health Sciences | 19 | 0.8% |
| Psychology | 96 | 4.0% |
| Social Sciences | 107 | 4.4% |
| Engineering | 218 | 9.0% |
| Multidisciplinary Studies | 29 | 1.2% |
| Science & Technology | 238 | 9.9% |
| Business | 729 | 30.3% |
| Education | 315 | 13.1% |
| Literature & Languages | 45 | 1.9% |
| Liberal Arts & History | 129 | 5.4% |
| Visual & Performing Arts | 116 | 4.8% |
| Communications | 34 | 1.4% |
| Arts & Humanities | 107 | 4.4% |
| Total | 2,408 | 100.0% |
Transportation & Commute in Medulla
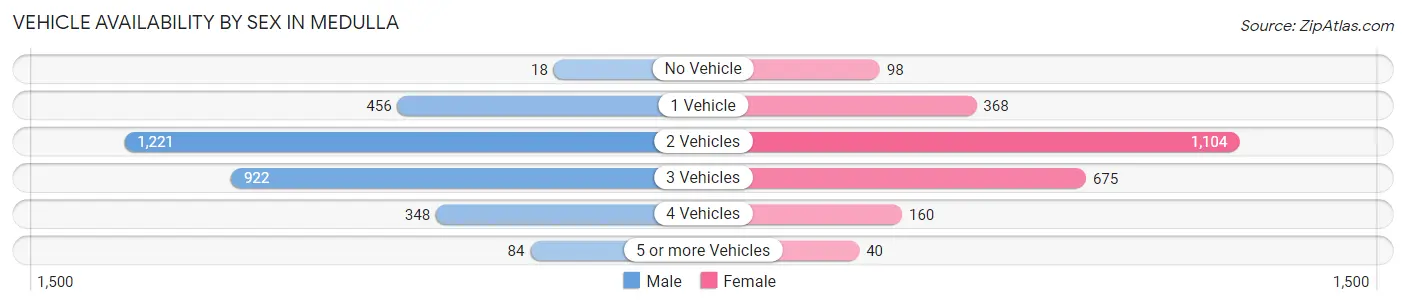
Vehicle Availability by Sex in Medulla
The most prevalent vehicle ownership categories in Medulla are males with 2 vehicles (1,221, accounting for 40.1%) and females with 2 vehicles (1,104, making up 49.9%).
| Vehicles Available | Male | Female |
| No Vehicle | 18 (0.6%) | 98 (4.0%) |
| 1 Vehicle | 456 (15.0%) | 368 (15.0%) |
| 2 Vehicles | 1,221 (40.1%) | 1,104 (45.2%) |
| 3 Vehicles | 922 (30.2%) | 675 (27.6%) |
| 4 Vehicles | 348 (11.4%) | 160 (6.5%) |
| 5 or more Vehicles | 84 (2.8%) | 40 (1.6%) |
| Total | 3,049 (100.0%) | 2,445 (100.0%) |
Commute Time in Medulla
The most frequently occuring commute durations in Medulla are 20 to 24 minutes (1,190 commuters, 24.3%), 30 to 34 minutes (881 commuters, 18.0%), and 15 to 19 minutes (816 commuters, 16.7%).
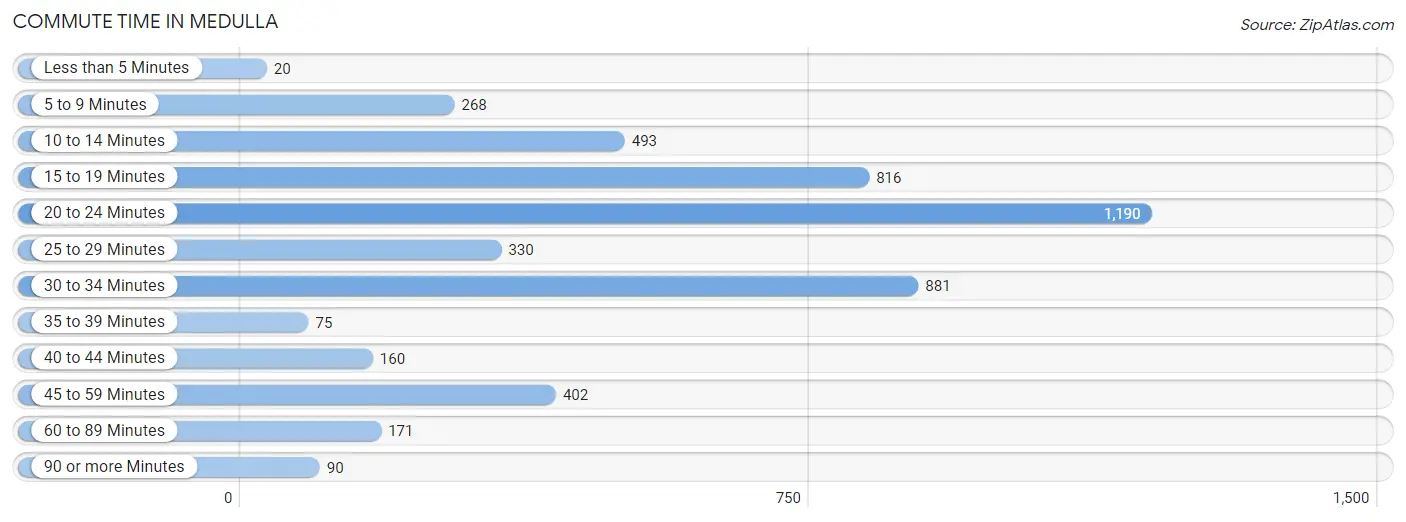
| Commute Time | # Commuters | % Commuters |
| Less than 5 Minutes | 20 | 0.4% |
| 5 to 9 Minutes | 268 | 5.5% |
| 10 to 14 Minutes | 493 | 10.1% |
| 15 to 19 Minutes | 816 | 16.7% |
| 20 to 24 Minutes | 1,190 | 24.3% |
| 25 to 29 Minutes | 330 | 6.7% |
| 30 to 34 Minutes | 881 | 18.0% |
| 35 to 39 Minutes | 75 | 1.5% |
| 40 to 44 Minutes | 160 | 3.3% |
| 45 to 59 Minutes | 402 | 8.2% |
| 60 to 89 Minutes | 171 | 3.5% |
| 90 or more Minutes | 90 | 1.8% |
Commute Time by Sex in Medulla
The most common commute times in Medulla are 20 to 24 minutes (671 commuters, 24.0%) for males and 20 to 24 minutes (519 commuters, 24.7%) for females.
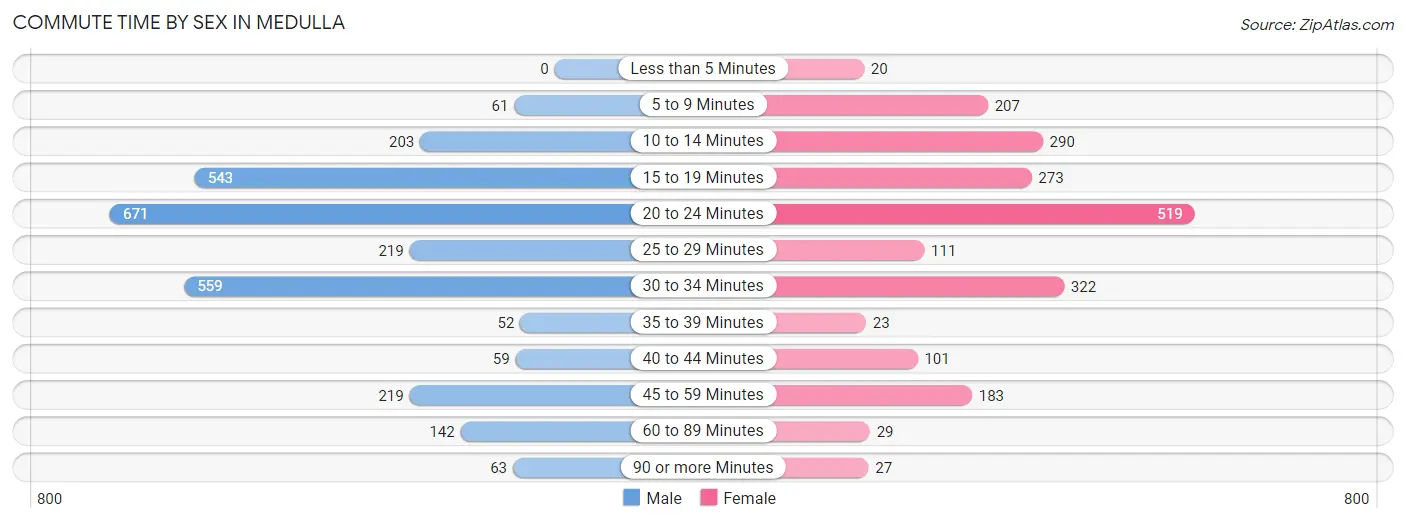
| Commute Time | Male | Female |
| Less than 5 Minutes | 0 (0.0%) | 20 (0.9%) |
| 5 to 9 Minutes | 61 (2.2%) | 207 (9.8%) |
| 10 to 14 Minutes | 203 (7.3%) | 290 (13.8%) |
| 15 to 19 Minutes | 543 (19.5%) | 273 (13.0%) |
| 20 to 24 Minutes | 671 (24.0%) | 519 (24.7%) |
| 25 to 29 Minutes | 219 (7.9%) | 111 (5.3%) |
| 30 to 34 Minutes | 559 (20.0%) | 322 (15.3%) |
| 35 to 39 Minutes | 52 (1.9%) | 23 (1.1%) |
| 40 to 44 Minutes | 59 (2.1%) | 101 (4.8%) |
| 45 to 59 Minutes | 219 (7.9%) | 183 (8.7%) |
| 60 to 89 Minutes | 142 (5.1%) | 29 (1.4%) |
| 90 or more Minutes | 63 (2.3%) | 27 (1.3%) |
Time of Departure to Work by Sex in Medulla
The most frequent times of departure to work in Medulla are 7:00 AM to 7:29 AM (578, 20.7%) for males and 7:30 AM to 7:59 AM (316, 15.0%) for females.
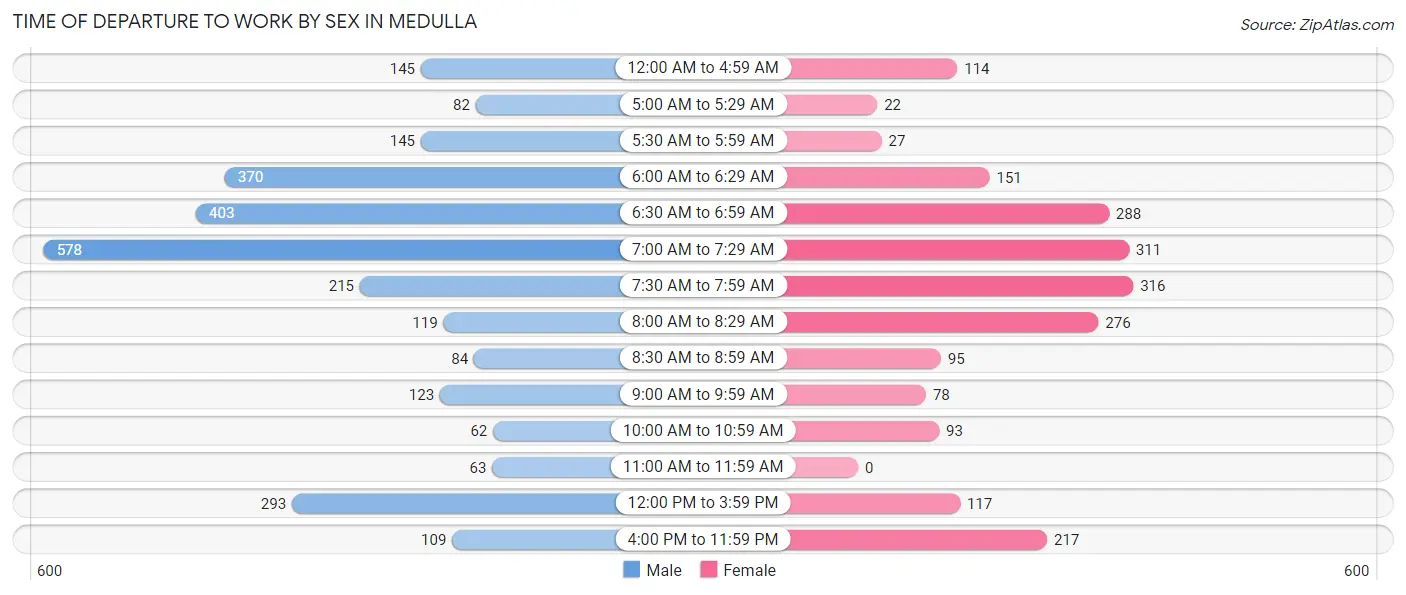
| Time of Departure | Male | Female |
| 12:00 AM to 4:59 AM | 145 (5.2%) | 114 (5.4%) |
| 5:00 AM to 5:29 AM | 82 (2.9%) | 22 (1.1%) |
| 5:30 AM to 5:59 AM | 145 (5.2%) | 27 (1.3%) |
| 6:00 AM to 6:29 AM | 370 (13.3%) | 151 (7.2%) |
| 6:30 AM to 6:59 AM | 403 (14.4%) | 288 (13.7%) |
| 7:00 AM to 7:29 AM | 578 (20.7%) | 311 (14.8%) |
| 7:30 AM to 7:59 AM | 215 (7.7%) | 316 (15.0%) |
| 8:00 AM to 8:29 AM | 119 (4.3%) | 276 (13.1%) |
| 8:30 AM to 8:59 AM | 84 (3.0%) | 95 (4.5%) |
| 9:00 AM to 9:59 AM | 123 (4.4%) | 78 (3.7%) |
| 10:00 AM to 10:59 AM | 62 (2.2%) | 93 (4.4%) |
| 11:00 AM to 11:59 AM | 63 (2.3%) | 0 (0.0%) |
| 12:00 PM to 3:59 PM | 293 (10.5%) | 117 (5.6%) |
| 4:00 PM to 11:59 PM | 109 (3.9%) | 217 (10.3%) |
| Total | 2,791 (100.0%) | 2,105 (100.0%) |
Housing Occupancy in Medulla
Occupancy by Ownership in Medulla
Of the total 4,067 dwellings in Medulla, owner-occupied units account for 2,753 (67.7%), while renter-occupied units make up 1,314 (32.3%).
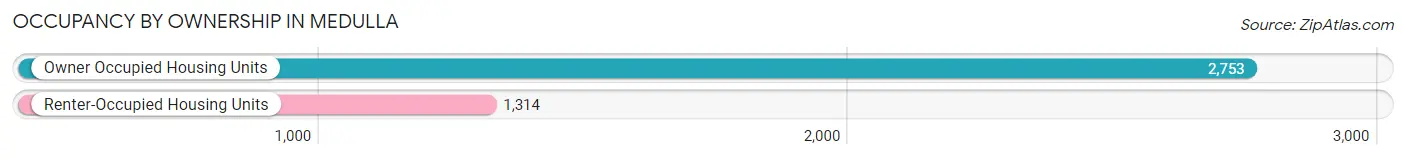
| Occupancy | # Housing Units | % Housing Units |
| Owner Occupied Housing Units | 2,753 | 67.7% |
| Renter-Occupied Housing Units | 1,314 | 32.3% |
| Total Occupied Housing Units | 4,067 | 100.0% |
Occupancy by Household Size in Medulla
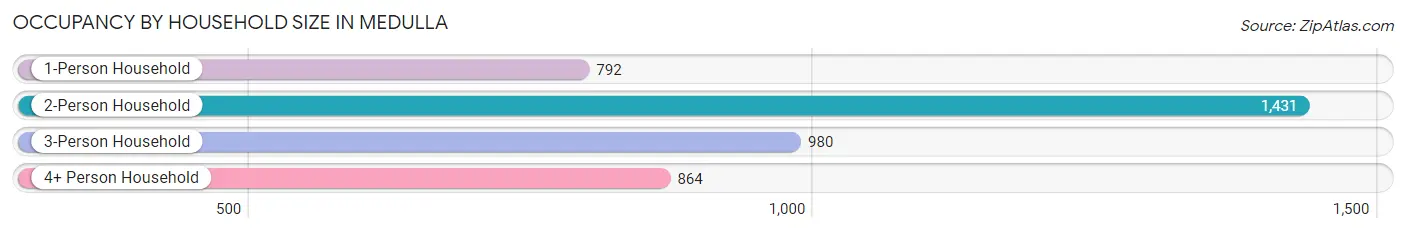
| Household Size | # Housing Units | % Housing Units |
| 1-Person Household | 792 | 19.5% |
| 2-Person Household | 1,431 | 35.2% |
| 3-Person Household | 980 | 24.1% |
| 4+ Person Household | 864 | 21.2% |
| Total Housing Units | 4,067 | 100.0% |
Occupancy by Ownership by Household Size in Medulla
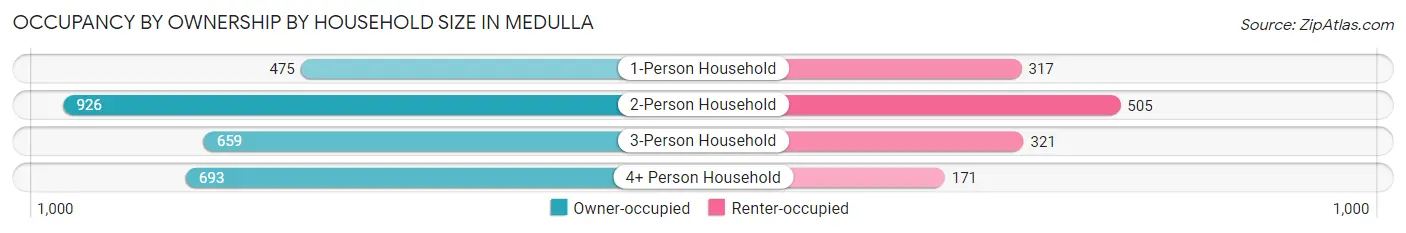
| Household Size | Owner-occupied | Renter-occupied |
| 1-Person Household | 475 (60.0%) | 317 (40.0%) |
| 2-Person Household | 926 (64.7%) | 505 (35.3%) |
| 3-Person Household | 659 (67.2%) | 321 (32.8%) |
| 4+ Person Household | 693 (80.2%) | 171 (19.8%) |
| Total Housing Units | 2,753 (67.7%) | 1,314 (32.3%) |
Occupancy by Educational Attainment in Medulla
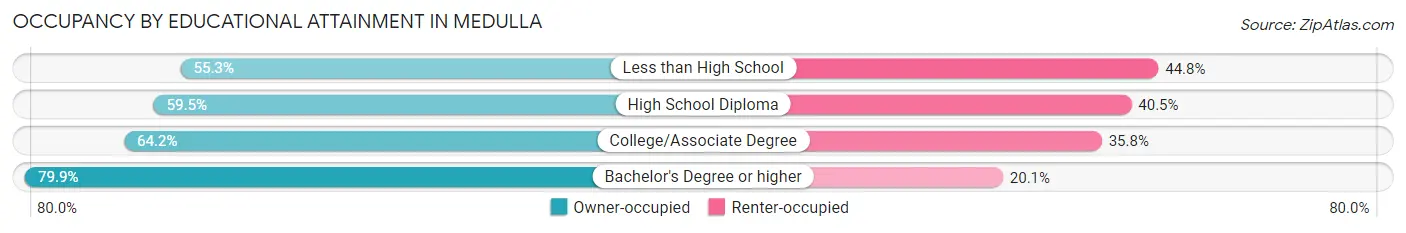
| Household Size | Owner-occupied | Renter-occupied |
| Less than High School | 163 (55.2%) | 132 (44.8%) |
| High School Diploma | 497 (59.5%) | 338 (40.5%) |
| College/Associate Degree | 1,039 (64.2%) | 579 (35.8%) |
| Bachelor's Degree or higher | 1,054 (79.9%) | 265 (20.1%) |
Occupancy by Age of Householder in Medulla
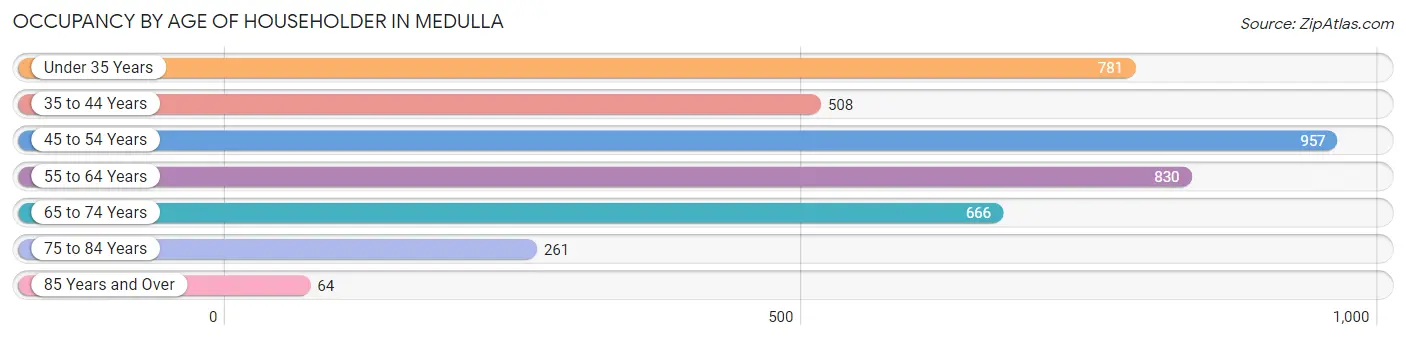
| Age Bracket | # Households | % Households |
| Under 35 Years | 781 | 19.2% |
| 35 to 44 Years | 508 | 12.5% |
| 45 to 54 Years | 957 | 23.5% |
| 55 to 64 Years | 830 | 20.4% |
| 65 to 74 Years | 666 | 16.4% |
| 75 to 84 Years | 261 | 6.4% |
| 85 Years and Over | 64 | 1.6% |
| Total | 4,067 | 100.0% |
Housing Finances in Medulla
Median Income by Occupancy in Medulla
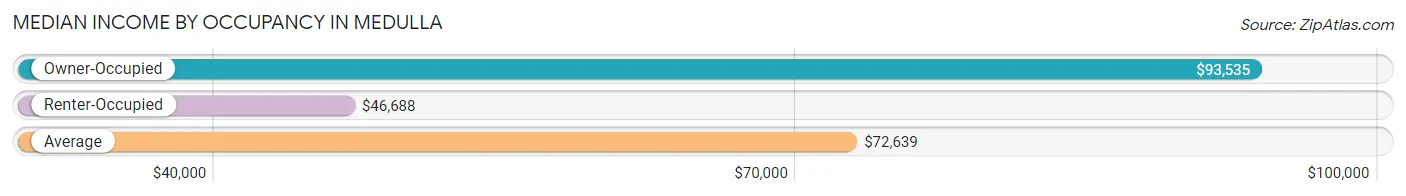
| Occupancy Type | # Households | Median Income |
| Owner-Occupied | 2,753 (67.7%) | $93,535 |
| Renter-Occupied | 1,314 (32.3%) | $46,688 |
| Average | 4,067 (100.0%) | $72,639 |
Occupancy by Householder Income Bracket in Medulla
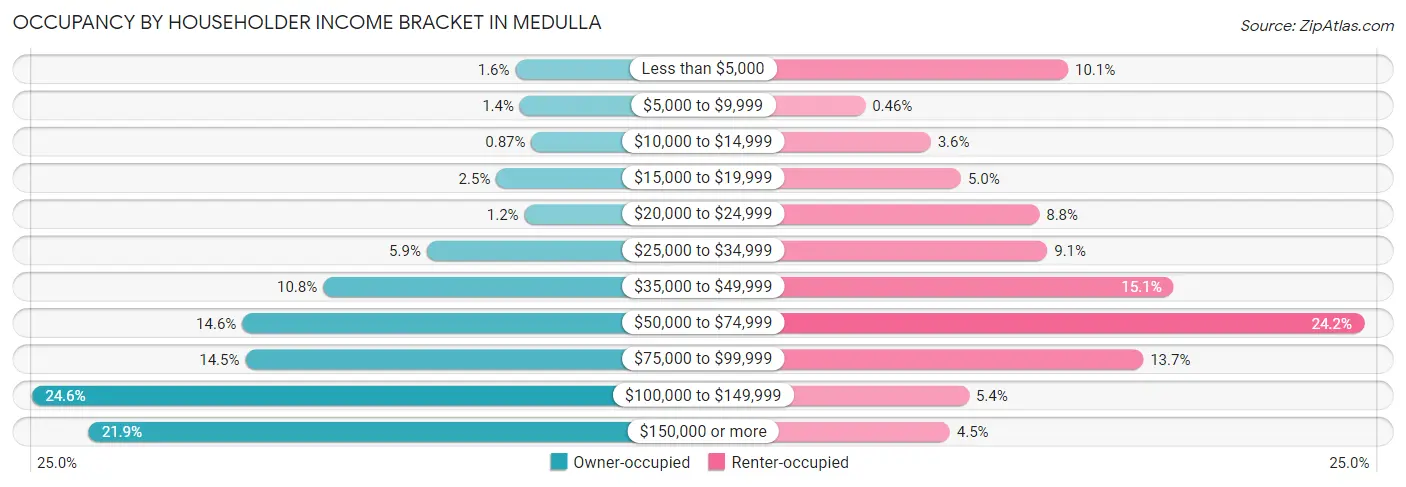
| Income Bracket | Owner-occupied | Renter-occupied |
| Less than $5,000 | 45 (1.6%) | 133 (10.1%) |
| $5,000 to $9,999 | 39 (1.4%) | 6 (0.5%) |
| $10,000 to $14,999 | 24 (0.9%) | 47 (3.6%) |
| $15,000 to $19,999 | 70 (2.5%) | 66 (5.0%) |
| $20,000 to $24,999 | 33 (1.2%) | 115 (8.7%) |
| $25,000 to $34,999 | 161 (5.9%) | 120 (9.1%) |
| $35,000 to $49,999 | 297 (10.8%) | 199 (15.1%) |
| $50,000 to $74,999 | 403 (14.6%) | 318 (24.2%) |
| $75,000 to $99,999 | 399 (14.5%) | 180 (13.7%) |
| $100,000 to $149,999 | 678 (24.6%) | 71 (5.4%) |
| $150,000 or more | 604 (21.9%) | 59 (4.5%) |
| Total | 2,753 (100.0%) | 1,314 (100.0%) |
Monthly Housing Cost Tiers in Medulla
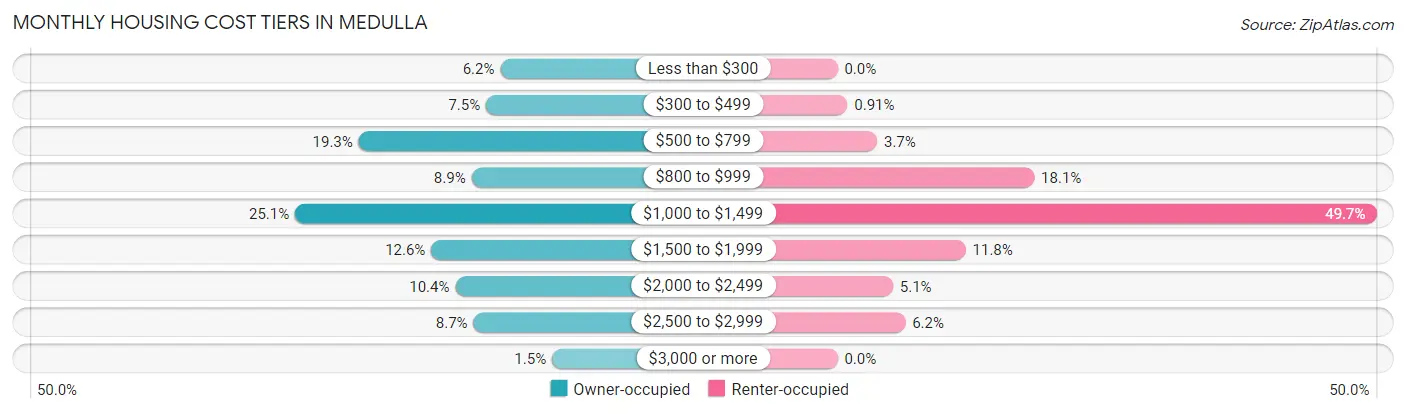
| Monthly Cost | Owner-occupied | Renter-occupied |
| Less than $300 | 171 (6.2%) | 0 (0.0%) |
| $300 to $499 | 207 (7.5%) | 12 (0.9%) |
| $500 to $799 | 530 (19.3%) | 48 (3.6%) |
| $800 to $999 | 244 (8.9%) | 238 (18.1%) |
| $1,000 to $1,499 | 691 (25.1%) | 653 (49.7%) |
| $1,500 to $1,999 | 346 (12.6%) | 155 (11.8%) |
| $2,000 to $2,499 | 285 (10.3%) | 67 (5.1%) |
| $2,500 to $2,999 | 239 (8.7%) | 82 (6.2%) |
| $3,000 or more | 40 (1.5%) | 0 (0.0%) |
| Total | 2,753 (100.0%) | 1,314 (100.0%) |
Physical Housing Characteristics in Medulla
Housing Structures in Medulla
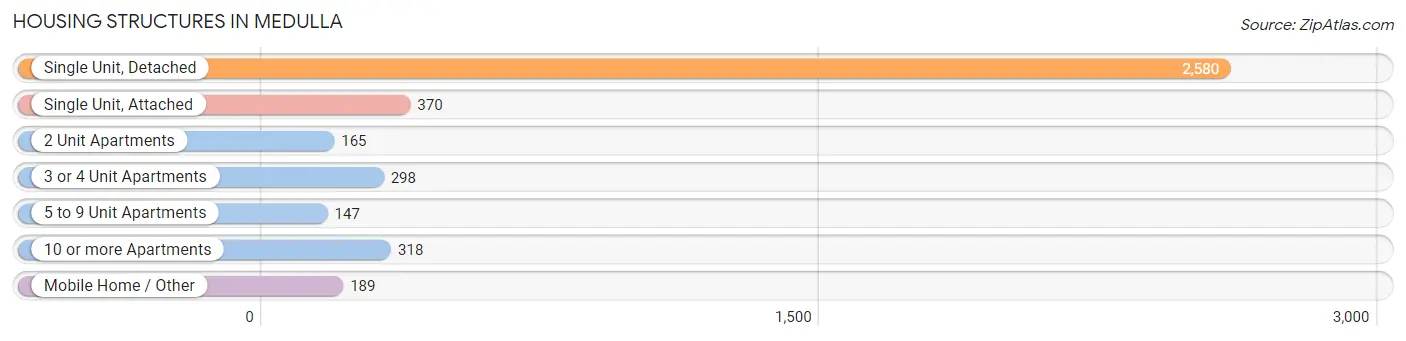
| Structure Type | # Housing Units | % Housing Units |
| Single Unit, Detached | 2,580 | 63.4% |
| Single Unit, Attached | 370 | 9.1% |
| 2 Unit Apartments | 165 | 4.1% |
| 3 or 4 Unit Apartments | 298 | 7.3% |
| 5 to 9 Unit Apartments | 147 | 3.6% |
| 10 or more Apartments | 318 | 7.8% |
| Mobile Home / Other | 189 | 4.6% |
| Total | 4,067 | 100.0% |
Housing Structures by Occupancy in Medulla
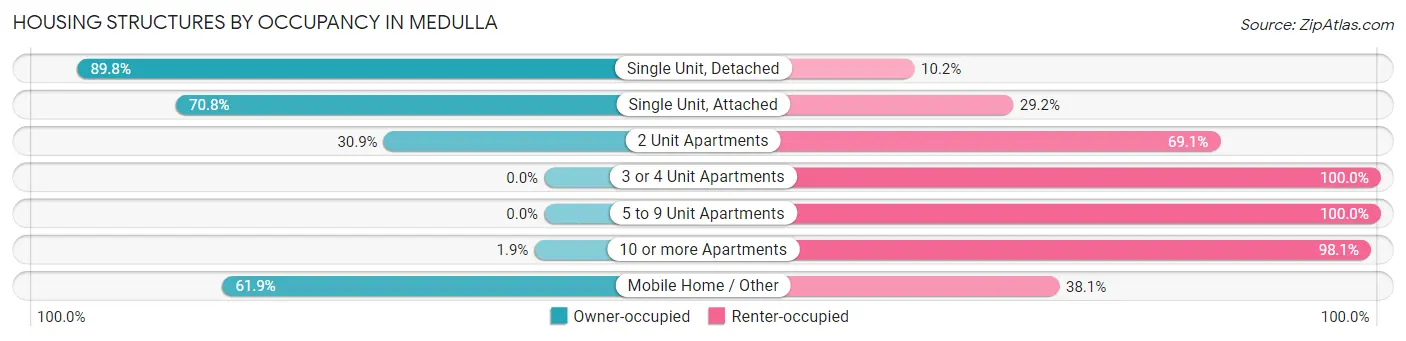
| Structure Type | Owner-occupied | Renter-occupied |
| Single Unit, Detached | 2,317 (89.8%) | 263 (10.2%) |
| Single Unit, Attached | 262 (70.8%) | 108 (29.2%) |
| 2 Unit Apartments | 51 (30.9%) | 114 (69.1%) |
| 3 or 4 Unit Apartments | 0 (0.0%) | 298 (100.0%) |
| 5 to 9 Unit Apartments | 0 (0.0%) | 147 (100.0%) |
| 10 or more Apartments | 6 (1.9%) | 312 (98.1%) |
| Mobile Home / Other | 117 (61.9%) | 72 (38.1%) |
| Total | 2,753 (67.7%) | 1,314 (32.3%) |
Housing Structures by Number of Rooms in Medulla
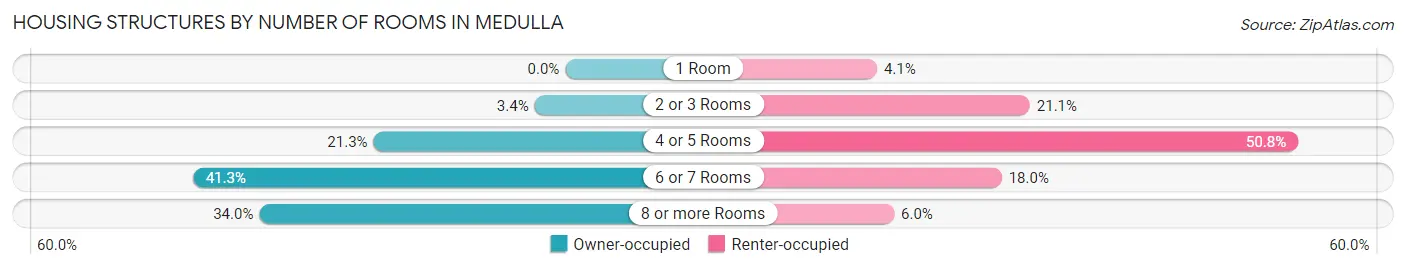
| Number of Rooms | Owner-occupied | Renter-occupied |
| 1 Room | 0 (0.0%) | 54 (4.1%) |
| 2 or 3 Rooms | 94 (3.4%) | 277 (21.1%) |
| 4 or 5 Rooms | 586 (21.3%) | 668 (50.8%) |
| 6 or 7 Rooms | 1,138 (41.3%) | 236 (18.0%) |
| 8 or more Rooms | 935 (34.0%) | 79 (6.0%) |
| Total | 2,753 (100.0%) | 1,314 (100.0%) |
Housing Structure by Heating Type in Medulla
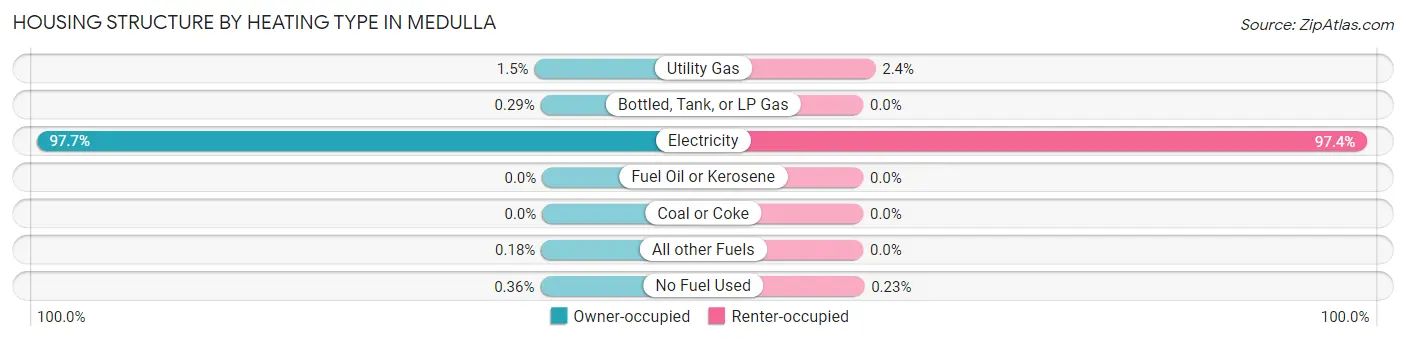
| Heating Type | Owner-occupied | Renter-occupied |
| Utility Gas | 41 (1.5%) | 31 (2.4%) |
| Bottled, Tank, or LP Gas | 8 (0.3%) | 0 (0.0%) |
| Electricity | 2,689 (97.7%) | 1,280 (97.4%) |
| Fuel Oil or Kerosene | 0 (0.0%) | 0 (0.0%) |
| Coal or Coke | 0 (0.0%) | 0 (0.0%) |
| All other Fuels | 5 (0.2%) | 0 (0.0%) |
| No Fuel Used | 10 (0.4%) | 3 (0.2%) |
| Total | 2,753 (100.0%) | 1,314 (100.0%) |
Household Vehicle Usage in Medulla
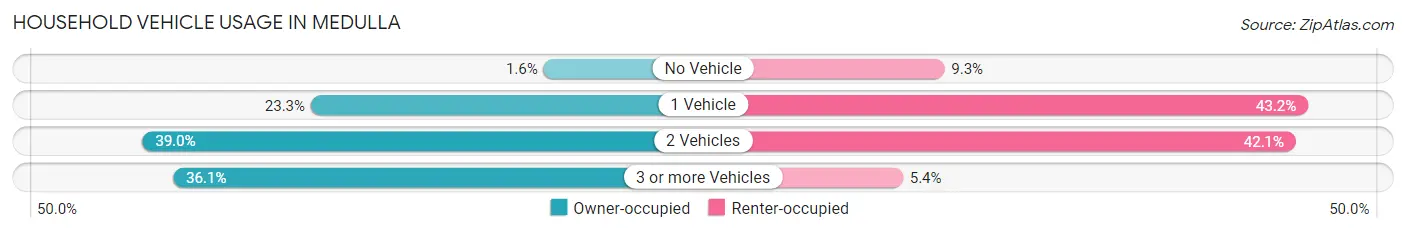
| Vehicles per Household | Owner-occupied | Renter-occupied |
| No Vehicle | 43 (1.6%) | 122 (9.3%) |
| 1 Vehicle | 641 (23.3%) | 568 (43.2%) |
| 2 Vehicles | 1,074 (39.0%) | 553 (42.1%) |
| 3 or more Vehicles | 995 (36.1%) | 71 (5.4%) |
| Total | 2,753 (100.0%) | 1,314 (100.0%) |
Real Estate & Mortgages in Medulla
Real Estate and Mortgage Overview in Medulla
| Characteristic | Without Mortgage | With Mortgage |
| Housing Units | 957 | 1,796 |
| Median Property Value | $279,100 | $261,900 |
| Median Household Income | $92,411 | $480 |
| Monthly Housing Costs | $577 | $40 |
| Real Estate Taxes | $2,110 | $97 |
Property Value by Mortgage Status in Medulla
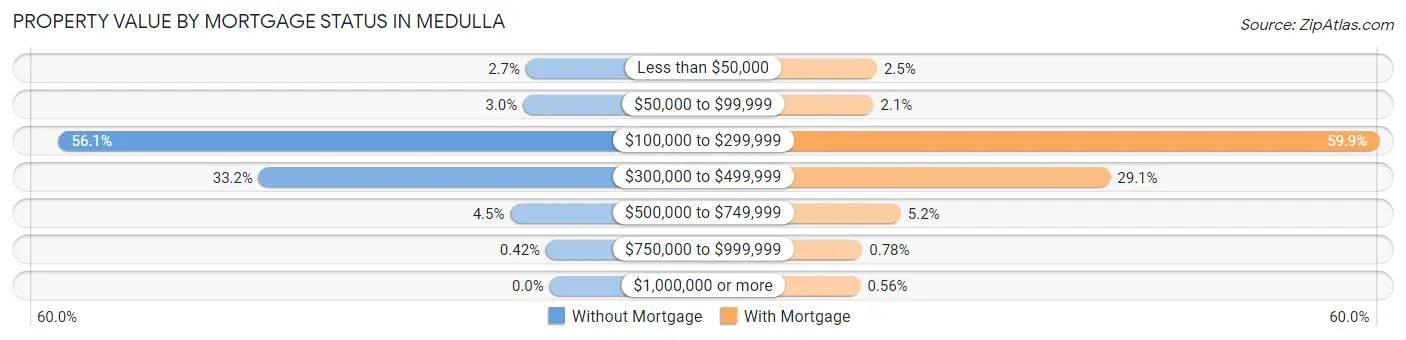
| Property Value | Without Mortgage | With Mortgage |
| Less than $50,000 | 26 (2.7%) | 44 (2.5%) |
| $50,000 to $99,999 | 29 (3.0%) | 37 (2.1%) |
| $100,000 to $299,999 | 537 (56.1%) | 1,075 (59.9%) |
| $300,000 to $499,999 | 318 (33.2%) | 523 (29.1%) |
| $500,000 to $749,999 | 43 (4.5%) | 93 (5.2%) |
| $750,000 to $999,999 | 4 (0.4%) | 14 (0.8%) |
| $1,000,000 or more | 0 (0.0%) | 10 (0.6%) |
| Total | 957 (100.0%) | 1,796 (100.0%) |
Household Income by Mortgage Status in Medulla
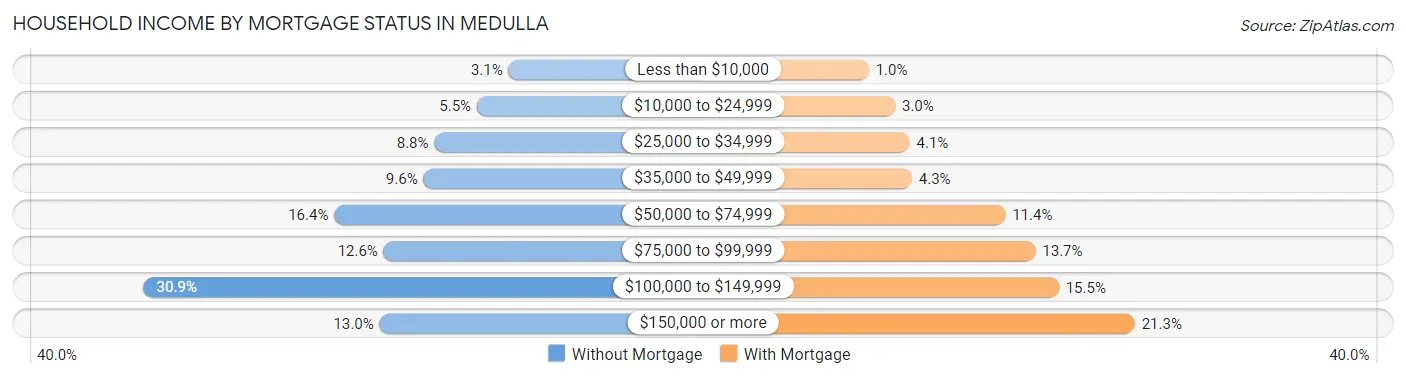
| Household Income | Without Mortgage | With Mortgage |
| Less than $10,000 | 30 (3.1%) | 18 (1.0%) |
| $10,000 to $24,999 | 53 (5.5%) | 54 (3.0%) |
| $25,000 to $34,999 | 84 (8.8%) | 74 (4.1%) |
| $35,000 to $49,999 | 92 (9.6%) | 77 (4.3%) |
| $50,000 to $74,999 | 157 (16.4%) | 205 (11.4%) |
| $75,000 to $99,999 | 121 (12.6%) | 246 (13.7%) |
| $100,000 to $149,999 | 296 (30.9%) | 278 (15.5%) |
| $150,000 or more | 124 (13.0%) | 382 (21.3%) |
| Total | 957 (100.0%) | 1,796 (100.0%) |
Property Value to Household Income Ratio in Medulla
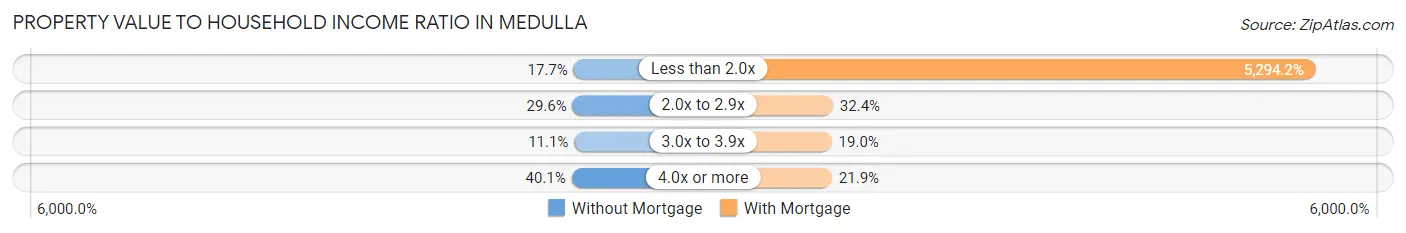
| Value-to-Income Ratio | Without Mortgage | With Mortgage |
| Less than 2.0x | 169 (17.7%) | 95,083 (5,294.1%) |
| 2.0x to 2.9x | 283 (29.6%) | 582 (32.4%) |
| 3.0x to 3.9x | 106 (11.1%) | 342 (19.0%) |
| 4.0x or more | 384 (40.1%) | 393 (21.9%) |
| Total | 957 (100.0%) | 1,796 (100.0%) |
Real Estate Taxes by Mortgage Status in Medulla
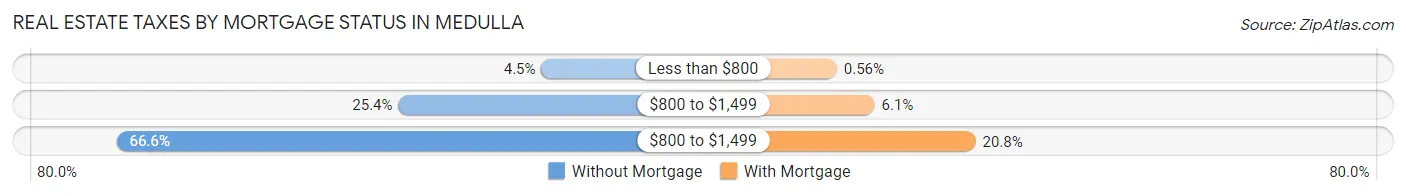
| Property Taxes | Without Mortgage | With Mortgage |
| Less than $800 | 43 (4.5%) | 10 (0.6%) |
| $800 to $1,499 | 243 (25.4%) | 109 (6.1%) |
| $800 to $1,499 | 637 (66.6%) | 374 (20.8%) |
| Total | 957 (100.0%) | 1,796 (100.0%) |
Health & Disability in Medulla
Health Insurance Coverage by Age in Medulla
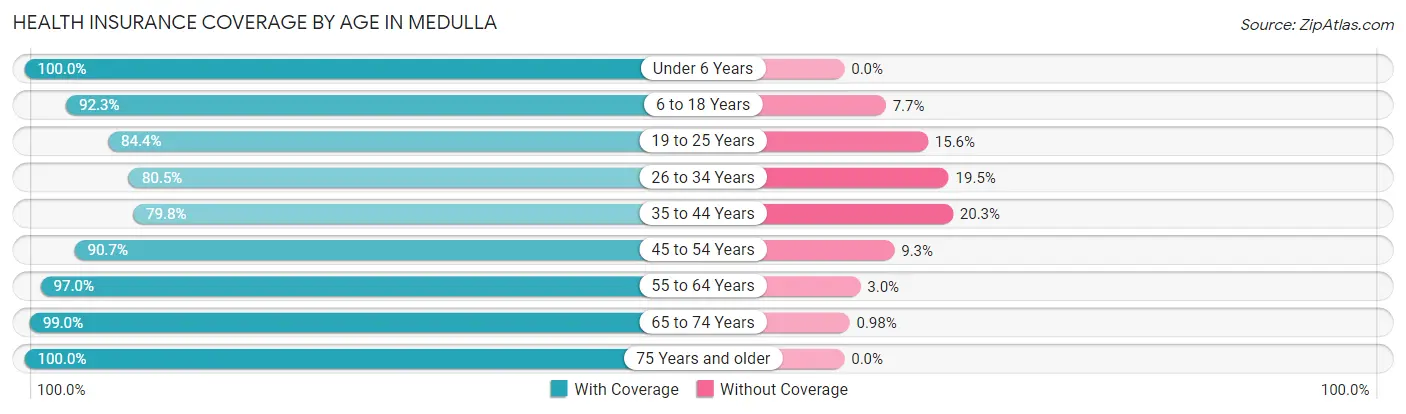
| Age Bracket | With Coverage | Without Coverage |
| Under 6 Years | 537 (100.0%) | 0 (0.0%) |
| 6 to 18 Years | 2,268 (92.3%) | 190 (7.7%) |
| 19 to 25 Years | 753 (84.4%) | 139 (15.6%) |
| 26 to 34 Years | 1,291 (80.5%) | 312 (19.5%) |
| 35 to 44 Years | 886 (79.7%) | 225 (20.3%) |
| 45 to 54 Years | 1,586 (90.7%) | 163 (9.3%) |
| 55 to 64 Years | 1,393 (97.0%) | 43 (3.0%) |
| 65 to 74 Years | 1,014 (99.0%) | 10 (1.0%) |
| 75 Years and older | 545 (100.0%) | 0 (0.0%) |
| Total | 10,273 (90.5%) | 1,082 (9.5%) |
Health Insurance Coverage by Citizenship Status in Medulla
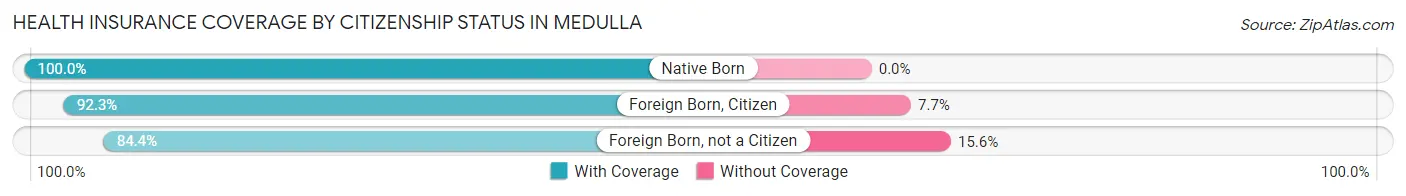
| Citizenship Status | With Coverage | Without Coverage |
| Native Born | 537 (100.0%) | 0 (0.0%) |
| Foreign Born, Citizen | 2,268 (92.3%) | 190 (7.7%) |
| Foreign Born, not a Citizen | 753 (84.4%) | 139 (15.6%) |
Health Insurance Coverage by Household Income in Medulla
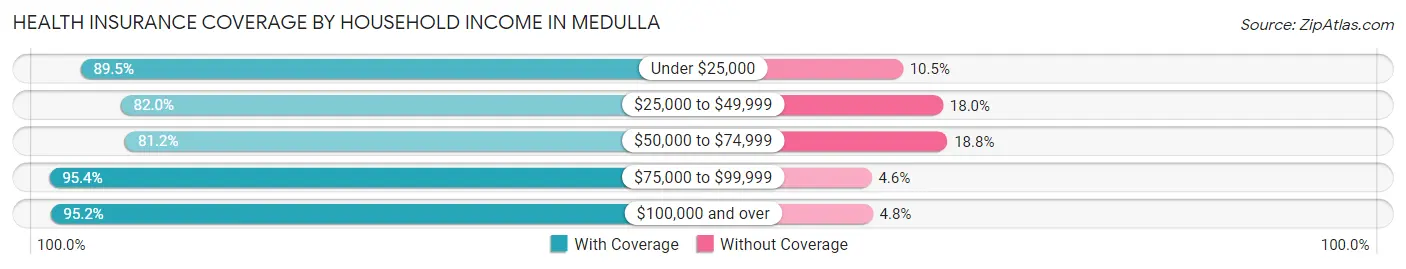
| Household Income | With Coverage | Without Coverage |
| Under $25,000 | 897 (89.5%) | 105 (10.5%) |
| $25,000 to $49,999 | 1,435 (82.0%) | 315 (18.0%) |
| $50,000 to $74,999 | 1,449 (81.2%) | 336 (18.8%) |
| $75,000 to $99,999 | 1,775 (95.4%) | 86 (4.6%) |
| $100,000 and over | 4,717 (95.2%) | 240 (4.8%) |
Public vs Private Health Insurance Coverage by Age in Medulla
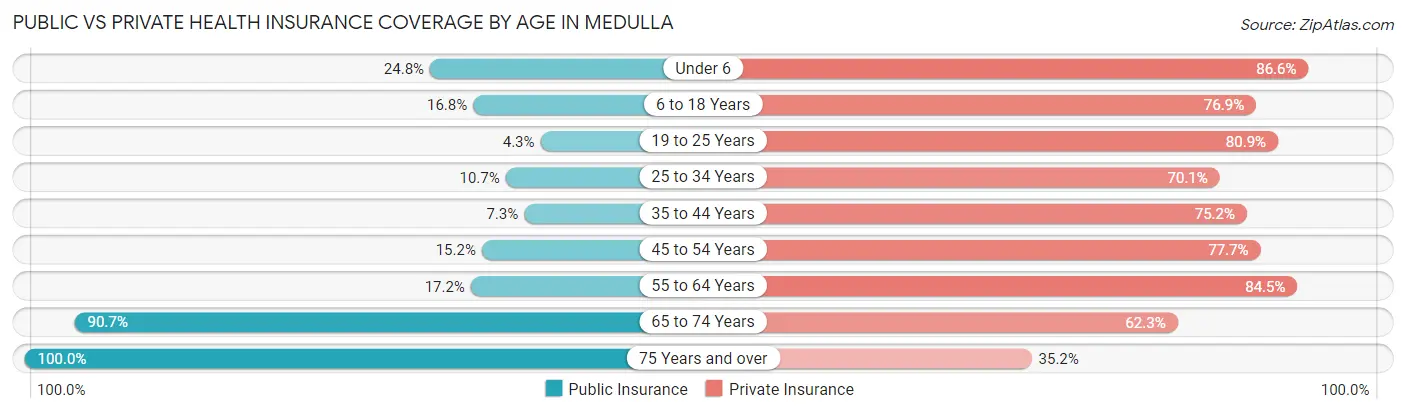
| Age Bracket | Public Insurance | Private Insurance |
| Under 6 | 133 (24.8%) | 465 (86.6%) |
| 6 to 18 Years | 412 (16.8%) | 1,890 (76.9%) |
| 19 to 25 Years | 38 (4.3%) | 722 (80.9%) |
| 25 to 34 Years | 172 (10.7%) | 1,124 (70.1%) |
| 35 to 44 Years | 81 (7.3%) | 835 (75.2%) |
| 45 to 54 Years | 265 (15.1%) | 1,359 (77.7%) |
| 55 to 64 Years | 247 (17.2%) | 1,214 (84.5%) |
| 65 to 74 Years | 929 (90.7%) | 638 (62.3%) |
| 75 Years and over | 545 (100.0%) | 192 (35.2%) |
| Total | 2,822 (24.8%) | 8,439 (74.3%) |
Disability Status by Sex by Age in Medulla
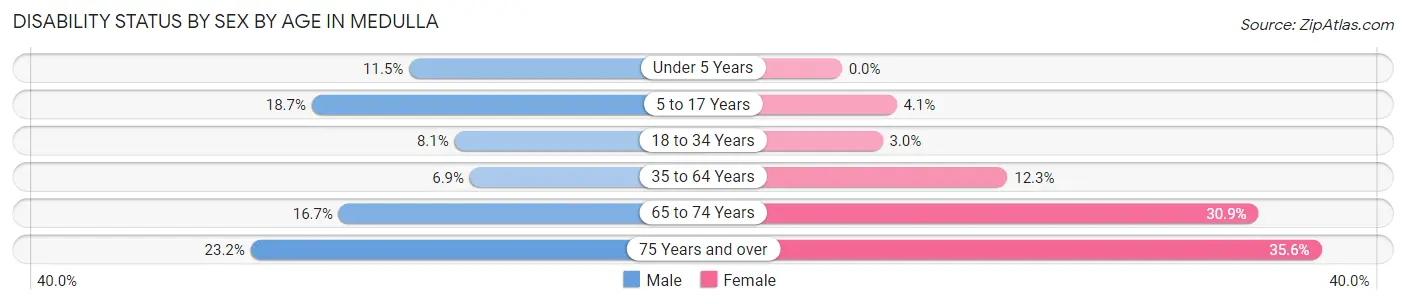
| Age Bracket | Male | Female |
| Under 5 Years | 30 (11.5%) | 0 (0.0%) |
| 5 to 17 Years | 223 (18.7%) | 41 (4.1%) |
| 18 to 34 Years | 113 (8.1%) | 43 (3.0%) |
| 35 to 64 Years | 144 (6.9%) | 273 (12.3%) |
| 65 to 74 Years | 92 (16.7%) | 146 (30.9%) |
| 75 Years and over | 62 (23.2%) | 99 (35.6%) |
Disability Class by Sex by Age in Medulla
Disability Class: Hearing Difficulty
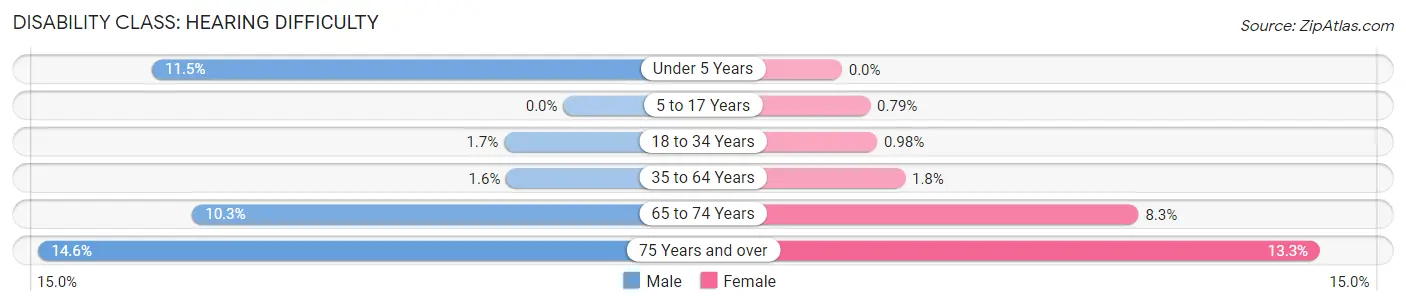
| Age Bracket | Male | Female |
| Under 5 Years | 30 (11.5%) | 0 (0.0%) |
| 5 to 17 Years | 0 (0.0%) | 8 (0.8%) |
| 18 to 34 Years | 23 (1.7%) | 14 (1.0%) |
| 35 to 64 Years | 33 (1.6%) | 39 (1.8%) |
| 65 to 74 Years | 57 (10.3%) | 39 (8.3%) |
| 75 Years and over | 39 (14.6%) | 37 (13.3%) |
Disability Class: Vision Difficulty
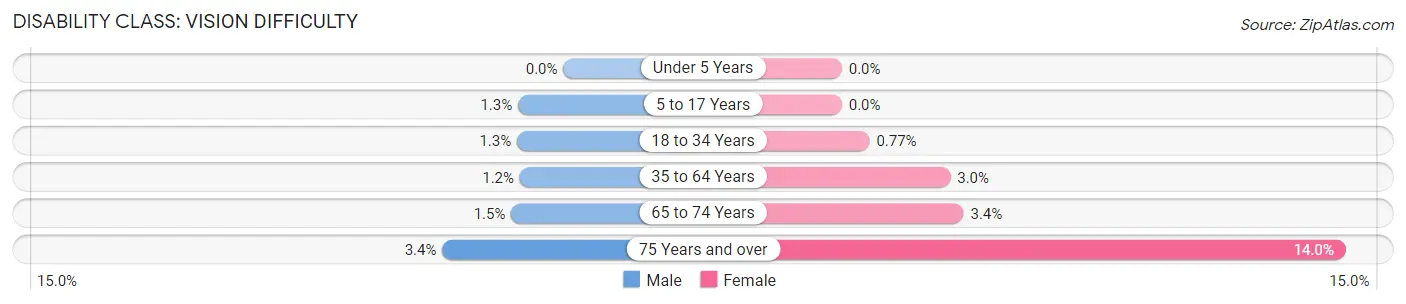
| Age Bracket | Male | Female |
| Under 5 Years | 0 (0.0%) | 0 (0.0%) |
| 5 to 17 Years | 15 (1.3%) | 0 (0.0%) |
| 18 to 34 Years | 18 (1.3%) | 11 (0.8%) |
| 35 to 64 Years | 25 (1.2%) | 67 (3.0%) |
| 65 to 74 Years | 8 (1.5%) | 16 (3.4%) |
| 75 Years and over | 9 (3.4%) | 39 (14.0%) |
Disability Class: Cognitive Difficulty
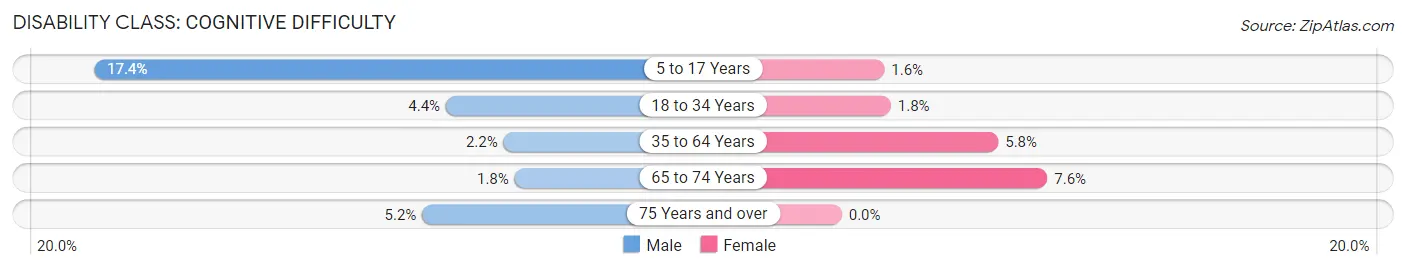
| Age Bracket | Male | Female |
| 5 to 17 Years | 208 (17.4%) | 16 (1.6%) |
| 18 to 34 Years | 61 (4.4%) | 26 (1.8%) |
| 35 to 64 Years | 46 (2.2%) | 129 (5.8%) |
| 65 to 74 Years | 10 (1.8%) | 36 (7.6%) |
| 75 Years and over | 14 (5.2%) | 0 (0.0%) |
Disability Class: Ambulatory Difficulty
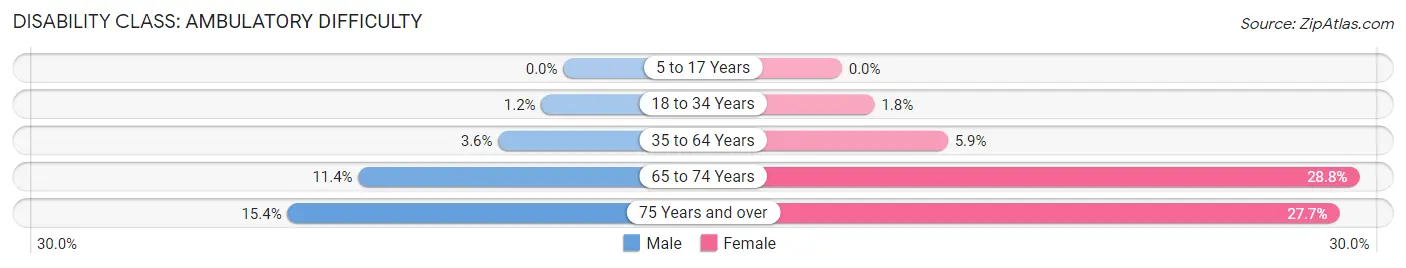
| Age Bracket | Male | Female |
| 5 to 17 Years | 0 (0.0%) | 0 (0.0%) |
| 18 to 34 Years | 17 (1.2%) | 26 (1.8%) |
| 35 to 64 Years | 75 (3.6%) | 131 (5.9%) |
| 65 to 74 Years | 63 (11.4%) | 136 (28.8%) |
| 75 Years and over | 41 (15.4%) | 77 (27.7%) |
Disability Class: Self-Care Difficulty
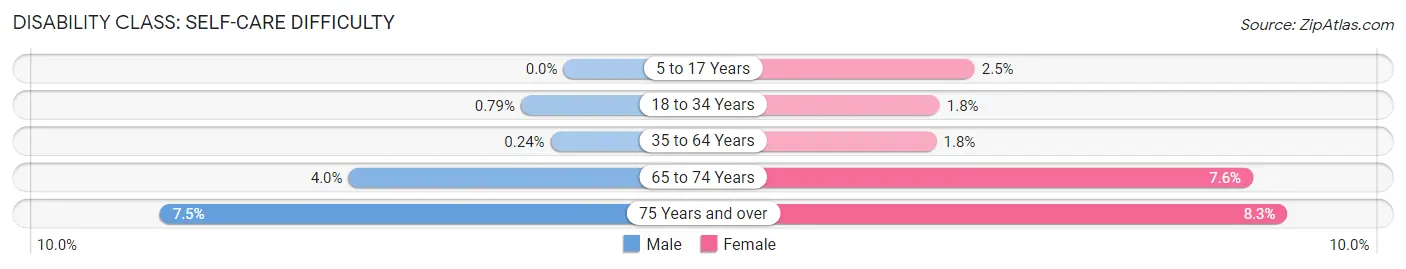
| Age Bracket | Male | Female |
| 5 to 17 Years | 0 (0.0%) | 25 (2.5%) |
| 18 to 34 Years | 11 (0.8%) | 26 (1.8%) |
| 35 to 64 Years | 5 (0.2%) | 39 (1.8%) |
| 65 to 74 Years | 22 (4.0%) | 36 (7.6%) |
| 75 Years and over | 20 (7.5%) | 23 (8.3%) |
Technology Access in Medulla
Computing Device Access in Medulla
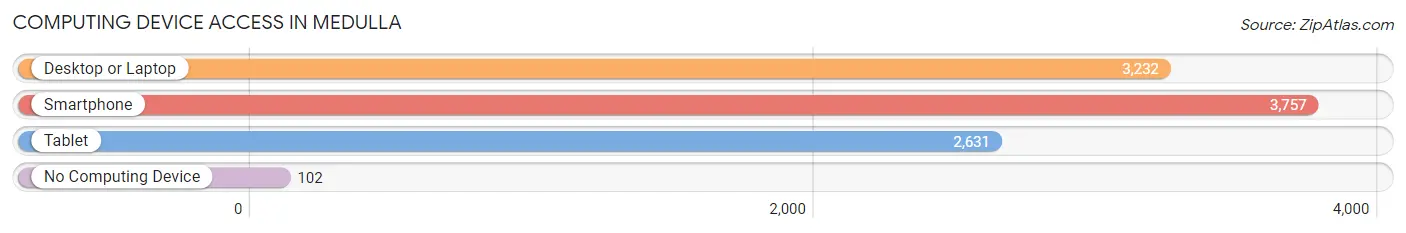
| Device Type | # Households | % Households |
| Desktop or Laptop | 3,232 | 79.5% |
| Smartphone | 3,757 | 92.4% |
| Tablet | 2,631 | 64.7% |
| No Computing Device | 102 | 2.5% |
| Total | 4,067 | 100.0% |
Internet Access in Medulla
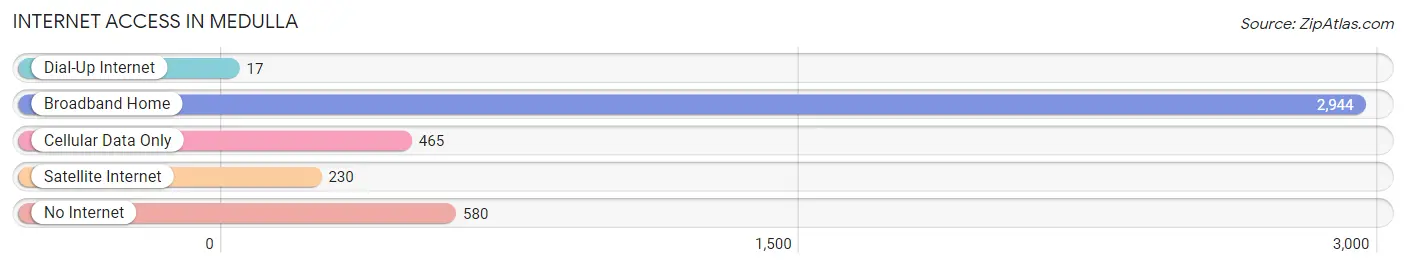
| Internet Type | # Households | % Households |
| Dial-Up Internet | 17 | 0.4% |
| Broadband Home | 2,944 | 72.4% |
| Cellular Data Only | 465 | 11.4% |
| Satellite Internet | 230 | 5.7% |
| No Internet | 580 | 14.3% |
| Total | 4,067 | 100.0% |
Medulla Summary
Medulla, Florida is a small unincorporated community located in Polk County, Florida. It is situated approximately 10 miles east of Lakeland and is part of the Lakeland-Winter Haven Metropolitan Statistical Area. The population of Medulla was estimated to be 1,845 in 2019.
History
Medulla was first settled in the late 1800s by a group of settlers from Georgia. The community was named after the nearby Medulla Creek, which was named after the Latin word for “marrow”. The first post office in Medulla was established in 1887.
In the early 1900s, Medulla was a thriving agricultural community. The main crops grown in the area were cotton, corn, and peanuts. The community also had a sawmill and a turpentine still.
In the 1920s, Medulla began to experience a population boom as more people moved to the area. The population of Medulla peaked in the 1940s, when it had a population of over 2,000 people.
Geography
Medulla is located in central Florida, approximately 10 miles east of Lakeland. The community is situated on the banks of Medulla Creek, which is a tributary of the Peace River. The terrain in the area is mostly flat, with some rolling hills. The climate in Medulla is humid subtropical, with hot, humid summers and mild winters.
Economy
The economy of Medulla is largely based on agriculture. The main crops grown in the area are cotton, corn, and peanuts. The community also has a few small businesses, including a convenience store, a gas station, and a few restaurants.
Demographics
As of 2019, the population of Medulla was estimated to be 1,845. The racial makeup of the community is predominantly white (90.2%), with African Americans (7.2%), Hispanics (1.7%), and Asians (0.9%) making up the remainder of the population. The median household income in Medulla is $41,944, and the median age is 41.7 years.
Conclusion
Medulla, Florida is a small unincorporated community located in Polk County, Florida. It is situated approximately 10 miles east of Lakeland and is part of the Lakeland-Winter Haven Metropolitan Statistical Area. The population of Medulla was estimated to be 1,845 in 2019. The economy of Medulla is largely based on agriculture, with cotton, corn, and peanuts being the main crops grown in the area. The racial makeup of the community is predominantly white, with African Americans, Hispanics, and Asians making up the remainder of the population. The median household income in Medulla is $41,944, and the median age is 41.7 years.
Common Questions
What is the Total Population of Medulla?
Total Population of Medulla is 11,355.
What is the Total Male Population of Medulla?
Total Male Population of Medulla is 5,747.
What is the Total Female Population of Medulla?
Total Female Population of Medulla is 5,608.
What is the Ratio of Males per 100 Females in Medulla?
There are 102.48 Males per 100 Females in Medulla.
What is the Ratio of Females per 100 Males in Medulla?
There are 97.58 Females per 100 Males in Medulla.
What is the Median Population Age in Medulla?
Median Population Age in Medulla is 36.8 Years.
What is the Average Family Size in Medulla
Average Family Size in Medulla is 3.2 People.
What is the Average Household Size in Medulla
Average Household Size in Medulla is 2.8 People.
What is Per Capita Income in Medulla?
Per Capita income in Medulla is $34,009.
What is the Median Family Income in Medulla?
Median Family Income in Medulla is $86,987.
What is the Median Household income in Medulla?
Median Household Income in Medulla is $72,639.
What is Income or Wage Gap in Medulla?
Income or Wage Gap in Medulla is 20.1%.
Women in Medulla earn 79.9 cents for every dollar earned by a man.
What is Inequality or Gini Index in Medulla?
Inequality or Gini Index in Medulla is 0.42.
How Large is the Labor Force in Medulla?
There are 5,769 People in the Labor Forcein in Medulla.
What is the Percentage of People in the Labor Force in Medulla?
62.7% of People are in the Labor Force in Medulla.
What is the Unemployment Rate in Medulla?
Unemployment Rate in Medulla is 2.9%.