Matlacha, FL
Matlacha Map
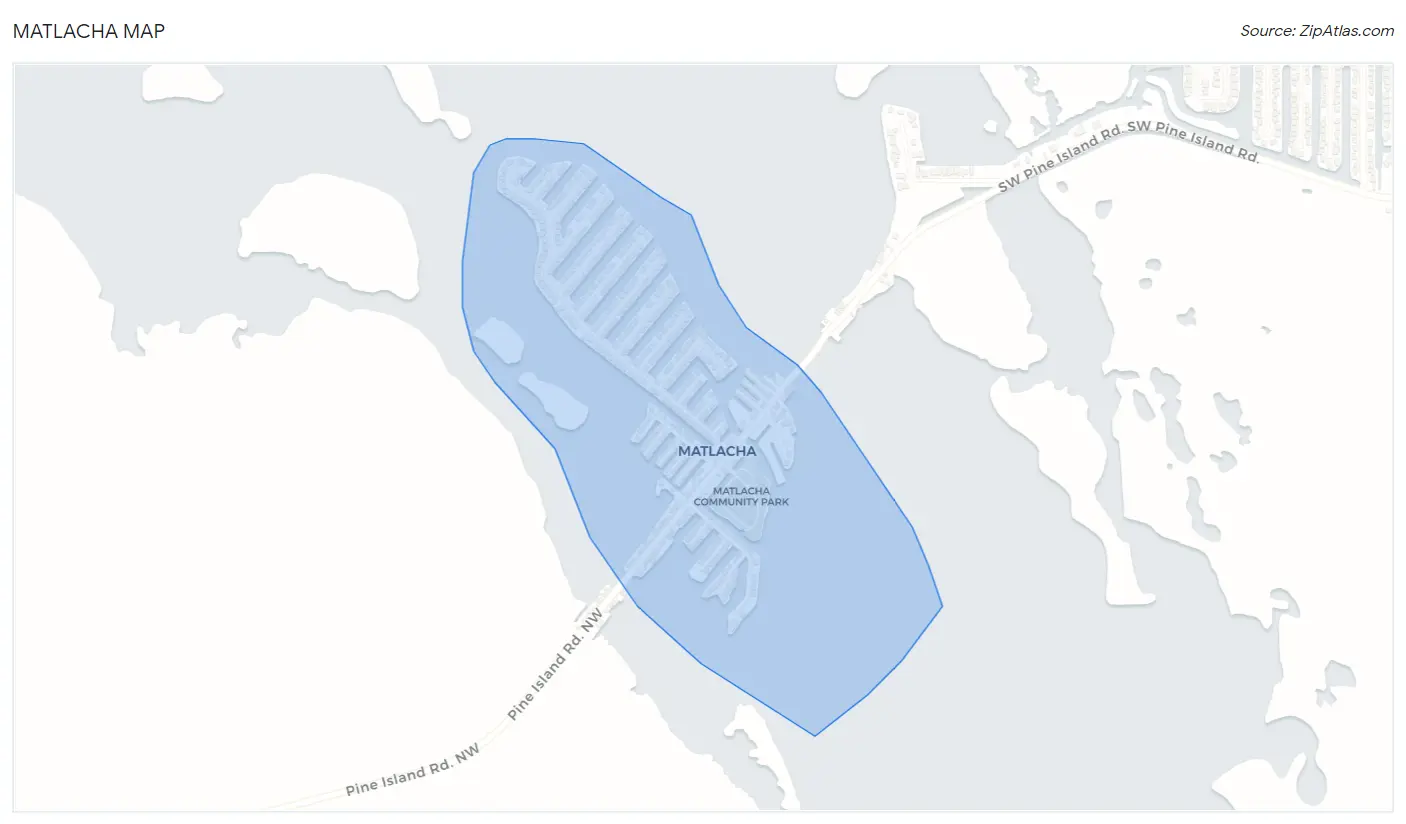
Matlacha Overview
837
TOTAL POPULATION
337
MALE POPULATION
500
FEMALE POPULATION
67.40
MALES / 100 FEMALES
148.37
FEMALES / 100 MALES
64.0
MEDIAN AGE
2.4
AVG FAMILY SIZE
1.9
AVG HOUSEHOLD SIZE
$93,762
PER CAPITA INCOME
$77,841
AVG HOUSEHOLD INCOME
92.7%
WAGE / INCOME GAP [ % ]
7.3¢/ $1
WAGE / INCOME GAP [ $ ]
$8,090
FAMILY INCOME DEFICIT
0.55
INEQUALITY / GINI INDEX
278
LABOR FORCE [ PEOPLE ]
36.4%
PERCENT IN LABOR FORCE
8.6%
UNEMPLOYMENT RATE
Matlacha Area Codes
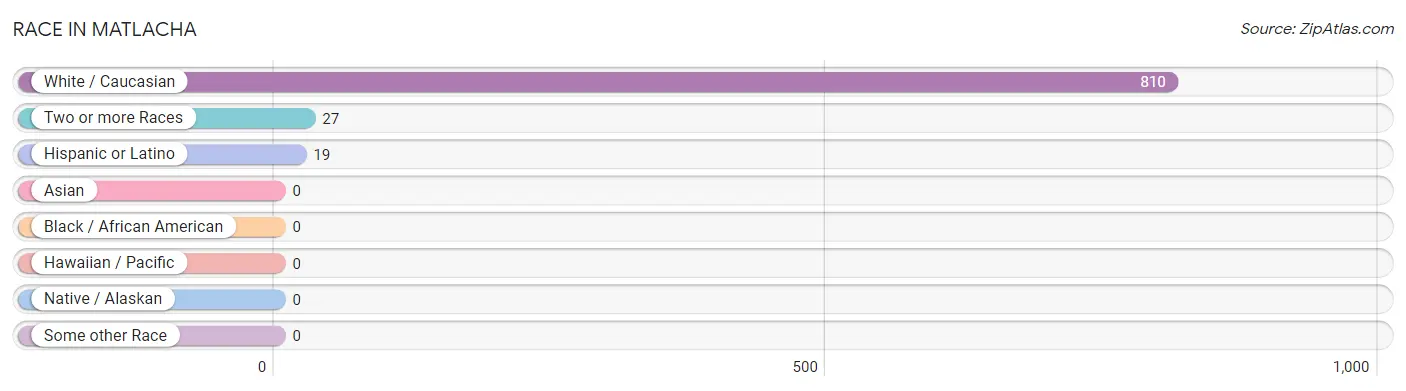
Race in Matlacha
The most populous races in Matlacha are White / Caucasian (810 | 96.8%), Two or more Races (27 | 3.2%), and Hispanic or Latino (19 | 2.3%).
| Race | # Population | % Population |
| Asian | 0 | 0.0% |
| Black / African American | 0 | 0.0% |
| Hawaiian / Pacific | 0 | 0.0% |
| Hispanic or Latino | 19 | 2.3% |
| Native / Alaskan | 0 | 0.0% |
| White / Caucasian | 810 | 96.8% |
| Two or more Races | 27 | 3.2% |
| Some other Race | 0 | 0.0% |
| Total | 837 | 100.0% |
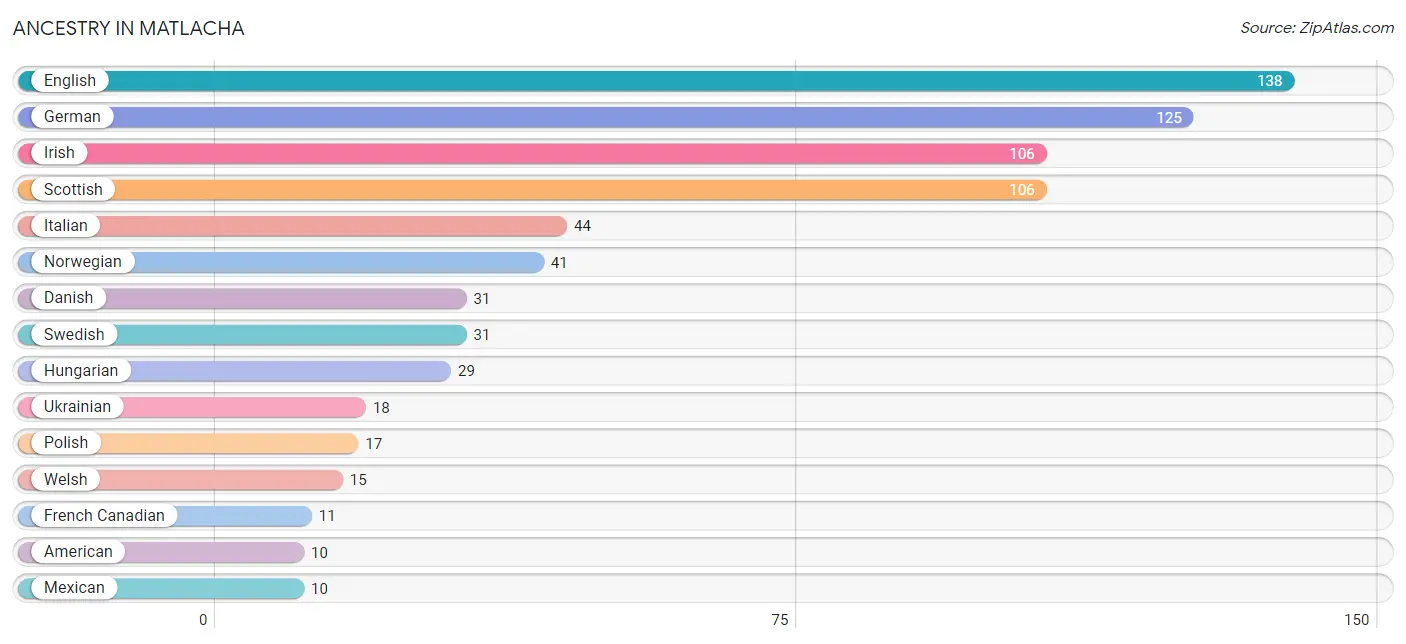
Ancestry in Matlacha
The most populous ancestries reported in Matlacha are English (138 | 16.5%), German (125 | 14.9%), Irish (106 | 12.7%), Scottish (106 | 12.7%), and Italian (44 | 5.3%), together accounting for 62.0% of all Matlacha residents.
| Ancestry | # Population | % Population |
| American | 10 | 1.2% |
| Canadian | 7 | 0.8% |
| Cuban | 9 | 1.1% |
| Danish | 31 | 3.7% |
| Dutch | 9 | 1.1% |
| English | 138 | 16.5% |
| Estonian | 9 | 1.1% |
| French Canadian | 11 | 1.3% |
| German | 125 | 14.9% |
| Hungarian | 29 | 3.5% |
| Irish | 106 | 12.7% |
| Italian | 44 | 5.3% |
| Mexican | 10 | 1.2% |
| Norwegian | 41 | 4.9% |
| Polish | 17 | 2.0% |
| Scotch-Irish | 8 | 1.0% |
| Scottish | 106 | 12.7% |
| Swedish | 31 | 3.7% |
| Swiss | 9 | 1.1% |
| Ukrainian | 18 | 2.1% |
| Welsh | 15 | 1.8% | View All 21 Rows |
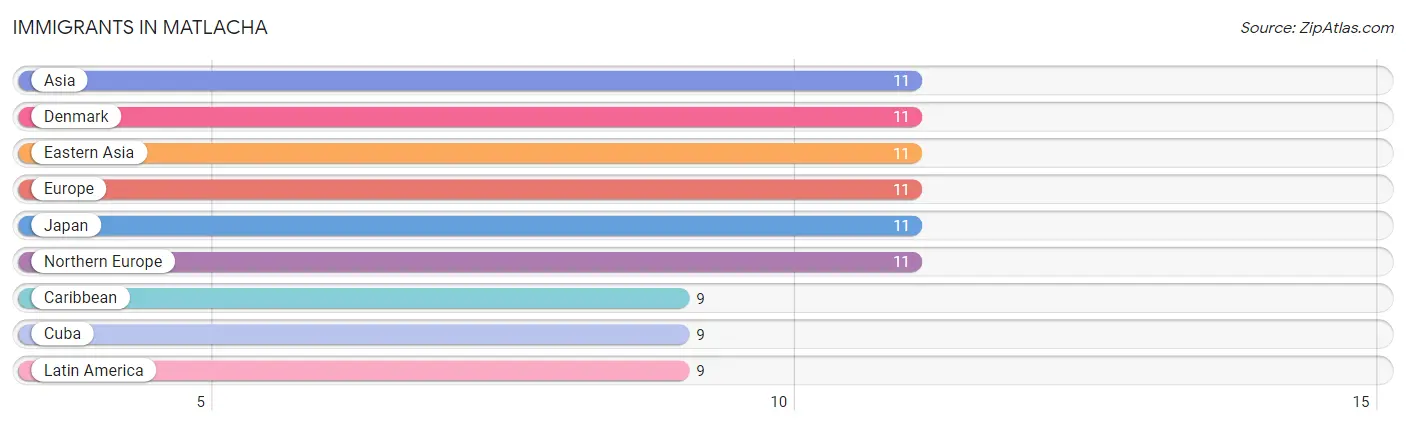
Immigrants in Matlacha
The most numerous immigrant groups reported in Matlacha came from Asia (11 | 1.3%), Denmark (11 | 1.3%), Eastern Asia (11 | 1.3%), Europe (11 | 1.3%), and Japan (11 | 1.3%), together accounting for 6.6% of all Matlacha residents.
| Immigration Origin | # Population | % Population |
| Asia | 11 | 1.3% |
| Caribbean | 9 | 1.1% |
| Cuba | 9 | 1.1% |
| Denmark | 11 | 1.3% |
| Eastern Asia | 11 | 1.3% |
| Europe | 11 | 1.3% |
| Japan | 11 | 1.3% |
| Latin America | 9 | 1.1% |
| Northern Europe | 11 | 1.3% | View All 9 Rows |
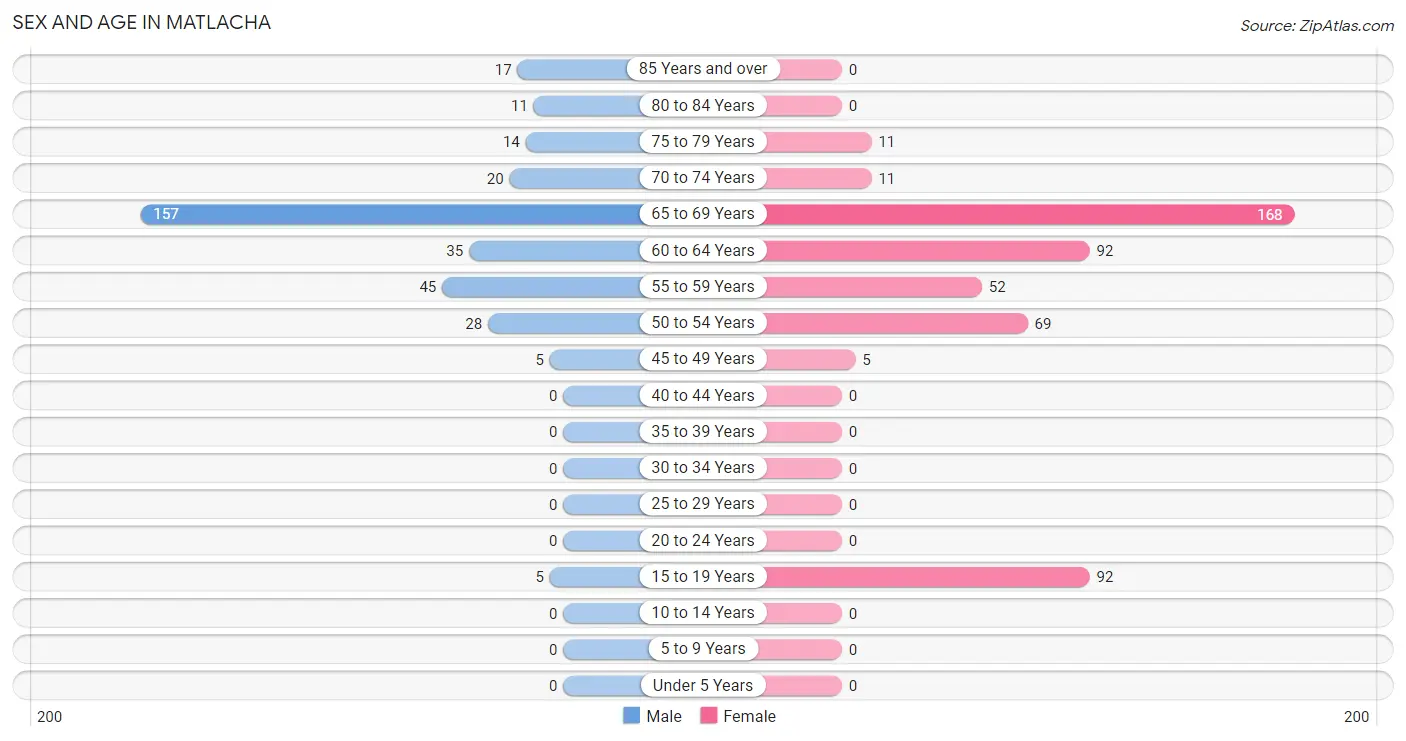
Sex and Age in Matlacha
Sex and Age in Matlacha
The most populous age groups in Matlacha are 65 to 69 Years (157 | 46.6%) for men and 65 to 69 Years (168 | 33.6%) for women.
| Age Bracket | Male | Female |
| Under 5 Years | 0 (0.0%) | 0 (0.0%) |
| 5 to 9 Years | 0 (0.0%) | 0 (0.0%) |
| 10 to 14 Years | 0 (0.0%) | 0 (0.0%) |
| 15 to 19 Years | 5 (1.5%) | 92 (18.4%) |
| 20 to 24 Years | 0 (0.0%) | 0 (0.0%) |
| 25 to 29 Years | 0 (0.0%) | 0 (0.0%) |
| 30 to 34 Years | 0 (0.0%) | 0 (0.0%) |
| 35 to 39 Years | 0 (0.0%) | 0 (0.0%) |
| 40 to 44 Years | 0 (0.0%) | 0 (0.0%) |
| 45 to 49 Years | 5 (1.5%) | 5 (1.0%) |
| 50 to 54 Years | 28 (8.3%) | 69 (13.8%) |
| 55 to 59 Years | 45 (13.4%) | 52 (10.4%) |
| 60 to 64 Years | 35 (10.4%) | 92 (18.4%) |
| 65 to 69 Years | 157 (46.6%) | 168 (33.6%) |
| 70 to 74 Years | 20 (5.9%) | 11 (2.2%) |
| 75 to 79 Years | 14 (4.2%) | 11 (2.2%) |
| 80 to 84 Years | 11 (3.3%) | 0 (0.0%) |
| 85 Years and over | 17 (5.0%) | 0 (0.0%) |
| Total | 337 (100.0%) | 500 (100.0%) |
Families and Households in Matlacha
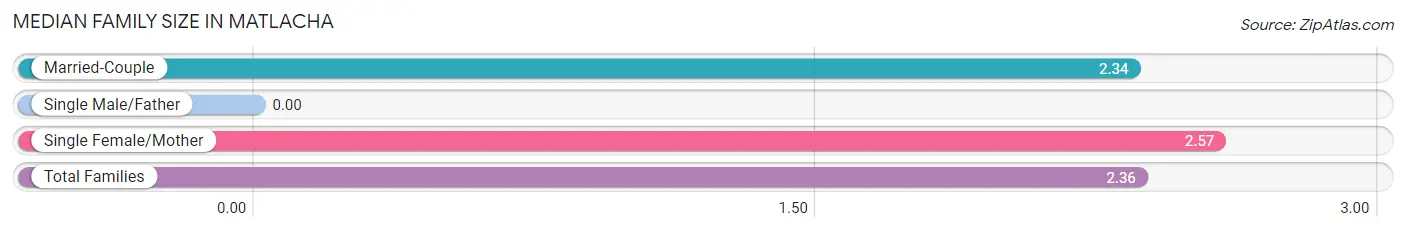
Median Family Size in Matlacha
| Family Type | # Families | Family Size |
| Married-Couple | 263 (92.0%) | 2.34 |
| Single Male/Father | 0 (0.0%) | - |
| Single Female/Mother | 23 (8.0%) | 2.57 |
| Total Families | 286 (100.0%) | 2.36 |
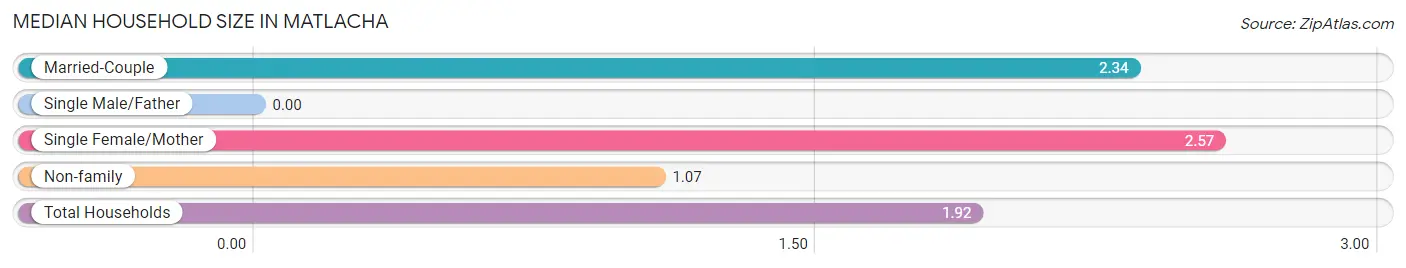
Median Household Size in Matlacha
| Household Type | # Households | Household Size |
| Married-Couple | 263 (60.2%) | 2.34 |
| Single Male/Father | 0 (0.0%) | - |
| Single Female/Mother | 23 (5.3%) | 2.57 |
| Non-family | 151 (34.5%) | 1.07 |
| Total Households | 437 (100.0%) | 1.92 |
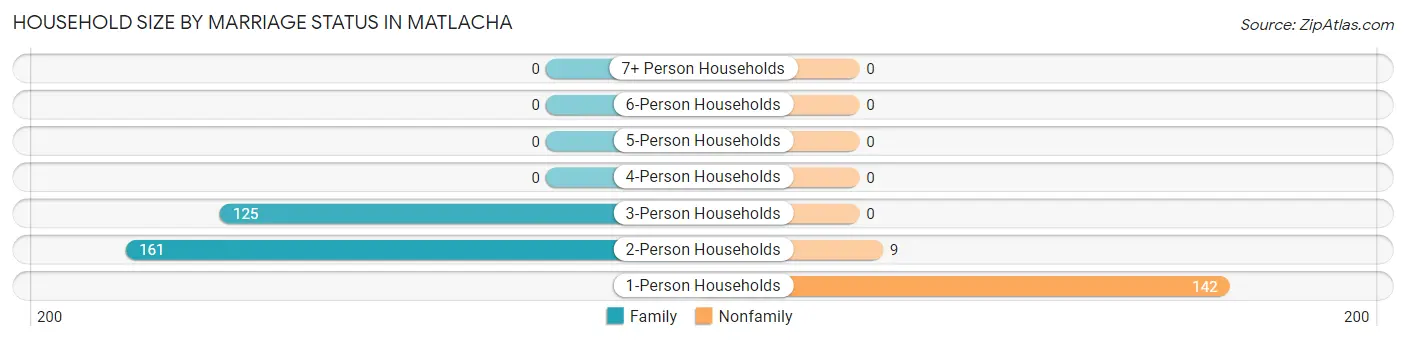
Household Size by Marriage Status in Matlacha
Out of a total of 437 households in Matlacha, 286 (65.4%) are family households, while 151 (34.5%) are nonfamily households. The most numerous type of family households are 2-person households, comprising 161, and the most common type of nonfamily households are 1-person households, comprising 142.
| Household Size | Family Households | Nonfamily Households |
| 1-Person Households | - | 142 (32.5%) |
| 2-Person Households | 161 (36.8%) | 9 (2.1%) |
| 3-Person Households | 125 (28.6%) | 0 (0.0%) |
| 4-Person Households | 0 (0.0%) | 0 (0.0%) |
| 5-Person Households | 0 (0.0%) | 0 (0.0%) |
| 6-Person Households | 0 (0.0%) | 0 (0.0%) |
| 7+ Person Households | 0 (0.0%) | 0 (0.0%) |
| Total | 286 (65.4%) | 151 (34.5%) |
Female Fertility in Matlacha
Fertility by Age in Matlacha
| Age Bracket | Women with Births | Births / 1,000 Women |
| 15 to 19 years | 0 (0.0%) | 0.0 |
| 20 to 34 years | 0 (0.0%) | 0.0 |
| 35 to 50 years | 0 (0.0%) | 0.0 |
| Total | 0 (0.0%) | 0.0 |
Fertility by Age by Marriage Status in Matlacha
| Age Bracket | Married | Unmarried |
| 15 to 19 years | 0 (0.0%) | 0 (0.0%) |
| 20 to 34 years | 0 (0.0%) | 0 (0.0%) |
| 35 to 50 years | 0 (0.0%) | 0 (0.0%) |
| Total | 0 (0.0%) | 0 (0.0%) |
Fertility by Education in Matlacha
| Educational Attainment | Women with Births | Births / 1,000 Women |
| Less than High School | 0 (0.0%) | 0.0 |
| High School Diploma | 0 (0.0%) | 0.0 |
| College or Associate's Degree | 0 (0.0%) | 0.0 |
| Bachelor's Degree | 0 (0.0%) | 0.0 |
| Graduate Degree | 0 (0.0%) | 0.0 |
| Total | 0 (0.0%) | 0.0 |
Fertility by Education by Marriage Status in Matlacha
| Educational Attainment | Married | Unmarried |
| Less than High School | 0 (0.0%) | 0 (0.0%) |
| High School Diploma | 0 (0.0%) | 0 (0.0%) |
| College or Associate's Degree | 0 (0.0%) | 0 (0.0%) |
| Bachelor's Degree | 0 (0.0%) | 0 (0.0%) |
| Graduate Degree | 0 (0.0%) | 0 (0.0%) |
| Total | 0 (0.0%) | 0 (0.0%) |
Income in Matlacha
Income Overview in Matlacha
| Characteristic | Number | Measure |
| Per Capita Income | 837 | $93,762 |
| Median Family Income | 286 | $0 |
| Mean Family Income | 286 | $251,358 |
| Median Household Income | 437 | $77,841 |
| Mean Household Income | 437 | $180,216 |
| Income Deficit | 286 | $8,090 |
| Wage / Income Gap (%) | 837 | 92.74% |
| Wage / Income Gap ($) | 837 | 7.26¢ per $1 |
| Gini / Inequality Index | 837 | 0.55 |
Earnings by Sex in Matlacha
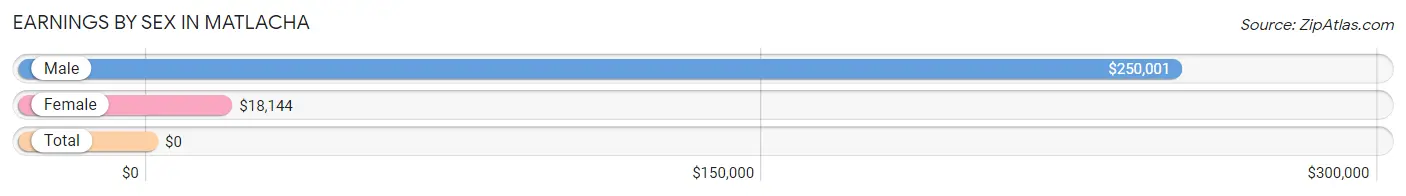
| Sex | Number | Average Earnings |
| Male | 197 (63.1%) | $250,001 |
| Female | 115 (36.9%) | $18,144 |
| Total | 312 (100.0%) | $0 |
Earnings by Sex by Income Bracket in Matlacha
The most common earnings brackets in Matlacha are $100,000+ for men (142 | 72.1%) and $17,500 to $19,999 for women (33 | 28.7%).
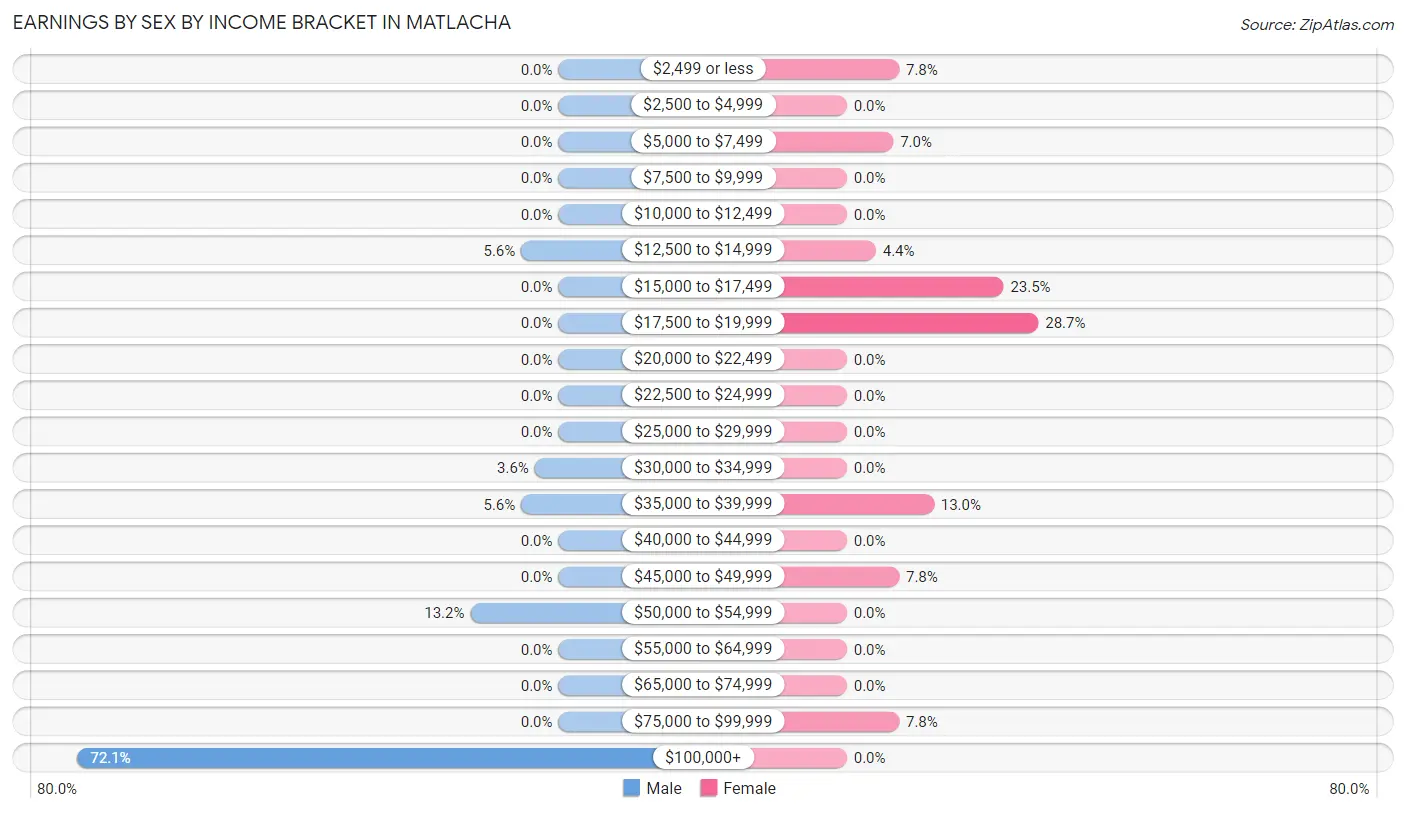
| Income | Male | Female |
| $2,499 or less | 0 (0.0%) | 9 (7.8%) |
| $2,500 to $4,999 | 0 (0.0%) | 0 (0.0%) |
| $5,000 to $7,499 | 0 (0.0%) | 8 (7.0%) |
| $7,500 to $9,999 | 0 (0.0%) | 0 (0.0%) |
| $10,000 to $12,499 | 0 (0.0%) | 0 (0.0%) |
| $12,500 to $14,999 | 11 (5.6%) | 5 (4.3%) |
| $15,000 to $17,499 | 0 (0.0%) | 27 (23.5%) |
| $17,500 to $19,999 | 0 (0.0%) | 33 (28.7%) |
| $20,000 to $22,499 | 0 (0.0%) | 0 (0.0%) |
| $22,500 to $24,999 | 0 (0.0%) | 0 (0.0%) |
| $25,000 to $29,999 | 0 (0.0%) | 0 (0.0%) |
| $30,000 to $34,999 | 7 (3.5%) | 0 (0.0%) |
| $35,000 to $39,999 | 11 (5.6%) | 15 (13.0%) |
| $40,000 to $44,999 | 0 (0.0%) | 0 (0.0%) |
| $45,000 to $49,999 | 0 (0.0%) | 9 (7.8%) |
| $50,000 to $54,999 | 26 (13.2%) | 0 (0.0%) |
| $55,000 to $64,999 | 0 (0.0%) | 0 (0.0%) |
| $65,000 to $74,999 | 0 (0.0%) | 0 (0.0%) |
| $75,000 to $99,999 | 0 (0.0%) | 9 (7.8%) |
| $100,000+ | 142 (72.1%) | 0 (0.0%) |
| Total | 197 (100.0%) | 115 (100.0%) |
Earnings by Sex by Educational Attainment in Matlacha
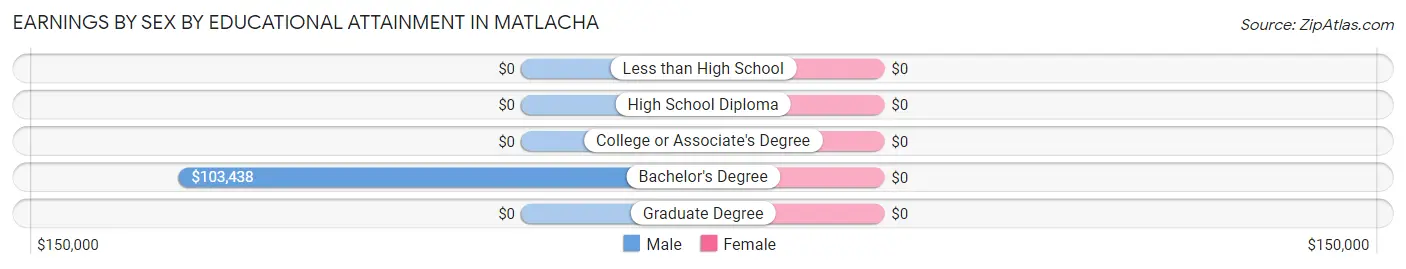
| Educational Attainment | Male Income | Female Income |
| Less than High School | - | - |
| High School Diploma | - | - |
| College or Associate's Degree | - | - |
| Bachelor's Degree | $103,438 | $0 |
| Graduate Degree | - | - |
| Total | $250,001 | $18,864 |
Family Income in Matlacha
Family Income Brackets in Matlacha
According to the Matlacha family income data, there are 142 families falling into the $200,000+ income range, which is the most common income bracket and makes up 49.6% of all families.
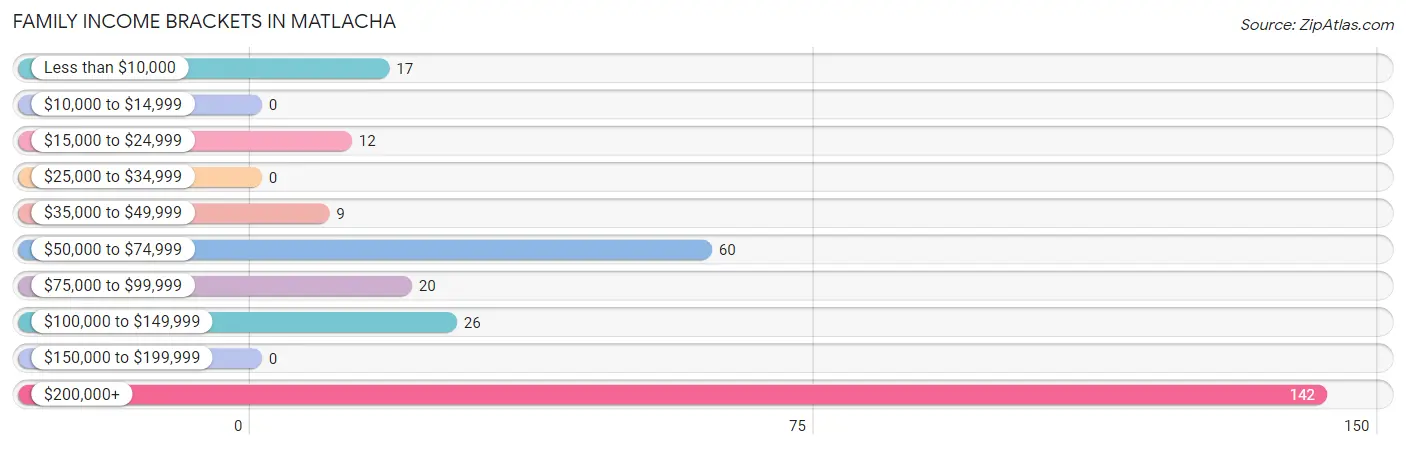
| Income Bracket | # Families | % Families |
| Less than $10,000 | 17 | 5.9% |
| $10,000 to $14,999 | 0 | 0.0% |
| $15,000 to $24,999 | 12 | 4.2% |
| $25,000 to $34,999 | 0 | 0.0% |
| $35,000 to $49,999 | 9 | 3.1% |
| $50,000 to $74,999 | 60 | 21.0% |
| $75,000 to $99,999 | 20 | 7.0% |
| $100,000 to $149,999 | 26 | 9.1% |
| $150,000 to $199,999 | 0 | 0.0% |
| $200,000+ | 142 | 49.7% |
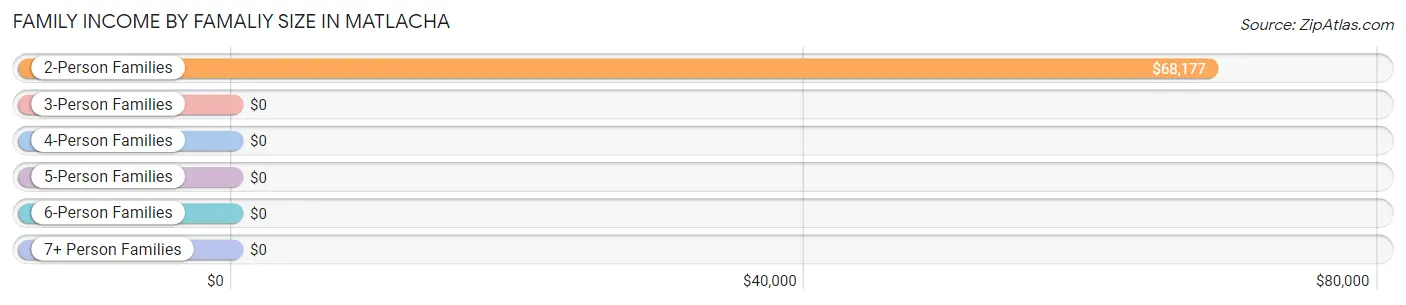
Family Income by Famaliy Size in Matlacha
2-person families (161 | 56.3%) account for the highest median family income in Matlacha with $68,177 per family, while 2-person families (161 | 56.3%) have the highest median income of $34,088 per family member.
| Income Bracket | # Families | Median Income |
| 2-Person Families | 161 (56.3%) | $68,177 |
| 3-Person Families | 125 (43.7%) | $0 |
| 4-Person Families | 0 (0.0%) | $0 |
| 5-Person Families | 0 (0.0%) | $0 |
| 6-Person Families | 0 (0.0%) | $0 |
| 7+ Person Families | 0 (0.0%) | $0 |
| Total | 286 (100.0%) | $0 |
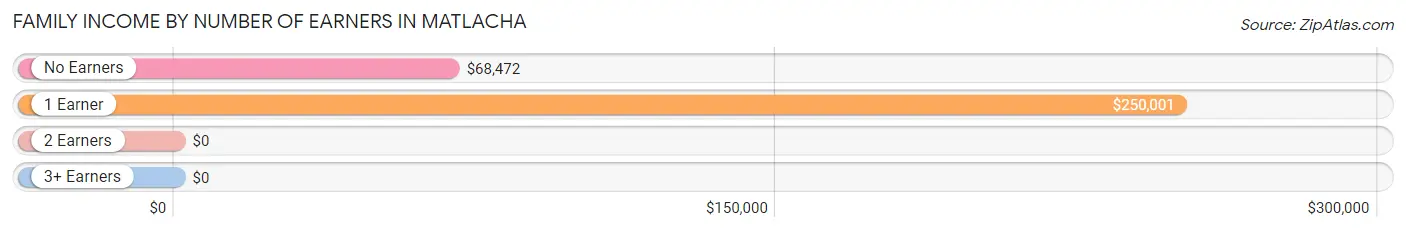
Family Income by Number of Earners in Matlacha
| Number of Earners | # Families | Median Income |
| No Earners | 69 (24.1%) | $68,472 |
| 1 Earner | 197 (68.9%) | $250,001 |
| 2 Earners | 20 (7.0%) | $0 |
| 3+ Earners | 0 (0.0%) | $0 |
| Total | 286 (100.0%) | $0 |
Household Income in Matlacha
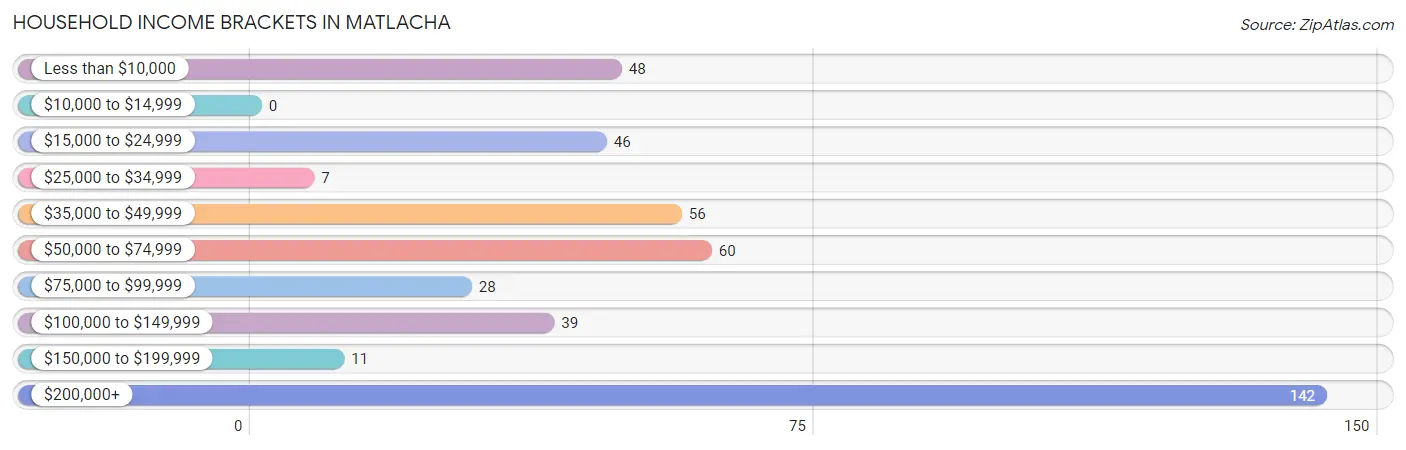
Household Income Brackets in Matlacha
With 142 households falling in the category, the $200,000+ income range is the most frequent in Matlacha, accounting for 32.5% of all households.
| Income Bracket | # Households | % Households |
| Less than $10,000 | 48 | 11.0% |
| $10,000 to $14,999 | 0 | 0.0% |
| $15,000 to $24,999 | 46 | 10.5% |
| $25,000 to $34,999 | 7 | 1.6% |
| $35,000 to $49,999 | 56 | 12.8% |
| $50,000 to $74,999 | 60 | 13.7% |
| $75,000 to $99,999 | 28 | 6.4% |
| $100,000 to $149,999 | 39 | 8.9% |
| $150,000 to $199,999 | 11 | 2.5% |
| $200,000+ | 142 | 32.5% |
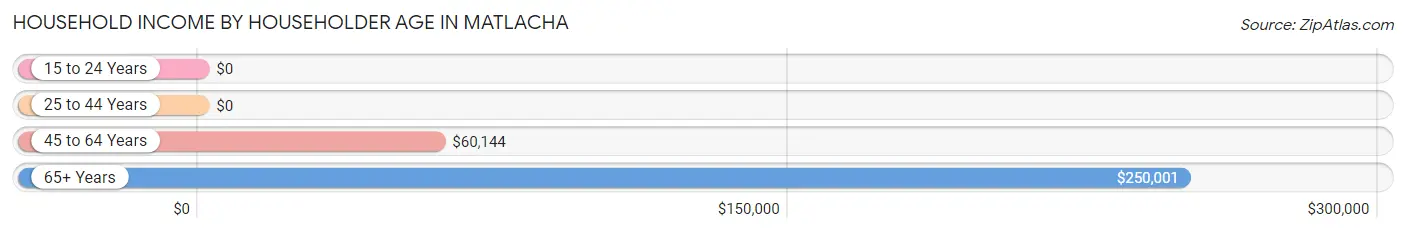
Household Income by Householder Age in Matlacha
The median household income in Matlacha is $77,841, with the highest median household income of $250,001 found in the 65+ years age bracket for the primary householder. A total of 220 households (50.3%) fall into this category.
| Income Bracket | # Households | Median Income |
| 15 to 24 Years | 0 (0.0%) | $0 |
| 25 to 44 Years | 0 (0.0%) | $0 |
| 45 to 64 Years | 217 (49.7%) | $60,144 |
| 65+ Years | 220 (50.3%) | $250,001 |
| Total | 437 (100.0%) | $77,841 |
Poverty in Matlacha
Income Below Poverty by Sex and Age in Matlacha
With 8.9% poverty level for males and 13.8% for females among the residents of Matlacha, 55 to 64 year old males and 75 year old and over females are the most vulnerable to poverty, with 20 males (25.0%) and 11 females (100.0%) in their respective age groups living below the poverty level.
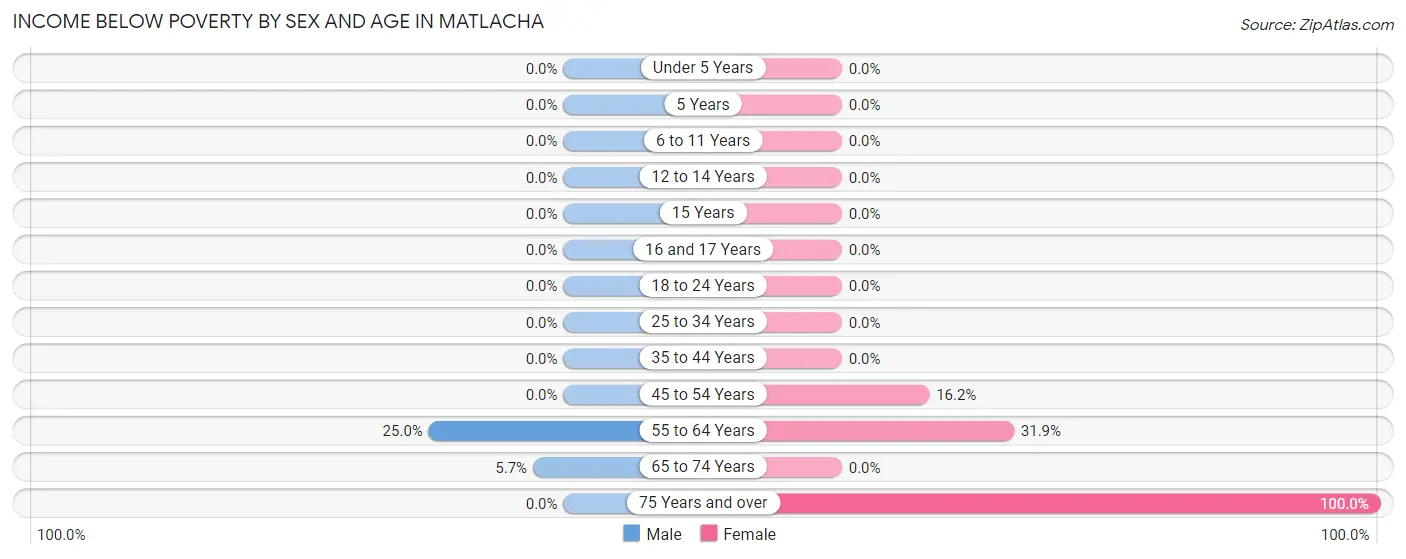
| Age Bracket | Male | Female |
| Under 5 Years | 0 (0.0%) | 0 (0.0%) |
| 5 Years | 0 (0.0%) | 0 (0.0%) |
| 6 to 11 Years | 0 (0.0%) | 0 (0.0%) |
| 12 to 14 Years | 0 (0.0%) | 0 (0.0%) |
| 15 Years | 0 (0.0%) | 0 (0.0%) |
| 16 and 17 Years | 0 (0.0%) | 0 (0.0%) |
| 18 to 24 Years | 0 (0.0%) | 0 (0.0%) |
| 25 to 34 Years | 0 (0.0%) | 0 (0.0%) |
| 35 to 44 Years | 0 (0.0%) | 0 (0.0%) |
| 45 to 54 Years | 0 (0.0%) | 12 (16.2%) |
| 55 to 64 Years | 20 (25.0%) | 46 (31.9%) |
| 65 to 74 Years | 10 (5.7%) | 0 (0.0%) |
| 75 Years and over | 0 (0.0%) | 11 (100.0%) |
| Total | 30 (8.9%) | 69 (13.8%) |
Income Above Poverty by Sex and Age in Matlacha
According to the poverty statistics in Matlacha, males aged 18 to 24 years and females aged 15 years are the age groups that are most secure financially, with 100.0% of males and 100.0% of females in these age groups living above the poverty line.
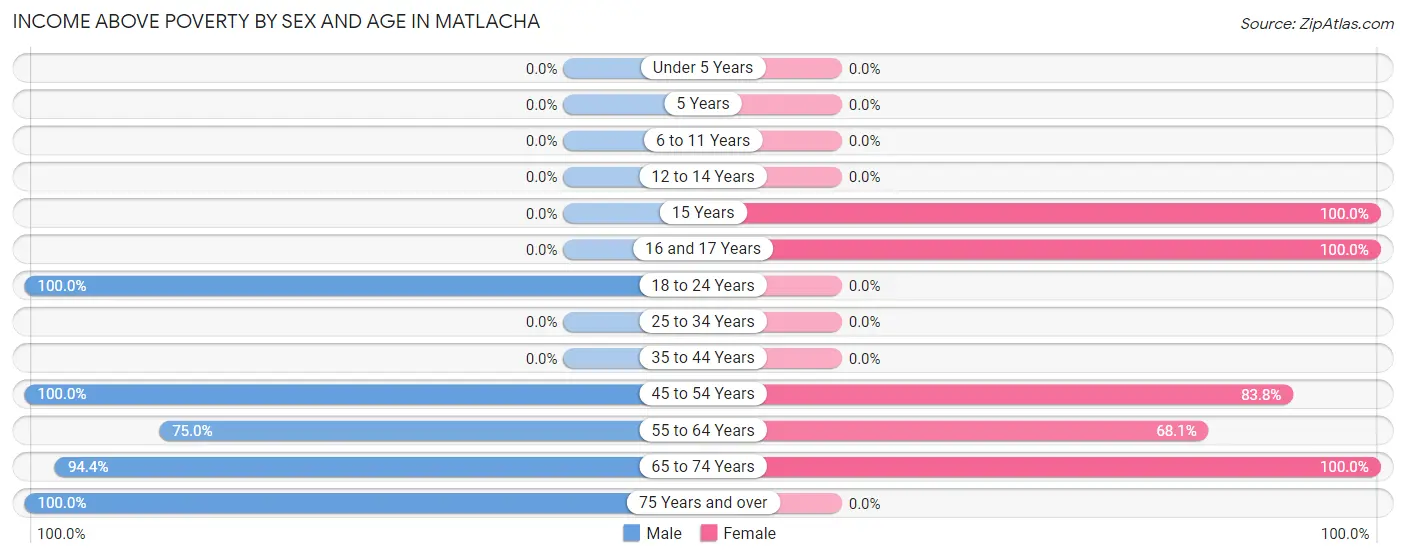
| Age Bracket | Male | Female |
| Under 5 Years | 0 (0.0%) | 0 (0.0%) |
| 5 Years | 0 (0.0%) | 0 (0.0%) |
| 6 to 11 Years | 0 (0.0%) | 0 (0.0%) |
| 12 to 14 Years | 0 (0.0%) | 0 (0.0%) |
| 15 Years | 0 (0.0%) | 73 (100.0%) |
| 16 and 17 Years | 0 (0.0%) | 19 (100.0%) |
| 18 to 24 Years | 5 (100.0%) | 0 (0.0%) |
| 25 to 34 Years | 0 (0.0%) | 0 (0.0%) |
| 35 to 44 Years | 0 (0.0%) | 0 (0.0%) |
| 45 to 54 Years | 33 (100.0%) | 62 (83.8%) |
| 55 to 64 Years | 60 (75.0%) | 98 (68.1%) |
| 65 to 74 Years | 167 (94.4%) | 179 (100.0%) |
| 75 Years and over | 42 (100.0%) | 0 (0.0%) |
| Total | 307 (91.1%) | 431 (86.2%) |
Income Below Poverty Among Married-Couple Families in Matlacha
The poverty statistics for married-couple families in Matlacha show that 11.0% or 29 of the total 263 families live below the poverty line. Families with no children have the highest poverty rate of 20.3%, comprising of 29 families. On the other hand, families with 1 or 2 children have the lowest poverty rate of 0.0%, which includes 0 families.
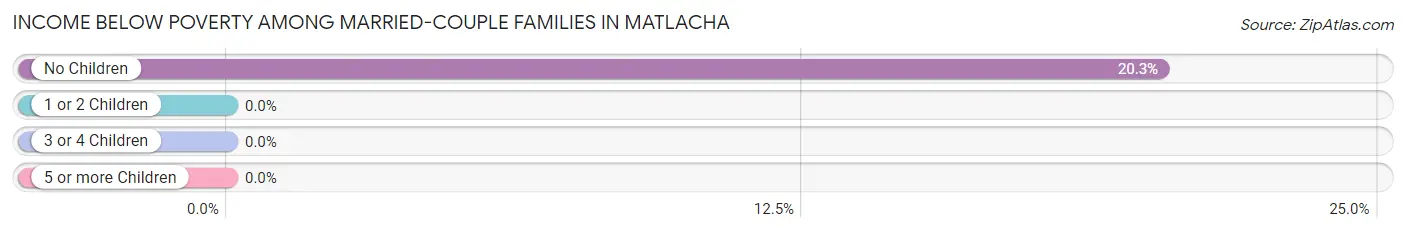
| Children | Above Poverty | Below Poverty |
| No Children | 114 (79.7%) | 29 (20.3%) |
| 1 or 2 Children | 120 (100.0%) | 0 (0.0%) |
| 3 or 4 Children | 0 (0.0%) | 0 (0.0%) |
| 5 or more Children | 0 (0.0%) | 0 (0.0%) |
| Total | 234 (89.0%) | 29 (11.0%) |
Income Below Poverty Among Single-Parent Households in Matlacha
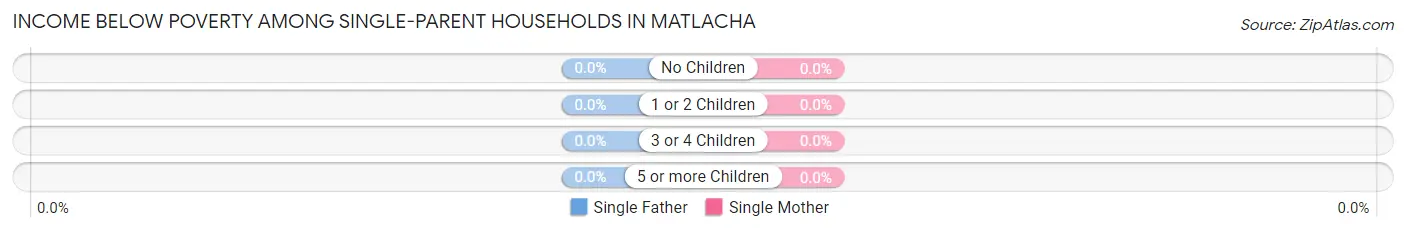
| Children | Single Father | Single Mother |
| No Children | 0 (0.0%) | 0 (0.0%) |
| 1 or 2 Children | 0 (0.0%) | 0 (0.0%) |
| 3 or 4 Children | 0 (0.0%) | 0 (0.0%) |
| 5 or more Children | 0 (0.0%) | 0 (0.0%) |
| Total | 0 (0.0%) | 0 (0.0%) |
Income Below Poverty Among Married-Couple vs Single-Parent Households in Matlacha
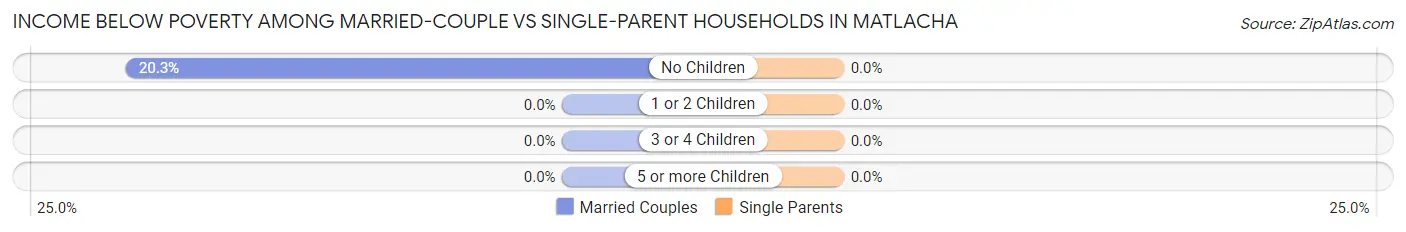
| Children | Married-Couple Families | Single-Parent Households |
| No Children | 29 (20.3%) | 0 (0.0%) |
| 1 or 2 Children | 0 (0.0%) | 0 (0.0%) |
| 3 or 4 Children | 0 (0.0%) | 0 (0.0%) |
| 5 or more Children | 0 (0.0%) | 0 (0.0%) |
| Total | 29 (11.0%) | 0 (0.0%) |
Employment Characteristics in Matlacha
Employment by Class of Employer in Matlacha
Among the 254 employed individuals in Matlacha, self-employed (incorporated) (133 | 52.4%), private company employees (98 | 38.6%), and self-employed (not incorporated) (9 | 3.5%) make up the most common classes of employment.
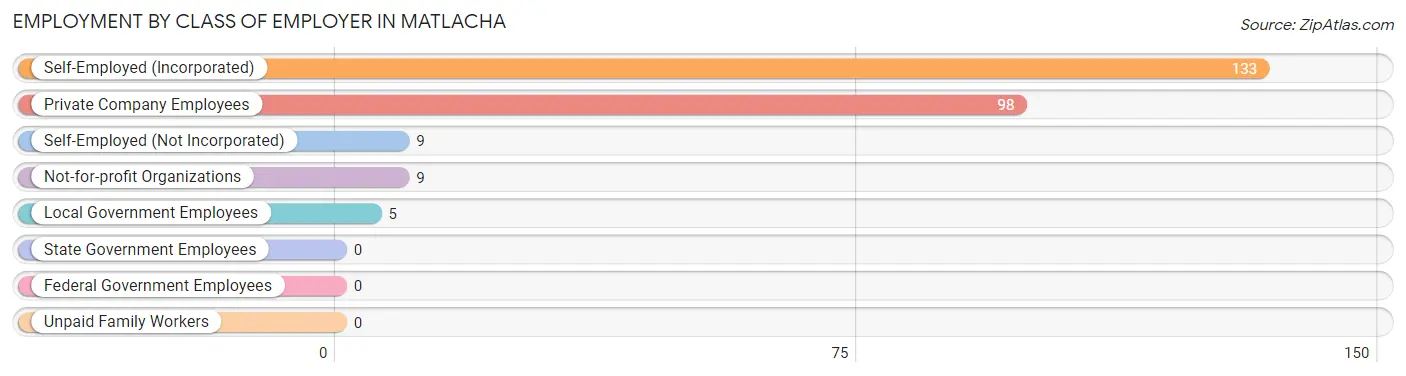
| Employer Class | # Employees | % Employees |
| Private Company Employees | 98 | 38.6% |
| Self-Employed (Incorporated) | 133 | 52.4% |
| Self-Employed (Not Incorporated) | 9 | 3.5% |
| Not-for-profit Organizations | 9 | 3.5% |
| Local Government Employees | 5 | 2.0% |
| State Government Employees | 0 | 0.0% |
| Federal Government Employees | 0 | 0.0% |
| Unpaid Family Workers | 0 | 0.0% |
| Total | 254 | 100.0% |
Employment Status by Age in Matlacha
According to the labor force statistics for Matlacha, out of the total population over 16 years of age (764), 36.4% or 278 individuals are in the labor force, with 8.6% or 24 of them unemployed. The age group with the highest labor force participation rate is 16 to 19 years, with 79.2% or 19 individuals in the labor force. Within the labor force, the 45 to 54 years age range has the highest percentage of unemployed individuals, with 31.2% or 24 of them being unemployed.
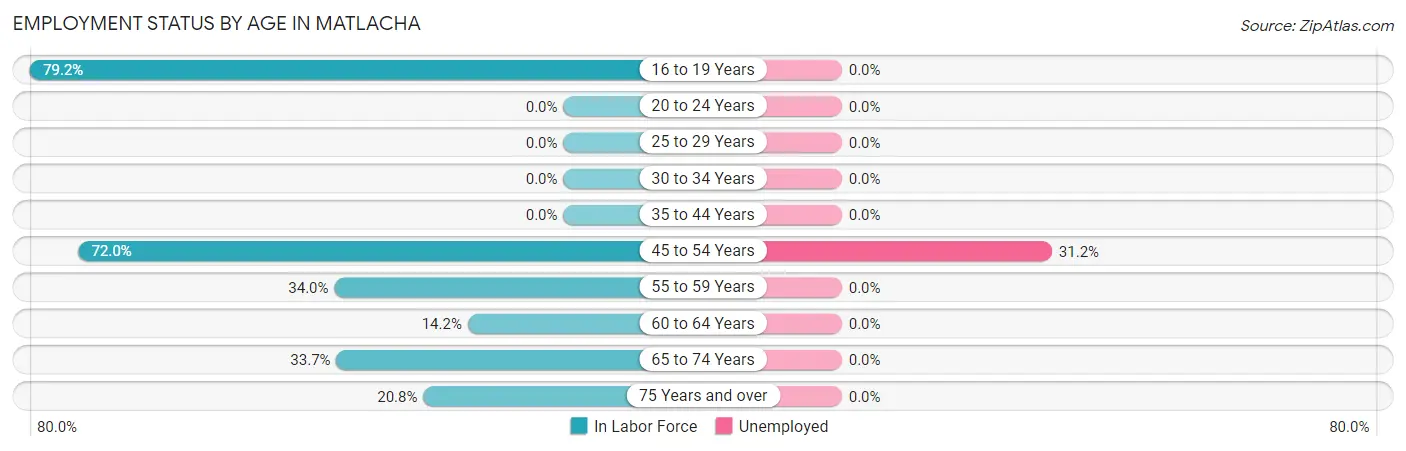
| Age Bracket | In Labor Force | Unemployed |
| 16 to 19 Years | 19 (79.2%) | 0 (0.0%) |
| 20 to 24 Years | 0 (0.0%) | 0 (0.0%) |
| 25 to 29 Years | 0 (0.0%) | 0 (0.0%) |
| 30 to 34 Years | 0 (0.0%) | 0 (0.0%) |
| 35 to 44 Years | 0 (0.0%) | 0 (0.0%) |
| 45 to 54 Years | 77 (72.0%) | 24 (31.2%) |
| 55 to 59 Years | 33 (34.0%) | 0 (0.0%) |
| 60 to 64 Years | 18 (14.2%) | 0 (0.0%) |
| 65 to 74 Years | 120 (33.7%) | 0 (0.0%) |
| 75 Years and over | 11 (20.8%) | 0 (0.0%) |
| Total | 278 (36.4%) | 24 (8.6%) |
Employment Status by Educational Attainment in Matlacha
According to labor force statistics for Matlacha, 38.7% of individuals (128) out of the total population between 25 and 64 years of age (331) are in the labor force, with 18.8% or 24 of them being unemployed. The group with the highest labor force participation rate are those with the educational attainment of high school diploma, with 51.5% or 35 individuals in the labor force. Within the labor force, individuals with high school diploma education have the highest percentage of unemployment, with 68.6% or 24 of them being unemployed.
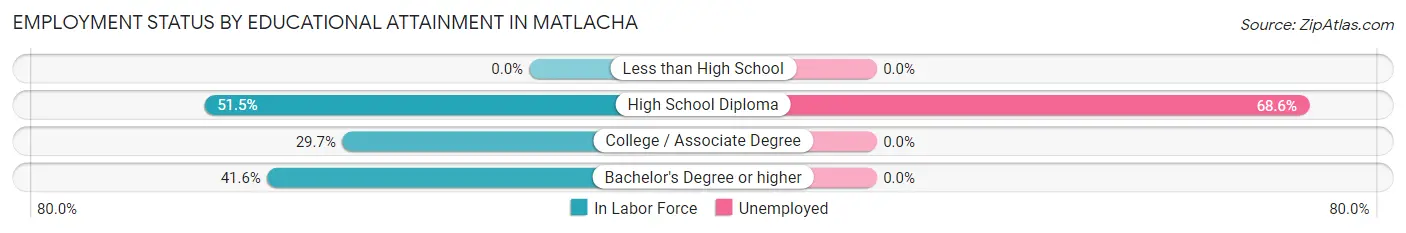
| Educational Attainment | In Labor Force | Unemployed |
| Less than High School | 0 (0.0%) | 0 (0.0%) |
| High School Diploma | 35 (51.5%) | 47 (68.6%) |
| College / Associate Degree | 41 (29.7%) | 0 (0.0%) |
| Bachelor's Degree or higher | 52 (41.6%) | 0 (0.0%) |
| Total | 128 (38.7%) | 62 (18.8%) |
Employment Occupations by Sex in Matlacha
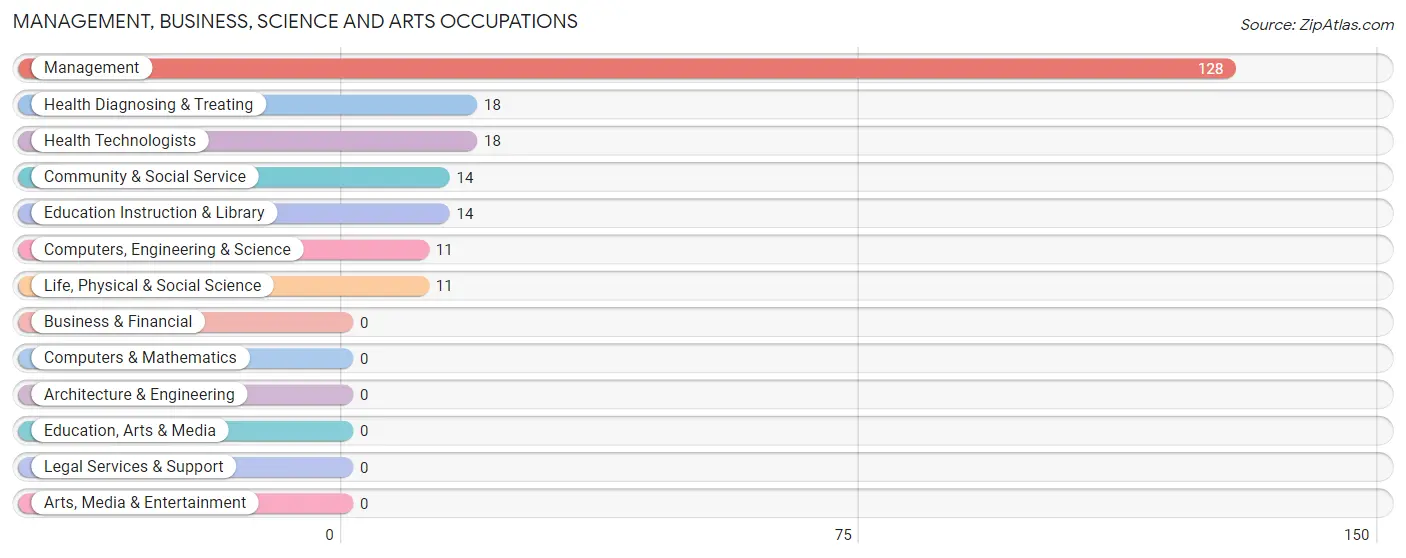
Management, Business, Science and Arts Occupations
The most common Management, Business, Science and Arts occupations in Matlacha are Management (128 | 50.4%), Health Diagnosing & Treating (18 | 7.1%), Health Technologists (18 | 7.1%), Community & Social Service (14 | 5.5%), and Education Instruction & Library (14 | 5.5%).
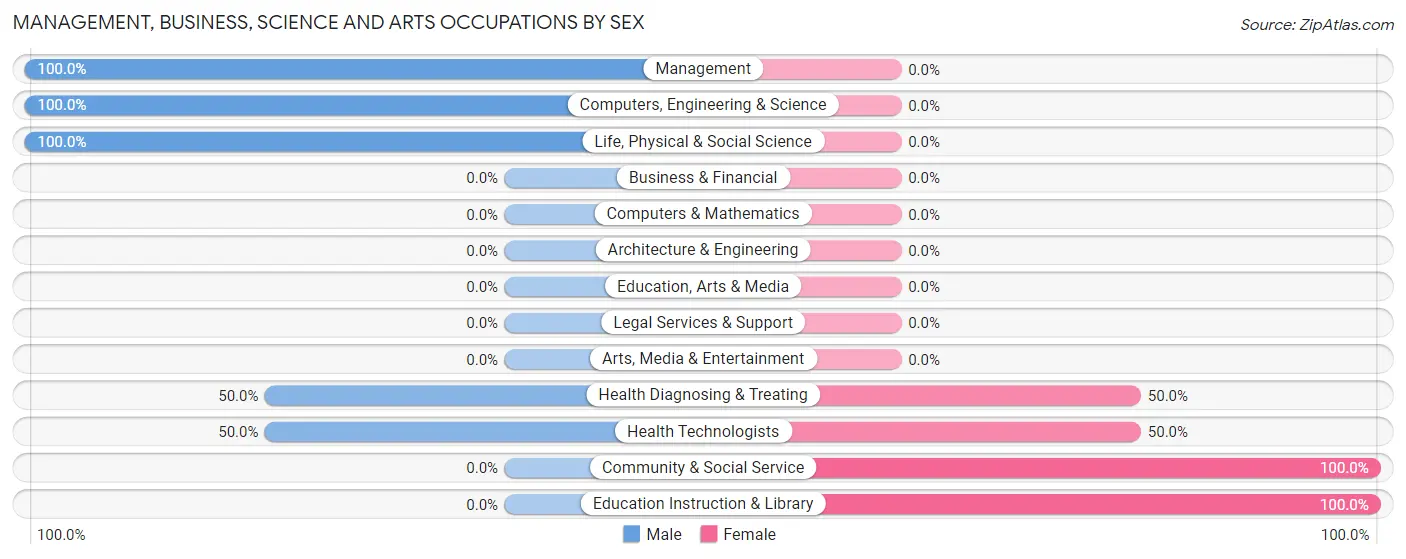
Management, Business, Science and Arts Occupations by Sex
Within the Management, Business, Science and Arts occupations in Matlacha, the most male-oriented occupations are Management (100.0%), Computers, Engineering & Science (100.0%), and Life, Physical & Social Science (100.0%), while the most female-oriented occupations are Community & Social Service (100.0%), Education Instruction & Library (100.0%), and Health Diagnosing & Treating (50.0%).
| Occupation | Male | Female |
| Management | 128 (100.0%) | 0 (0.0%) |
| Business & Financial | 0 (0.0%) | 0 (0.0%) |
| Computers, Engineering & Science | 11 (100.0%) | 0 (0.0%) |
| Computers & Mathematics | 0 (0.0%) | 0 (0.0%) |
| Architecture & Engineering | 0 (0.0%) | 0 (0.0%) |
| Life, Physical & Social Science | 11 (100.0%) | 0 (0.0%) |
| Community & Social Service | 0 (0.0%) | 14 (100.0%) |
| Education, Arts & Media | 0 (0.0%) | 0 (0.0%) |
| Legal Services & Support | 0 (0.0%) | 0 (0.0%) |
| Education Instruction & Library | 0 (0.0%) | 14 (100.0%) |
| Arts, Media & Entertainment | 0 (0.0%) | 0 (0.0%) |
| Health Diagnosing & Treating | 9 (50.0%) | 9 (50.0%) |
| Health Technologists | 9 (50.0%) | 9 (50.0%) |
| Total (Category) | 148 (86.6%) | 23 (13.5%) |
| Total (Overall) | 197 (77.6%) | 57 (22.4%) |
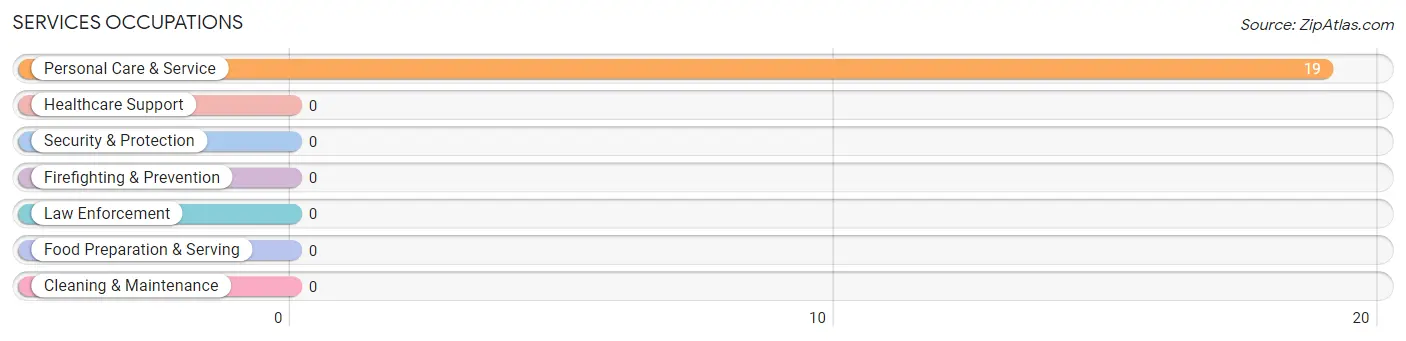
Services Occupations
The most common Services occupations in Matlacha are , and Personal Care & Service (19 | 7.5%).
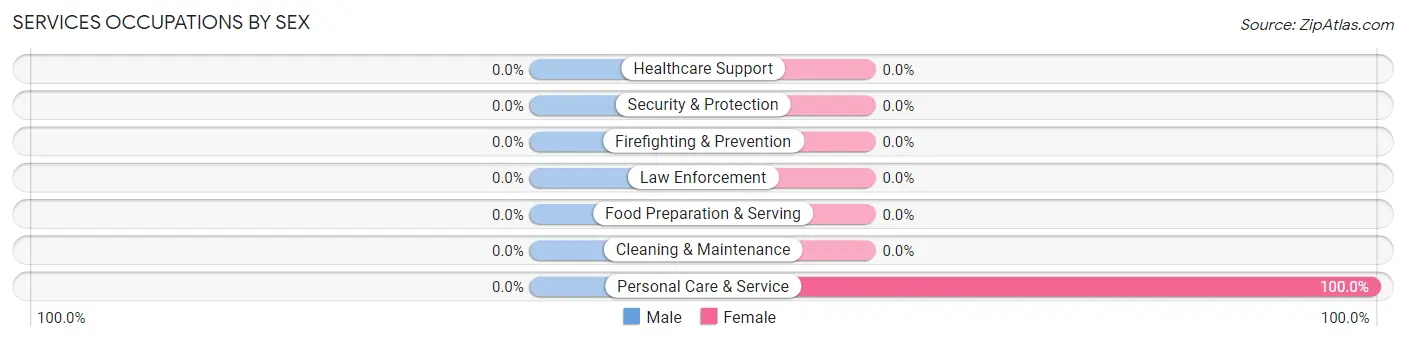
Services Occupations by Sex
| Occupation | Male | Female |
| Healthcare Support | 0 (0.0%) | 0 (0.0%) |
| Security & Protection | 0 (0.0%) | 0 (0.0%) |
| Firefighting & Prevention | 0 (0.0%) | 0 (0.0%) |
| Law Enforcement | 0 (0.0%) | 0 (0.0%) |
| Food Preparation & Serving | 0 (0.0%) | 0 (0.0%) |
| Cleaning & Maintenance | 0 (0.0%) | 0 (0.0%) |
| Personal Care & Service | 0 (0.0%) | 19 (100.0%) |
| Total (Category) | 0 (0.0%) | 19 (100.0%) |
| Total (Overall) | 197 (77.6%) | 57 (22.4%) |
Sales and Office Occupations
The most common Sales and Office occupations in Matlacha are Office & Administration (15 | 5.9%), and Sales & Related (5 | 2.0%).
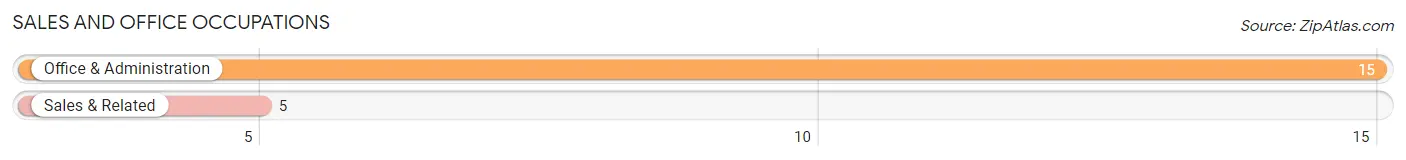
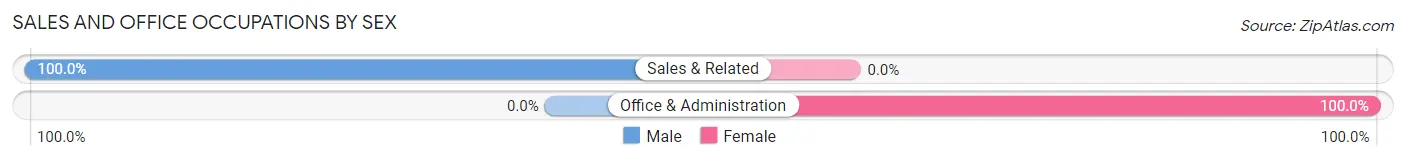
Sales and Office Occupations by Sex
| Occupation | Male | Female |
| Sales & Related | 5 (100.0%) | 0 (0.0%) |
| Office & Administration | 0 (0.0%) | 15 (100.0%) |
| Total (Category) | 5 (25.0%) | 15 (75.0%) |
| Total (Overall) | 197 (77.6%) | 57 (22.4%) |
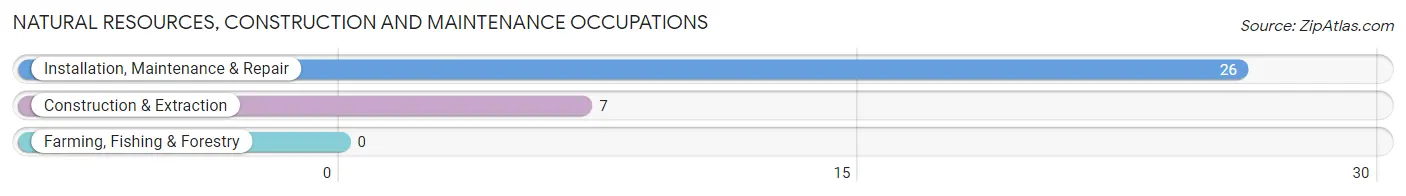
Natural Resources, Construction and Maintenance Occupations
The most common Natural Resources, Construction and Maintenance occupations in Matlacha are Installation, Maintenance & Repair (26 | 10.2%), and Construction & Extraction (7 | 2.8%).
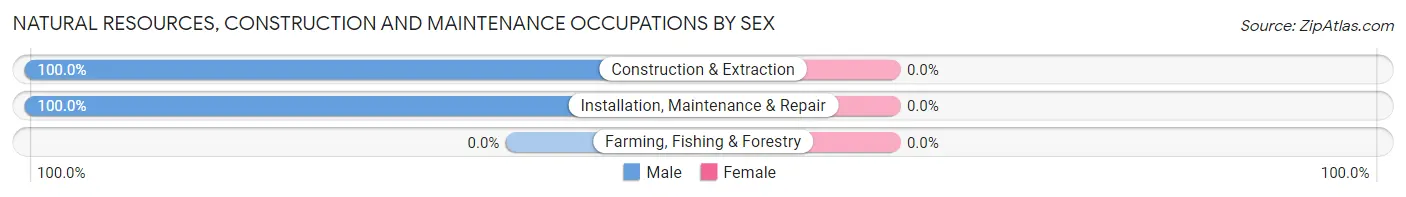
Natural Resources, Construction and Maintenance Occupations by Sex
| Occupation | Male | Female |
| Farming, Fishing & Forestry | 0 (0.0%) | 0 (0.0%) |
| Construction & Extraction | 7 (100.0%) | 0 (0.0%) |
| Installation, Maintenance & Repair | 26 (100.0%) | 0 (0.0%) |
| Total (Category) | 33 (100.0%) | 0 (0.0%) |
| Total (Overall) | 197 (77.6%) | 57 (22.4%) |
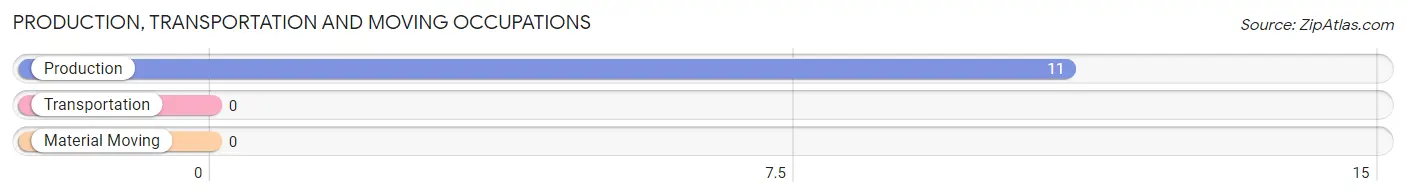
Production, Transportation and Moving Occupations
The most common Production, Transportation and Moving occupations in Matlacha are , and Production (11 | 4.3%).
Production, Transportation and Moving Occupations by Sex
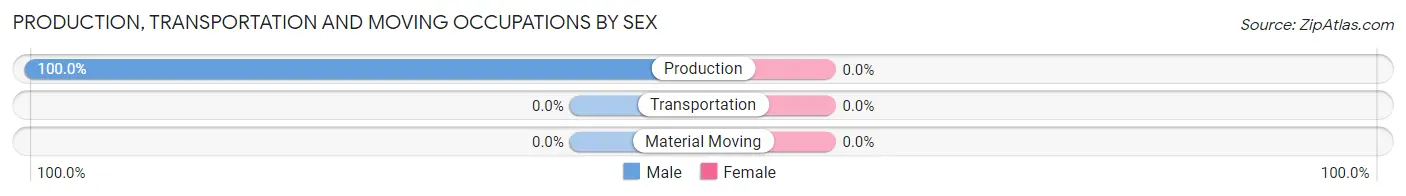
| Occupation | Male | Female |
| Production | 11 (100.0%) | 0 (0.0%) |
| Transportation | 0 (0.0%) | 0 (0.0%) |
| Material Moving | 0 (0.0%) | 0 (0.0%) |
| Total (Category) | 11 (100.0%) | 0 (0.0%) |
| Total (Overall) | 197 (77.6%) | 57 (22.4%) |
Employment Industries by Sex in Matlacha
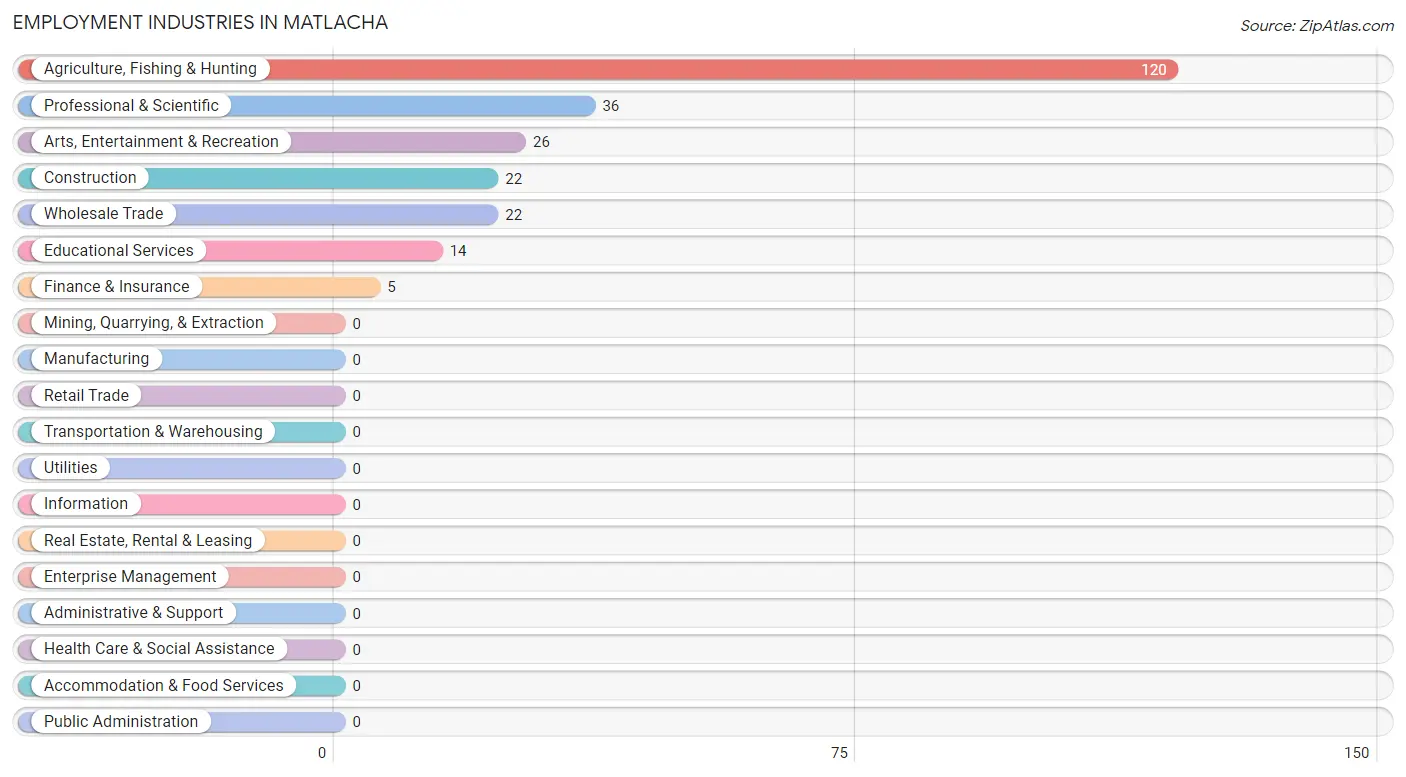
Employment Industries in Matlacha
The major employment industries in Matlacha include Agriculture, Fishing & Hunting (120 | 47.2%), Professional & Scientific (36 | 14.2%), Arts, Entertainment & Recreation (26 | 10.2%), Construction (22 | 8.7%), and Wholesale Trade (22 | 8.7%).
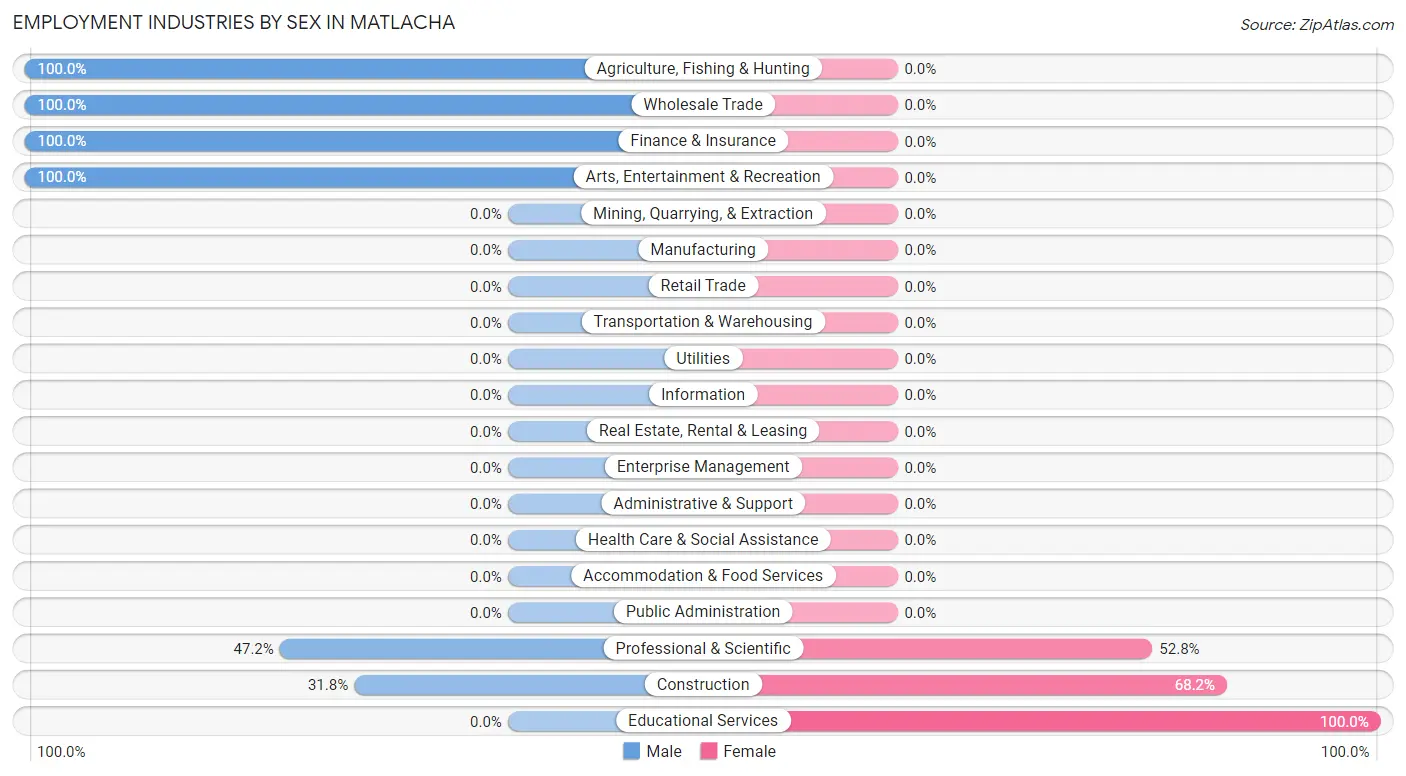
Employment Industries by Sex in Matlacha
The Matlacha industries that see more men than women are Agriculture, Fishing & Hunting (100.0%), Wholesale Trade (100.0%), and Finance & Insurance (100.0%), whereas the industries that tend to have a higher number of women are Educational Services (100.0%), Construction (68.2%), and Professional & Scientific (52.8%).
| Industry | Male | Female |
| Agriculture, Fishing & Hunting | 120 (100.0%) | 0 (0.0%) |
| Mining, Quarrying, & Extraction | 0 (0.0%) | 0 (0.0%) |
| Construction | 7 (31.8%) | 15 (68.2%) |
| Manufacturing | 0 (0.0%) | 0 (0.0%) |
| Wholesale Trade | 22 (100.0%) | 0 (0.0%) |
| Retail Trade | 0 (0.0%) | 0 (0.0%) |
| Transportation & Warehousing | 0 (0.0%) | 0 (0.0%) |
| Utilities | 0 (0.0%) | 0 (0.0%) |
| Information | 0 (0.0%) | 0 (0.0%) |
| Finance & Insurance | 5 (100.0%) | 0 (0.0%) |
| Real Estate, Rental & Leasing | 0 (0.0%) | 0 (0.0%) |
| Professional & Scientific | 17 (47.2%) | 19 (52.8%) |
| Enterprise Management | 0 (0.0%) | 0 (0.0%) |
| Administrative & Support | 0 (0.0%) | 0 (0.0%) |
| Educational Services | 0 (0.0%) | 14 (100.0%) |
| Health Care & Social Assistance | 0 (0.0%) | 0 (0.0%) |
| Arts, Entertainment & Recreation | 26 (100.0%) | 0 (0.0%) |
| Accommodation & Food Services | 0 (0.0%) | 0 (0.0%) |
| Public Administration | 0 (0.0%) | 0 (0.0%) |
| Total | 197 (77.6%) | 57 (22.4%) |
Education in Matlacha
School Enrollment in Matlacha
The most common levels of schooling among the 116 students in Matlacha are high school (97 | 83.6%), graduate / professional (11 | 9.5%), and college / undergraduate (8 | 6.9%).
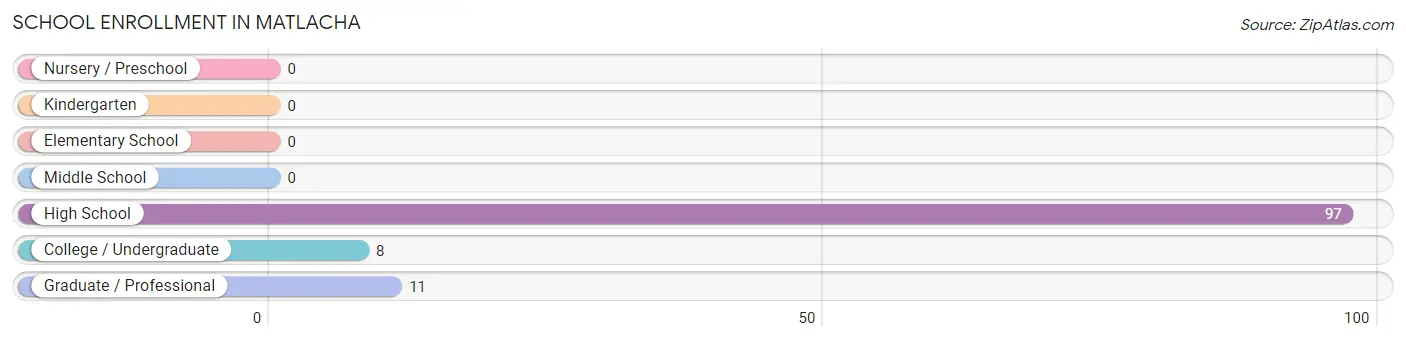
| School Level | # Students | % Students |
| Nursery / Preschool | 0 | 0.0% |
| Kindergarten | 0 | 0.0% |
| Elementary School | 0 | 0.0% |
| Middle School | 0 | 0.0% |
| High School | 97 | 83.6% |
| College / Undergraduate | 8 | 6.9% |
| Graduate / Professional | 11 | 9.5% |
| Total | 116 | 100.0% |
School Enrollment by Age by Funding Source in Matlacha
Out of a total of 116 students who are enrolled in schools in Matlacha, 86 (74.1%) attend a private institution, while the remaining 30 (25.9%) are enrolled in public schools. The age group of 18 to 19 year olds has the highest likelihood of being enrolled in private schools, with 5 (100.0% in the age bracket) enrolled. Conversely, the age group of 35 years and over has the lowest likelihood of being enrolled in a private school, with 11 (57.9% in the age bracket) attending a public institution.
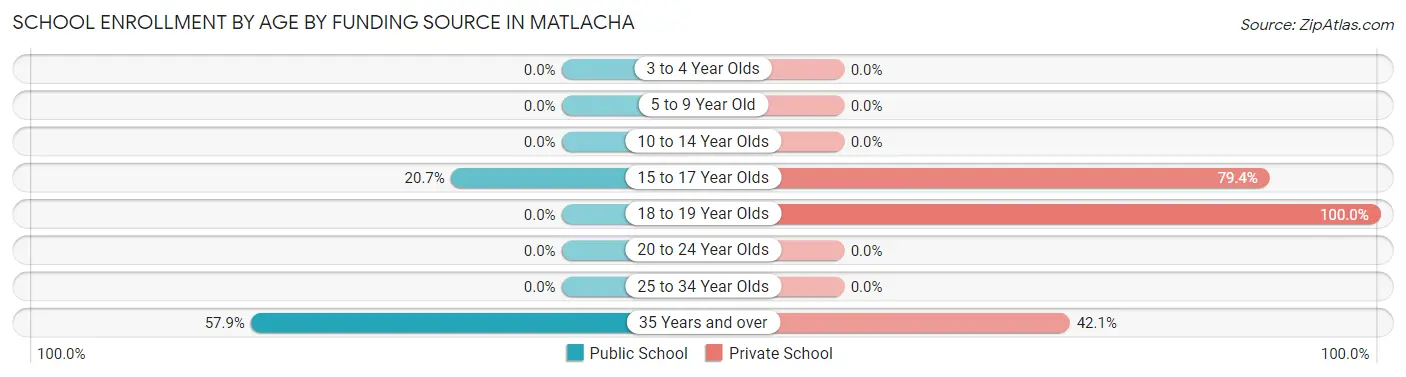
| Age Bracket | Public School | Private School |
| 3 to 4 Year Olds | 0 (0.0%) | 0 (0.0%) |
| 5 to 9 Year Old | 0 (0.0%) | 0 (0.0%) |
| 10 to 14 Year Olds | 0 (0.0%) | 0 (0.0%) |
| 15 to 17 Year Olds | 19 (20.6%) | 73 (79.3%) |
| 18 to 19 Year Olds | 0 (0.0%) | 5 (100.0%) |
| 20 to 24 Year Olds | 0 (0.0%) | 0 (0.0%) |
| 25 to 34 Year Olds | 0 (0.0%) | 0 (0.0%) |
| 35 Years and over | 11 (57.9%) | 8 (42.1%) |
| Total | 30 (25.9%) | 86 (74.1%) |
Educational Attainment by Field of Study in Matlacha
Business (37 | 17.4%), bio, nature & agricultural (31 | 14.6%), science & technology (27 | 12.7%), computers & mathematics (19 | 9.0%), and engineering (19 | 9.0%) are the most common fields of study among 212 individuals in Matlacha who have obtained a bachelor's degree or higher.
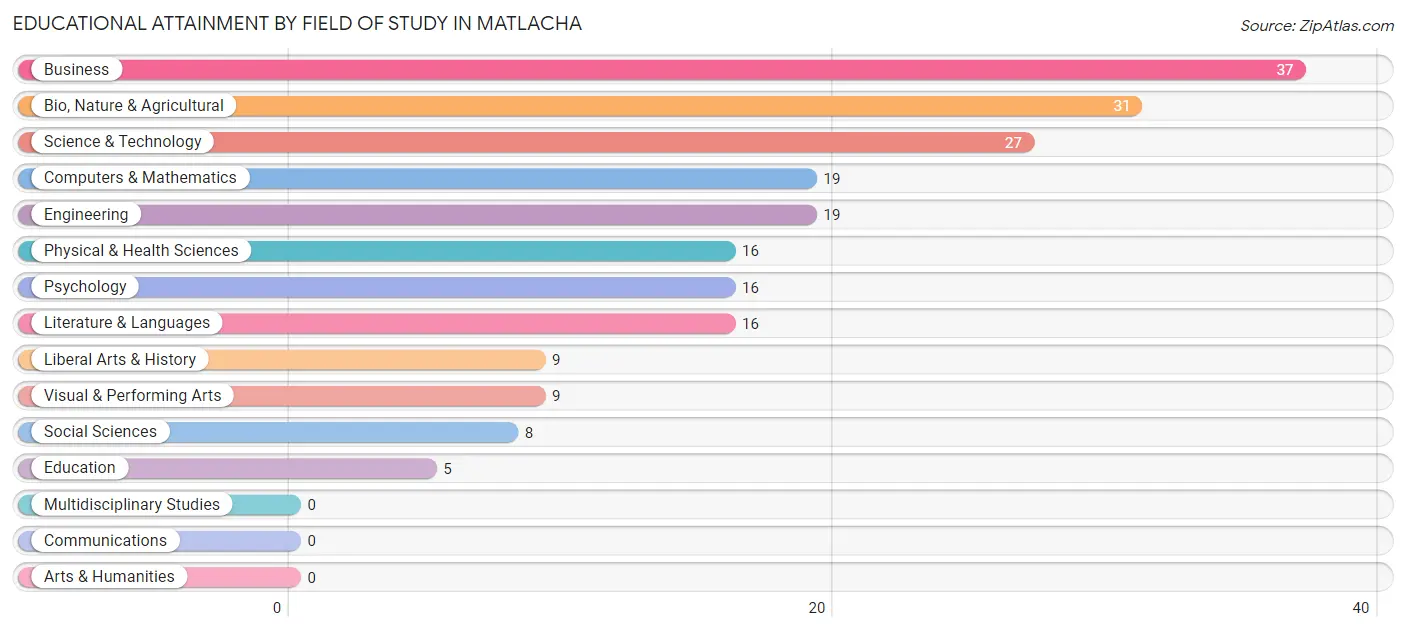
| Field of Study | # Graduates | % Graduates |
| Computers & Mathematics | 19 | 9.0% |
| Bio, Nature & Agricultural | 31 | 14.6% |
| Physical & Health Sciences | 16 | 7.5% |
| Psychology | 16 | 7.5% |
| Social Sciences | 8 | 3.8% |
| Engineering | 19 | 9.0% |
| Multidisciplinary Studies | 0 | 0.0% |
| Science & Technology | 27 | 12.7% |
| Business | 37 | 17.4% |
| Education | 5 | 2.4% |
| Literature & Languages | 16 | 7.5% |
| Liberal Arts & History | 9 | 4.3% |
| Visual & Performing Arts | 9 | 4.3% |
| Communications | 0 | 0.0% |
| Arts & Humanities | 0 | 0.0% |
| Total | 212 | 100.0% |
Transportation & Commute in Matlacha
Vehicle Availability by Sex in Matlacha
The most prevalent vehicle ownership categories in Matlacha are males with 2 vehicles (148, accounting for 75.1%) and females with 2 vehicles (34, making up 259.6%).
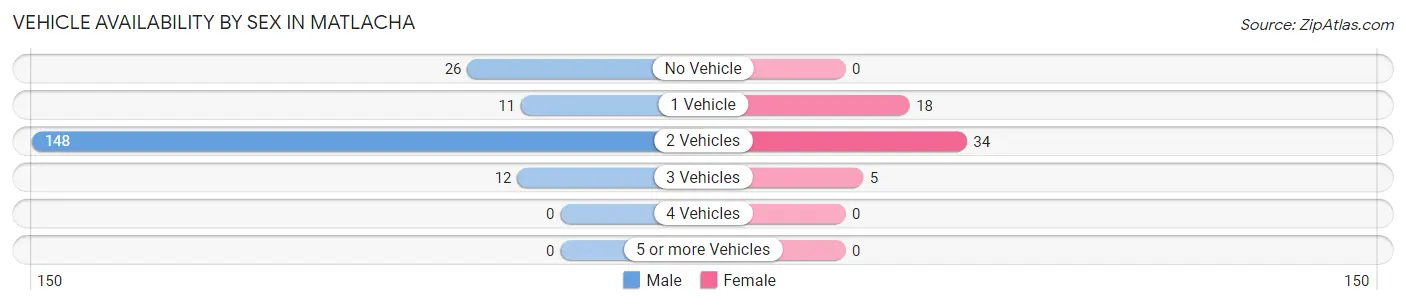
| Vehicles Available | Male | Female |
| No Vehicle | 26 (13.2%) | 0 (0.0%) |
| 1 Vehicle | 11 (5.6%) | 18 (31.6%) |
| 2 Vehicles | 148 (75.1%) | 34 (59.7%) |
| 3 Vehicles | 12 (6.1%) | 5 (8.8%) |
| 4 Vehicles | 0 (0.0%) | 0 (0.0%) |
| 5 or more Vehicles | 0 (0.0%) | 0 (0.0%) |
| Total | 197 (100.0%) | 57 (100.0%) |
Commute Time in Matlacha
The most frequently occuring commute durations in Matlacha are less than 5 minutes (120 commuters, 51.7%), 5 to 9 minutes (30 commuters, 12.9%), and 60 to 89 minutes (26 commuters, 11.2%).
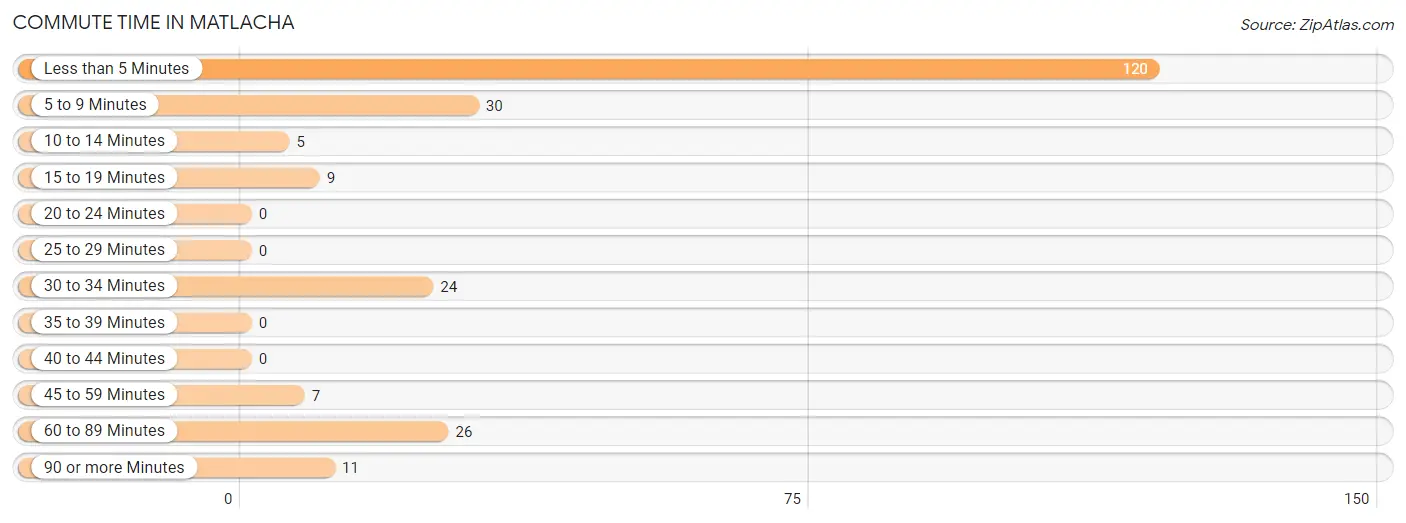
| Commute Time | # Commuters | % Commuters |
| Less than 5 Minutes | 120 | 51.7% |
| 5 to 9 Minutes | 30 | 12.9% |
| 10 to 14 Minutes | 5 | 2.2% |
| 15 to 19 Minutes | 9 | 3.9% |
| 20 to 24 Minutes | 0 | 0.0% |
| 25 to 29 Minutes | 0 | 0.0% |
| 30 to 34 Minutes | 24 | 10.3% |
| 35 to 39 Minutes | 0 | 0.0% |
| 40 to 44 Minutes | 0 | 0.0% |
| 45 to 59 Minutes | 7 | 3.0% |
| 60 to 89 Minutes | 26 | 11.2% |
| 90 or more Minutes | 11 | 4.7% |
Commute Time by Sex in Matlacha
The most common commute times in Matlacha are less than 5 minutes (120 commuters, 68.6%) for males and 30 to 34 minutes (24 commuters, 42.1%) for females.
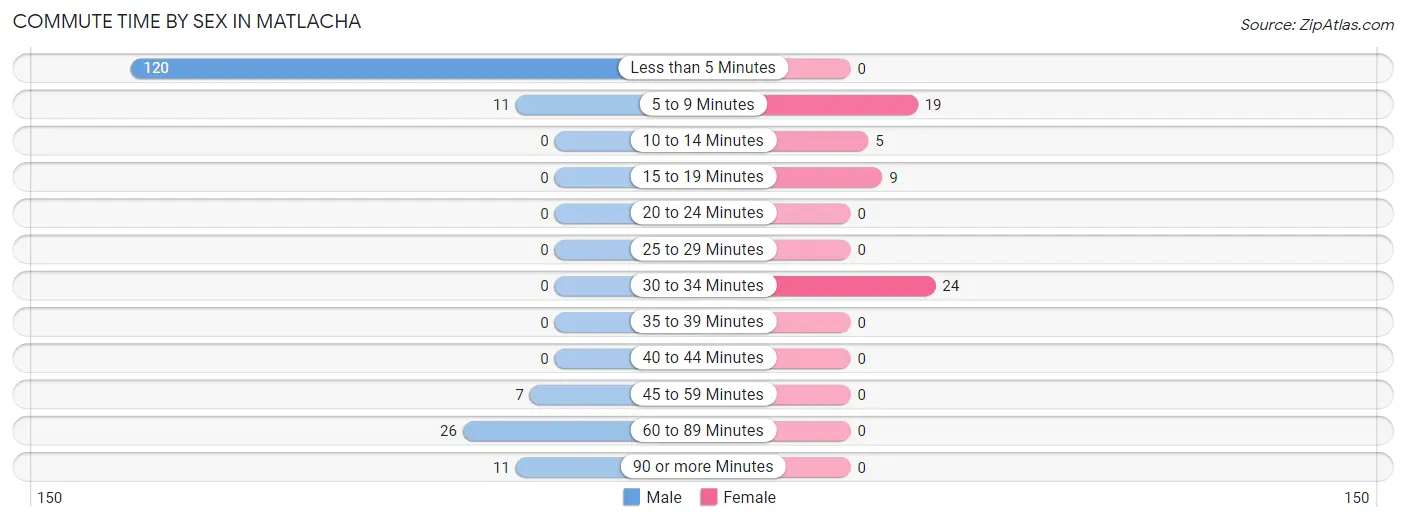
| Commute Time | Male | Female |
| Less than 5 Minutes | 120 (68.6%) | 0 (0.0%) |
| 5 to 9 Minutes | 11 (6.3%) | 19 (33.3%) |
| 10 to 14 Minutes | 0 (0.0%) | 5 (8.8%) |
| 15 to 19 Minutes | 0 (0.0%) | 9 (15.8%) |
| 20 to 24 Minutes | 0 (0.0%) | 0 (0.0%) |
| 25 to 29 Minutes | 0 (0.0%) | 0 (0.0%) |
| 30 to 34 Minutes | 0 (0.0%) | 24 (42.1%) |
| 35 to 39 Minutes | 0 (0.0%) | 0 (0.0%) |
| 40 to 44 Minutes | 0 (0.0%) | 0 (0.0%) |
| 45 to 59 Minutes | 7 (4.0%) | 0 (0.0%) |
| 60 to 89 Minutes | 26 (14.9%) | 0 (0.0%) |
| 90 or more Minutes | 11 (6.3%) | 0 (0.0%) |
Time of Departure to Work by Sex in Matlacha
The most frequent times of departure to work in Matlacha are 9:00 AM to 9:59 AM (120, 68.6%) for males and 12:00 PM to 3:59 PM (19, 33.3%) for females.
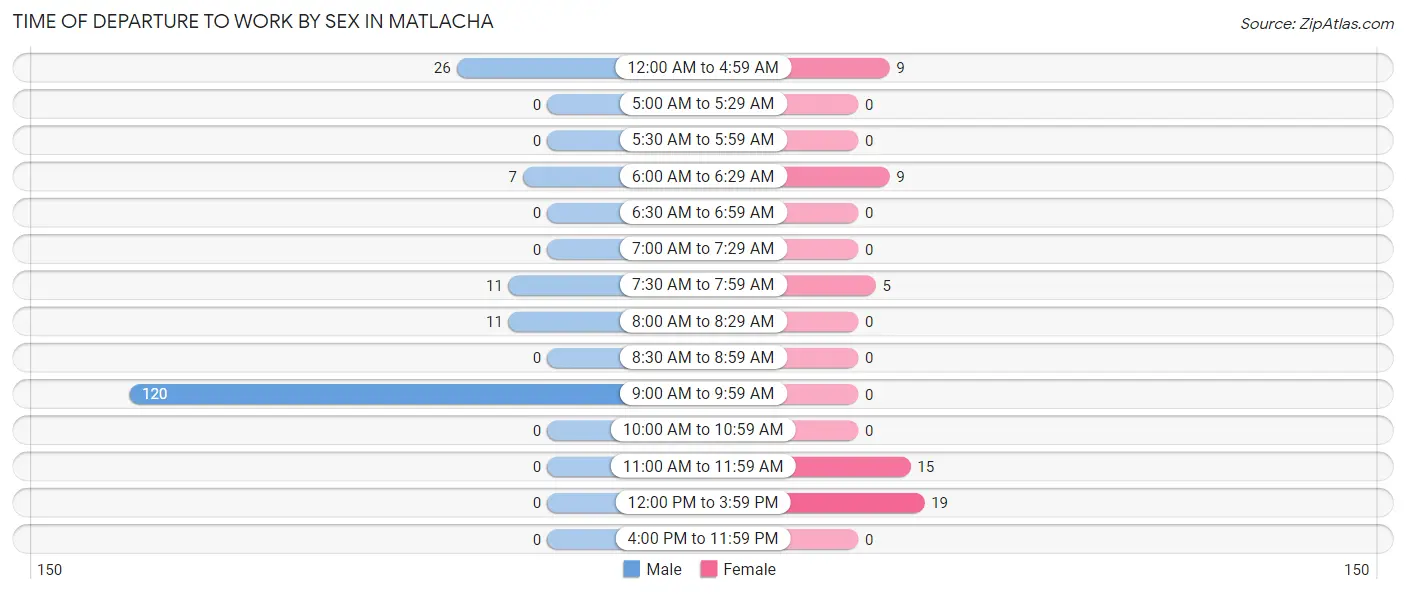
| Time of Departure | Male | Female |
| 12:00 AM to 4:59 AM | 26 (14.9%) | 9 (15.8%) |
| 5:00 AM to 5:29 AM | 0 (0.0%) | 0 (0.0%) |
| 5:30 AM to 5:59 AM | 0 (0.0%) | 0 (0.0%) |
| 6:00 AM to 6:29 AM | 7 (4.0%) | 9 (15.8%) |
| 6:30 AM to 6:59 AM | 0 (0.0%) | 0 (0.0%) |
| 7:00 AM to 7:29 AM | 0 (0.0%) | 0 (0.0%) |
| 7:30 AM to 7:59 AM | 11 (6.3%) | 5 (8.8%) |
| 8:00 AM to 8:29 AM | 11 (6.3%) | 0 (0.0%) |
| 8:30 AM to 8:59 AM | 0 (0.0%) | 0 (0.0%) |
| 9:00 AM to 9:59 AM | 120 (68.6%) | 0 (0.0%) |
| 10:00 AM to 10:59 AM | 0 (0.0%) | 0 (0.0%) |
| 11:00 AM to 11:59 AM | 0 (0.0%) | 15 (26.3%) |
| 12:00 PM to 3:59 PM | 0 (0.0%) | 19 (33.3%) |
| 4:00 PM to 11:59 PM | 0 (0.0%) | 0 (0.0%) |
| Total | 175 (100.0%) | 57 (100.0%) |
Housing Occupancy in Matlacha
Occupancy by Ownership in Matlacha
Of the total 437 dwellings in Matlacha, owner-occupied units account for 374 (85.6%), while renter-occupied units make up 63 (14.4%).
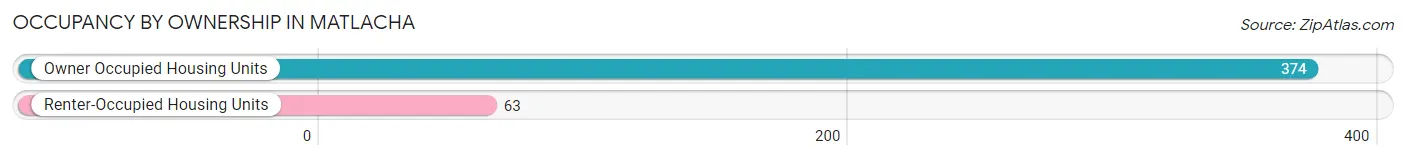
| Occupancy | # Housing Units | % Housing Units |
| Owner Occupied Housing Units | 374 | 85.6% |
| Renter-Occupied Housing Units | 63 | 14.4% |
| Total Occupied Housing Units | 437 | 100.0% |
Occupancy by Household Size in Matlacha
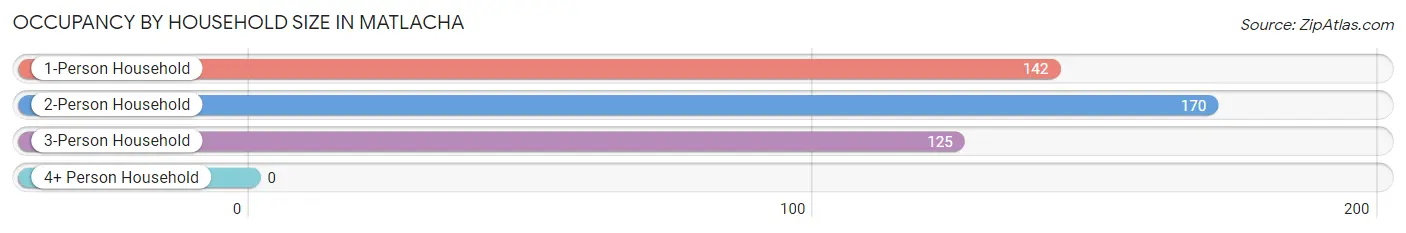
| Household Size | # Housing Units | % Housing Units |
| 1-Person Household | 142 | 32.5% |
| 2-Person Household | 170 | 38.9% |
| 3-Person Household | 125 | 28.6% |
| 4+ Person Household | 0 | 0.0% |
| Total Housing Units | 437 | 100.0% |
Occupancy by Ownership by Household Size in Matlacha
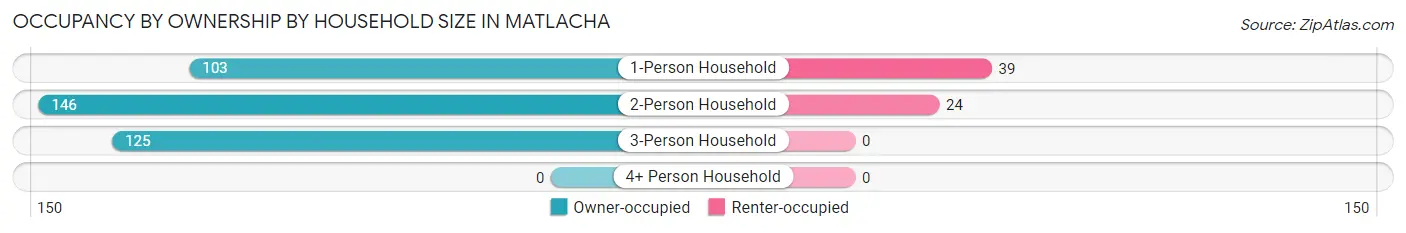
| Household Size | Owner-occupied | Renter-occupied |
| 1-Person Household | 103 (72.5%) | 39 (27.5%) |
| 2-Person Household | 146 (85.9%) | 24 (14.1%) |
| 3-Person Household | 125 (100.0%) | 0 (0.0%) |
| 4+ Person Household | 0 (0.0%) | 0 (0.0%) |
| Total Housing Units | 374 (85.6%) | 63 (14.4%) |
Occupancy by Educational Attainment in Matlacha
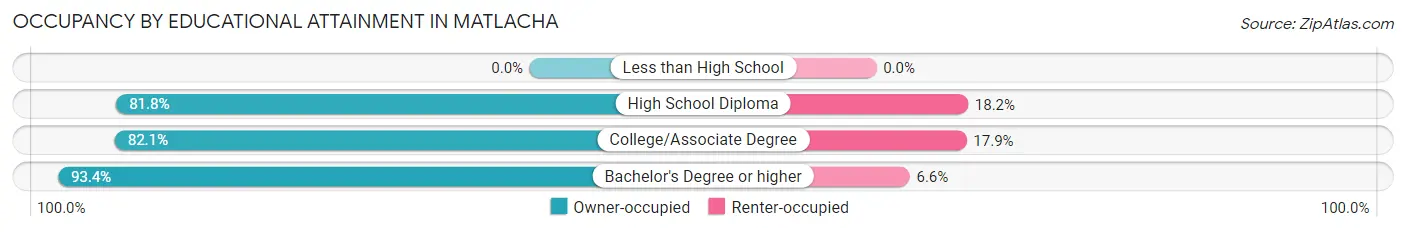
| Household Size | Owner-occupied | Renter-occupied |
| Less than High School | 0 (0.0%) | 0 (0.0%) |
| High School Diploma | 45 (81.8%) | 10 (18.2%) |
| College/Associate Degree | 202 (82.1%) | 44 (17.9%) |
| Bachelor's Degree or higher | 127 (93.4%) | 9 (6.6%) |
Occupancy by Age of Householder in Matlacha
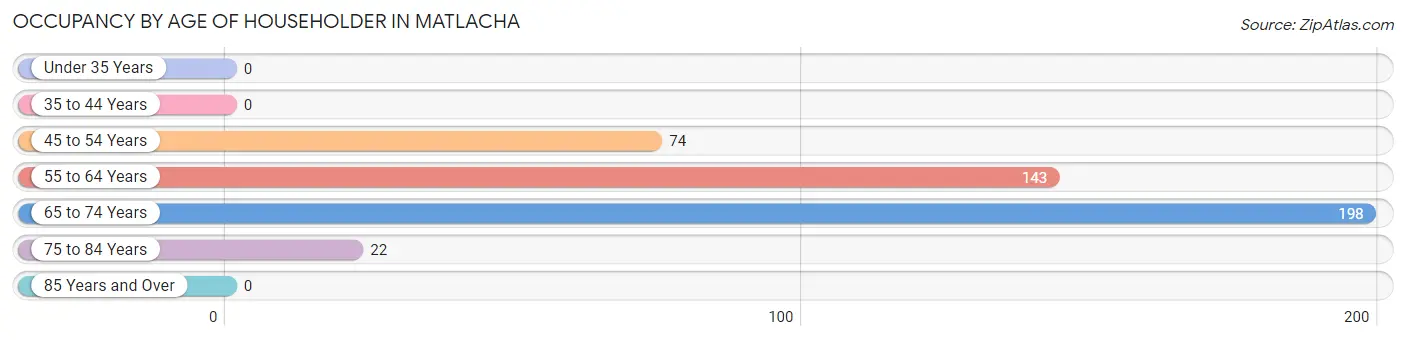
| Age Bracket | # Households | % Households |
| Under 35 Years | 0 | 0.0% |
| 35 to 44 Years | 0 | 0.0% |
| 45 to 54 Years | 74 | 16.9% |
| 55 to 64 Years | 143 | 32.7% |
| 65 to 74 Years | 198 | 45.3% |
| 75 to 84 Years | 22 | 5.0% |
| 85 Years and Over | 0 | 0.0% |
| Total | 437 | 100.0% |
Housing Finances in Matlacha
Median Income by Occupancy in Matlacha
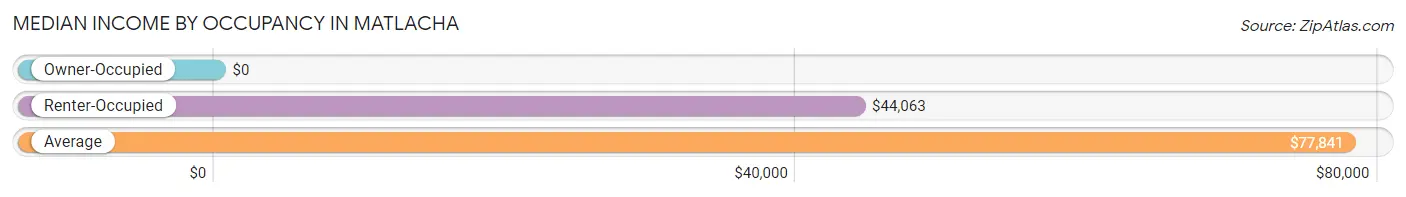
| Occupancy Type | # Households | Median Income |
| Owner-Occupied | 374 (85.6%) | $0 |
| Renter-Occupied | 63 (14.4%) | $44,063 |
| Average | 437 (100.0%) | $77,841 |
Occupancy by Householder Income Bracket in Matlacha
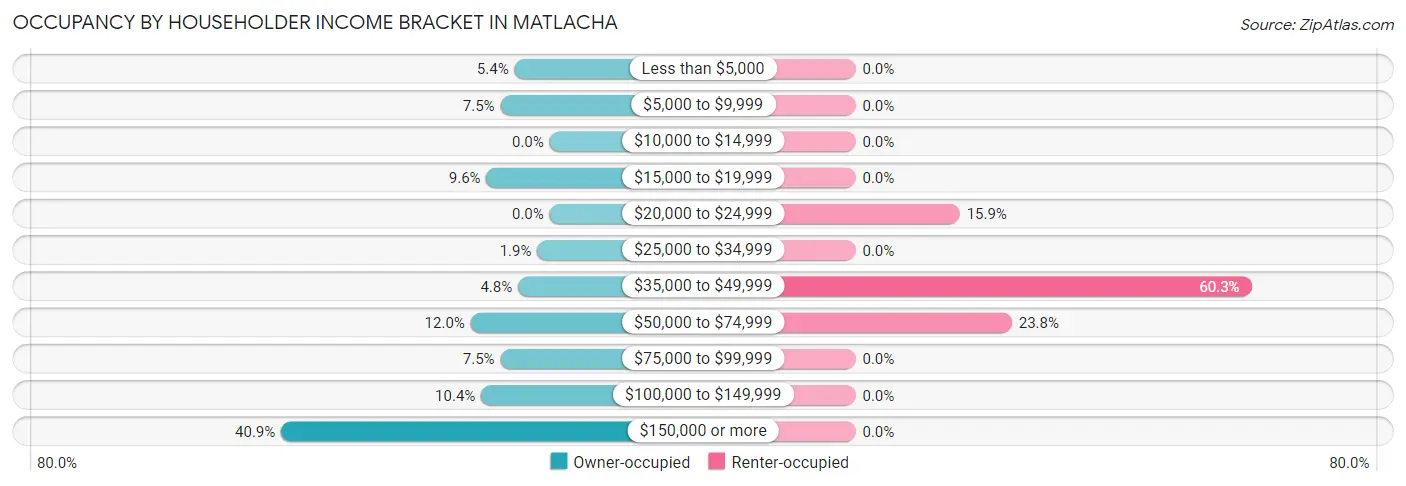
| Income Bracket | Owner-occupied | Renter-occupied |
| Less than $5,000 | 20 (5.3%) | 0 (0.0%) |
| $5,000 to $9,999 | 28 (7.5%) | 0 (0.0%) |
| $10,000 to $14,999 | 0 (0.0%) | 0 (0.0%) |
| $15,000 to $19,999 | 36 (9.6%) | 0 (0.0%) |
| $20,000 to $24,999 | 0 (0.0%) | 10 (15.9%) |
| $25,000 to $34,999 | 7 (1.9%) | 0 (0.0%) |
| $35,000 to $49,999 | 18 (4.8%) | 38 (60.3%) |
| $50,000 to $74,999 | 45 (12.0%) | 15 (23.8%) |
| $75,000 to $99,999 | 28 (7.5%) | 0 (0.0%) |
| $100,000 to $149,999 | 39 (10.4%) | 0 (0.0%) |
| $150,000 or more | 153 (40.9%) | 0 (0.0%) |
| Total | 374 (100.0%) | 63 (100.0%) |
Monthly Housing Cost Tiers in Matlacha
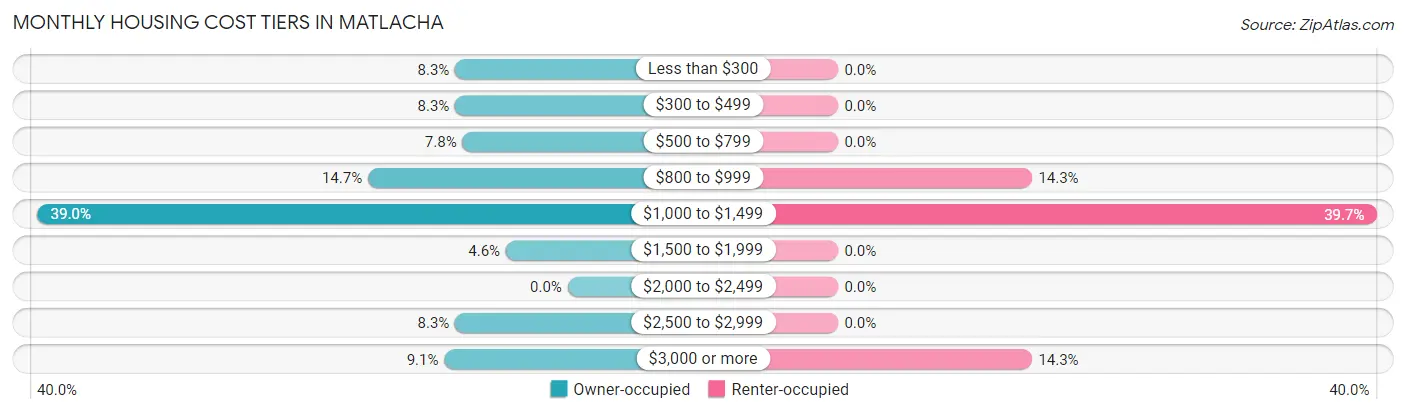
| Monthly Cost | Owner-occupied | Renter-occupied |
| Less than $300 | 31 (8.3%) | 0 (0.0%) |
| $300 to $499 | 31 (8.3%) | 0 (0.0%) |
| $500 to $799 | 29 (7.7%) | 0 (0.0%) |
| $800 to $999 | 55 (14.7%) | 9 (14.3%) |
| $1,000 to $1,499 | 146 (39.0%) | 25 (39.7%) |
| $1,500 to $1,999 | 17 (4.5%) | 0 (0.0%) |
| $2,000 to $2,499 | 0 (0.0%) | 0 (0.0%) |
| $2,500 to $2,999 | 31 (8.3%) | 0 (0.0%) |
| $3,000 or more | 34 (9.1%) | 9 (14.3%) |
| Total | 374 (100.0%) | 63 (100.0%) |
Physical Housing Characteristics in Matlacha
Housing Structures in Matlacha
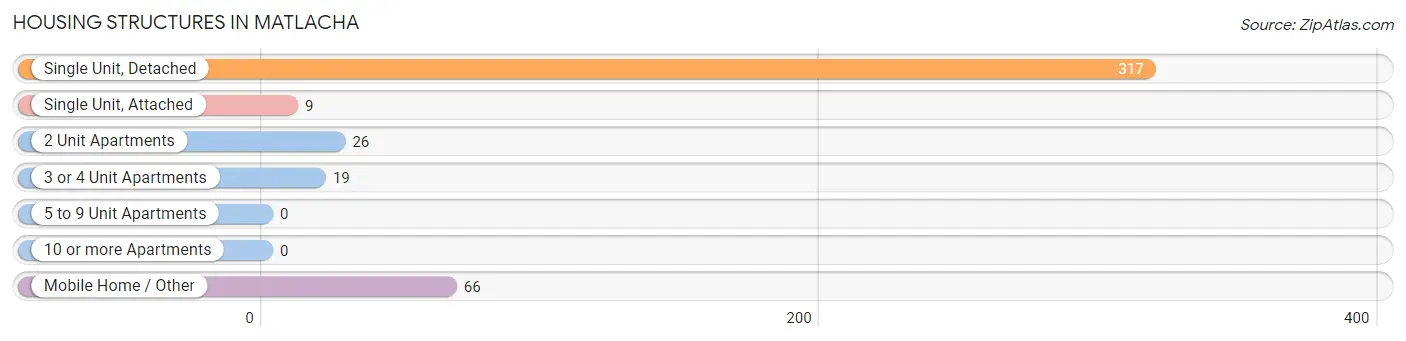
| Structure Type | # Housing Units | % Housing Units |
| Single Unit, Detached | 317 | 72.5% |
| Single Unit, Attached | 9 | 2.1% |
| 2 Unit Apartments | 26 | 5.9% |
| 3 or 4 Unit Apartments | 19 | 4.3% |
| 5 to 9 Unit Apartments | 0 | 0.0% |
| 10 or more Apartments | 0 | 0.0% |
| Mobile Home / Other | 66 | 15.1% |
| Total | 437 | 100.0% |
Housing Structures by Occupancy in Matlacha
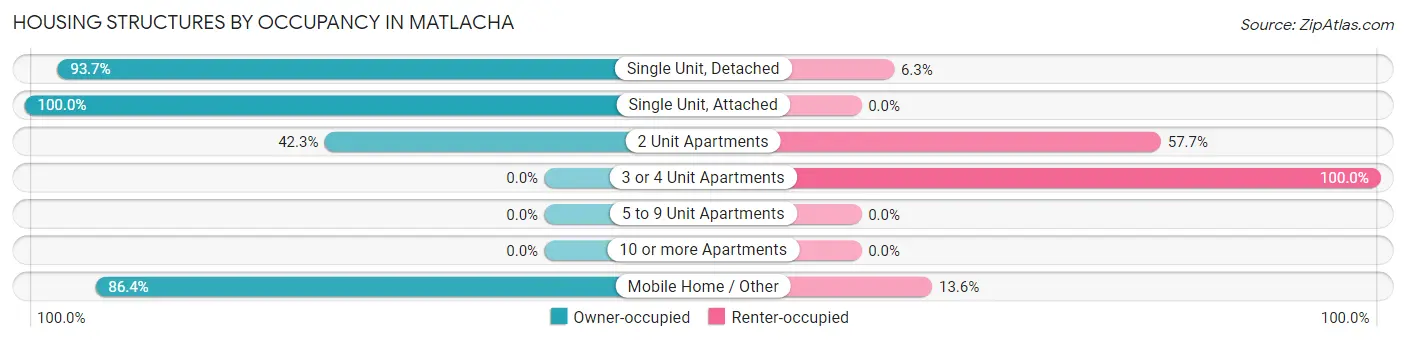
| Structure Type | Owner-occupied | Renter-occupied |
| Single Unit, Detached | 297 (93.7%) | 20 (6.3%) |
| Single Unit, Attached | 9 (100.0%) | 0 (0.0%) |
| 2 Unit Apartments | 11 (42.3%) | 15 (57.7%) |
| 3 or 4 Unit Apartments | 0 (0.0%) | 19 (100.0%) |
| 5 to 9 Unit Apartments | 0 (0.0%) | 0 (0.0%) |
| 10 or more Apartments | 0 (0.0%) | 0 (0.0%) |
| Mobile Home / Other | 57 (86.4%) | 9 (13.6%) |
| Total | 374 (85.6%) | 63 (14.4%) |
Housing Structures by Number of Rooms in Matlacha
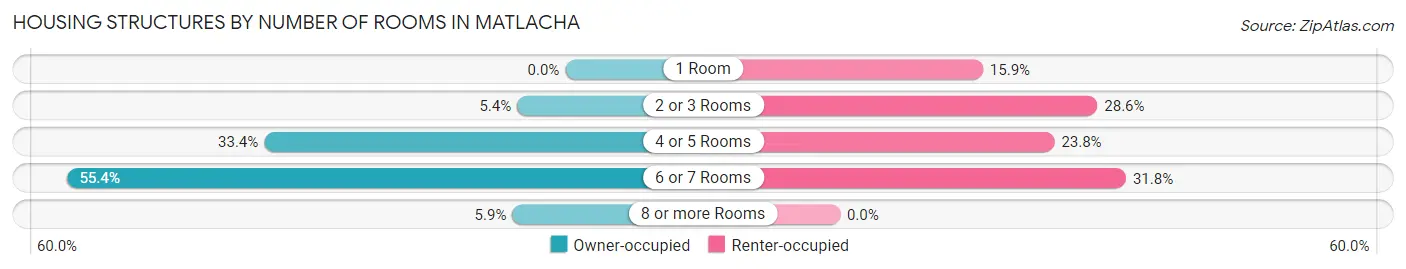
| Number of Rooms | Owner-occupied | Renter-occupied |
| 1 Room | 0 (0.0%) | 10 (15.9%) |
| 2 or 3 Rooms | 20 (5.3%) | 18 (28.6%) |
| 4 or 5 Rooms | 125 (33.4%) | 15 (23.8%) |
| 6 or 7 Rooms | 207 (55.3%) | 20 (31.8%) |
| 8 or more Rooms | 22 (5.9%) | 0 (0.0%) |
| Total | 374 (100.0%) | 63 (100.0%) |
Housing Structure by Heating Type in Matlacha
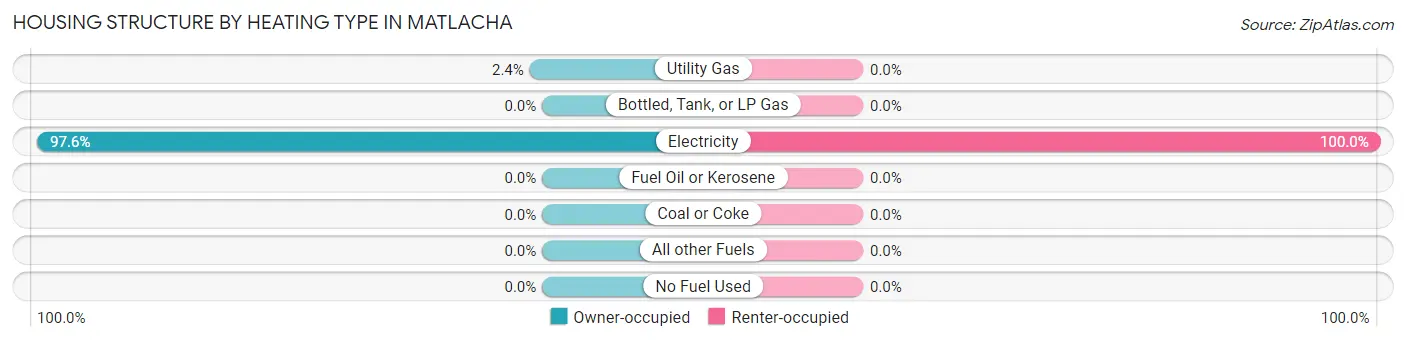
| Heating Type | Owner-occupied | Renter-occupied |
| Utility Gas | 9 (2.4%) | 0 (0.0%) |
| Bottled, Tank, or LP Gas | 0 (0.0%) | 0 (0.0%) |
| Electricity | 365 (97.6%) | 63 (100.0%) |
| Fuel Oil or Kerosene | 0 (0.0%) | 0 (0.0%) |
| Coal or Coke | 0 (0.0%) | 0 (0.0%) |
| All other Fuels | 0 (0.0%) | 0 (0.0%) |
| No Fuel Used | 0 (0.0%) | 0 (0.0%) |
| Total | 374 (100.0%) | 63 (100.0%) |
Household Vehicle Usage in Matlacha
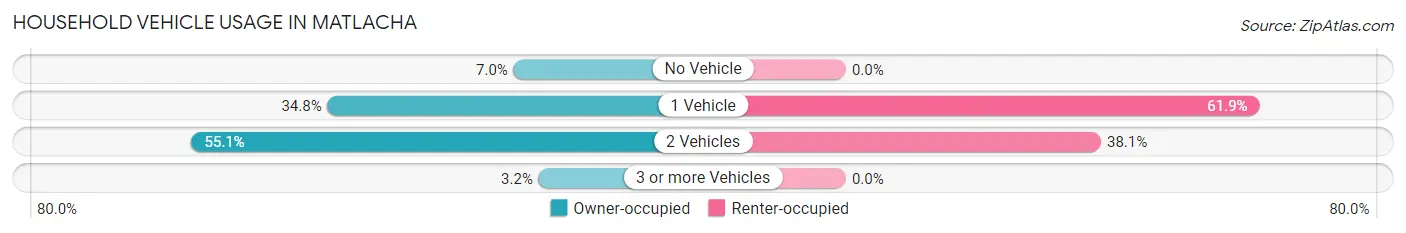
| Vehicles per Household | Owner-occupied | Renter-occupied |
| No Vehicle | 26 (7.0%) | 0 (0.0%) |
| 1 Vehicle | 130 (34.8%) | 39 (61.9%) |
| 2 Vehicles | 206 (55.1%) | 24 (38.1%) |
| 3 or more Vehicles | 12 (3.2%) | 0 (0.0%) |
| Total | 374 (100.0%) | 63 (100.0%) |
Real Estate & Mortgages in Matlacha
Real Estate and Mortgage Overview in Matlacha
| Characteristic | Without Mortgage | With Mortgage |
| Housing Units | 301 | 73 |
| Median Property Value | $349,300 | $570,700 |
| Median Household Income | - | - |
| Monthly Housing Costs | $1,017 | $34 |
| Real Estate Taxes | $5,692 | $0 |
Property Value by Mortgage Status in Matlacha
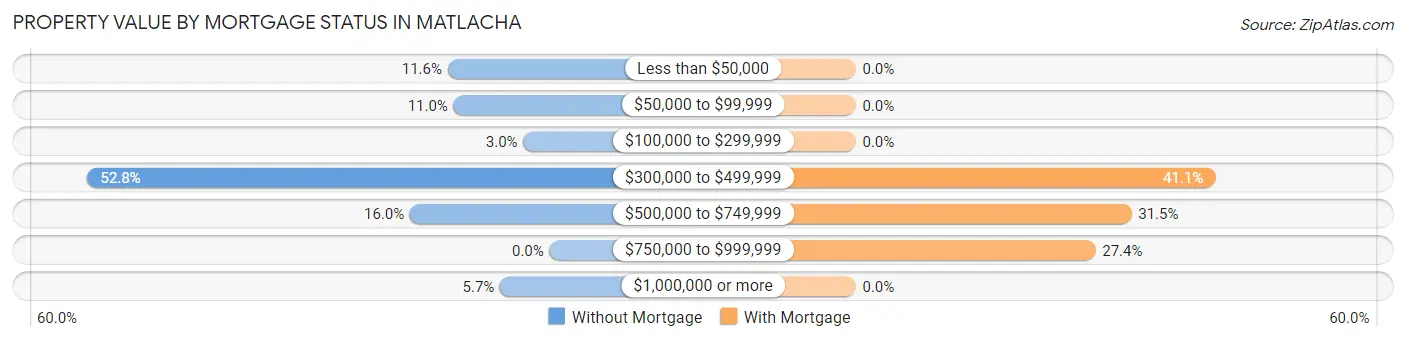
| Property Value | Without Mortgage | With Mortgage |
| Less than $50,000 | 35 (11.6%) | 0 (0.0%) |
| $50,000 to $99,999 | 33 (11.0%) | 0 (0.0%) |
| $100,000 to $299,999 | 9 (3.0%) | 0 (0.0%) |
| $300,000 to $499,999 | 159 (52.8%) | 30 (41.1%) |
| $500,000 to $749,999 | 48 (16.0%) | 23 (31.5%) |
| $750,000 to $999,999 | 0 (0.0%) | 20 (27.4%) |
| $1,000,000 or more | 17 (5.7%) | 0 (0.0%) |
| Total | 301 (100.0%) | 73 (100.0%) |
Household Income by Mortgage Status in Matlacha
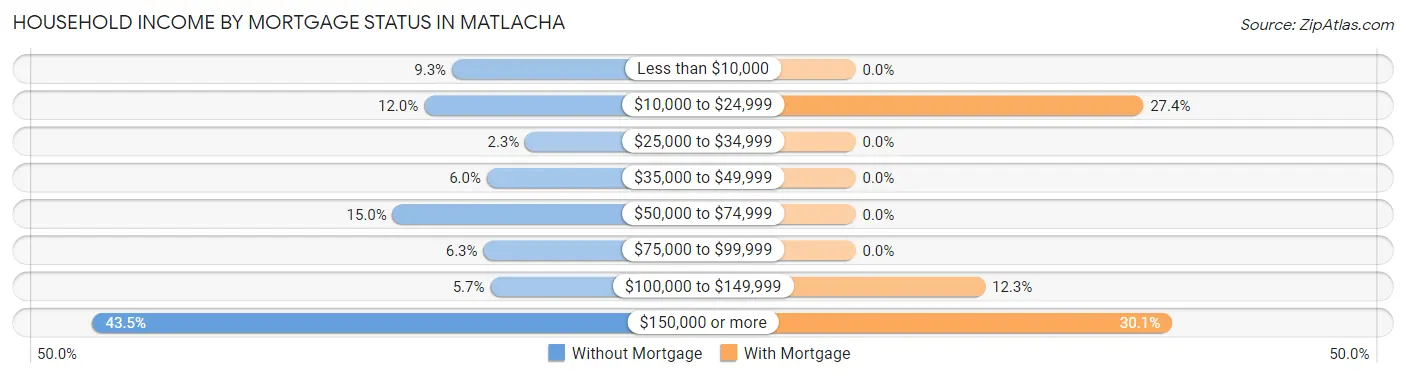
| Household Income | Without Mortgage | With Mortgage |
| Less than $10,000 | 28 (9.3%) | 0 (0.0%) |
| $10,000 to $24,999 | 36 (12.0%) | 20 (27.4%) |
| $25,000 to $34,999 | 7 (2.3%) | 0 (0.0%) |
| $35,000 to $49,999 | 18 (6.0%) | 0 (0.0%) |
| $50,000 to $74,999 | 45 (14.9%) | 0 (0.0%) |
| $75,000 to $99,999 | 19 (6.3%) | 0 (0.0%) |
| $100,000 to $149,999 | 17 (5.7%) | 9 (12.3%) |
| $150,000 or more | 131 (43.5%) | 22 (30.1%) |
| Total | 301 (100.0%) | 73 (100.0%) |
Property Value to Household Income Ratio in Matlacha
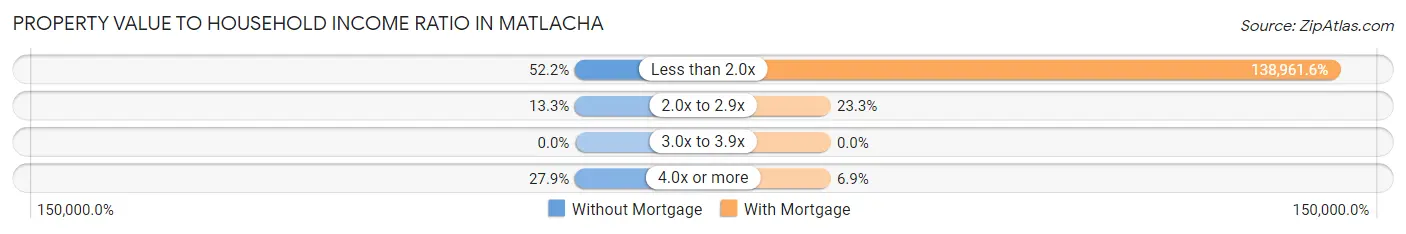
| Value-to-Income Ratio | Without Mortgage | With Mortgage |
| Less than 2.0x | 157 (52.2%) | 101,442 (138,961.6%) |
| 2.0x to 2.9x | 40 (13.3%) | 17 (23.3%) |
| 3.0x to 3.9x | 0 (0.0%) | 0 (0.0%) |
| 4.0x or more | 84 (27.9%) | 5 (6.9%) |
| Total | 301 (100.0%) | 73 (100.0%) |
Real Estate Taxes by Mortgage Status in Matlacha
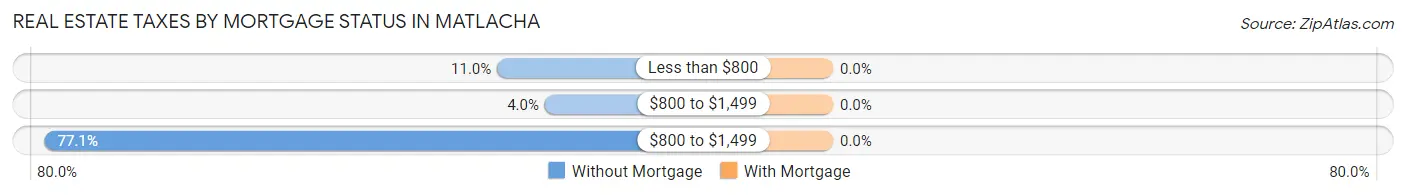
| Property Taxes | Without Mortgage | With Mortgage |
| Less than $800 | 33 (11.0%) | 0 (0.0%) |
| $800 to $1,499 | 12 (4.0%) | 0 (0.0%) |
| $800 to $1,499 | 232 (77.1%) | 0 (0.0%) |
| Total | 301 (100.0%) | 73 (100.0%) |
Health & Disability in Matlacha
Health Insurance Coverage by Age in Matlacha
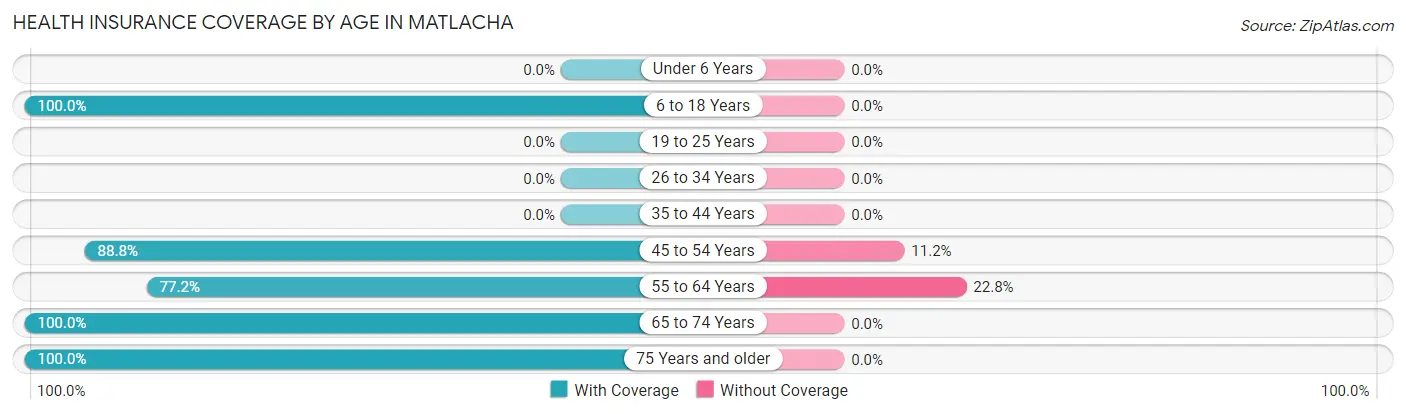
| Age Bracket | With Coverage | Without Coverage |
| Under 6 Years | 0 (0.0%) | 0 (0.0%) |
| 6 to 18 Years | 97 (100.0%) | 0 (0.0%) |
| 19 to 25 Years | 0 (0.0%) | 0 (0.0%) |
| 26 to 34 Years | 0 (0.0%) | 0 (0.0%) |
| 35 to 44 Years | 0 (0.0%) | 0 (0.0%) |
| 45 to 54 Years | 95 (88.8%) | 12 (11.2%) |
| 55 to 64 Years | 173 (77.2%) | 51 (22.8%) |
| 65 to 74 Years | 356 (100.0%) | 0 (0.0%) |
| 75 Years and older | 53 (100.0%) | 0 (0.0%) |
| Total | 774 (92.5%) | 63 (7.5%) |
Health Insurance Coverage by Citizenship Status in Matlacha
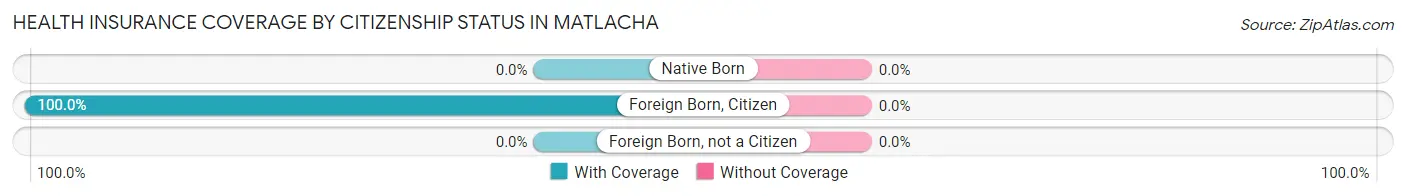
| Citizenship Status | With Coverage | Without Coverage |
| Native Born | 0 (0.0%) | 0 (0.0%) |
| Foreign Born, Citizen | 97 (100.0%) | 0 (0.0%) |
| Foreign Born, not a Citizen | 0 (0.0%) | 0 (0.0%) |
Health Insurance Coverage by Household Income in Matlacha
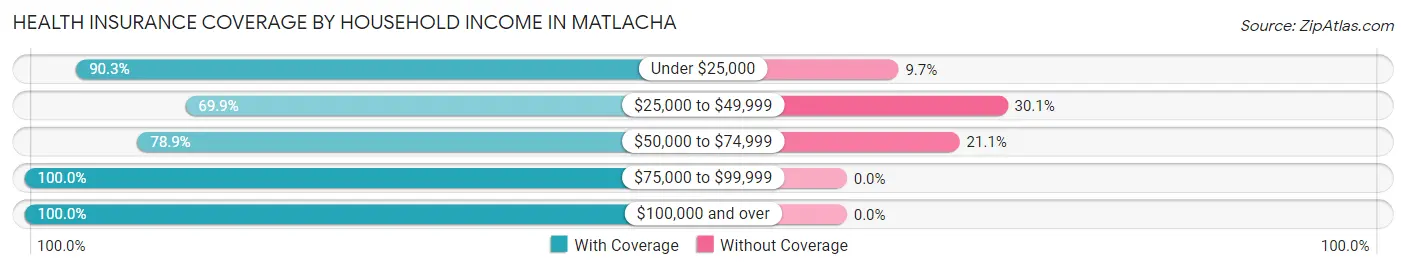
| Household Income | With Coverage | Without Coverage |
| Under $25,000 | 112 (90.3%) | 12 (9.7%) |
| $25,000 to $49,999 | 58 (69.9%) | 25 (30.1%) |
| $50,000 to $74,999 | 97 (78.9%) | 26 (21.1%) |
| $75,000 to $99,999 | 50 (100.0%) | 0 (0.0%) |
| $100,000 and over | 457 (100.0%) | 0 (0.0%) |
Public vs Private Health Insurance Coverage by Age in Matlacha
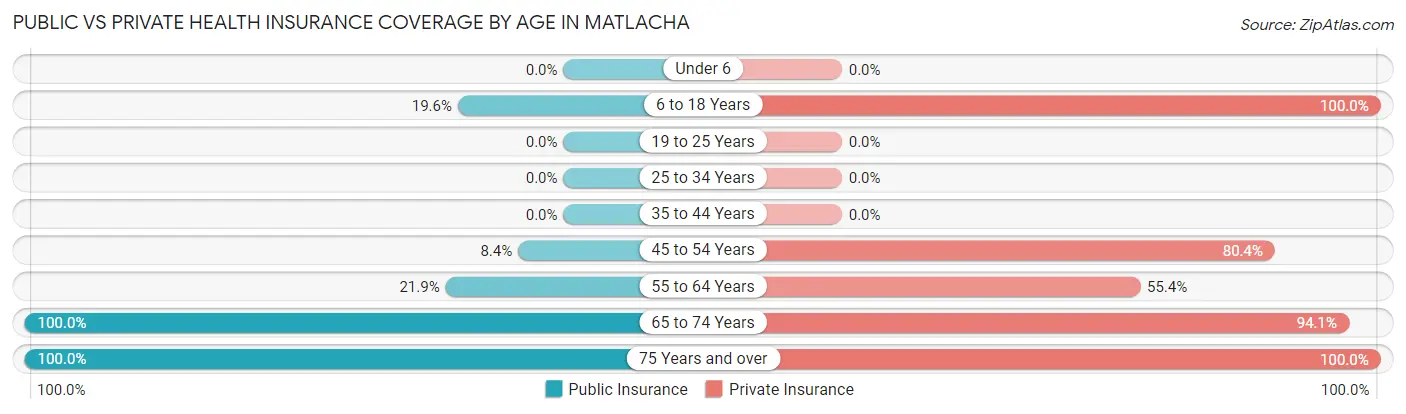
| Age Bracket | Public Insurance | Private Insurance |
| Under 6 | 0 (0.0%) | 0 (0.0%) |
| 6 to 18 Years | 19 (19.6%) | 97 (100.0%) |
| 19 to 25 Years | 0 (0.0%) | 0 (0.0%) |
| 25 to 34 Years | 0 (0.0%) | 0 (0.0%) |
| 35 to 44 Years | 0 (0.0%) | 0 (0.0%) |
| 45 to 54 Years | 9 (8.4%) | 86 (80.4%) |
| 55 to 64 Years | 49 (21.9%) | 124 (55.4%) |
| 65 to 74 Years | 356 (100.0%) | 335 (94.1%) |
| 75 Years and over | 53 (100.0%) | 53 (100.0%) |
| Total | 486 (58.1%) | 695 (83.0%) |
Disability Status by Sex by Age in Matlacha
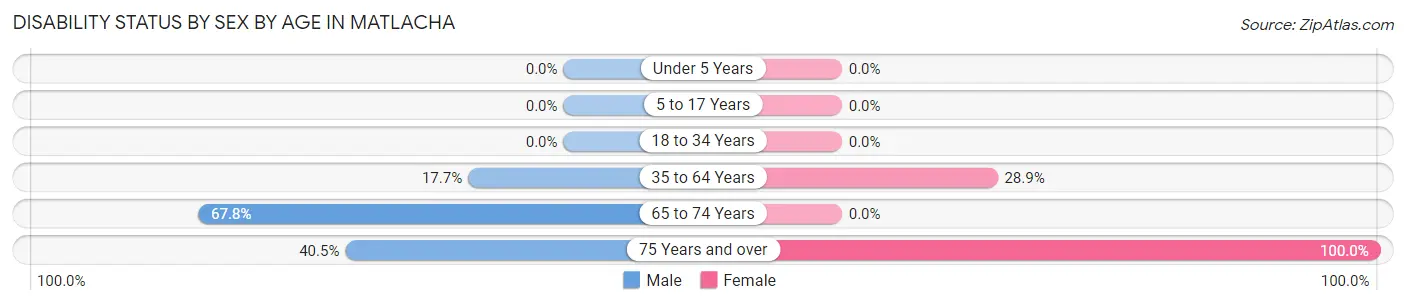
| Age Bracket | Male | Female |
| Under 5 Years | 0 (0.0%) | 0 (0.0%) |
| 5 to 17 Years | 0 (0.0%) | 0 (0.0%) |
| 18 to 34 Years | 0 (0.0%) | 0 (0.0%) |
| 35 to 64 Years | 20 (17.7%) | 63 (28.9%) |
| 65 to 74 Years | 120 (67.8%) | 0 (0.0%) |
| 75 Years and over | 17 (40.5%) | 11 (100.0%) |
Disability Class by Sex by Age in Matlacha
Disability Class: Hearing Difficulty
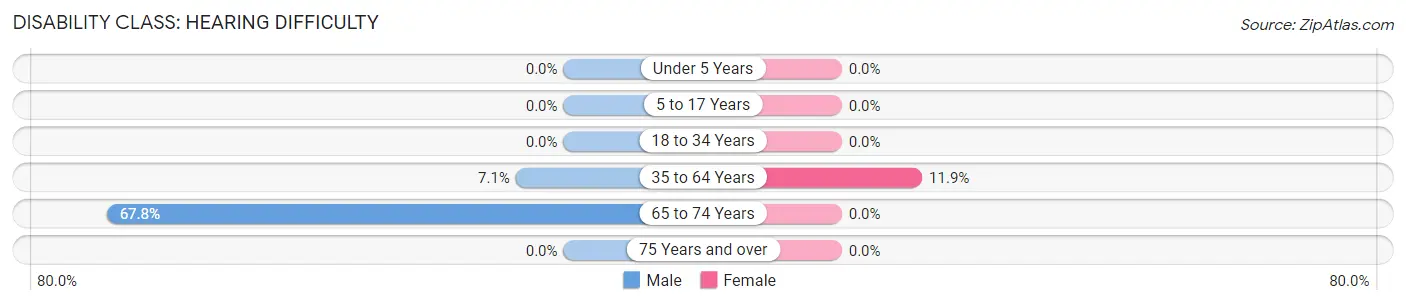
| Age Bracket | Male | Female |
| Under 5 Years | 0 (0.0%) | 0 (0.0%) |
| 5 to 17 Years | 0 (0.0%) | 0 (0.0%) |
| 18 to 34 Years | 0 (0.0%) | 0 (0.0%) |
| 35 to 64 Years | 8 (7.1%) | 26 (11.9%) |
| 65 to 74 Years | 120 (67.8%) | 0 (0.0%) |
| 75 Years and over | 0 (0.0%) | 0 (0.0%) |
Disability Class: Vision Difficulty
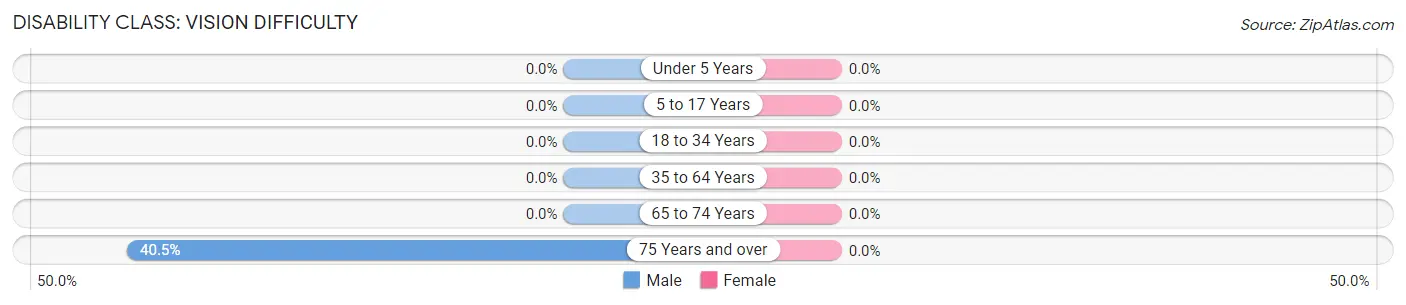
| Age Bracket | Male | Female |
| Under 5 Years | 0 (0.0%) | 0 (0.0%) |
| 5 to 17 Years | 0 (0.0%) | 0 (0.0%) |
| 18 to 34 Years | 0 (0.0%) | 0 (0.0%) |
| 35 to 64 Years | 0 (0.0%) | 0 (0.0%) |
| 65 to 74 Years | 0 (0.0%) | 0 (0.0%) |
| 75 Years and over | 17 (40.5%) | 0 (0.0%) |
Disability Class: Cognitive Difficulty
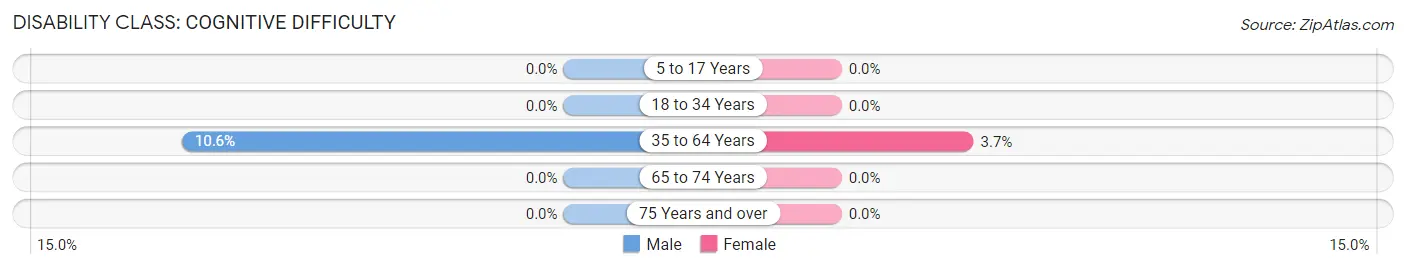
| Age Bracket | Male | Female |
| 5 to 17 Years | 0 (0.0%) | 0 (0.0%) |
| 18 to 34 Years | 0 (0.0%) | 0 (0.0%) |
| 35 to 64 Years | 12 (10.6%) | 8 (3.7%) |
| 65 to 74 Years | 0 (0.0%) | 0 (0.0%) |
| 75 Years and over | 0 (0.0%) | 0 (0.0%) |
Disability Class: Ambulatory Difficulty
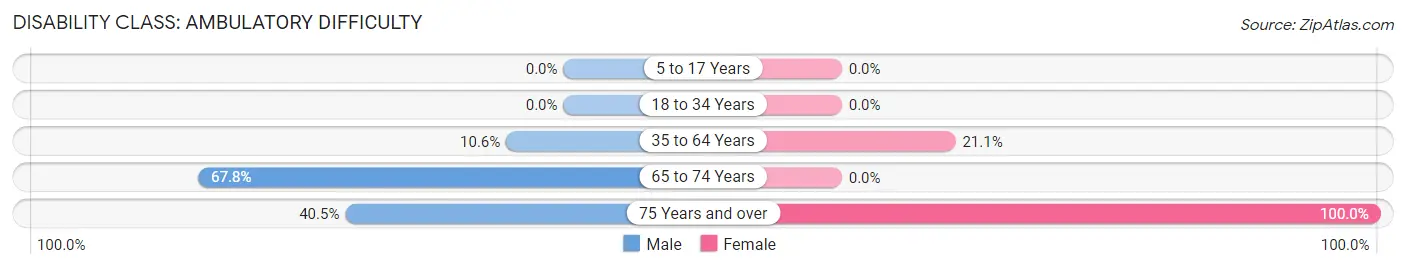
| Age Bracket | Male | Female |
| 5 to 17 Years | 0 (0.0%) | 0 (0.0%) |
| 18 to 34 Years | 0 (0.0%) | 0 (0.0%) |
| 35 to 64 Years | 12 (10.6%) | 46 (21.1%) |
| 65 to 74 Years | 120 (67.8%) | 0 (0.0%) |
| 75 Years and over | 17 (40.5%) | 11 (100.0%) |
Disability Class: Self-Care Difficulty
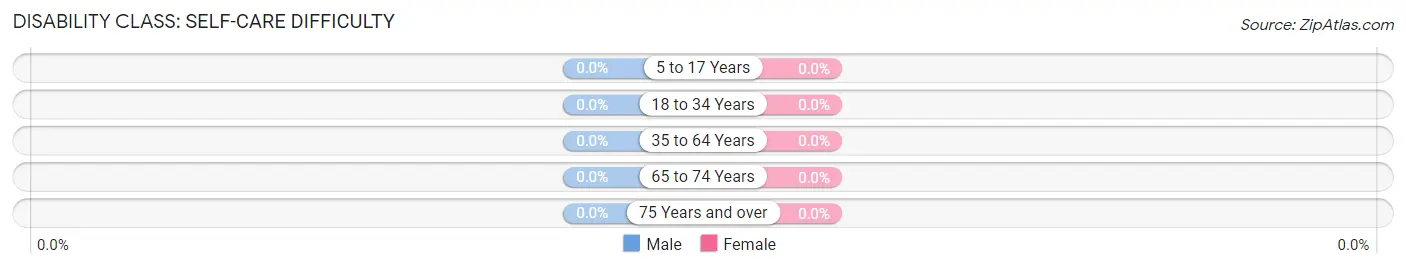
| Age Bracket | Male | Female |
| 5 to 17 Years | 0 (0.0%) | 0 (0.0%) |
| 18 to 34 Years | 0 (0.0%) | 0 (0.0%) |
| 35 to 64 Years | 0 (0.0%) | 0 (0.0%) |
| 65 to 74 Years | 0 (0.0%) | 0 (0.0%) |
| 75 Years and over | 0 (0.0%) | 0 (0.0%) |
Technology Access in Matlacha
Computing Device Access in Matlacha
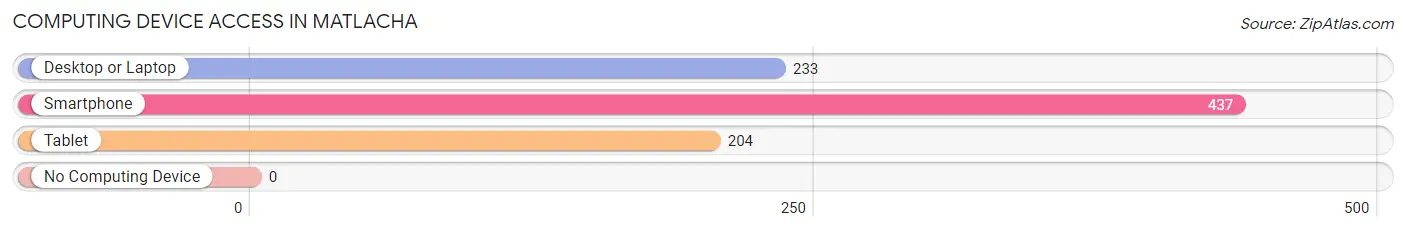
| Device Type | # Households | % Households |
| Desktop or Laptop | 233 | 53.3% |
| Smartphone | 437 | 100.0% |
| Tablet | 204 | 46.7% |
| No Computing Device | 0 | 0.0% |
| Total | 437 | 100.0% |
Internet Access in Matlacha
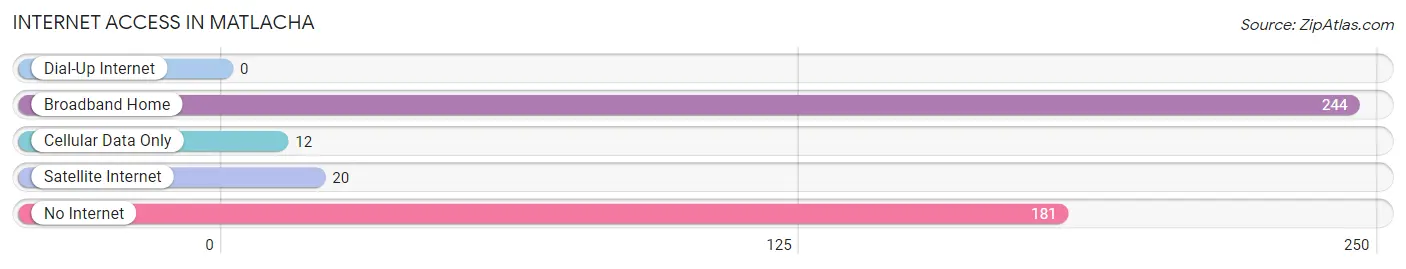
| Internet Type | # Households | % Households |
| Dial-Up Internet | 0 | 0.0% |
| Broadband Home | 244 | 55.8% |
| Cellular Data Only | 12 | 2.8% |
| Satellite Internet | 20 | 4.6% |
| No Internet | 181 | 41.4% |
| Total | 437 | 100.0% |
Matlacha Summary
Matlacha, Florida is a small fishing village located in Lee County, Florida. It is situated on the northern tip of Pine Island, which is the largest island in the chain of islands known as the Ten Thousand Islands. Matlacha is a popular tourist destination due to its laid-back atmosphere, beautiful beaches, and abundance of wildlife.
History
Matlacha was originally inhabited by the Calusa Indians, who were the first known inhabitants of the area. The Calusa were a powerful tribe that controlled much of the area from Tampa Bay to the Florida Keys. They were known for their fishing and trading skills, and their influence can still be seen in the area today.
In the late 1800s, the area was settled by fishermen from the Bahamas and Cuba. These fishermen established a small fishing village on the northern tip of Pine Island, which they named Matlacha. The name Matlacha is derived from the Calusa word for “turtle”, which is fitting since the area is known for its abundance of sea turtles.
In the early 1900s, the area began to attract more settlers, and the village of Matlacha began to grow. The village was incorporated in 1925, and it has remained a small fishing village ever since.
Geography
Matlacha is located on the northern tip of Pine Island, which is the largest island in the Ten Thousand Islands chain. The island is approximately 25 miles long and 5 miles wide, and it is surrounded by the Caloosahatchee River to the north and the Gulf of Mexico to the south.
The village of Matlacha is located on the northern tip of the island, and it is bordered by the Matlacha Pass to the east and the Pine Island Sound to the west. The village is home to several small islands, including Matlacha Key, which is connected to the mainland by a bridge.
Economy
Matlacha’s economy is largely based on fishing and tourism. The village is home to several fishing charters, which offer deep-sea fishing trips and sightseeing tours. The village also has several restaurants, bars, and shops that cater to tourists.
The village is also home to several art galleries, which feature the work of local artists. The galleries are popular with tourists, and they help to bring in additional revenue for the village.
Demographics
As of the 2010 census, the population of Matlacha was 1,822. The population is predominantly white (90.2%), with a small percentage of African Americans (3.2%) and Hispanics (4.3%). The median household income is $41,250, and the median age is 47.
Matlacha is a small, close-knit community that is known for its laid-back atmosphere and friendly people. The village is a popular tourist destination, and it is a great place to relax and enjoy the beauty of nature.
Common Questions
What is the Total Population of Matlacha?
Total Population of Matlacha is 837.
What is the Total Male Population of Matlacha?
Total Male Population of Matlacha is 337.
What is the Total Female Population of Matlacha?
Total Female Population of Matlacha is 500.
What is the Ratio of Males per 100 Females in Matlacha?
There are 67.40 Males per 100 Females in Matlacha.
What is the Ratio of Females per 100 Males in Matlacha?
There are 148.37 Females per 100 Males in Matlacha.
What is the Median Population Age in Matlacha?
Median Population Age in Matlacha is 64.0 Years.
What is the Average Family Size in Matlacha
Average Family Size in Matlacha is 2.4 People.
What is the Average Household Size in Matlacha
Average Household Size in Matlacha is 1.9 People.
What is Per Capita Income in Matlacha?
Per Capita income in Matlacha is $93,762.
What is the Median Household income in Matlacha?
Median Household Income in Matlacha is $77,841.
What is Income or Wage Gap in Matlacha?
Income or Wage Gap in Matlacha is 92.7%.
Women in Matlacha earn 7.3 cents for every dollar earned by a man.
What is Family Income Deficit in Matlacha?
Family Income Deficit in Matlacha is $8,090.
Families that are below poverty line in Matlacha earn $8,090 less on average than the poverty threshold level.
What is Inequality or Gini Index in Matlacha?
Inequality or Gini Index in Matlacha is 0.55.
How Large is the Labor Force in Matlacha?
There are 278 People in the Labor Forcein in Matlacha.
What is the Percentage of People in the Labor Force in Matlacha?
36.4% of People are in the Labor Force in Matlacha.
What is the Unemployment Rate in Matlacha?
Unemployment Rate in Matlacha is 8.6%.