Manasota Key, FL
Manasota Key Map
Manasota Key Overview
1,718
TOTAL POPULATION
804
MALE POPULATION
914
FEMALE POPULATION
87.96
MALES / 100 FEMALES
113.68
FEMALES / 100 MALES
72.1
MEDIAN AGE
2.1
AVG FAMILY SIZE
1.9
AVG HOUSEHOLD SIZE
$81,642
PER CAPITA INCOME
$183,508
AVG FAMILY INCOME
$111,250
AVG HOUSEHOLD INCOME
80.8%
WAGE / INCOME GAP [ % ]
19.2¢/ $1
WAGE / INCOME GAP [ $ ]
0.44
INEQUALITY / GINI INDEX
496
LABOR FORCE [ PEOPLE ]
29.1%
PERCENT IN LABOR FORCE
6.3%
UNEMPLOYMENT RATE
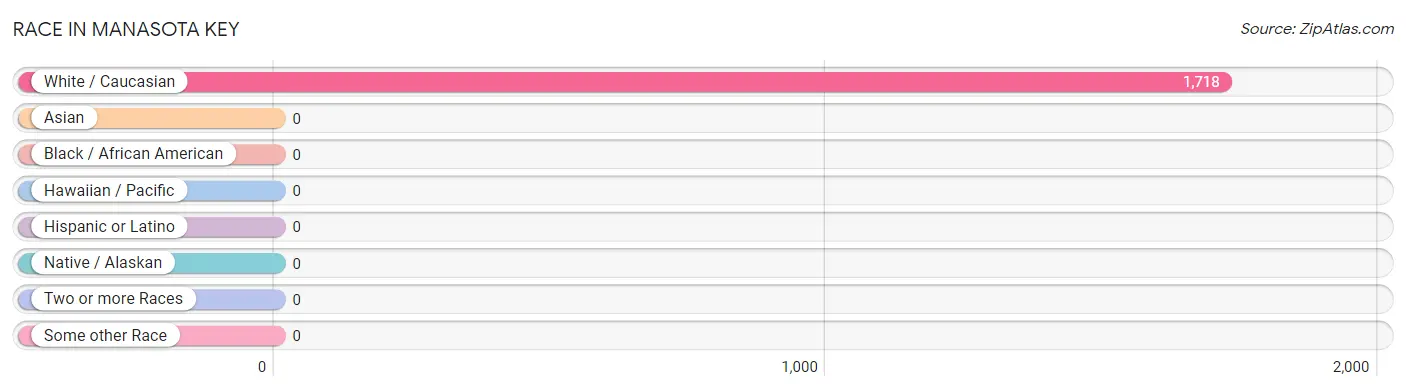
Race in Manasota Key
The most populous races in Manasota Key are , and White / Caucasian (1,718 | 100.0%).
| Race | # Population | % Population |
| Asian | 0 | 0.0% |
| Black / African American | 0 | 0.0% |
| Hawaiian / Pacific | 0 | 0.0% |
| Hispanic or Latino | 0 | 0.0% |
| Native / Alaskan | 0 | 0.0% |
| White / Caucasian | 1,718 | 100.0% |
| Two or more Races | 0 | 0.0% |
| Some other Race | 0 | 0.0% |
| Total | 1,718 | 100.0% |
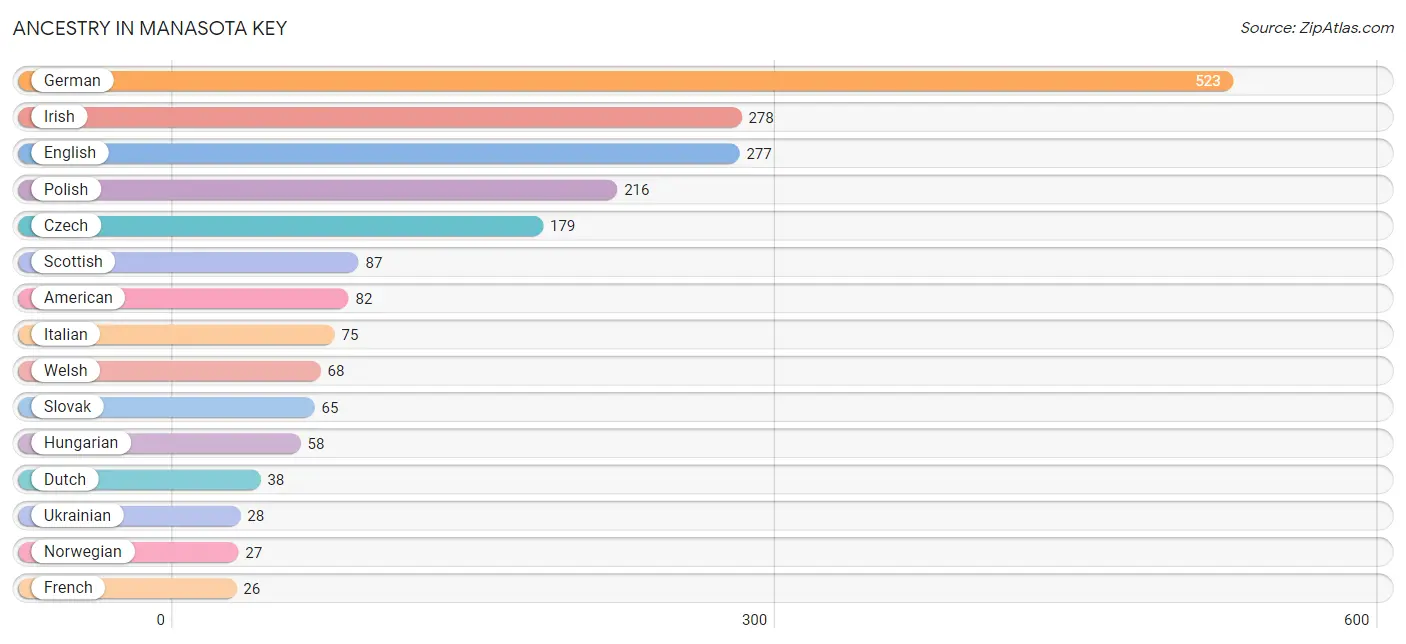
Ancestry in Manasota Key
The most populous ancestries reported in Manasota Key are German (523 | 30.4%), Irish (278 | 16.2%), English (277 | 16.1%), Polish (216 | 12.6%), and Czech (179 | 10.4%), together accounting for 85.7% of all Manasota Key residents.
| Ancestry | # Population | % Population |
| American | 82 | 4.8% |
| Croatian | 8 | 0.5% |
| Czech | 179 | 10.4% |
| Danish | 11 | 0.6% |
| Dutch | 38 | 2.2% |
| English | 277 | 16.1% |
| European | 14 | 0.8% |
| French | 26 | 1.5% |
| French Canadian | 20 | 1.2% |
| German | 523 | 30.4% |
| Greek | 8 | 0.5% |
| Hungarian | 58 | 3.4% |
| Irish | 278 | 16.2% |
| Italian | 75 | 4.4% |
| Lithuanian | 10 | 0.6% |
| Norwegian | 27 | 1.6% |
| Polish | 216 | 12.6% |
| Portuguese | 8 | 0.5% |
| Russian | 6 | 0.4% |
| Scotch-Irish | 16 | 0.9% |
| Scottish | 87 | 5.1% |
| Slovak | 65 | 3.8% |
| Swedish | 9 | 0.5% |
| Swiss | 11 | 0.6% |
| Ukrainian | 28 | 1.6% |
| Welsh | 68 | 4.0% | View All 26 Rows |
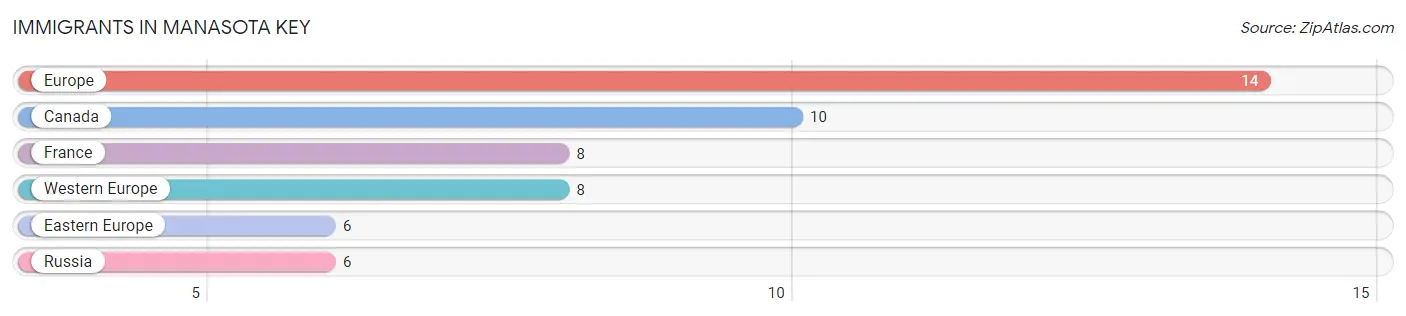
Immigrants in Manasota Key
The most numerous immigrant groups reported in Manasota Key came from Europe (14 | 0.8%), Canada (10 | 0.6%), France (8 | 0.5%), Western Europe (8 | 0.5%), and Eastern Europe (6 | 0.4%), together accounting for 2.7% of all Manasota Key residents.
| Immigration Origin | # Population | % Population |
| Canada | 10 | 0.6% |
| Eastern Europe | 6 | 0.4% |
| Europe | 14 | 0.8% |
| France | 8 | 0.5% |
| Russia | 6 | 0.4% |
| Western Europe | 8 | 0.5% | View All 6 Rows |
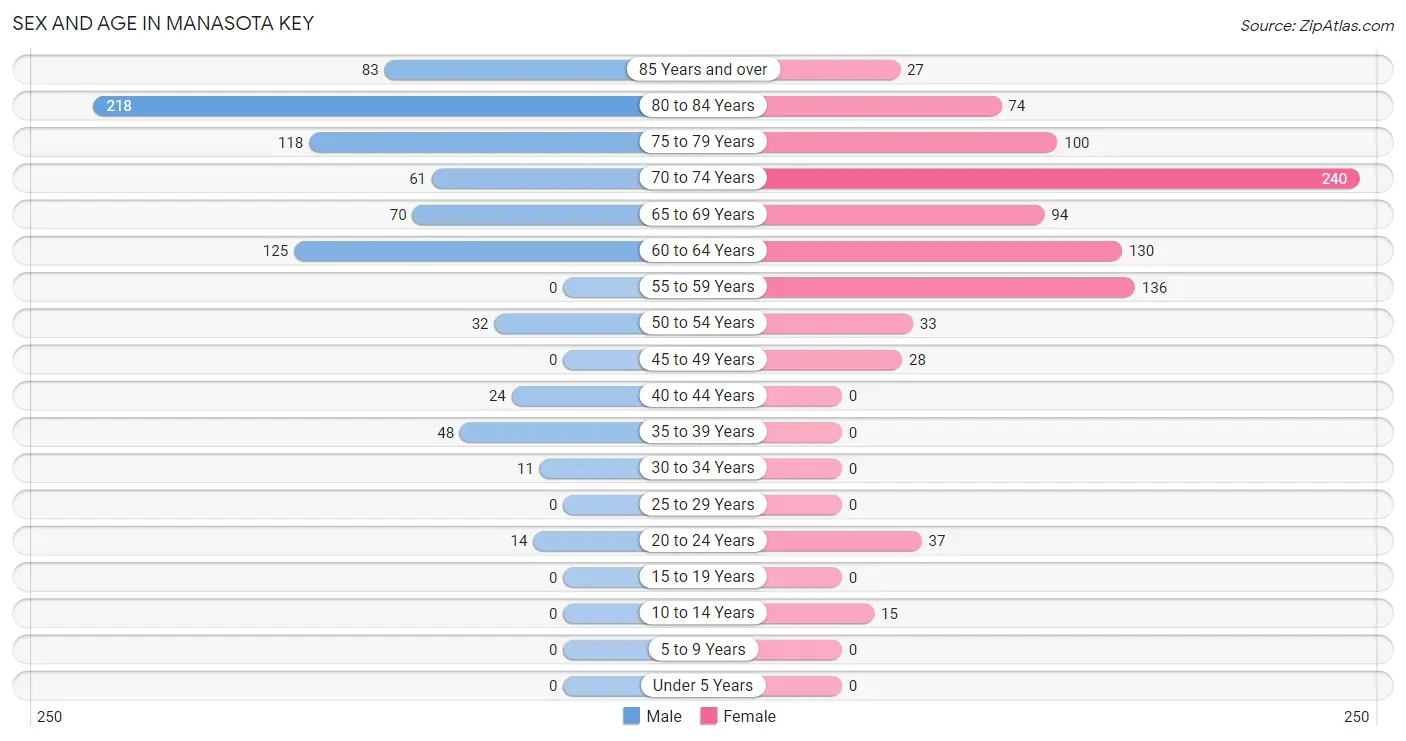
Sex and Age in Manasota Key
Sex and Age in Manasota Key
The most populous age groups in Manasota Key are 80 to 84 Years (218 | 27.1%) for men and 70 to 74 Years (240 | 26.3%) for women.
| Age Bracket | Male | Female |
| Under 5 Years | 0 (0.0%) | 0 (0.0%) |
| 5 to 9 Years | 0 (0.0%) | 0 (0.0%) |
| 10 to 14 Years | 0 (0.0%) | 15 (1.6%) |
| 15 to 19 Years | 0 (0.0%) | 0 (0.0%) |
| 20 to 24 Years | 14 (1.7%) | 37 (4.1%) |
| 25 to 29 Years | 0 (0.0%) | 0 (0.0%) |
| 30 to 34 Years | 11 (1.4%) | 0 (0.0%) |
| 35 to 39 Years | 48 (6.0%) | 0 (0.0%) |
| 40 to 44 Years | 24 (3.0%) | 0 (0.0%) |
| 45 to 49 Years | 0 (0.0%) | 28 (3.1%) |
| 50 to 54 Years | 32 (4.0%) | 33 (3.6%) |
| 55 to 59 Years | 0 (0.0%) | 136 (14.9%) |
| 60 to 64 Years | 125 (15.5%) | 130 (14.2%) |
| 65 to 69 Years | 70 (8.7%) | 94 (10.3%) |
| 70 to 74 Years | 61 (7.6%) | 240 (26.3%) |
| 75 to 79 Years | 118 (14.7%) | 100 (10.9%) |
| 80 to 84 Years | 218 (27.1%) | 74 (8.1%) |
| 85 Years and over | 83 (10.3%) | 27 (2.9%) |
| Total | 804 (100.0%) | 914 (100.0%) |
Families and Households in Manasota Key
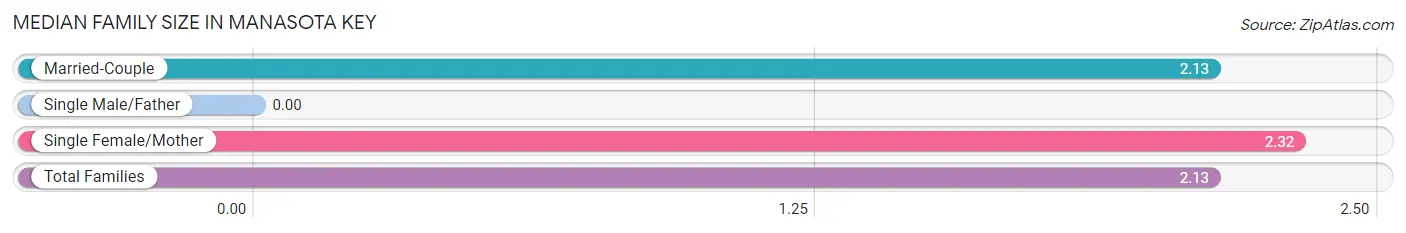
Median Family Size in Manasota Key
| Family Type | # Families | Family Size |
| Married-Couple | 591 (95.5%) | 2.13 |
| Single Male/Father | 0 (0.0%) | - |
| Single Female/Mother | 28 (4.5%) | 2.32 |
| Total Families | 619 (100.0%) | 2.13 |
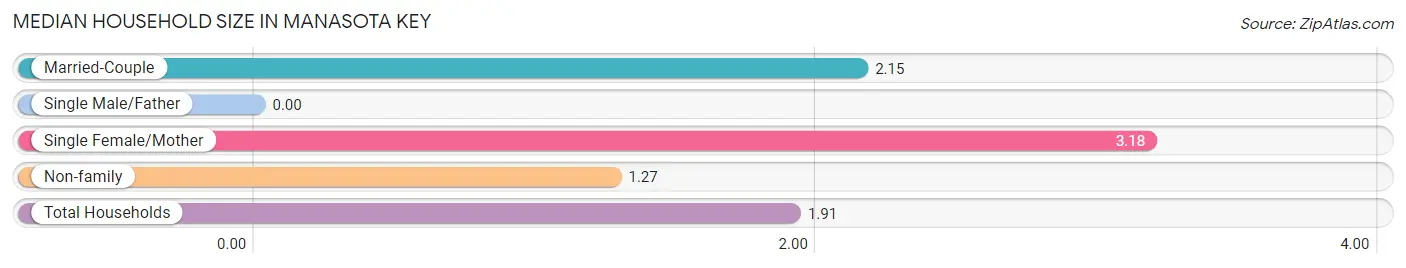
Median Household Size in Manasota Key
| Household Type | # Households | Household Size |
| Married-Couple | 591 (65.7%) | 2.15 |
| Single Male/Father | 0 (0.0%) | - |
| Single Female/Mother | 28 (3.1%) | 3.18 |
| Non-family | 281 (31.2%) | 1.27 |
| Total Households | 900 (100.0%) | 1.91 |
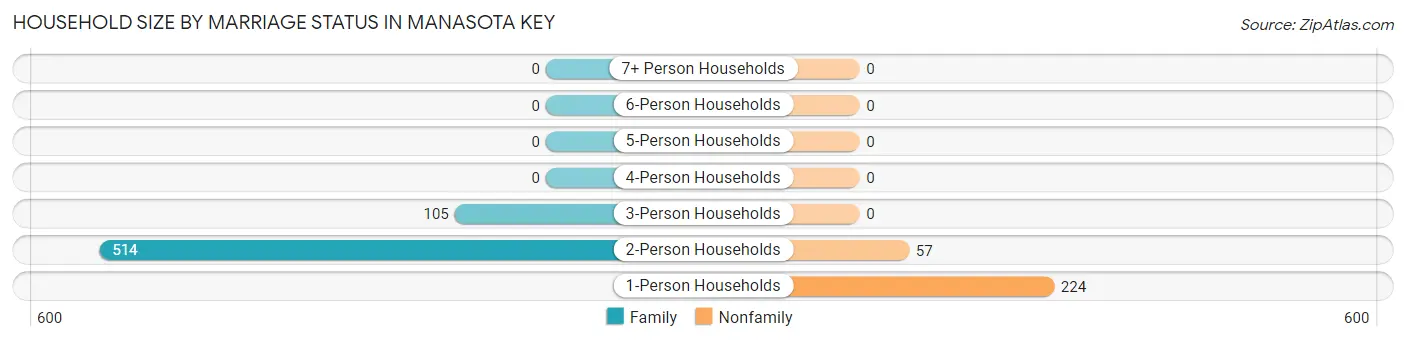
Household Size by Marriage Status in Manasota Key
Out of a total of 900 households in Manasota Key, 619 (68.8%) are family households, while 281 (31.2%) are nonfamily households. The most numerous type of family households are 2-person households, comprising 514, and the most common type of nonfamily households are 1-person households, comprising 224.
| Household Size | Family Households | Nonfamily Households |
| 1-Person Households | - | 224 (24.9%) |
| 2-Person Households | 514 (57.1%) | 57 (6.3%) |
| 3-Person Households | 105 (11.7%) | 0 (0.0%) |
| 4-Person Households | 0 (0.0%) | 0 (0.0%) |
| 5-Person Households | 0 (0.0%) | 0 (0.0%) |
| 6-Person Households | 0 (0.0%) | 0 (0.0%) |
| 7+ Person Households | 0 (0.0%) | 0 (0.0%) |
| Total | 619 (68.8%) | 281 (31.2%) |
Female Fertility in Manasota Key
Fertility by Age in Manasota Key
| Age Bracket | Women with Births | Births / 1,000 Women |
| 15 to 19 years | 0 (0.0%) | 0.0 |
| 20 to 34 years | 0 (0.0%) | 0.0 |
| 35 to 50 years | 0 (0.0%) | 0.0 |
| Total | 0 (0.0%) | 0.0 |
Fertility by Age by Marriage Status in Manasota Key
| Age Bracket | Married | Unmarried |
| 15 to 19 years | 0 (0.0%) | 0 (0.0%) |
| 20 to 34 years | 0 (0.0%) | 0 (0.0%) |
| 35 to 50 years | 0 (0.0%) | 0 (0.0%) |
| Total | 0 (0.0%) | 0 (0.0%) |
Fertility by Education in Manasota Key
| Educational Attainment | Women with Births | Births / 1,000 Women |
| Less than High School | 0 (0.0%) | 0.0 |
| High School Diploma | 0 (0.0%) | 0.0 |
| College or Associate's Degree | 0 (0.0%) | 0.0 |
| Bachelor's Degree | 0 (0.0%) | 0.0 |
| Graduate Degree | 0 (0.0%) | 0.0 |
| Total | 0 (0.0%) | 0.0 |
Fertility by Education by Marriage Status in Manasota Key
| Educational Attainment | Married | Unmarried |
| Less than High School | 0 (0.0%) | 0 (0.0%) |
| High School Diploma | 0 (0.0%) | 0 (0.0%) |
| College or Associate's Degree | 0 (0.0%) | 0 (0.0%) |
| Bachelor's Degree | 0 (0.0%) | 0 (0.0%) |
| Graduate Degree | 0 (0.0%) | 0 (0.0%) |
| Total | 0 (0.0%) | 0 (0.0%) |
Income in Manasota Key
Income Overview in Manasota Key
Per Capita Income in Manasota Key is $81,642, while median incomes of families and households are $183,508 and $111,250 respectively.
| Characteristic | Number | Measure |
| Per Capita Income | 1,718 | $81,642 |
| Median Family Income | 619 | $183,508 |
| Mean Family Income | 619 | $180,168 |
| Median Household Income | 900 | $111,250 |
| Mean Household Income | 900 | $156,580 |
| Income Deficit | 619 | $0 |
| Wage / Income Gap (%) | 1,718 | 80.81% |
| Wage / Income Gap ($) | 1,718 | 19.19¢ per $1 |
| Gini / Inequality Index | 1,718 | 0.44 |
Earnings by Sex in Manasota Key
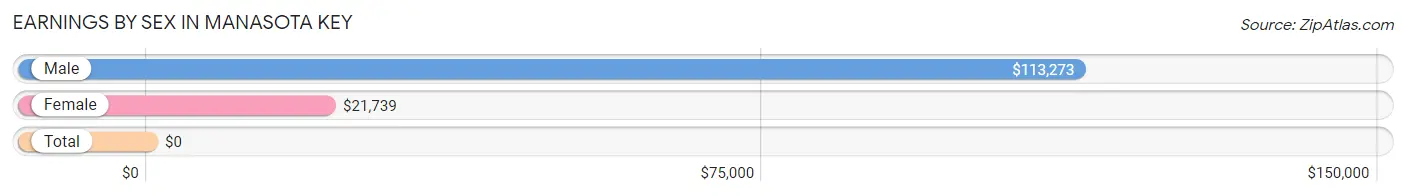
| Sex | Number | Average Earnings |
| Male | 280 (54.9%) | $113,273 |
| Female | 230 (45.1%) | $21,739 |
| Total | 510 (100.0%) | $0 |
Earnings by Sex by Income Bracket in Manasota Key
The most common earnings brackets in Manasota Key are $100,000+ for men (187 | 66.8%) and $5,000 to $7,499 for women (65 | 28.3%).
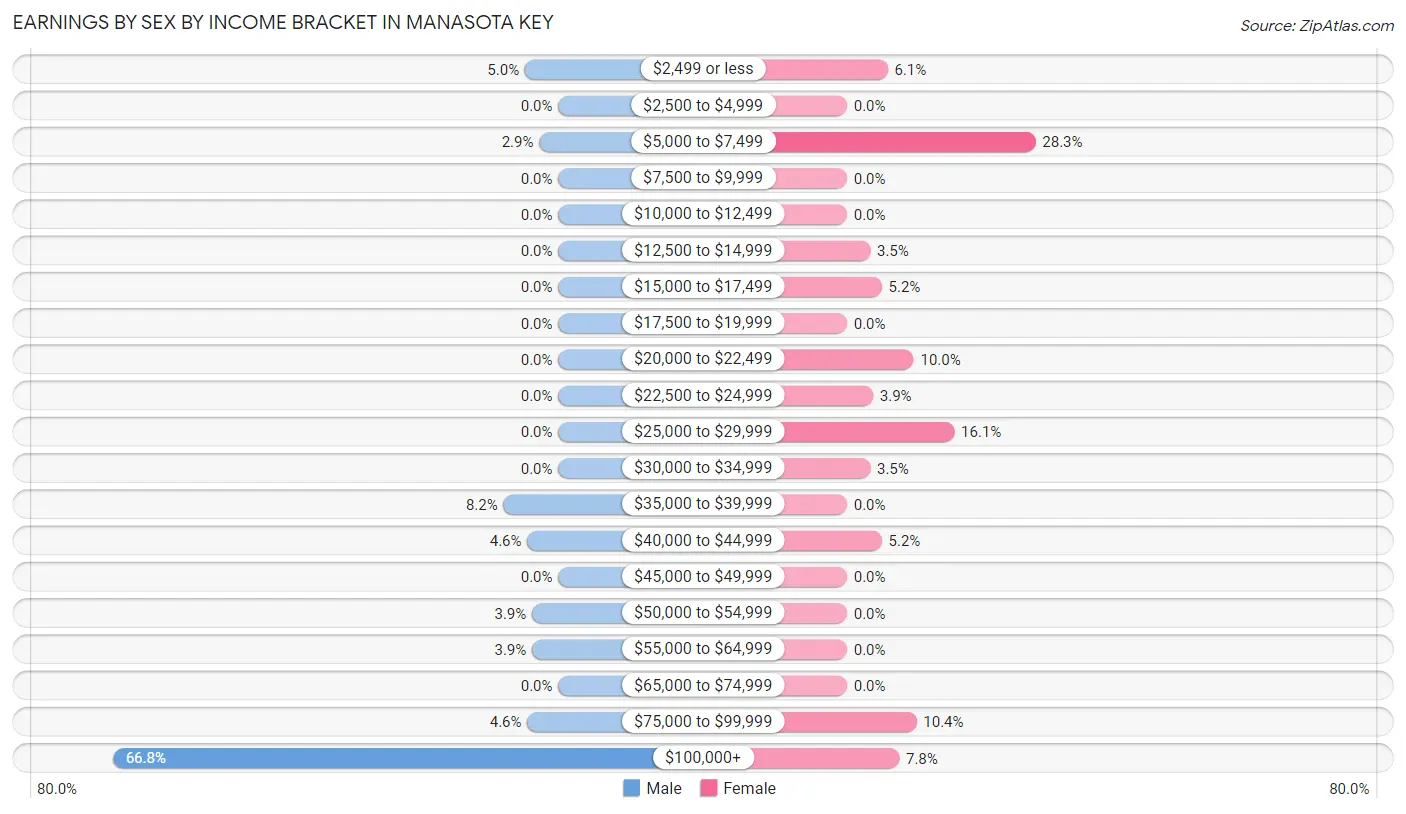
| Income | Male | Female |
| $2,499 or less | 14 (5.0%) | 14 (6.1%) |
| $2,500 to $4,999 | 0 (0.0%) | 0 (0.0%) |
| $5,000 to $7,499 | 8 (2.9%) | 65 (28.3%) |
| $7,500 to $9,999 | 0 (0.0%) | 0 (0.0%) |
| $10,000 to $12,499 | 0 (0.0%) | 0 (0.0%) |
| $12,500 to $14,999 | 0 (0.0%) | 8 (3.5%) |
| $15,000 to $17,499 | 0 (0.0%) | 12 (5.2%) |
| $17,500 to $19,999 | 0 (0.0%) | 0 (0.0%) |
| $20,000 to $22,499 | 0 (0.0%) | 23 (10.0%) |
| $22,500 to $24,999 | 0 (0.0%) | 9 (3.9%) |
| $25,000 to $29,999 | 0 (0.0%) | 37 (16.1%) |
| $30,000 to $34,999 | 0 (0.0%) | 8 (3.5%) |
| $35,000 to $39,999 | 23 (8.2%) | 0 (0.0%) |
| $40,000 to $44,999 | 13 (4.6%) | 12 (5.2%) |
| $45,000 to $49,999 | 0 (0.0%) | 0 (0.0%) |
| $50,000 to $54,999 | 11 (3.9%) | 0 (0.0%) |
| $55,000 to $64,999 | 11 (3.9%) | 0 (0.0%) |
| $65,000 to $74,999 | 0 (0.0%) | 0 (0.0%) |
| $75,000 to $99,999 | 13 (4.6%) | 24 (10.4%) |
| $100,000+ | 187 (66.8%) | 18 (7.8%) |
| Total | 280 (100.0%) | 230 (100.0%) |
Earnings by Sex by Educational Attainment in Manasota Key
Average earnings in Manasota Key are $113,388 for men and $27,669 for women, a difference of 75.6%. Men with an educational attainment of college or associate's degree enjoy the highest average annual earnings of $250,001, while those with high school diploma education earn the least with $113,569. Women with an educational attainment of graduate degree earn the most with the average annual earnings of $76,198, while those with high school diploma education have the smallest earnings of $20,652.
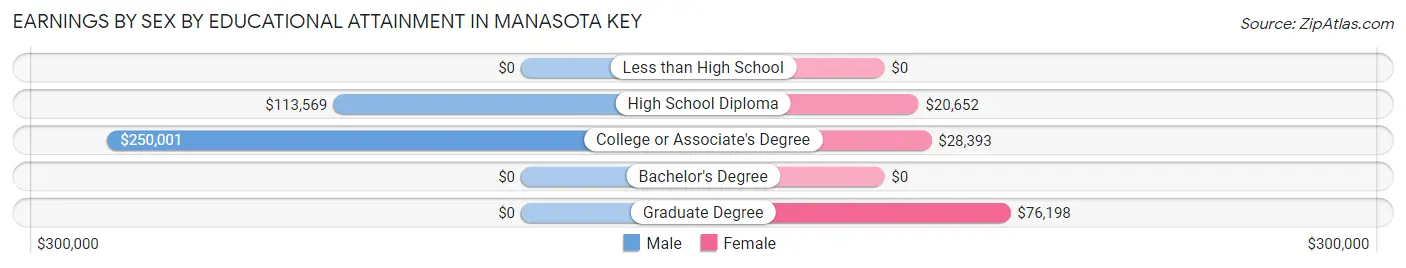
| Educational Attainment | Male Income | Female Income |
| Less than High School | - | - |
| High School Diploma | $113,569 | $20,652 |
| College or Associate's Degree | $250,001 | $28,393 |
| Bachelor's Degree | - | - |
| Graduate Degree | - | - |
| Total | $113,388 | $27,669 |
Family Income in Manasota Key
Family Income Brackets in Manasota Key
According to the Manasota Key family income data, there are 283 families falling into the $200,000+ income range, which is the most common income bracket and makes up 45.7% of all families.
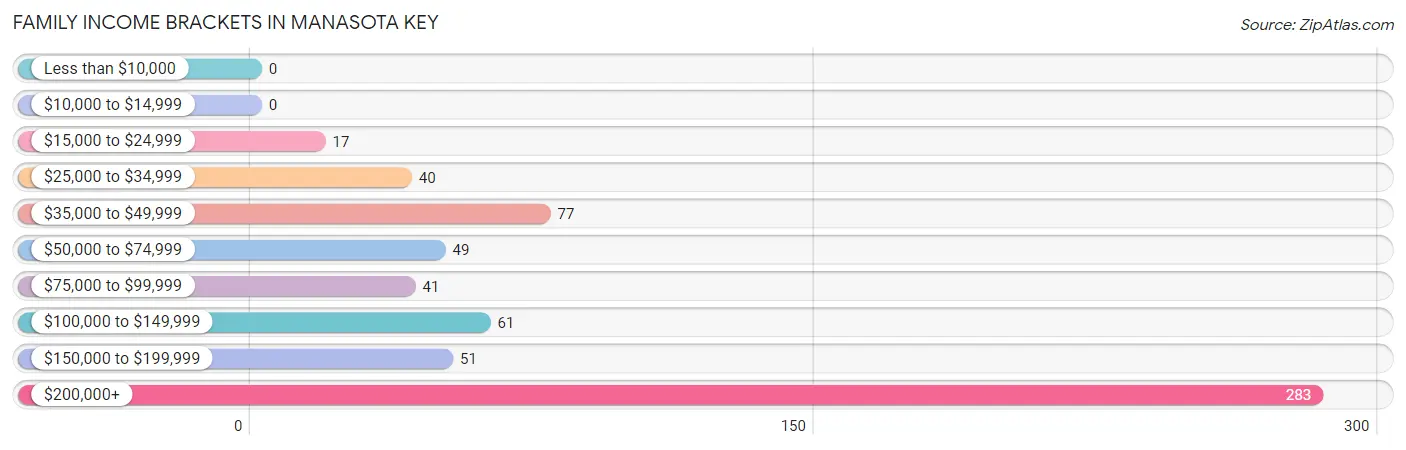
| Income Bracket | # Families | % Families |
| Less than $10,000 | 0 | 0.0% |
| $10,000 to $14,999 | 0 | 0.0% |
| $15,000 to $24,999 | 17 | 2.7% |
| $25,000 to $34,999 | 40 | 6.5% |
| $35,000 to $49,999 | 77 | 12.4% |
| $50,000 to $74,999 | 49 | 7.9% |
| $75,000 to $99,999 | 41 | 6.6% |
| $100,000 to $149,999 | 61 | 9.9% |
| $150,000 to $199,999 | 51 | 8.2% |
| $200,000+ | 283 | 45.7% |
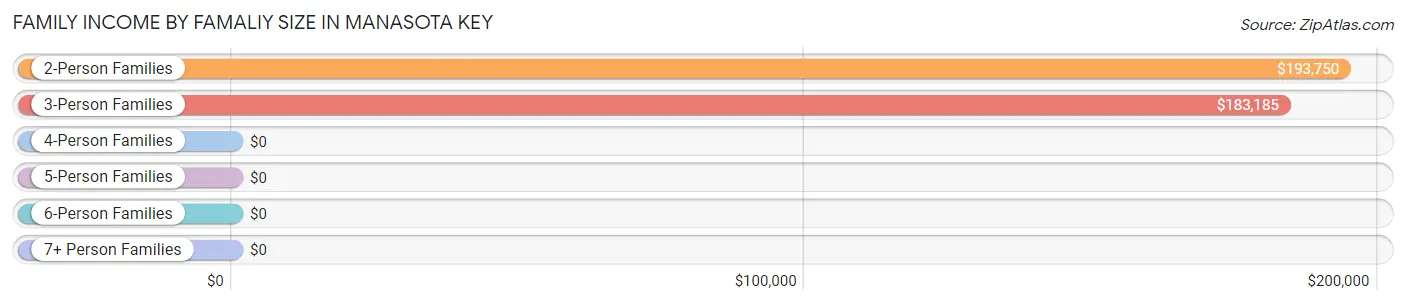
Family Income by Famaliy Size in Manasota Key
2-person families (552 | 89.2%) account for the highest median family income in Manasota Key with $193,750 per family, while 2-person families (552 | 89.2%) have the highest median income of $96,875 per family member.
| Income Bracket | # Families | Median Income |
| 2-Person Families | 552 (89.2%) | $193,750 |
| 3-Person Families | 67 (10.8%) | $183,185 |
| 4-Person Families | 0 (0.0%) | $0 |
| 5-Person Families | 0 (0.0%) | $0 |
| 6-Person Families | 0 (0.0%) | $0 |
| 7+ Person Families | 0 (0.0%) | $0 |
| Total | 619 (100.0%) | $183,508 |
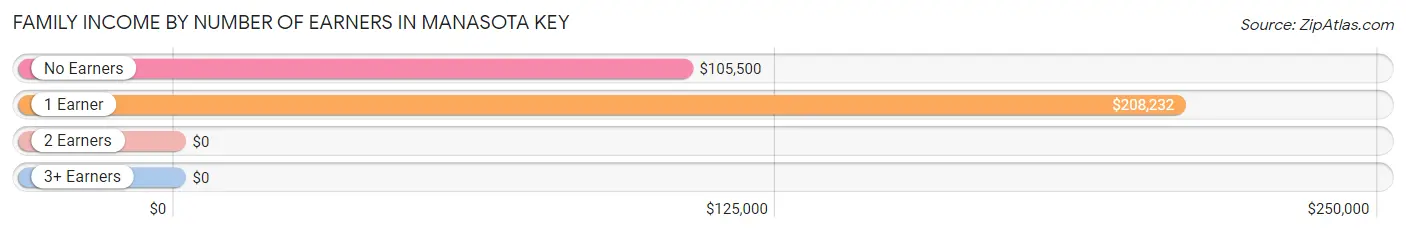
Family Income by Number of Earners in Manasota Key
| Number of Earners | # Families | Median Income |
| No Earners | 324 (52.3%) | $105,500 |
| 1 Earner | 231 (37.3%) | $208,232 |
| 2 Earners | 53 (8.6%) | $0 |
| 3+ Earners | 11 (1.8%) | $0 |
| Total | 619 (100.0%) | $183,508 |
Household Income in Manasota Key
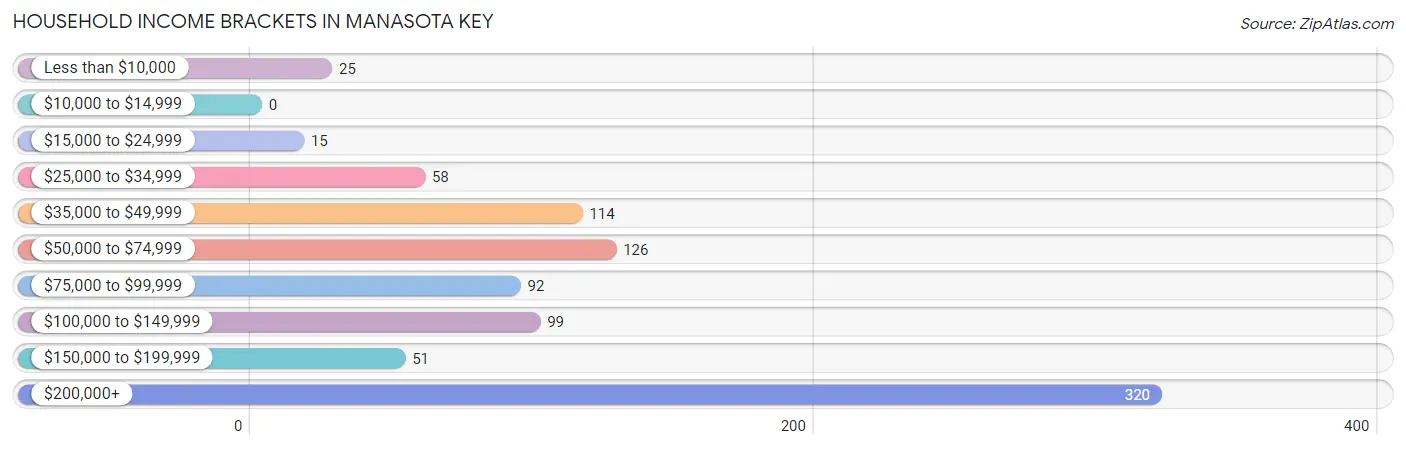
Household Income Brackets in Manasota Key
With 320 households falling in the category, the $200,000+ income range is the most frequent in Manasota Key, accounting for 35.6% of all households.
| Income Bracket | # Households | % Households |
| Less than $10,000 | 25 | 2.8% |
| $10,000 to $14,999 | 0 | 0.0% |
| $15,000 to $24,999 | 15 | 1.7% |
| $25,000 to $34,999 | 58 | 6.4% |
| $35,000 to $49,999 | 114 | 12.7% |
| $50,000 to $74,999 | 126 | 14.0% |
| $75,000 to $99,999 | 92 | 10.2% |
| $100,000 to $149,999 | 99 | 11.0% |
| $150,000 to $199,999 | 51 | 5.7% |
| $200,000+ | 320 | 35.6% |
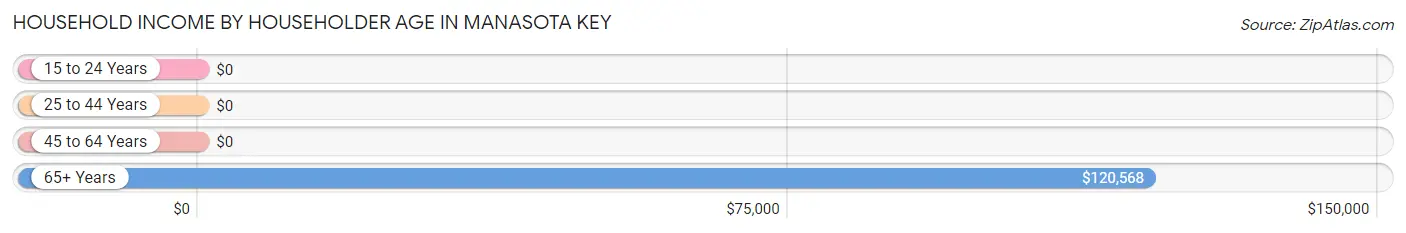
Household Income by Householder Age in Manasota Key
The median household income in Manasota Key is $111,250, with the highest median household income of $120,568 found in the 65+ years age bracket for the primary householder. A total of 609 households (67.7%) fall into this category.
| Income Bracket | # Households | Median Income |
| 15 to 24 Years | 0 (0.0%) | $0 |
| 25 to 44 Years | 11 (1.2%) | $0 |
| 45 to 64 Years | 280 (31.1%) | $0 |
| 65+ Years | 609 (67.7%) | $120,568 |
| Total | 900 (100.0%) | $111,250 |
Poverty in Manasota Key
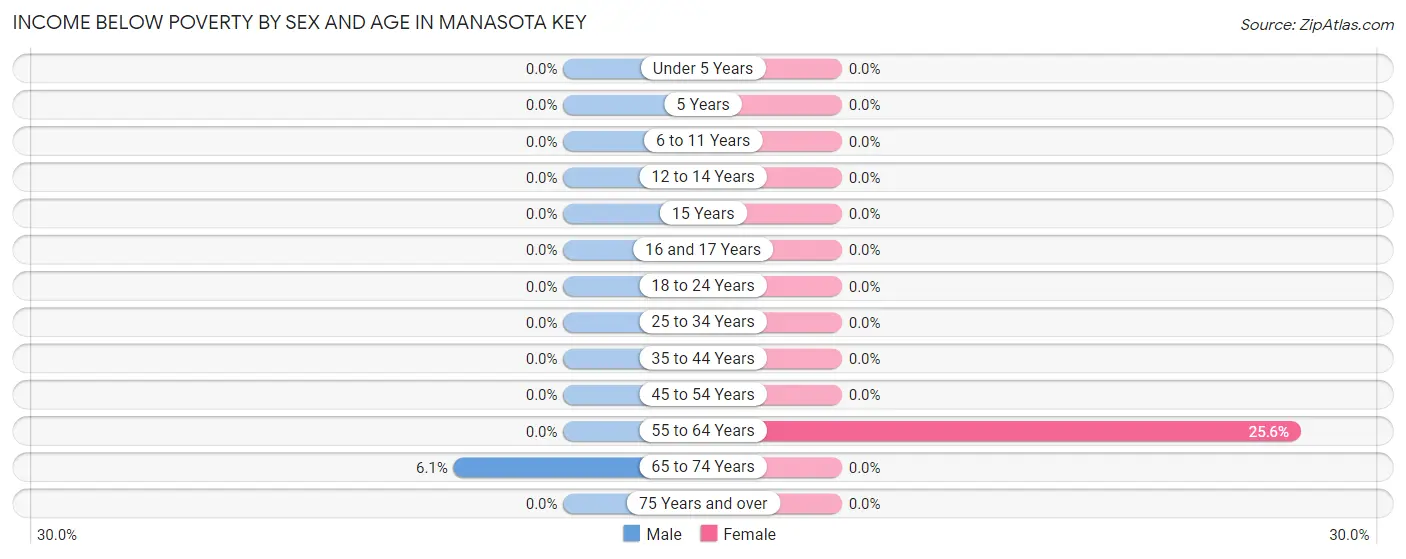
Income Below Poverty by Sex and Age in Manasota Key
With 1.0% poverty level for males and 7.4% for females among the residents of Manasota Key, 65 to 74 year old males and 55 to 64 year old females are the most vulnerable to poverty, with 8 males (6.1%) and 68 females (25.6%) in their respective age groups living below the poverty level.
| Age Bracket | Male | Female |
| Under 5 Years | 0 (0.0%) | 0 (0.0%) |
| 5 Years | 0 (0.0%) | 0 (0.0%) |
| 6 to 11 Years | 0 (0.0%) | 0 (0.0%) |
| 12 to 14 Years | 0 (0.0%) | 0 (0.0%) |
| 15 Years | 0 (0.0%) | 0 (0.0%) |
| 16 and 17 Years | 0 (0.0%) | 0 (0.0%) |
| 18 to 24 Years | 0 (0.0%) | 0 (0.0%) |
| 25 to 34 Years | 0 (0.0%) | 0 (0.0%) |
| 35 to 44 Years | 0 (0.0%) | 0 (0.0%) |
| 45 to 54 Years | 0 (0.0%) | 0 (0.0%) |
| 55 to 64 Years | 0 (0.0%) | 68 (25.6%) |
| 65 to 74 Years | 8 (6.1%) | 0 (0.0%) |
| 75 Years and over | 0 (0.0%) | 0 (0.0%) |
| Total | 8 (1.0%) | 68 (7.4%) |
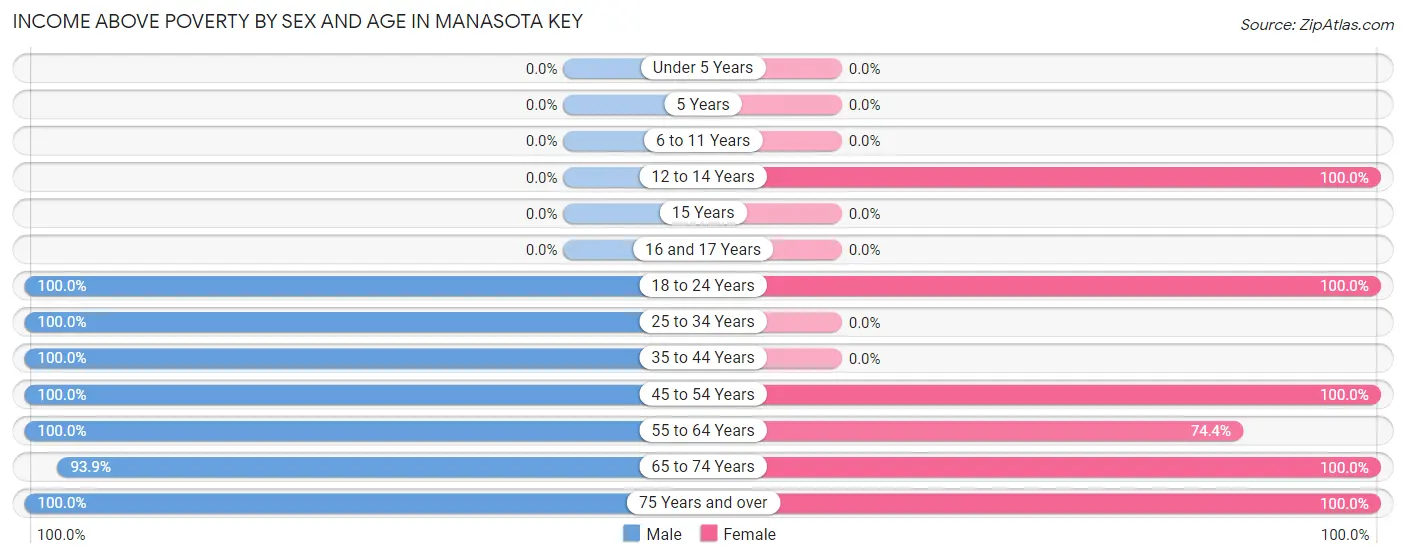
Income Above Poverty by Sex and Age in Manasota Key
According to the poverty statistics in Manasota Key, males aged 18 to 24 years and females aged 12 to 14 years are the age groups that are most secure financially, with 100.0% of males and 100.0% of females in these age groups living above the poverty line.
| Age Bracket | Male | Female |
| Under 5 Years | 0 (0.0%) | 0 (0.0%) |
| 5 Years | 0 (0.0%) | 0 (0.0%) |
| 6 to 11 Years | 0 (0.0%) | 0 (0.0%) |
| 12 to 14 Years | 0 (0.0%) | 15 (100.0%) |
| 15 Years | 0 (0.0%) | 0 (0.0%) |
| 16 and 17 Years | 0 (0.0%) | 0 (0.0%) |
| 18 to 24 Years | 14 (100.0%) | 37 (100.0%) |
| 25 to 34 Years | 11 (100.0%) | 0 (0.0%) |
| 35 to 44 Years | 72 (100.0%) | 0 (0.0%) |
| 45 to 54 Years | 32 (100.0%) | 61 (100.0%) |
| 55 to 64 Years | 125 (100.0%) | 198 (74.4%) |
| 65 to 74 Years | 123 (93.9%) | 334 (100.0%) |
| 75 Years and over | 419 (100.0%) | 201 (100.0%) |
| Total | 796 (99.0%) | 846 (92.6%) |
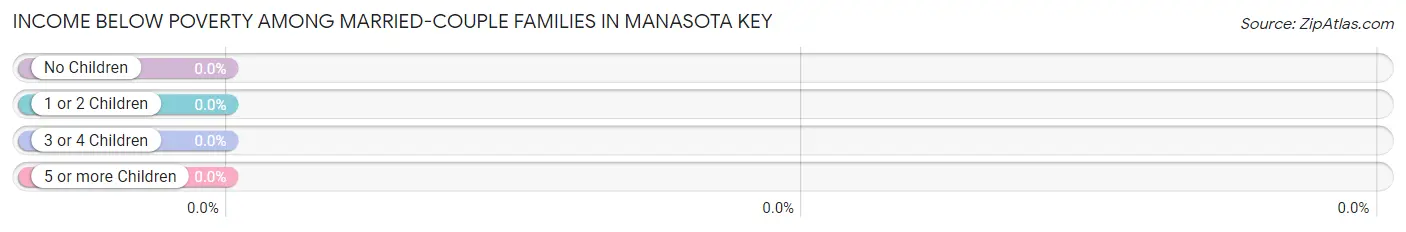
Income Below Poverty Among Married-Couple Families in Manasota Key
| Children | Above Poverty | Below Poverty |
| No Children | 577 (100.0%) | 0 (0.0%) |
| 1 or 2 Children | 14 (100.0%) | 0 (0.0%) |
| 3 or 4 Children | 0 (0.0%) | 0 (0.0%) |
| 5 or more Children | 0 (0.0%) | 0 (0.0%) |
| Total | 591 (100.0%) | 0 (0.0%) |
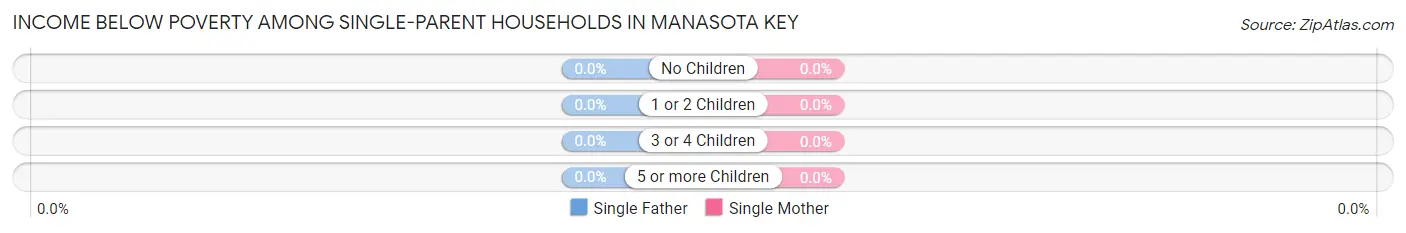
Income Below Poverty Among Single-Parent Households in Manasota Key
| Children | Single Father | Single Mother |
| No Children | 0 (0.0%) | 0 (0.0%) |
| 1 or 2 Children | 0 (0.0%) | 0 (0.0%) |
| 3 or 4 Children | 0 (0.0%) | 0 (0.0%) |
| 5 or more Children | 0 (0.0%) | 0 (0.0%) |
| Total | 0 (0.0%) | 0 (0.0%) |
Income Below Poverty Among Married-Couple vs Single-Parent Households in Manasota Key
| Children | Married-Couple Families | Single-Parent Households |
| No Children | 0 (0.0%) | 0 (0.0%) |
| 1 or 2 Children | 0 (0.0%) | 0 (0.0%) |
| 3 or 4 Children | 0 (0.0%) | 0 (0.0%) |
| 5 or more Children | 0 (0.0%) | 0 (0.0%) |
| Total | 0 (0.0%) | 0 (0.0%) |
Employment Characteristics in Manasota Key
Employment by Class of Employer in Manasota Key
Among the 464 employed individuals in Manasota Key, private company employees (350 | 75.4%), self-employed (incorporated) (54 | 11.6%), and local government employees (28 | 6.0%) make up the most common classes of employment.
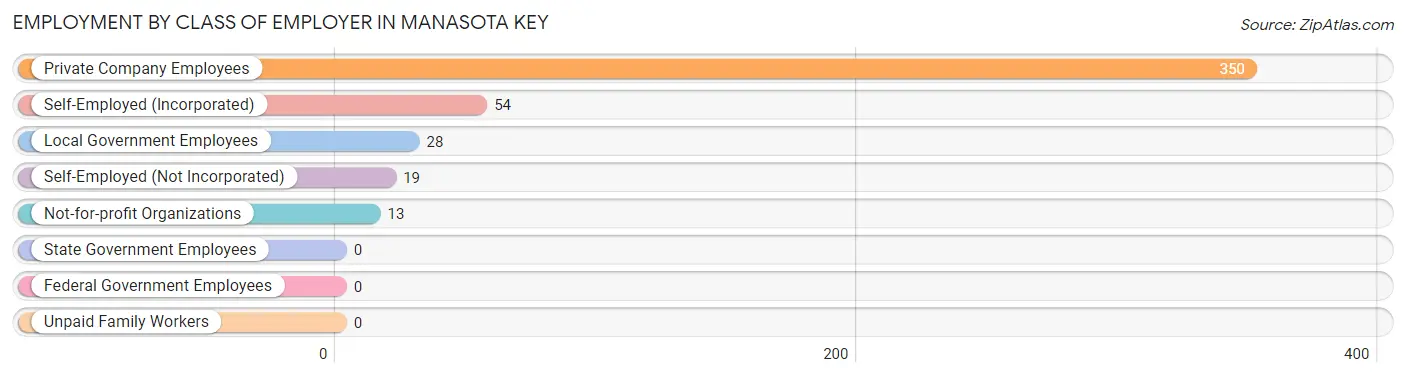
| Employer Class | # Employees | % Employees |
| Private Company Employees | 350 | 75.4% |
| Self-Employed (Incorporated) | 54 | 11.6% |
| Self-Employed (Not Incorporated) | 19 | 4.1% |
| Not-for-profit Organizations | 13 | 2.8% |
| Local Government Employees | 28 | 6.0% |
| State Government Employees | 0 | 0.0% |
| Federal Government Employees | 0 | 0.0% |
| Unpaid Family Workers | 0 | 0.0% |
| Total | 464 | 100.0% |
Employment Status by Age in Manasota Key
According to the labor force statistics for Manasota Key, out of the total population over 16 years of age (1,703), 29.1% or 496 individuals are in the labor force, with 6.3% or 31 of them unemployed. The age group with the highest labor force participation rate is 30 to 34 years, with 100.0% or 11 individuals in the labor force. Within the labor force, the 60 to 64 years age range has the highest percentage of unemployed individuals, with 63.9% or 23 of them being unemployed.
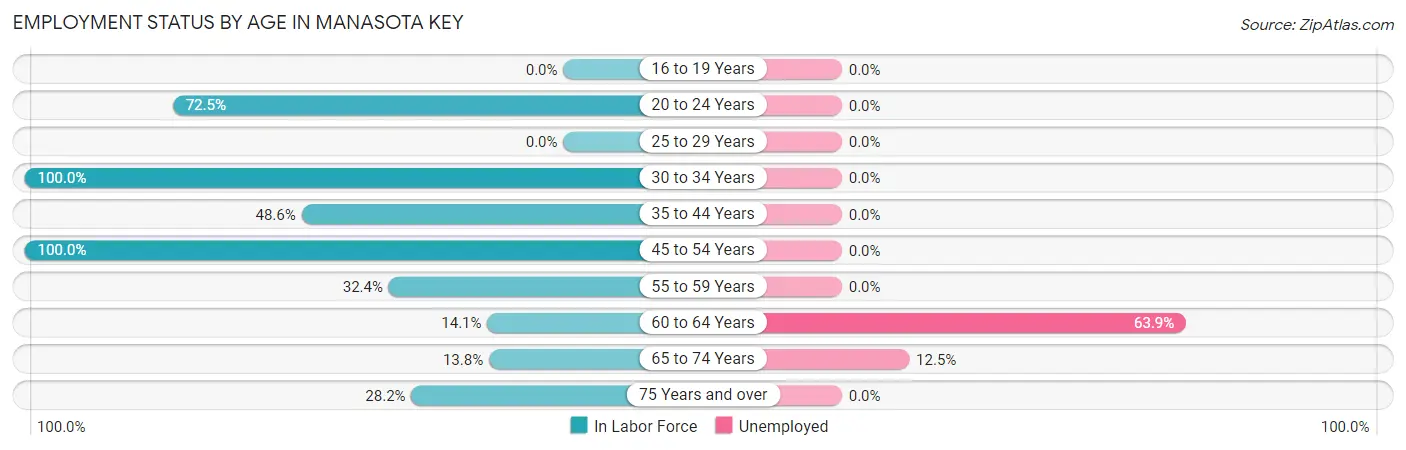
| Age Bracket | In Labor Force | Unemployed |
| 16 to 19 Years | 0 (0.0%) | 0 (0.0%) |
| 20 to 24 Years | 37 (72.5%) | 0 (0.0%) |
| 25 to 29 Years | 0 (0.0%) | 0 (0.0%) |
| 30 to 34 Years | 11 (100.0%) | 0 (0.0%) |
| 35 to 44 Years | 35 (48.6%) | 0 (0.0%) |
| 45 to 54 Years | 93 (100.0%) | 0 (0.0%) |
| 55 to 59 Years | 44 (32.4%) | 0 (0.0%) |
| 60 to 64 Years | 36 (14.1%) | 23 (63.9%) |
| 65 to 74 Years | 64 (13.8%) | 8 (12.5%) |
| 75 Years and over | 175 (28.2%) | 0 (0.0%) |
| Total | 496 (29.1%) | 31 (6.3%) |
Employment Status by Educational Attainment in Manasota Key
According to labor force statistics for Manasota Key, 38.6% of individuals (219) out of the total population between 25 and 64 years of age (567) are in the labor force, with 10.5% or 23 of them being unemployed. The group with the highest labor force participation rate are those with the educational attainment of college / associate degree, with 84.1% or 95 individuals in the labor force. Within the labor force, individuals with high school diploma education have the highest percentage of unemployment, with 43.4% or 23 of them being unemployed.
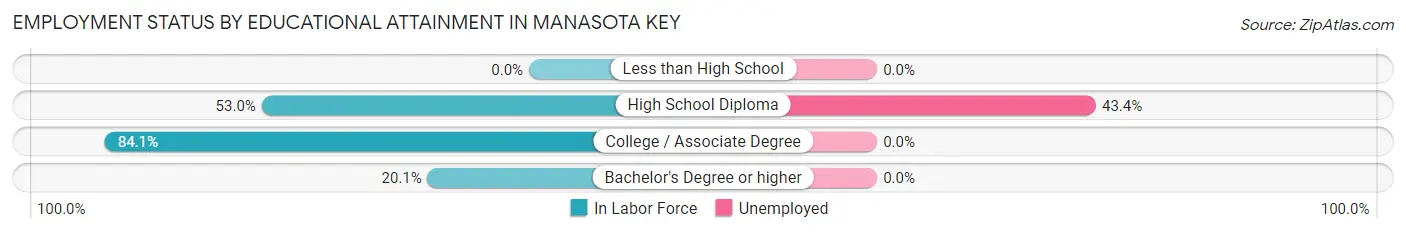
| Educational Attainment | In Labor Force | Unemployed |
| Less than High School | 0 (0.0%) | 0 (0.0%) |
| High School Diploma | 53 (53.0%) | 43 (43.4%) |
| College / Associate Degree | 95 (84.1%) | 0 (0.0%) |
| Bachelor's Degree or higher | 71 (20.1%) | 0 (0.0%) |
| Total | 219 (38.6%) | 60 (10.5%) |
Employment Occupations by Sex in Manasota Key
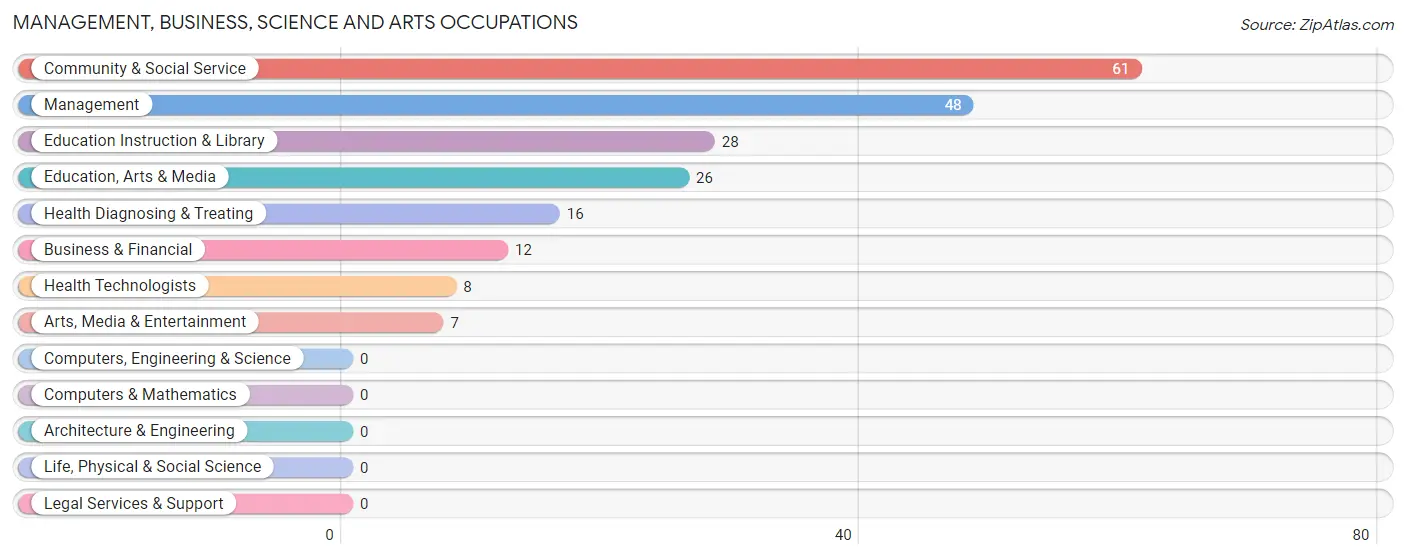
Management, Business, Science and Arts Occupations
The most common Management, Business, Science and Arts occupations in Manasota Key are Community & Social Service (61 | 13.2%), Management (48 | 10.3%), Education Instruction & Library (28 | 6.0%), Education, Arts & Media (26 | 5.6%), and Health Diagnosing & Treating (16 | 3.5%).
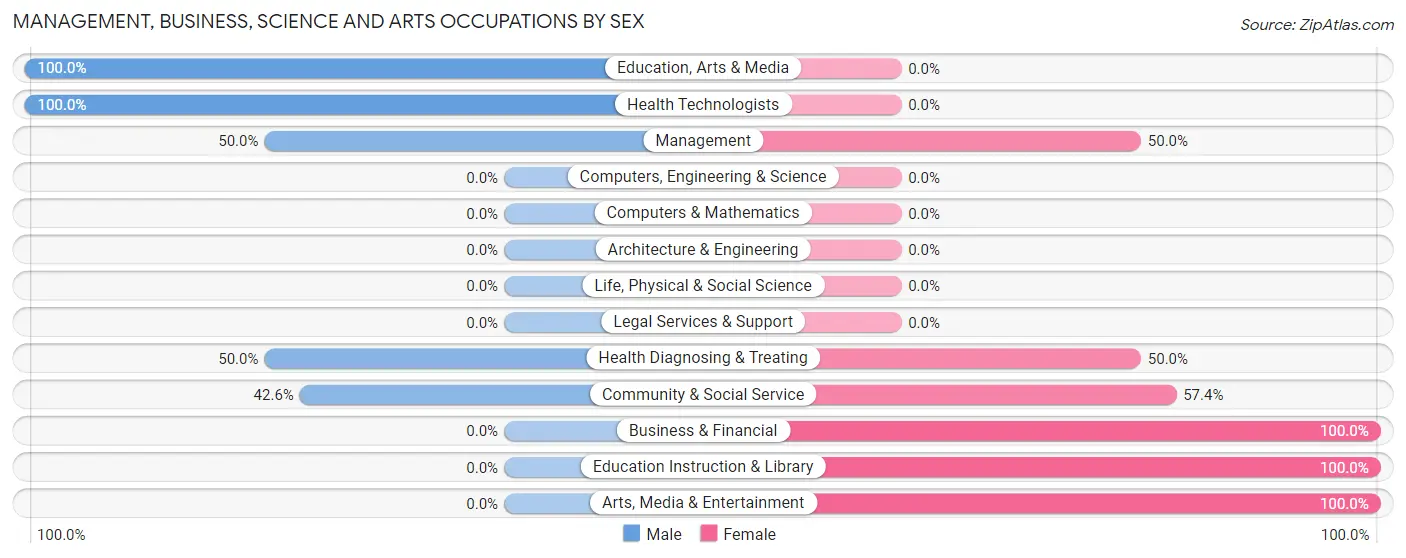
Management, Business, Science and Arts Occupations by Sex
Within the Management, Business, Science and Arts occupations in Manasota Key, the most male-oriented occupations are Education, Arts & Media (100.0%), Health Technologists (100.0%), and Management (50.0%), while the most female-oriented occupations are Business & Financial (100.0%), Education Instruction & Library (100.0%), and Arts, Media & Entertainment (100.0%).
| Occupation | Male | Female |
| Management | 24 (50.0%) | 24 (50.0%) |
| Business & Financial | 0 (0.0%) | 12 (100.0%) |
| Computers, Engineering & Science | 0 (0.0%) | 0 (0.0%) |
| Computers & Mathematics | 0 (0.0%) | 0 (0.0%) |
| Architecture & Engineering | 0 (0.0%) | 0 (0.0%) |
| Life, Physical & Social Science | 0 (0.0%) | 0 (0.0%) |
| Community & Social Service | 26 (42.6%) | 35 (57.4%) |
| Education, Arts & Media | 26 (100.0%) | 0 (0.0%) |
| Legal Services & Support | 0 (0.0%) | 0 (0.0%) |
| Education Instruction & Library | 0 (0.0%) | 28 (100.0%) |
| Arts, Media & Entertainment | 0 (0.0%) | 7 (100.0%) |
| Health Diagnosing & Treating | 8 (50.0%) | 8 (50.0%) |
| Health Technologists | 8 (100.0%) | 0 (0.0%) |
| Total (Category) | 58 (42.3%) | 79 (57.7%) |
| Total (Overall) | 266 (57.3%) | 198 (42.7%) |
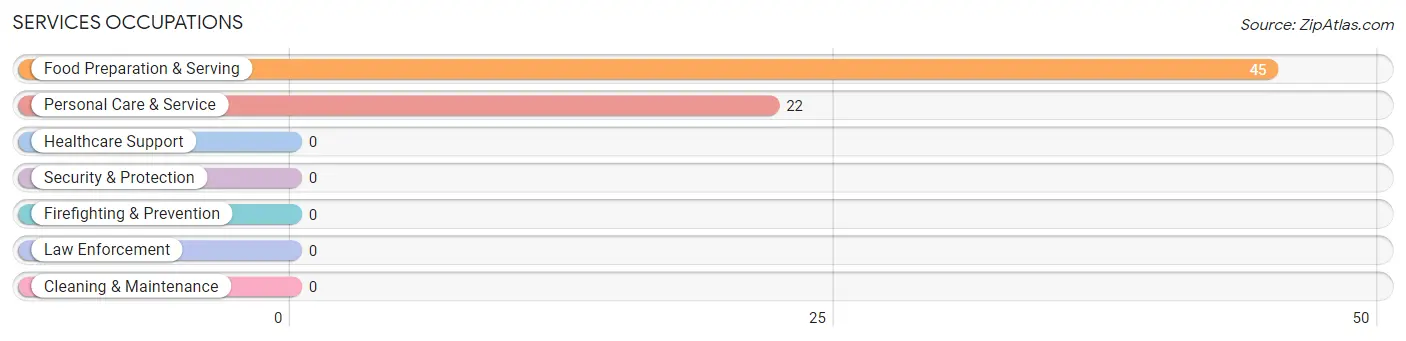
Services Occupations
The most common Services occupations in Manasota Key are Food Preparation & Serving (45 | 9.7%), and Personal Care & Service (22 | 4.7%).
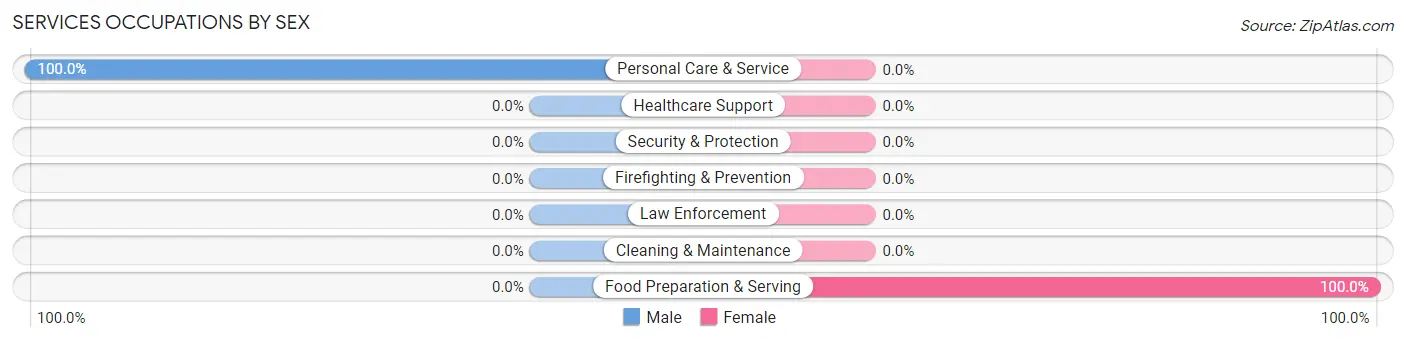
Services Occupations by Sex
| Occupation | Male | Female |
| Healthcare Support | 0 (0.0%) | 0 (0.0%) |
| Security & Protection | 0 (0.0%) | 0 (0.0%) |
| Firefighting & Prevention | 0 (0.0%) | 0 (0.0%) |
| Law Enforcement | 0 (0.0%) | 0 (0.0%) |
| Food Preparation & Serving | 0 (0.0%) | 45 (100.0%) |
| Cleaning & Maintenance | 0 (0.0%) | 0 (0.0%) |
| Personal Care & Service | 22 (100.0%) | 0 (0.0%) |
| Total (Category) | 22 (32.8%) | 45 (67.2%) |
| Total (Overall) | 266 (57.3%) | 198 (42.7%) |
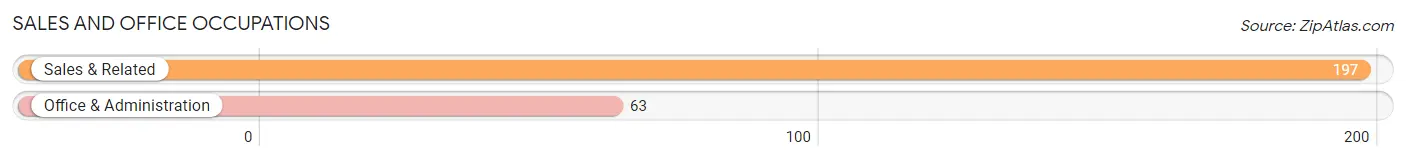
Sales and Office Occupations
The most common Sales and Office occupations in Manasota Key are Sales & Related (197 | 42.5%), and Office & Administration (63 | 13.6%).
Sales and Office Occupations by Sex
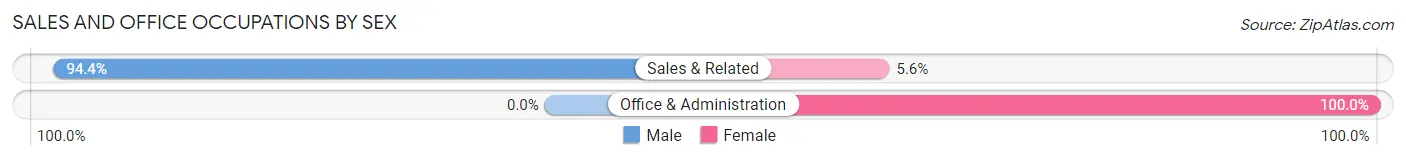
| Occupation | Male | Female |
| Sales & Related | 186 (94.4%) | 11 (5.6%) |
| Office & Administration | 0 (0.0%) | 63 (100.0%) |
| Total (Category) | 186 (71.5%) | 74 (28.5%) |
| Total (Overall) | 266 (57.3%) | 198 (42.7%) |
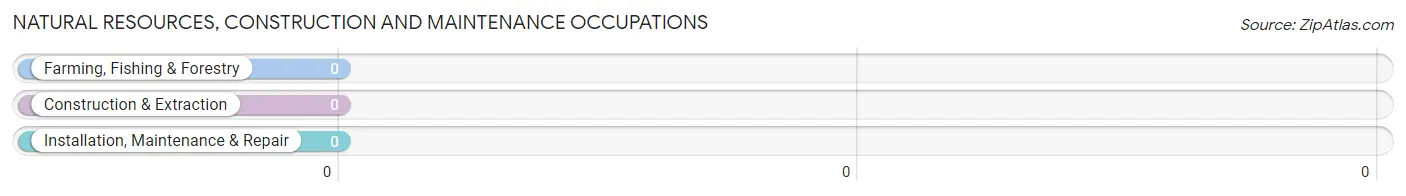
Natural Resources, Construction and Maintenance Occupations
Natural Resources, Construction and Maintenance Occupations by Sex
| Occupation | Male | Female |
| Farming, Fishing & Forestry | 0 (0.0%) | 0 (0.0%) |
| Construction & Extraction | 0 (0.0%) | 0 (0.0%) |
| Installation, Maintenance & Repair | 0 (0.0%) | 0 (0.0%) |
| Total (Category) | 0 (0.0%) | 0 (0.0%) |
| Total (Overall) | 266 (57.3%) | 198 (42.7%) |
Production, Transportation and Moving Occupations
Production, Transportation and Moving Occupations by Sex
| Occupation | Male | Female |
| Production | 0 (0.0%) | 0 (0.0%) |
| Transportation | 0 (0.0%) | 0 (0.0%) |
| Material Moving | 0 (0.0%) | 0 (0.0%) |
| Total (Category) | 0 (0.0%) | 0 (0.0%) |
| Total (Overall) | 266 (57.3%) | 198 (42.7%) |
Employment Industries by Sex in Manasota Key
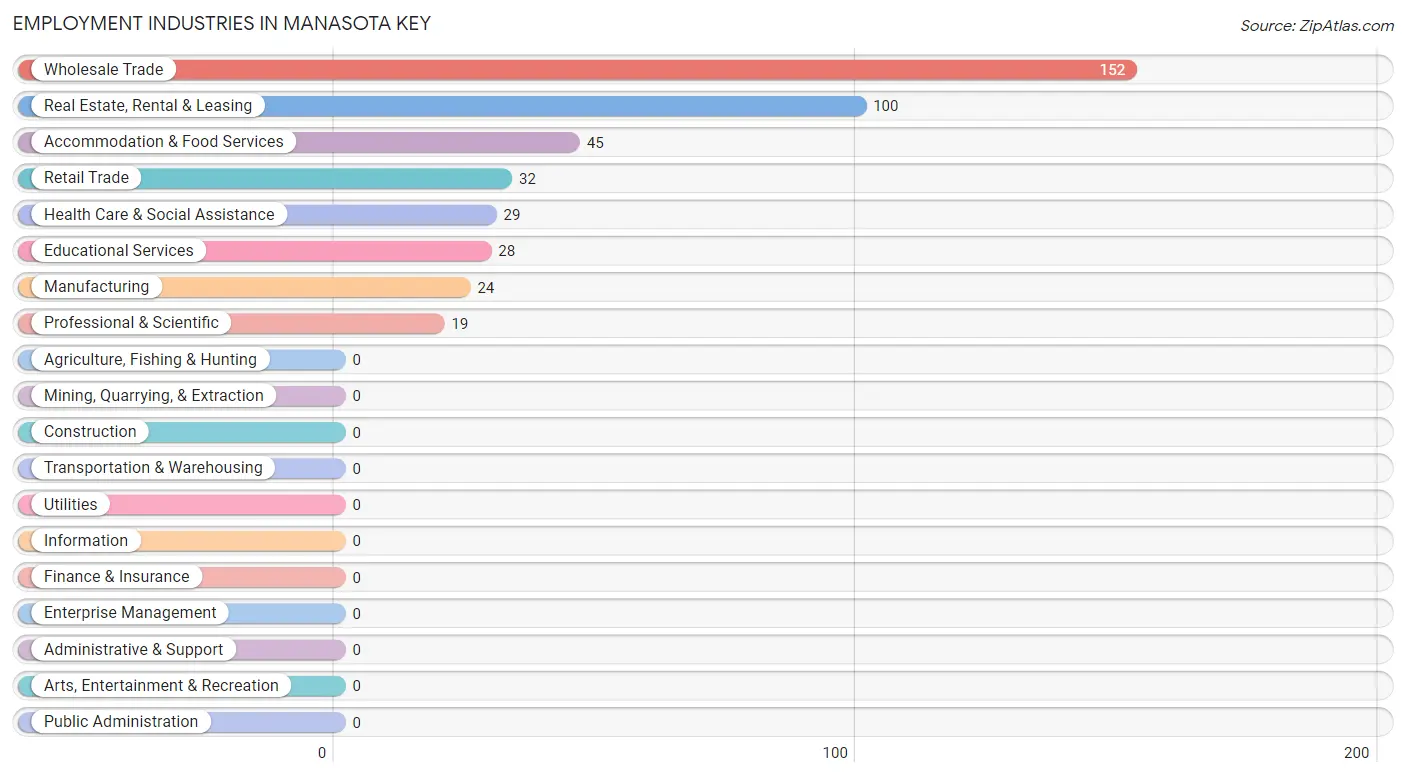
Employment Industries in Manasota Key
The major employment industries in Manasota Key include Wholesale Trade (152 | 32.8%), Real Estate, Rental & Leasing (100 | 21.5%), Accommodation & Food Services (45 | 9.7%), Retail Trade (32 | 6.9%), and Health Care & Social Assistance (29 | 6.2%).
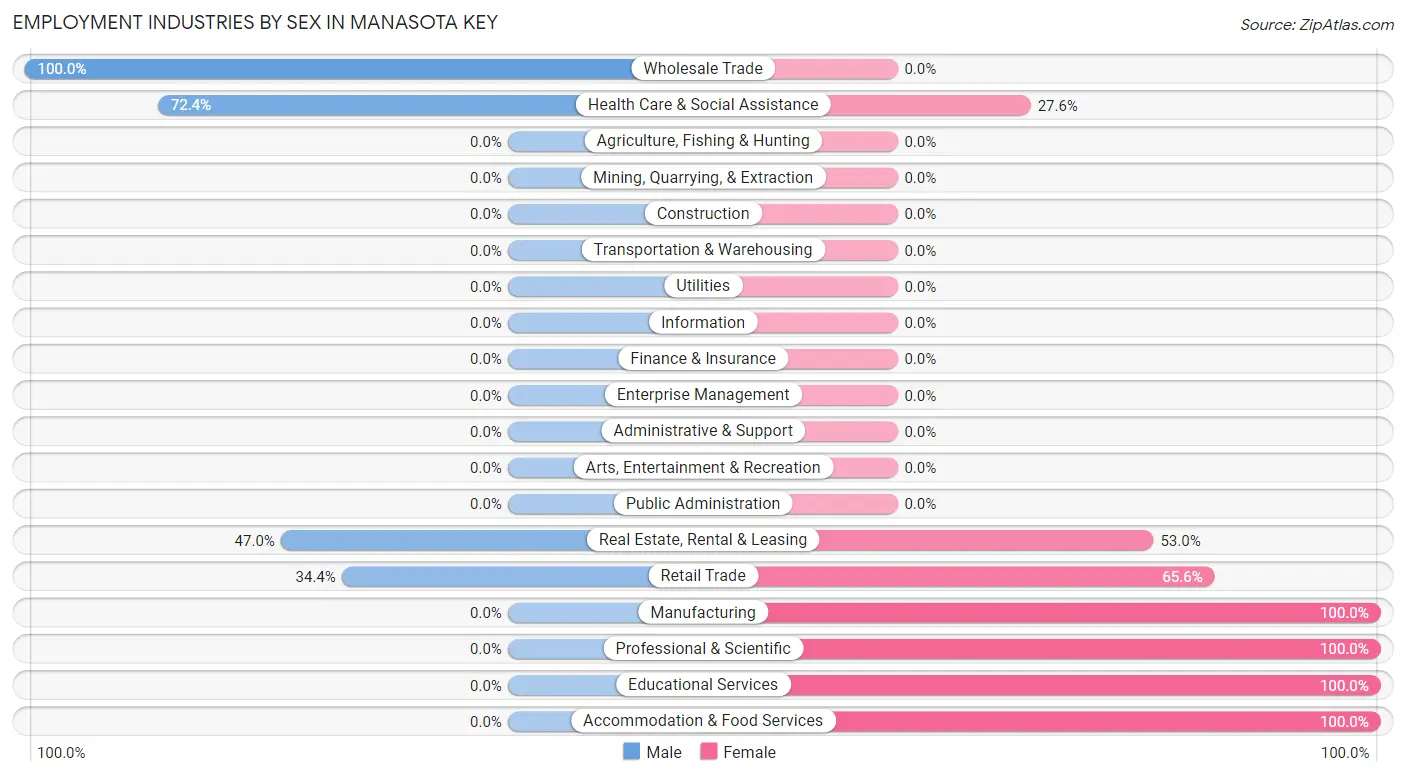
Employment Industries by Sex in Manasota Key
The Manasota Key industries that see more men than women are Wholesale Trade (100.0%), Health Care & Social Assistance (72.4%), and Real Estate, Rental & Leasing (47.0%), whereas the industries that tend to have a higher number of women are Manufacturing (100.0%), Professional & Scientific (100.0%), and Educational Services (100.0%).
| Industry | Male | Female |
| Agriculture, Fishing & Hunting | 0 (0.0%) | 0 (0.0%) |
| Mining, Quarrying, & Extraction | 0 (0.0%) | 0 (0.0%) |
| Construction | 0 (0.0%) | 0 (0.0%) |
| Manufacturing | 0 (0.0%) | 24 (100.0%) |
| Wholesale Trade | 152 (100.0%) | 0 (0.0%) |
| Retail Trade | 11 (34.4%) | 21 (65.6%) |
| Transportation & Warehousing | 0 (0.0%) | 0 (0.0%) |
| Utilities | 0 (0.0%) | 0 (0.0%) |
| Information | 0 (0.0%) | 0 (0.0%) |
| Finance & Insurance | 0 (0.0%) | 0 (0.0%) |
| Real Estate, Rental & Leasing | 47 (47.0%) | 53 (53.0%) |
| Professional & Scientific | 0 (0.0%) | 19 (100.0%) |
| Enterprise Management | 0 (0.0%) | 0 (0.0%) |
| Administrative & Support | 0 (0.0%) | 0 (0.0%) |
| Educational Services | 0 (0.0%) | 28 (100.0%) |
| Health Care & Social Assistance | 21 (72.4%) | 8 (27.6%) |
| Arts, Entertainment & Recreation | 0 (0.0%) | 0 (0.0%) |
| Accommodation & Food Services | 0 (0.0%) | 45 (100.0%) |
| Public Administration | 0 (0.0%) | 0 (0.0%) |
| Total | 266 (57.3%) | 198 (42.7%) |
Education in Manasota Key
School Enrollment in Manasota Key
The most common levels of schooling among the 47 students in Manasota Key are college / undergraduate (24 | 51.1%), middle school (15 | 31.9%), and high school (8 | 17.0%).
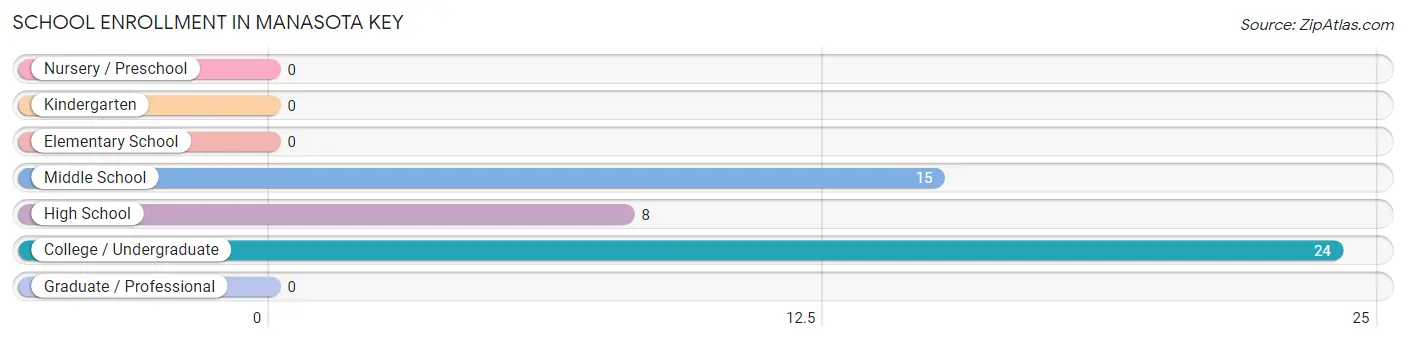
| School Level | # Students | % Students |
| Nursery / Preschool | 0 | 0.0% |
| Kindergarten | 0 | 0.0% |
| Elementary School | 0 | 0.0% |
| Middle School | 15 | 31.9% |
| High School | 8 | 17.0% |
| College / Undergraduate | 24 | 51.1% |
| Graduate / Professional | 0 | 0.0% |
| Total | 47 | 100.0% |
School Enrollment by Age by Funding Source in Manasota Key
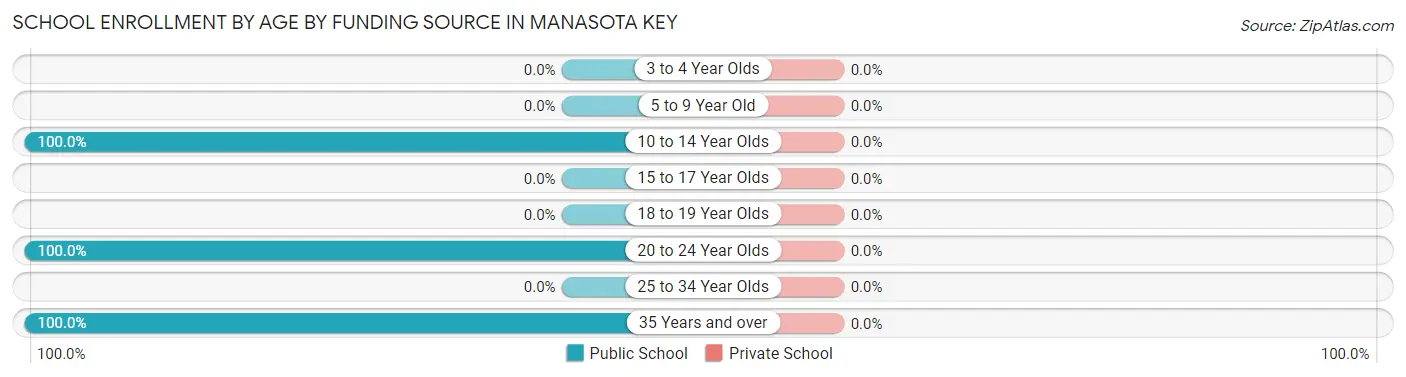
| Age Bracket | Public School | Private School |
| 3 to 4 Year Olds | 0 (0.0%) | 0 (0.0%) |
| 5 to 9 Year Old | 0 (0.0%) | 0 (0.0%) |
| 10 to 14 Year Olds | 15 (100.0%) | 0 (0.0%) |
| 15 to 17 Year Olds | 0 (0.0%) | 0 (0.0%) |
| 18 to 19 Year Olds | 0 (0.0%) | 0 (0.0%) |
| 20 to 24 Year Olds | 14 (100.0%) | 0 (0.0%) |
| 25 to 34 Year Olds | 0 (0.0%) | 0 (0.0%) |
| 35 Years and over | 18 (100.0%) | 0 (0.0%) |
| Total | 47 (100.0%) | 0 (0.0%) |
Educational Attainment by Field of Study in Manasota Key
Education (173 | 21.7%), business (166 | 20.8%), engineering (86 | 10.8%), science & technology (83 | 10.4%), and arts & humanities (58 | 7.3%) are the most common fields of study among 798 individuals in Manasota Key who have obtained a bachelor's degree or higher.
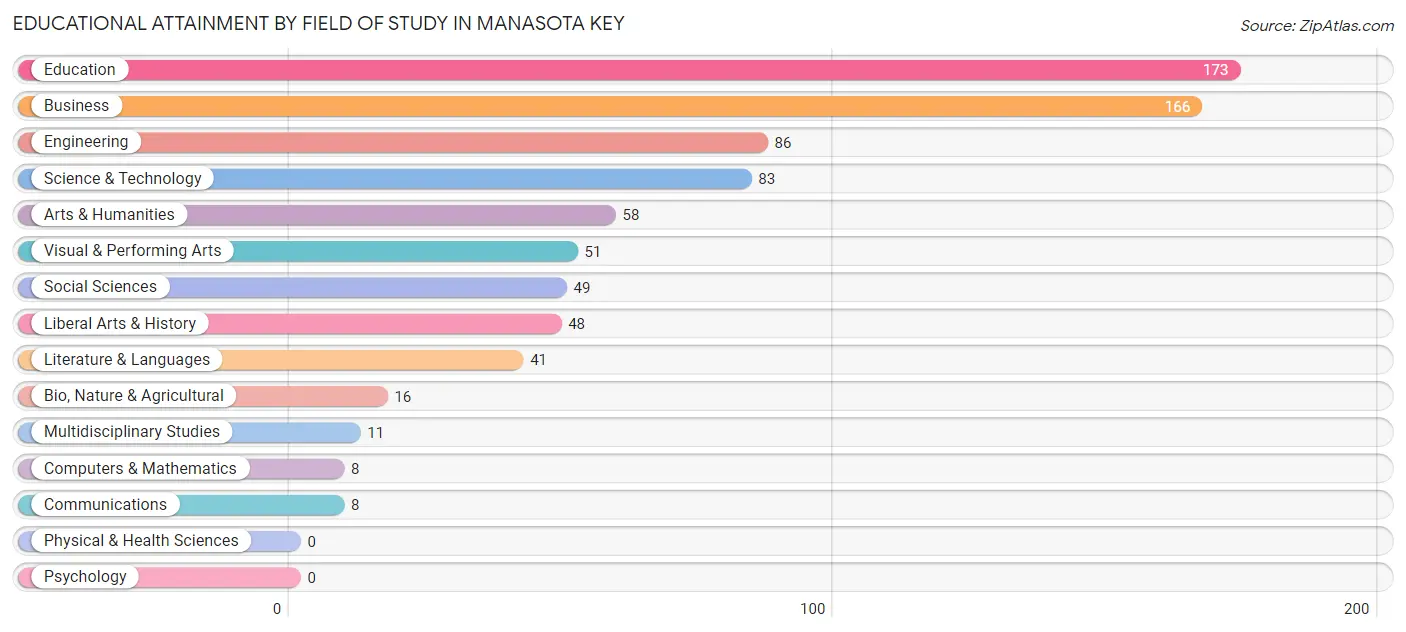
| Field of Study | # Graduates | % Graduates |
| Computers & Mathematics | 8 | 1.0% |
| Bio, Nature & Agricultural | 16 | 2.0% |
| Physical & Health Sciences | 0 | 0.0% |
| Psychology | 0 | 0.0% |
| Social Sciences | 49 | 6.1% |
| Engineering | 86 | 10.8% |
| Multidisciplinary Studies | 11 | 1.4% |
| Science & Technology | 83 | 10.4% |
| Business | 166 | 20.8% |
| Education | 173 | 21.7% |
| Literature & Languages | 41 | 5.1% |
| Liberal Arts & History | 48 | 6.0% |
| Visual & Performing Arts | 51 | 6.4% |
| Communications | 8 | 1.0% |
| Arts & Humanities | 58 | 7.3% |
| Total | 798 | 100.0% |
Transportation & Commute in Manasota Key
Vehicle Availability by Sex in Manasota Key
The most prevalent vehicle ownership categories in Manasota Key are males with 2 vehicles (209, accounting for 78.6%) and females with 2 vehicles (82, making up 105.6%).
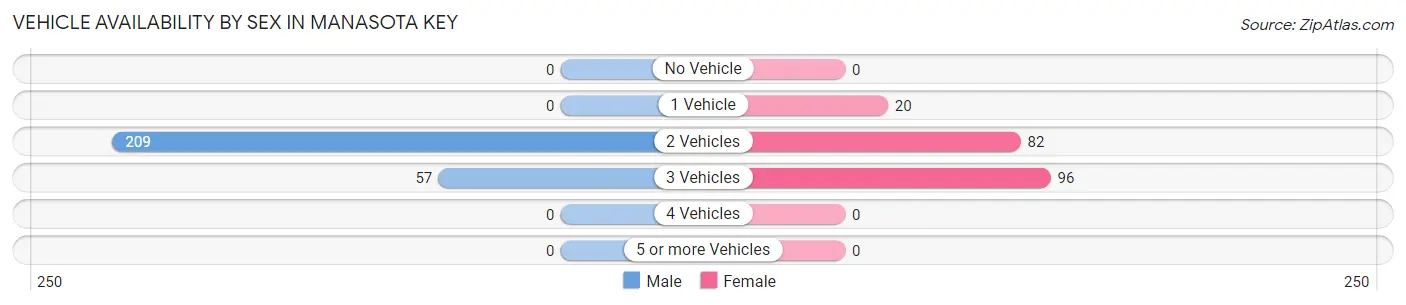
| Vehicles Available | Male | Female |
| No Vehicle | 0 (0.0%) | 0 (0.0%) |
| 1 Vehicle | 0 (0.0%) | 20 (10.1%) |
| 2 Vehicles | 209 (78.6%) | 82 (41.4%) |
| 3 Vehicles | 57 (21.4%) | 96 (48.5%) |
| 4 Vehicles | 0 (0.0%) | 0 (0.0%) |
| 5 or more Vehicles | 0 (0.0%) | 0 (0.0%) |
| Total | 266 (100.0%) | 198 (100.0%) |
Commute Time in Manasota Key
The most frequently occuring commute durations in Manasota Key are 5 to 9 minutes (60 commuters, 23.9%), 15 to 19 minutes (48 commuters, 19.1%), and 10 to 14 minutes (39 commuters, 15.5%).
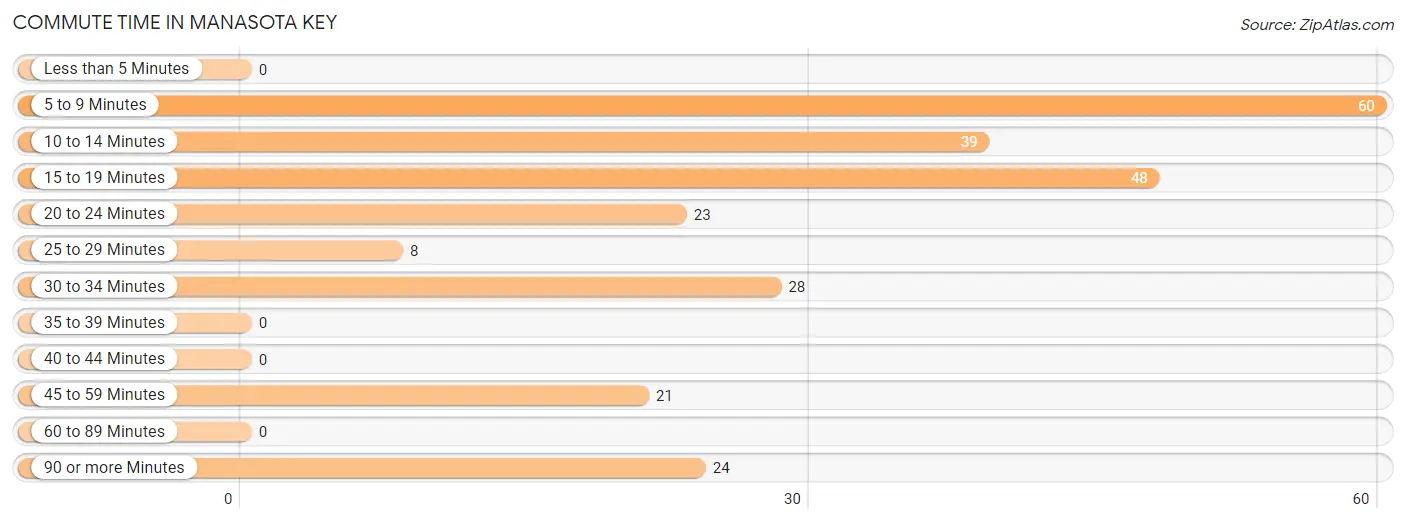
| Commute Time | # Commuters | % Commuters |
| Less than 5 Minutes | 0 | 0.0% |
| 5 to 9 Minutes | 60 | 23.9% |
| 10 to 14 Minutes | 39 | 15.5% |
| 15 to 19 Minutes | 48 | 19.1% |
| 20 to 24 Minutes | 23 | 9.2% |
| 25 to 29 Minutes | 8 | 3.2% |
| 30 to 34 Minutes | 28 | 11.2% |
| 35 to 39 Minutes | 0 | 0.0% |
| 40 to 44 Minutes | 0 | 0.0% |
| 45 to 59 Minutes | 21 | 8.4% |
| 60 to 89 Minutes | 0 | 0.0% |
| 90 or more Minutes | 24 | 9.6% |
Commute Time by Sex in Manasota Key
The most common commute times in Manasota Key are 5 to 9 minutes (60 commuters, 58.3%) for males and 10 to 14 minutes (39 commuters, 26.4%) for females.
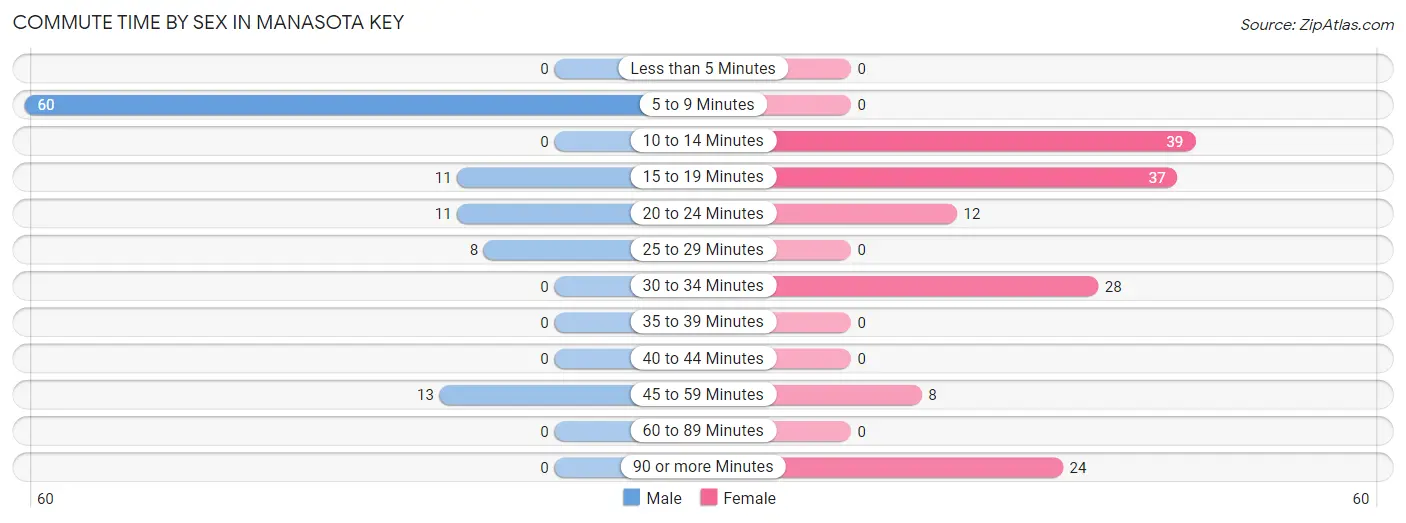
| Commute Time | Male | Female |
| Less than 5 Minutes | 0 (0.0%) | 0 (0.0%) |
| 5 to 9 Minutes | 60 (58.3%) | 0 (0.0%) |
| 10 to 14 Minutes | 0 (0.0%) | 39 (26.4%) |
| 15 to 19 Minutes | 11 (10.7%) | 37 (25.0%) |
| 20 to 24 Minutes | 11 (10.7%) | 12 (8.1%) |
| 25 to 29 Minutes | 8 (7.8%) | 0 (0.0%) |
| 30 to 34 Minutes | 0 (0.0%) | 28 (18.9%) |
| 35 to 39 Minutes | 0 (0.0%) | 0 (0.0%) |
| 40 to 44 Minutes | 0 (0.0%) | 0 (0.0%) |
| 45 to 59 Minutes | 13 (12.6%) | 8 (5.4%) |
| 60 to 89 Minutes | 0 (0.0%) | 0 (0.0%) |
| 90 or more Minutes | 0 (0.0%) | 24 (16.2%) |
Time of Departure to Work by Sex in Manasota Key
The most frequent times of departure to work in Manasota Key are 7:30 AM to 7:59 AM (37, 35.9%) for males and 7:00 AM to 7:29 AM (40, 27.0%) for females.
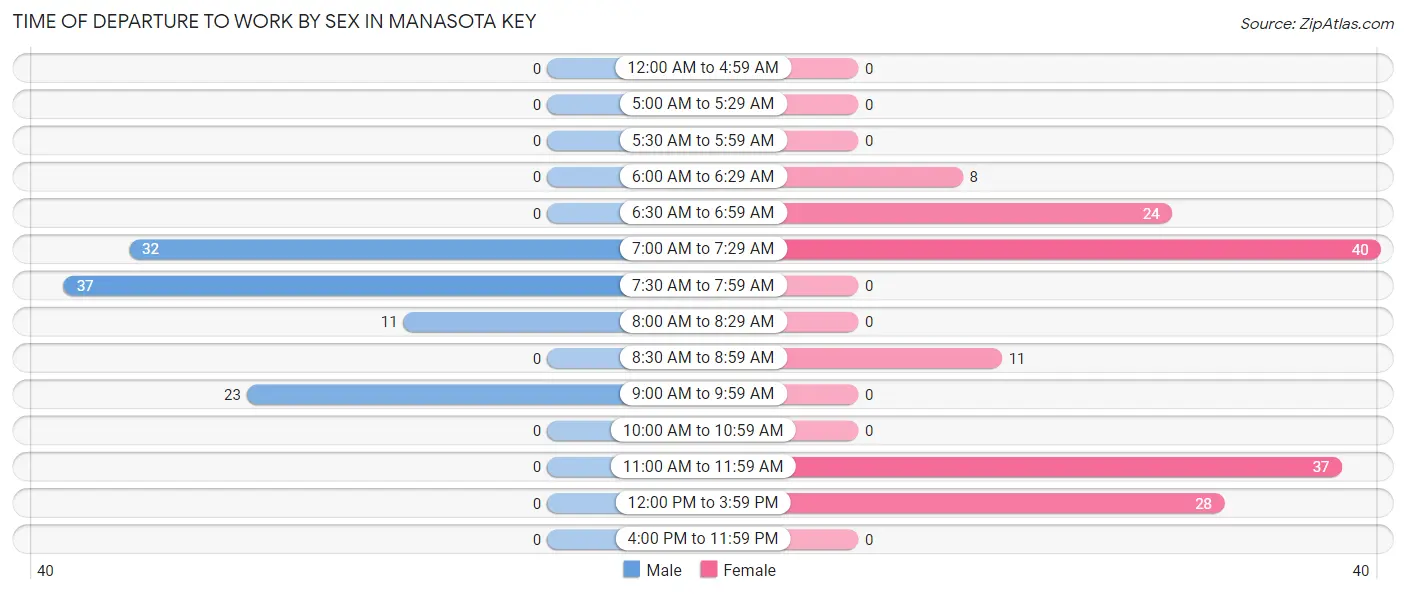
| Time of Departure | Male | Female |
| 12:00 AM to 4:59 AM | 0 (0.0%) | 0 (0.0%) |
| 5:00 AM to 5:29 AM | 0 (0.0%) | 0 (0.0%) |
| 5:30 AM to 5:59 AM | 0 (0.0%) | 0 (0.0%) |
| 6:00 AM to 6:29 AM | 0 (0.0%) | 8 (5.4%) |
| 6:30 AM to 6:59 AM | 0 (0.0%) | 24 (16.2%) |
| 7:00 AM to 7:29 AM | 32 (31.1%) | 40 (27.0%) |
| 7:30 AM to 7:59 AM | 37 (35.9%) | 0 (0.0%) |
| 8:00 AM to 8:29 AM | 11 (10.7%) | 0 (0.0%) |
| 8:30 AM to 8:59 AM | 0 (0.0%) | 11 (7.4%) |
| 9:00 AM to 9:59 AM | 23 (22.3%) | 0 (0.0%) |
| 10:00 AM to 10:59 AM | 0 (0.0%) | 0 (0.0%) |
| 11:00 AM to 11:59 AM | 0 (0.0%) | 37 (25.0%) |
| 12:00 PM to 3:59 PM | 0 (0.0%) | 28 (18.9%) |
| 4:00 PM to 11:59 PM | 0 (0.0%) | 0 (0.0%) |
| Total | 103 (100.0%) | 148 (100.0%) |
Housing Occupancy in Manasota Key
Occupancy by Ownership in Manasota Key
Of the total 900 dwellings in Manasota Key, owner-occupied units account for 815 (90.6%), while renter-occupied units make up 85 (9.4%).
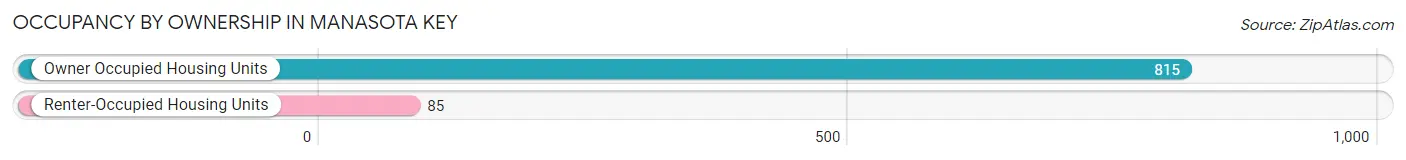
| Occupancy | # Housing Units | % Housing Units |
| Owner Occupied Housing Units | 815 | 90.6% |
| Renter-Occupied Housing Units | 85 | 9.4% |
| Total Occupied Housing Units | 900 | 100.0% |
Occupancy by Household Size in Manasota Key
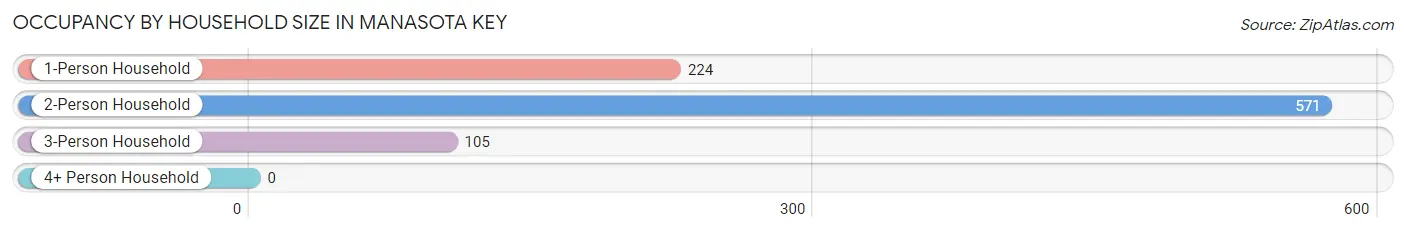
| Household Size | # Housing Units | % Housing Units |
| 1-Person Household | 224 | 24.9% |
| 2-Person Household | 571 | 63.4% |
| 3-Person Household | 105 | 11.7% |
| 4+ Person Household | 0 | 0.0% |
| Total Housing Units | 900 | 100.0% |
Occupancy by Ownership by Household Size in Manasota Key
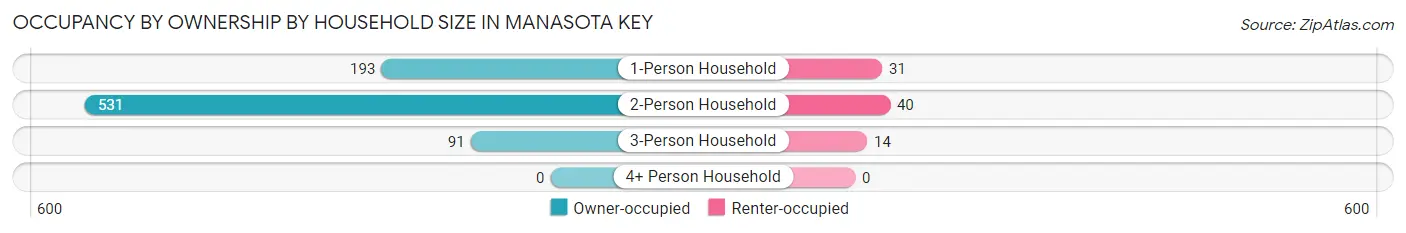
| Household Size | Owner-occupied | Renter-occupied |
| 1-Person Household | 193 (86.2%) | 31 (13.8%) |
| 2-Person Household | 531 (93.0%) | 40 (7.0%) |
| 3-Person Household | 91 (86.7%) | 14 (13.3%) |
| 4+ Person Household | 0 (0.0%) | 0 (0.0%) |
| Total Housing Units | 815 (90.6%) | 85 (9.4%) |
Occupancy by Educational Attainment in Manasota Key
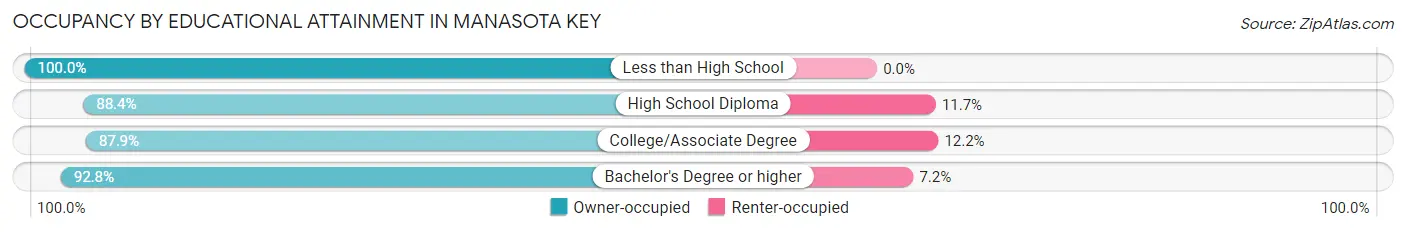
| Household Size | Owner-occupied | Renter-occupied |
| Less than High School | 8 (100.0%) | 0 (0.0%) |
| High School Diploma | 235 (88.3%) | 31 (11.7%) |
| College/Associate Degree | 159 (87.8%) | 22 (12.1%) |
| Bachelor's Degree or higher | 413 (92.8%) | 32 (7.2%) |
Occupancy by Age of Householder in Manasota Key
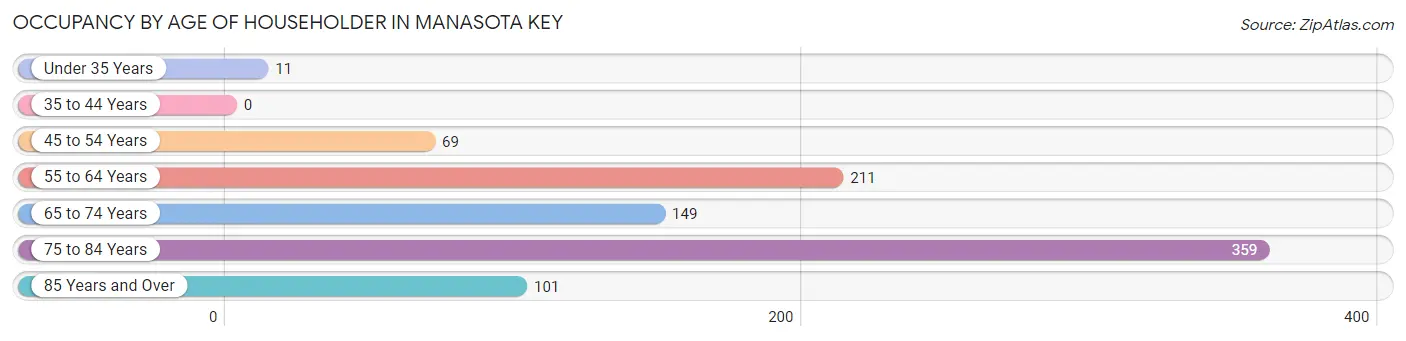
| Age Bracket | # Households | % Households |
| Under 35 Years | 11 | 1.2% |
| 35 to 44 Years | 0 | 0.0% |
| 45 to 54 Years | 69 | 7.7% |
| 55 to 64 Years | 211 | 23.4% |
| 65 to 74 Years | 149 | 16.6% |
| 75 to 84 Years | 359 | 39.9% |
| 85 Years and Over | 101 | 11.2% |
| Total | 900 | 100.0% |
Housing Finances in Manasota Key
Median Income by Occupancy in Manasota Key
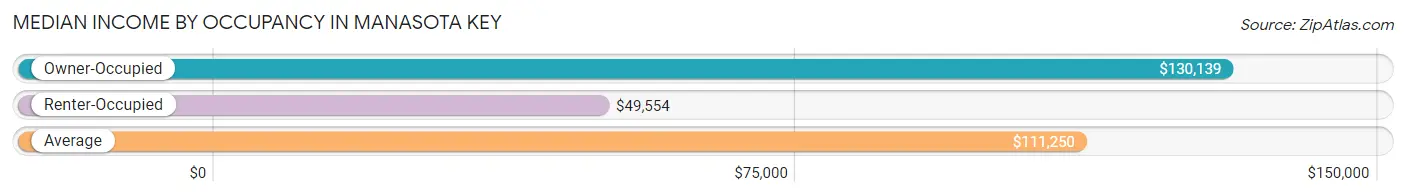
| Occupancy Type | # Households | Median Income |
| Owner-Occupied | 815 (90.6%) | $130,139 |
| Renter-Occupied | 85 (9.4%) | $49,554 |
| Average | 900 (100.0%) | $111,250 |
Occupancy by Householder Income Bracket in Manasota Key
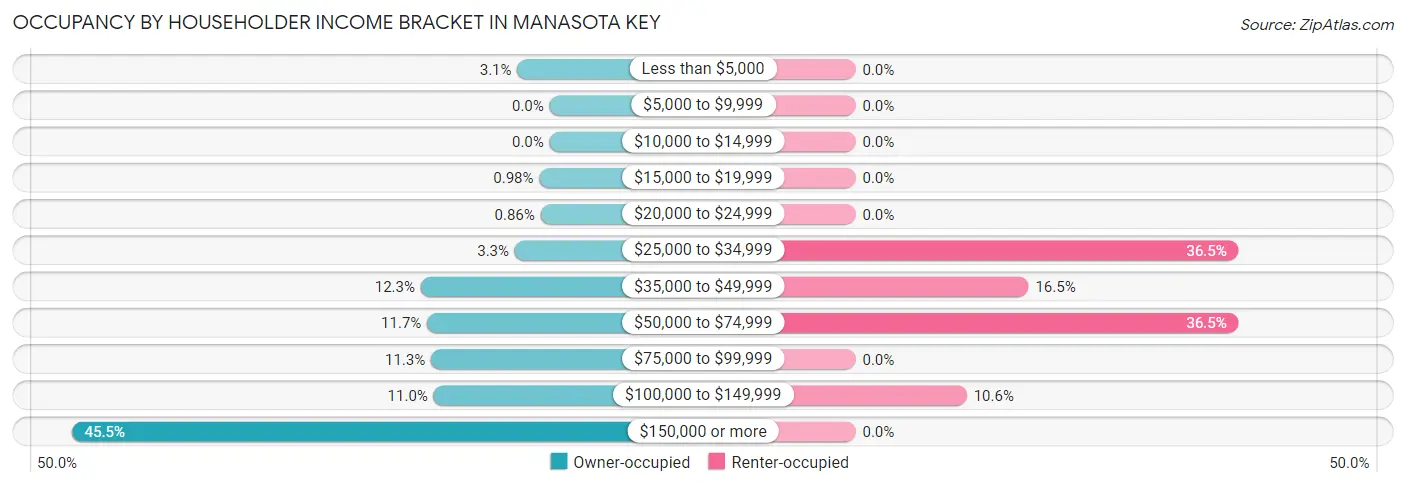
| Income Bracket | Owner-occupied | Renter-occupied |
| Less than $5,000 | 25 (3.1%) | 0 (0.0%) |
| $5,000 to $9,999 | 0 (0.0%) | 0 (0.0%) |
| $10,000 to $14,999 | 0 (0.0%) | 0 (0.0%) |
| $15,000 to $19,999 | 8 (1.0%) | 0 (0.0%) |
| $20,000 to $24,999 | 7 (0.9%) | 0 (0.0%) |
| $25,000 to $34,999 | 27 (3.3%) | 31 (36.5%) |
| $35,000 to $49,999 | 100 (12.3%) | 14 (16.5%) |
| $50,000 to $74,999 | 95 (11.7%) | 31 (36.5%) |
| $75,000 to $99,999 | 92 (11.3%) | 0 (0.0%) |
| $100,000 to $149,999 | 90 (11.0%) | 9 (10.6%) |
| $150,000 or more | 371 (45.5%) | 0 (0.0%) |
| Total | 815 (100.0%) | 85 (100.0%) |
Monthly Housing Cost Tiers in Manasota Key
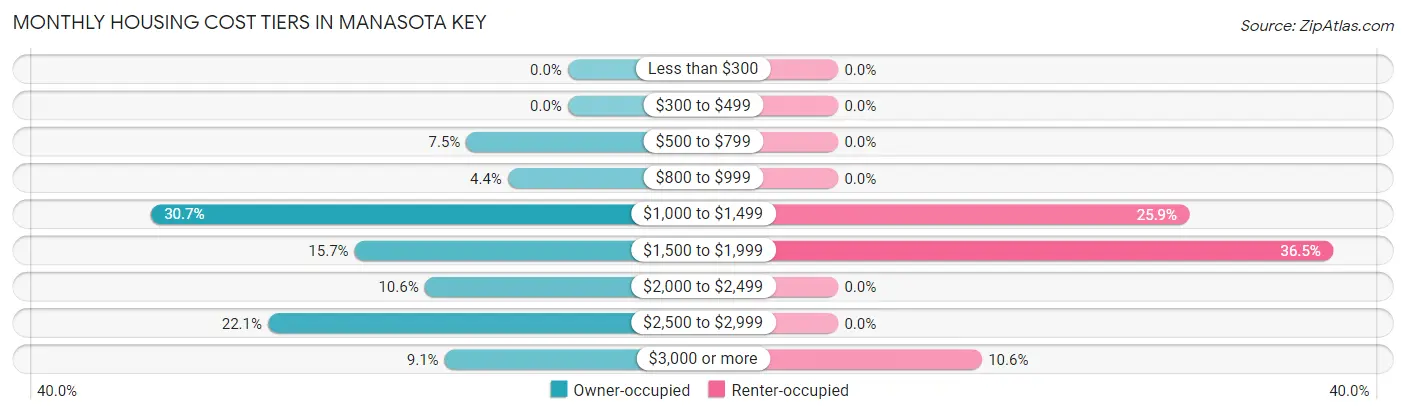
| Monthly Cost | Owner-occupied | Renter-occupied |
| Less than $300 | 0 (0.0%) | 0 (0.0%) |
| $300 to $499 | 0 (0.0%) | 0 (0.0%) |
| $500 to $799 | 61 (7.5%) | 0 (0.0%) |
| $800 to $999 | 36 (4.4%) | 0 (0.0%) |
| $1,000 to $1,499 | 250 (30.7%) | 22 (25.9%) |
| $1,500 to $1,999 | 128 (15.7%) | 31 (36.5%) |
| $2,000 to $2,499 | 86 (10.5%) | 0 (0.0%) |
| $2,500 to $2,999 | 180 (22.1%) | 0 (0.0%) |
| $3,000 or more | 74 (9.1%) | 9 (10.6%) |
| Total | 815 (100.0%) | 85 (100.0%) |
Physical Housing Characteristics in Manasota Key
Housing Structures in Manasota Key
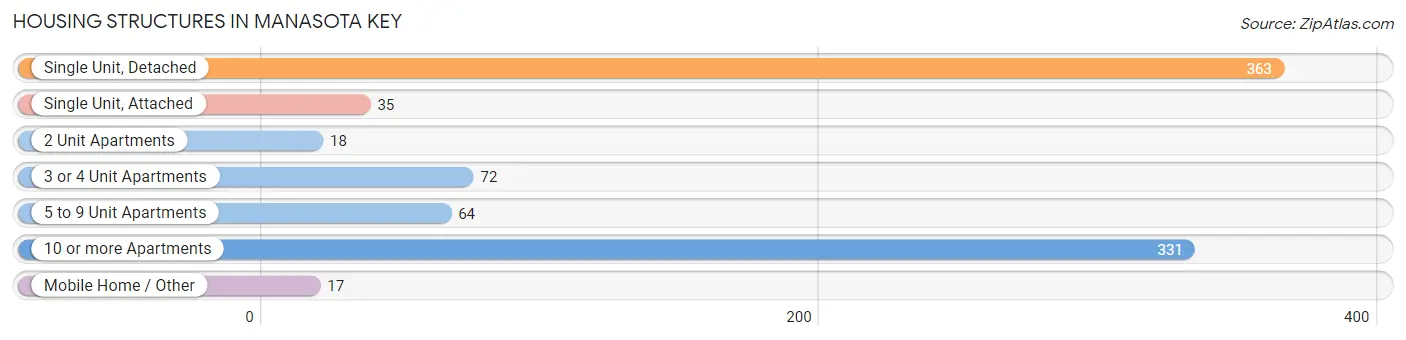
| Structure Type | # Housing Units | % Housing Units |
| Single Unit, Detached | 363 | 40.3% |
| Single Unit, Attached | 35 | 3.9% |
| 2 Unit Apartments | 18 | 2.0% |
| 3 or 4 Unit Apartments | 72 | 8.0% |
| 5 to 9 Unit Apartments | 64 | 7.1% |
| 10 or more Apartments | 331 | 36.8% |
| Mobile Home / Other | 17 | 1.9% |
| Total | 900 | 100.0% |
Housing Structures by Occupancy in Manasota Key
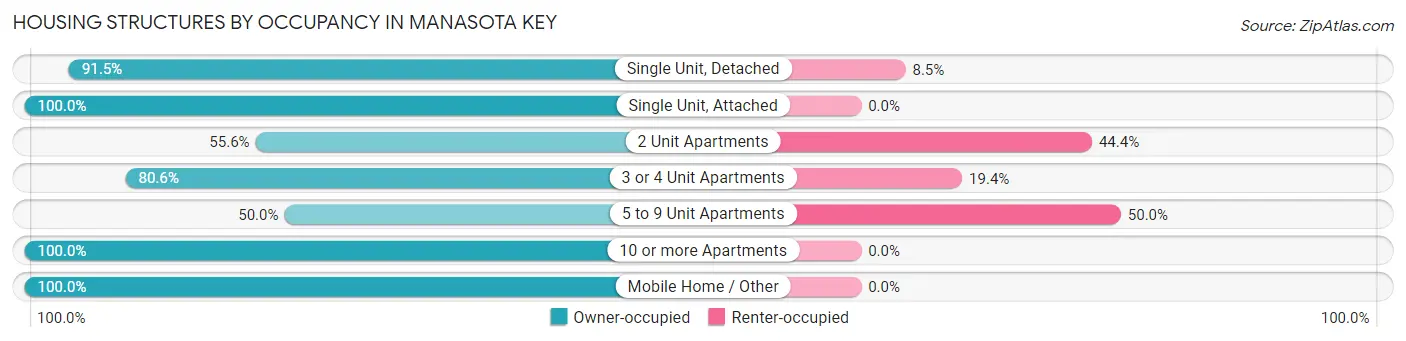
| Structure Type | Owner-occupied | Renter-occupied |
| Single Unit, Detached | 332 (91.5%) | 31 (8.5%) |
| Single Unit, Attached | 35 (100.0%) | 0 (0.0%) |
| 2 Unit Apartments | 10 (55.6%) | 8 (44.4%) |
| 3 or 4 Unit Apartments | 58 (80.6%) | 14 (19.4%) |
| 5 to 9 Unit Apartments | 32 (50.0%) | 32 (50.0%) |
| 10 or more Apartments | 331 (100.0%) | 0 (0.0%) |
| Mobile Home / Other | 17 (100.0%) | 0 (0.0%) |
| Total | 815 (90.6%) | 85 (9.4%) |
Housing Structures by Number of Rooms in Manasota Key
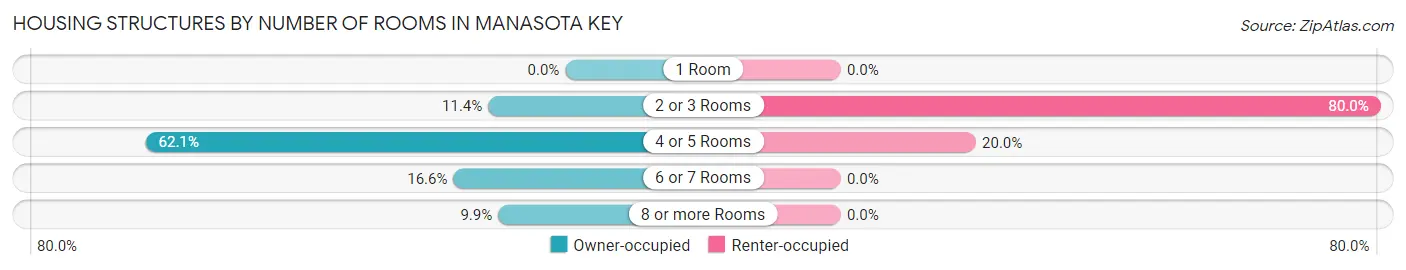
| Number of Rooms | Owner-occupied | Renter-occupied |
| 1 Room | 0 (0.0%) | 0 (0.0%) |
| 2 or 3 Rooms | 93 (11.4%) | 68 (80.0%) |
| 4 or 5 Rooms | 506 (62.1%) | 17 (20.0%) |
| 6 or 7 Rooms | 135 (16.6%) | 0 (0.0%) |
| 8 or more Rooms | 81 (9.9%) | 0 (0.0%) |
| Total | 815 (100.0%) | 85 (100.0%) |
Housing Structure by Heating Type in Manasota Key
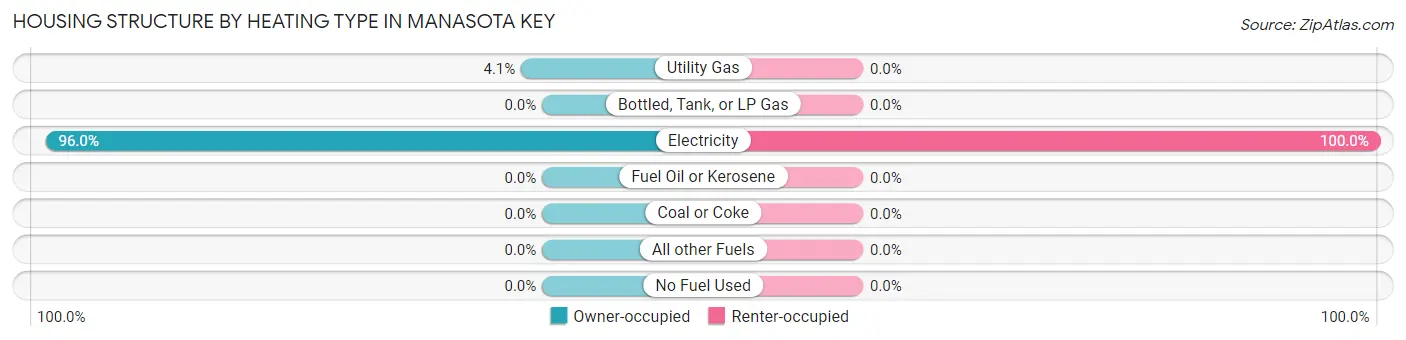
| Heating Type | Owner-occupied | Renter-occupied |
| Utility Gas | 33 (4.1%) | 0 (0.0%) |
| Bottled, Tank, or LP Gas | 0 (0.0%) | 0 (0.0%) |
| Electricity | 782 (96.0%) | 85 (100.0%) |
| Fuel Oil or Kerosene | 0 (0.0%) | 0 (0.0%) |
| Coal or Coke | 0 (0.0%) | 0 (0.0%) |
| All other Fuels | 0 (0.0%) | 0 (0.0%) |
| No Fuel Used | 0 (0.0%) | 0 (0.0%) |
| Total | 815 (100.0%) | 85 (100.0%) |
Household Vehicle Usage in Manasota Key
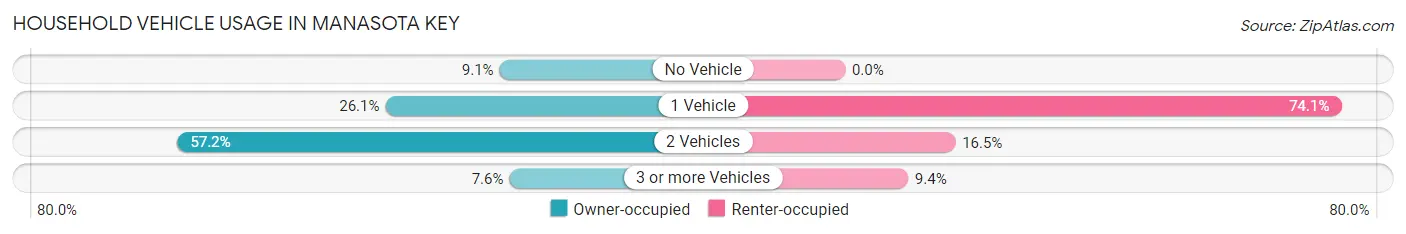
| Vehicles per Household | Owner-occupied | Renter-occupied |
| No Vehicle | 74 (9.1%) | 0 (0.0%) |
| 1 Vehicle | 213 (26.1%) | 63 (74.1%) |
| 2 Vehicles | 466 (57.2%) | 14 (16.5%) |
| 3 or more Vehicles | 62 (7.6%) | 8 (9.4%) |
| Total | 815 (100.0%) | 85 (100.0%) |
Real Estate & Mortgages in Manasota Key
Real Estate and Mortgage Overview in Manasota Key
| Characteristic | Without Mortgage | With Mortgage |
| Housing Units | 705 | 110 |
| Median Property Value | $576,200 | $625,000 |
| Median Household Income | - | - |
| Monthly Housing Costs | $1,501 | $67 |
| Real Estate Taxes | $7,721 | $0 |
Property Value by Mortgage Status in Manasota Key
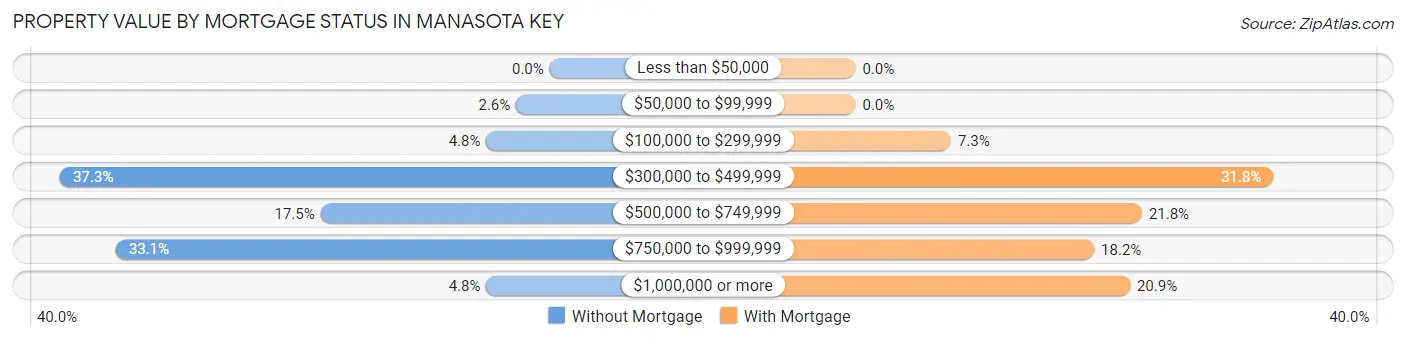
| Property Value | Without Mortgage | With Mortgage |
| Less than $50,000 | 0 (0.0%) | 0 (0.0%) |
| $50,000 to $99,999 | 18 (2.5%) | 0 (0.0%) |
| $100,000 to $299,999 | 34 (4.8%) | 8 (7.3%) |
| $300,000 to $499,999 | 263 (37.3%) | 35 (31.8%) |
| $500,000 to $749,999 | 123 (17.4%) | 24 (21.8%) |
| $750,000 to $999,999 | 233 (33.1%) | 20 (18.2%) |
| $1,000,000 or more | 34 (4.8%) | 23 (20.9%) |
| Total | 705 (100.0%) | 110 (100.0%) |
Household Income by Mortgage Status in Manasota Key
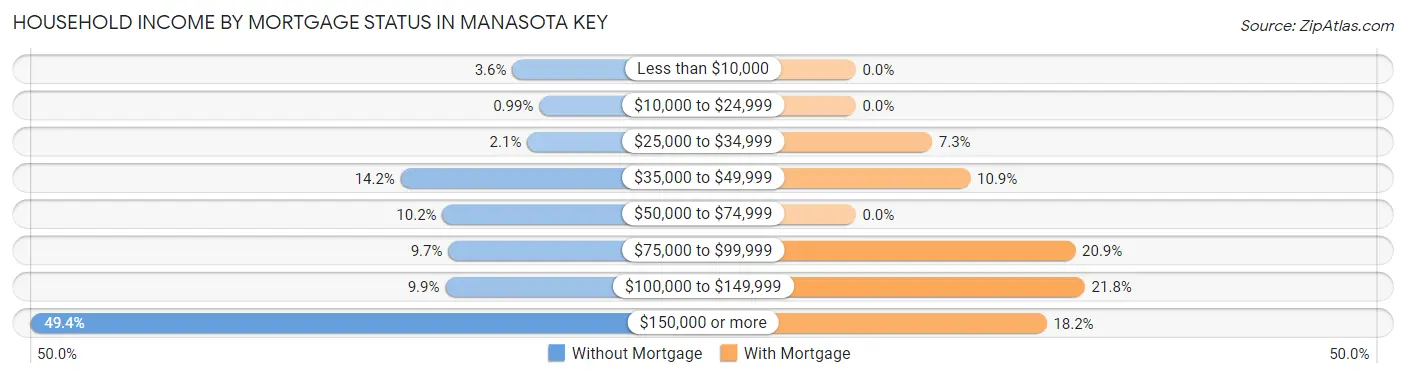
| Household Income | Without Mortgage | With Mortgage |
| Less than $10,000 | 25 (3.5%) | 0 (0.0%) |
| $10,000 to $24,999 | 7 (1.0%) | 0 (0.0%) |
| $25,000 to $34,999 | 15 (2.1%) | 8 (7.3%) |
| $35,000 to $49,999 | 100 (14.2%) | 12 (10.9%) |
| $50,000 to $74,999 | 72 (10.2%) | 0 (0.0%) |
| $75,000 to $99,999 | 68 (9.7%) | 23 (20.9%) |
| $100,000 to $149,999 | 70 (9.9%) | 24 (21.8%) |
| $150,000 or more | 348 (49.4%) | 20 (18.2%) |
| Total | 705 (100.0%) | 110 (100.0%) |
Property Value to Household Income Ratio in Manasota Key
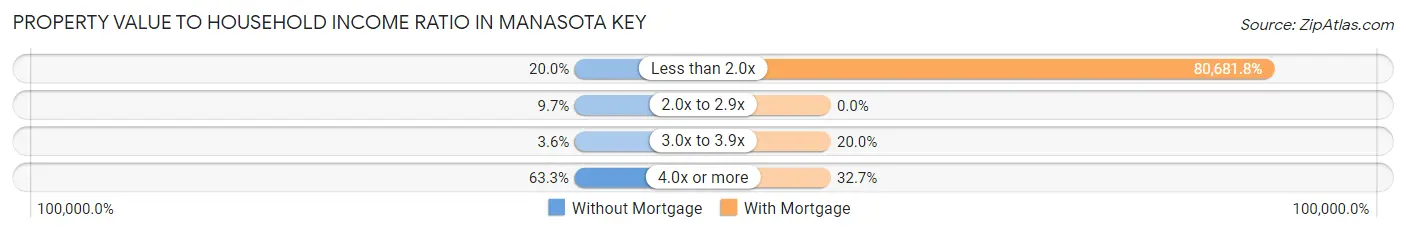
| Value-to-Income Ratio | Without Mortgage | With Mortgage |
| Less than 2.0x | 141 (20.0%) | 88,750 (80,681.8%) |
| 2.0x to 2.9x | 68 (9.7%) | 0 (0.0%) |
| 3.0x to 3.9x | 25 (3.5%) | 22 (20.0%) |
| 4.0x or more | 446 (63.3%) | 36 (32.7%) |
| Total | 705 (100.0%) | 110 (100.0%) |
Real Estate Taxes by Mortgage Status in Manasota Key
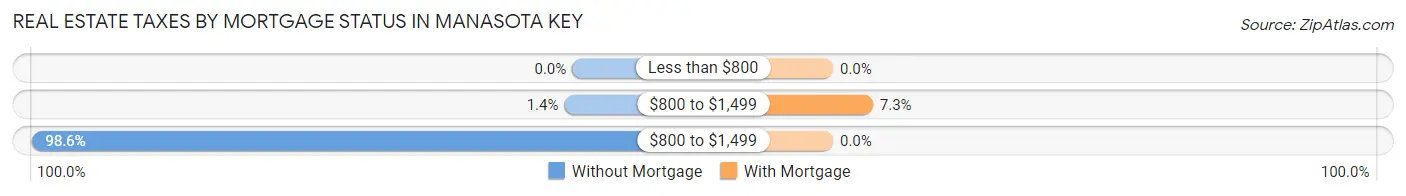
| Property Taxes | Without Mortgage | With Mortgage |
| Less than $800 | 0 (0.0%) | 0 (0.0%) |
| $800 to $1,499 | 10 (1.4%) | 8 (7.3%) |
| $800 to $1,499 | 695 (98.6%) | 0 (0.0%) |
| Total | 705 (100.0%) | 110 (100.0%) |
Health & Disability in Manasota Key
Health Insurance Coverage by Age in Manasota Key
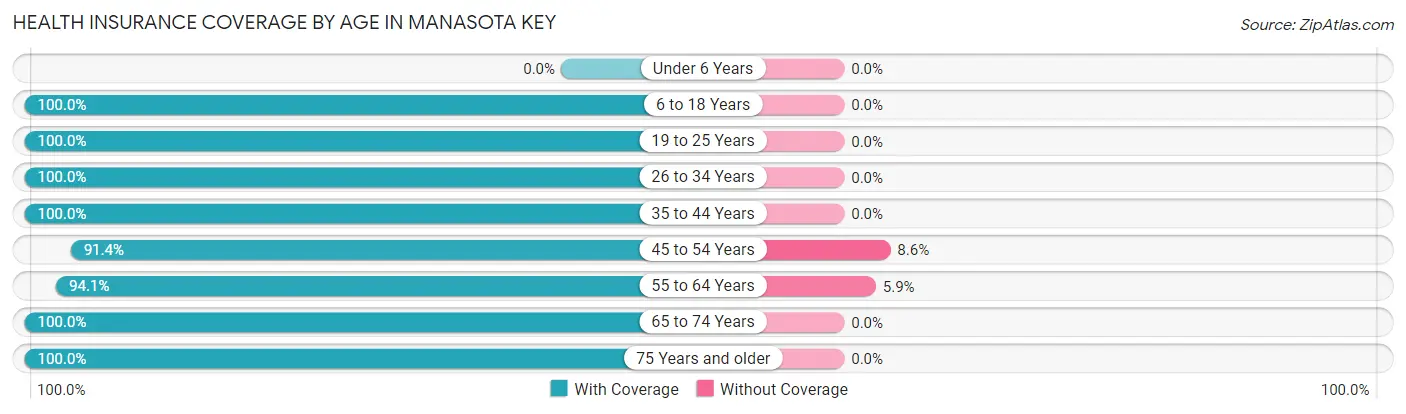
| Age Bracket | With Coverage | Without Coverage |
| Under 6 Years | 0 (0.0%) | 0 (0.0%) |
| 6 to 18 Years | 15 (100.0%) | 0 (0.0%) |
| 19 to 25 Years | 51 (100.0%) | 0 (0.0%) |
| 26 to 34 Years | 11 (100.0%) | 0 (0.0%) |
| 35 to 44 Years | 72 (100.0%) | 0 (0.0%) |
| 45 to 54 Years | 85 (91.4%) | 8 (8.6%) |
| 55 to 64 Years | 368 (94.1%) | 23 (5.9%) |
| 65 to 74 Years | 465 (100.0%) | 0 (0.0%) |
| 75 Years and older | 620 (100.0%) | 0 (0.0%) |
| Total | 1,687 (98.2%) | 31 (1.8%) |
Health Insurance Coverage by Citizenship Status in Manasota Key
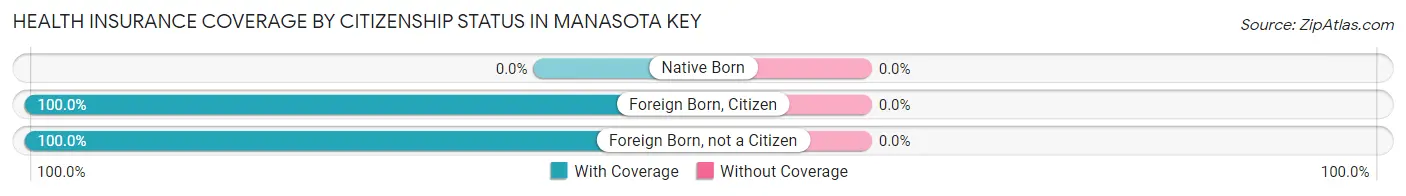
| Citizenship Status | With Coverage | Without Coverage |
| Native Born | 0 (0.0%) | 0 (0.0%) |
| Foreign Born, Citizen | 15 (100.0%) | 0 (0.0%) |
| Foreign Born, not a Citizen | 51 (100.0%) | 0 (0.0%) |
Health Insurance Coverage by Household Income in Manasota Key
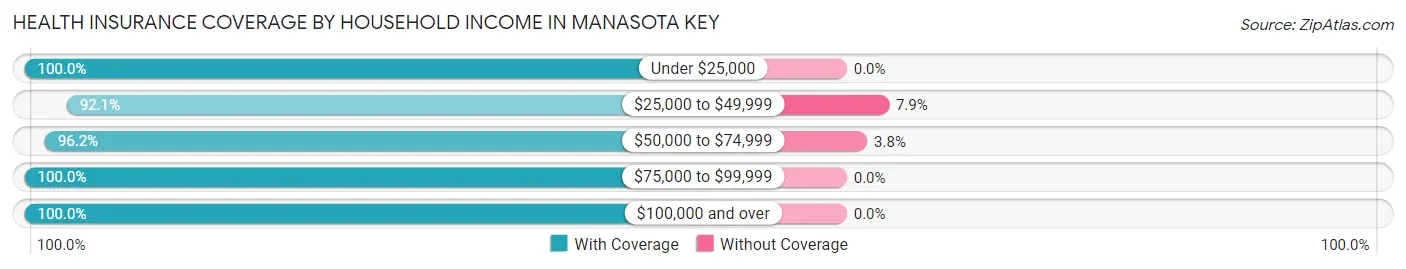
| Household Income | With Coverage | Without Coverage |
| Under $25,000 | 48 (100.0%) | 0 (0.0%) |
| $25,000 to $49,999 | 268 (92.1%) | 23 (7.9%) |
| $50,000 to $74,999 | 202 (96.2%) | 8 (3.8%) |
| $75,000 to $99,999 | 170 (100.0%) | 0 (0.0%) |
| $100,000 and over | 999 (100.0%) | 0 (0.0%) |
Public vs Private Health Insurance Coverage by Age in Manasota Key
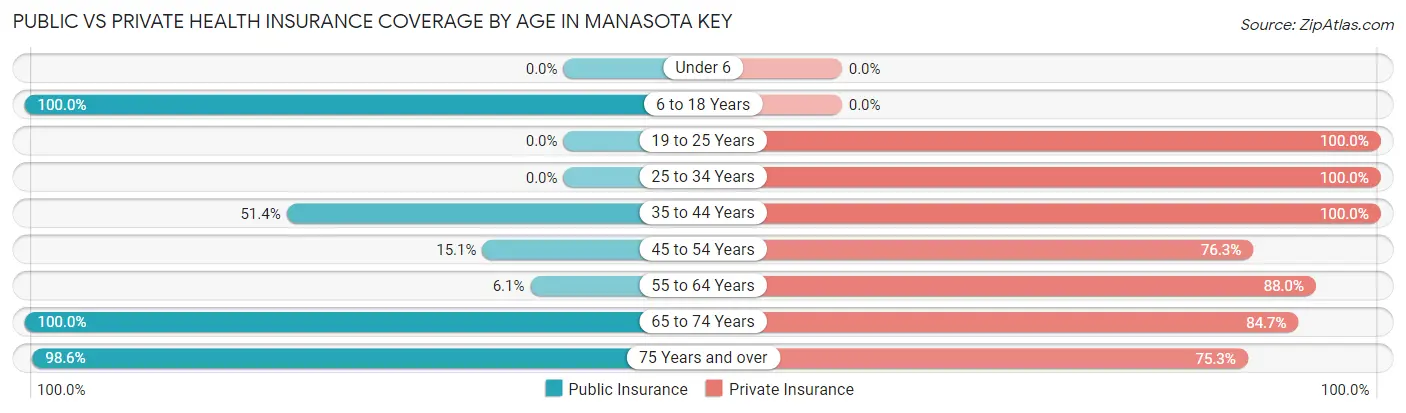
| Age Bracket | Public Insurance | Private Insurance |
| Under 6 | 0 (0.0%) | 0 (0.0%) |
| 6 to 18 Years | 15 (100.0%) | 0 (0.0%) |
| 19 to 25 Years | 0 (0.0%) | 51 (100.0%) |
| 25 to 34 Years | 0 (0.0%) | 11 (100.0%) |
| 35 to 44 Years | 37 (51.4%) | 72 (100.0%) |
| 45 to 54 Years | 14 (15.0%) | 71 (76.3%) |
| 55 to 64 Years | 24 (6.1%) | 344 (88.0%) |
| 65 to 74 Years | 465 (100.0%) | 394 (84.7%) |
| 75 Years and over | 611 (98.6%) | 467 (75.3%) |
| Total | 1,166 (67.9%) | 1,410 (82.1%) |
Disability Status by Sex by Age in Manasota Key
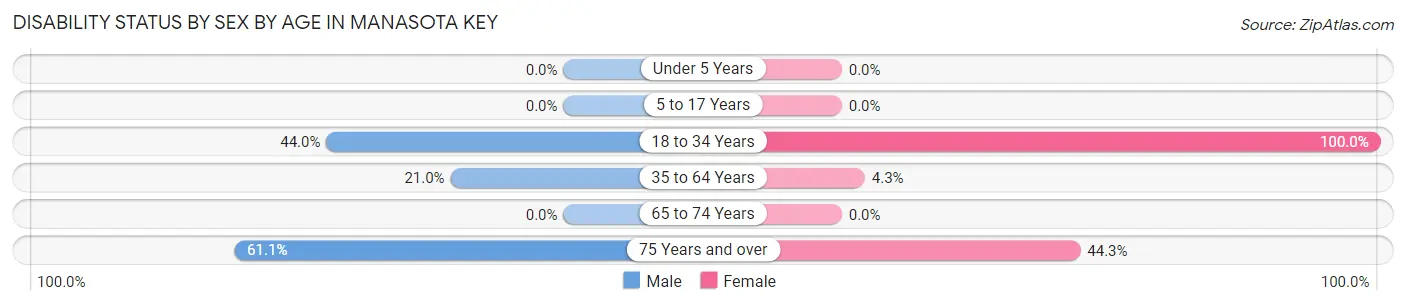
| Age Bracket | Male | Female |
| Under 5 Years | 0 (0.0%) | 0 (0.0%) |
| 5 to 17 Years | 0 (0.0%) | 0 (0.0%) |
| 18 to 34 Years | 11 (44.0%) | 37 (100.0%) |
| 35 to 64 Years | 48 (21.0%) | 14 (4.3%) |
| 65 to 74 Years | 0 (0.0%) | 0 (0.0%) |
| 75 Years and over | 256 (61.1%) | 89 (44.3%) |
Disability Class by Sex by Age in Manasota Key
Disability Class: Hearing Difficulty
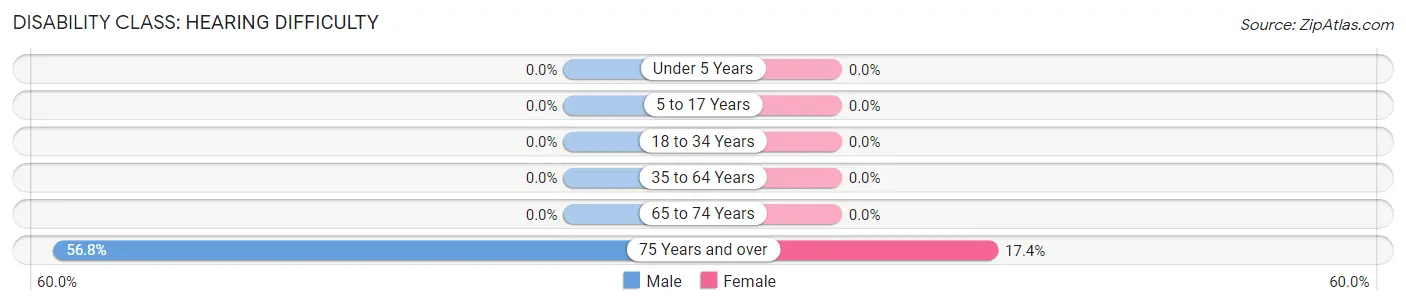
| Age Bracket | Male | Female |
| Under 5 Years | 0 (0.0%) | 0 (0.0%) |
| 5 to 17 Years | 0 (0.0%) | 0 (0.0%) |
| 18 to 34 Years | 0 (0.0%) | 0 (0.0%) |
| 35 to 64 Years | 0 (0.0%) | 0 (0.0%) |
| 65 to 74 Years | 0 (0.0%) | 0 (0.0%) |
| 75 Years and over | 238 (56.8%) | 35 (17.4%) |
Disability Class: Vision Difficulty
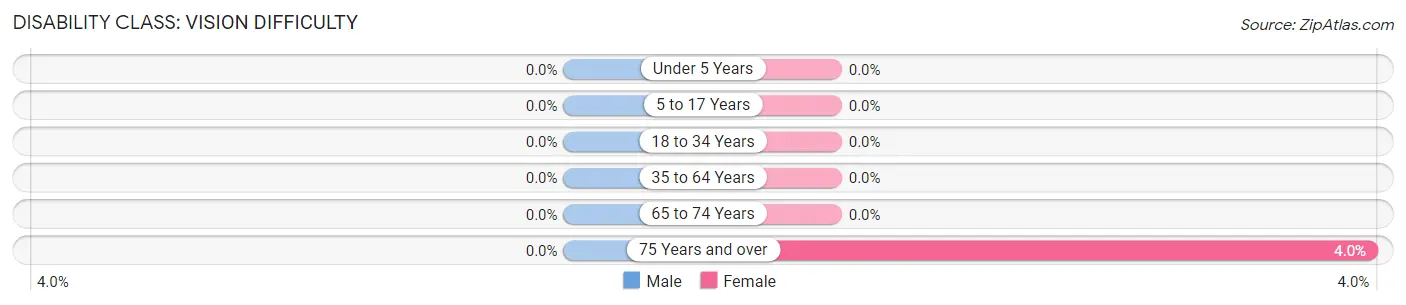
| Age Bracket | Male | Female |
| Under 5 Years | 0 (0.0%) | 0 (0.0%) |
| 5 to 17 Years | 0 (0.0%) | 0 (0.0%) |
| 18 to 34 Years | 0 (0.0%) | 0 (0.0%) |
| 35 to 64 Years | 0 (0.0%) | 0 (0.0%) |
| 65 to 74 Years | 0 (0.0%) | 0 (0.0%) |
| 75 Years and over | 0 (0.0%) | 8 (4.0%) |
Disability Class: Cognitive Difficulty
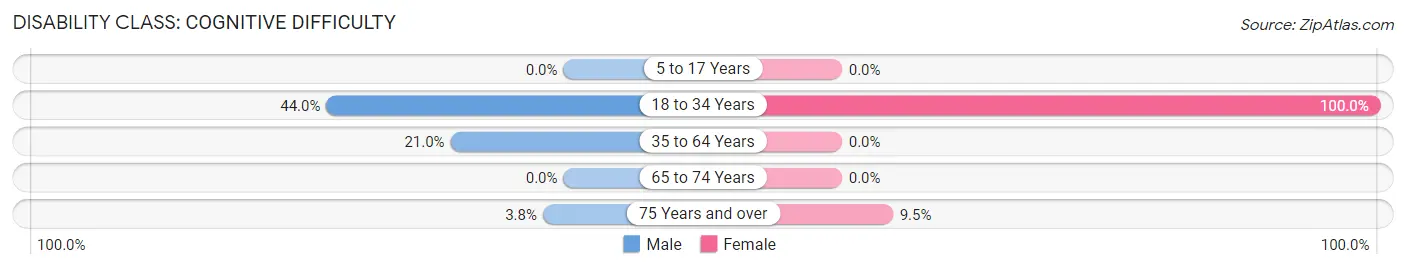
| Age Bracket | Male | Female |
| 5 to 17 Years | 0 (0.0%) | 0 (0.0%) |
| 18 to 34 Years | 11 (44.0%) | 37 (100.0%) |
| 35 to 64 Years | 48 (21.0%) | 0 (0.0%) |
| 65 to 74 Years | 0 (0.0%) | 0 (0.0%) |
| 75 Years and over | 16 (3.8%) | 19 (9.5%) |
Disability Class: Ambulatory Difficulty
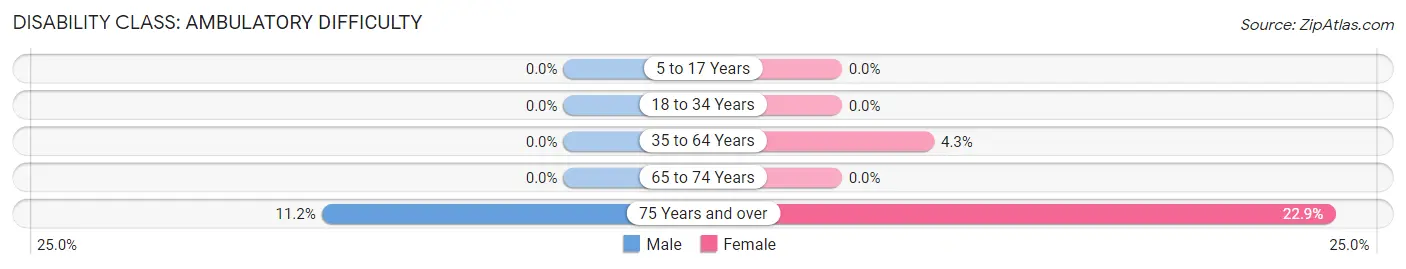
| Age Bracket | Male | Female |
| 5 to 17 Years | 0 (0.0%) | 0 (0.0%) |
| 18 to 34 Years | 0 (0.0%) | 0 (0.0%) |
| 35 to 64 Years | 0 (0.0%) | 14 (4.3%) |
| 65 to 74 Years | 0 (0.0%) | 0 (0.0%) |
| 75 Years and over | 47 (11.2%) | 46 (22.9%) |
Disability Class: Self-Care Difficulty
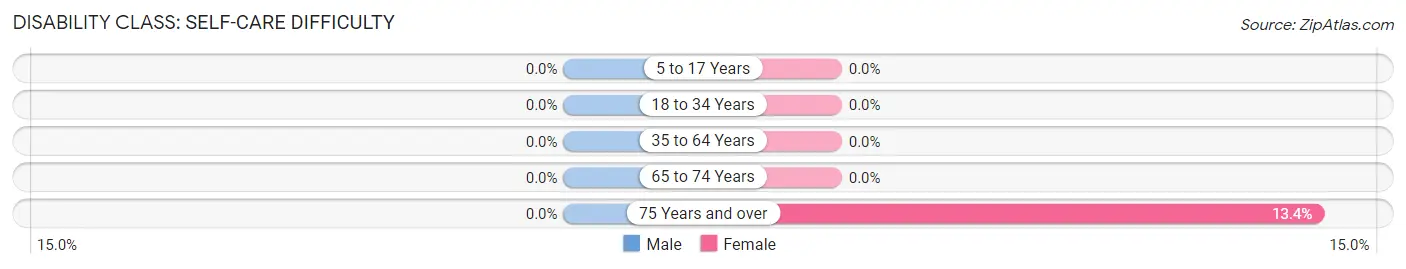
| Age Bracket | Male | Female |
| 5 to 17 Years | 0 (0.0%) | 0 (0.0%) |
| 18 to 34 Years | 0 (0.0%) | 0 (0.0%) |
| 35 to 64 Years | 0 (0.0%) | 0 (0.0%) |
| 65 to 74 Years | 0 (0.0%) | 0 (0.0%) |
| 75 Years and over | 0 (0.0%) | 27 (13.4%) |
Technology Access in Manasota Key
Computing Device Access in Manasota Key
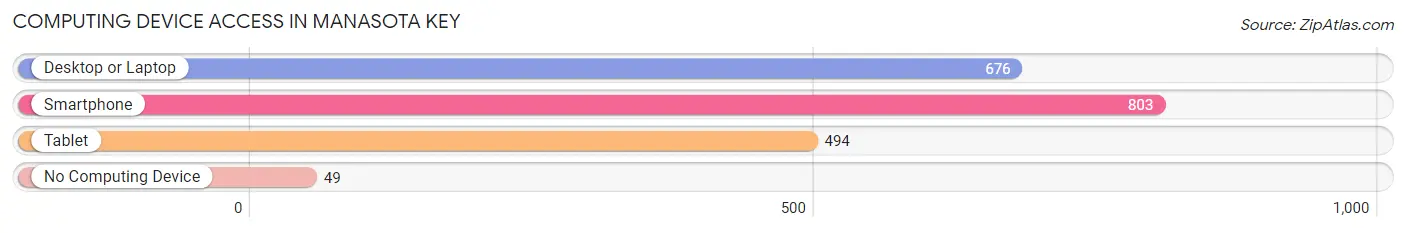
| Device Type | # Households | % Households |
| Desktop or Laptop | 676 | 75.1% |
| Smartphone | 803 | 89.2% |
| Tablet | 494 | 54.9% |
| No Computing Device | 49 | 5.4% |
| Total | 900 | 100.0% |
Internet Access in Manasota Key
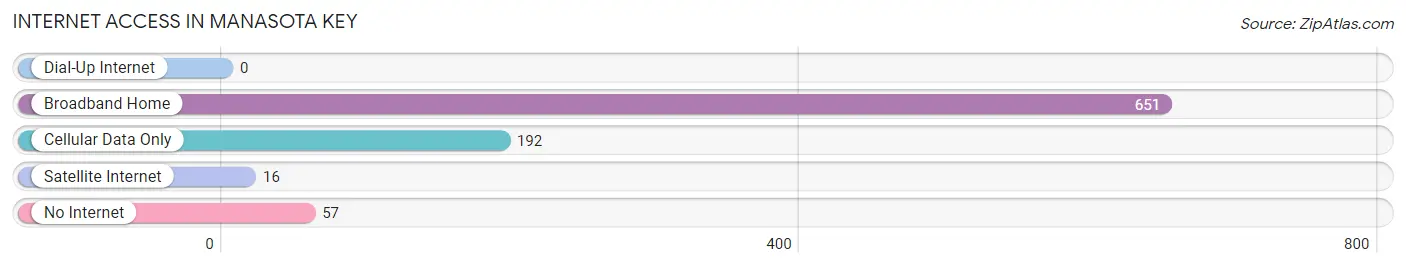
| Internet Type | # Households | % Households |
| Dial-Up Internet | 0 | 0.0% |
| Broadband Home | 651 | 72.3% |
| Cellular Data Only | 192 | 21.3% |
| Satellite Internet | 16 | 1.8% |
| No Internet | 57 | 6.3% |
| Total | 900 | 100.0% |
Manasota Key Summary
Manasota Key is a barrier island located in Sarasota County, Florida. It is situated between the Gulf of Mexico and Lemon Bay, and is approximately 11 miles long. The island is home to a variety of wildlife, including sea turtles, shorebirds, and dolphins. Manasota Key is a popular destination for tourists and locals alike, offering a variety of activities such as swimming, fishing, boating, and sunbathing.
Geography
Manasota Key is located in the southwestern part of Florida, approximately 11 miles long and 1 mile wide. It is situated between the Gulf of Mexico and Lemon Bay, and is connected to the mainland by two bridges. The island is composed of sand and shells, and is bordered by mangroves and sea grasses. The highest point on the island is approximately 10 feet above sea level.
The climate of Manasota Key is subtropical, with hot, humid summers and mild winters. The average temperature ranges from the mid-70s in the winter to the mid-90s in the summer. The island receives an average of 50 inches of rain per year.
History
Manasota Key has been inhabited for thousands of years. The first known inhabitants were the Calusa Indians, who lived on the island until the late 1700s. In the early 1800s, the island was used as a fishing and trading post by the Spanish. In the late 1800s, the island was used as a cattle ranch.
In the early 1900s, the island was developed as a resort destination. The first hotel was built in 1912, and the island quickly became a popular destination for tourists. In the 1950s, the island was developed further, with the construction of condominiums and other vacation homes.
Economy
The economy of Manasota Key is largely based on tourism. The island is home to a variety of hotels, resorts, restaurants, and other businesses that cater to tourists. The island also has a thriving real estate market, with many vacation homes and condominiums available for purchase or rent.
Demographics
As of the 2010 census, the population of Manasota Key was 1,845. The population is predominantly white (94.3%), with a small percentage of African Americans (2.2%) and Hispanics (2.5%). The median household income is $50,000, and the median age is 54.
Manasota Key is a popular destination for tourists and locals alike. The island offers a variety of activities, including swimming, fishing, boating, and sunbathing. The island is also home to a variety of wildlife, including sea turtles, shorebirds, and dolphins. With its beautiful beaches and laid-back atmosphere, Manasota Key is a great place to visit or call home.
Common Questions
What is the Total Population of Manasota Key?
Total Population of Manasota Key is 1,718.
What is the Total Male Population of Manasota Key?
Total Male Population of Manasota Key is 804.
What is the Total Female Population of Manasota Key?
Total Female Population of Manasota Key is 914.
What is the Ratio of Males per 100 Females in Manasota Key?
There are 87.96 Males per 100 Females in Manasota Key.
What is the Ratio of Females per 100 Males in Manasota Key?
There are 113.68 Females per 100 Males in Manasota Key.
What is the Median Population Age in Manasota Key?
Median Population Age in Manasota Key is 72.1 Years.
What is the Average Family Size in Manasota Key
Average Family Size in Manasota Key is 2.1 People.
What is the Average Household Size in Manasota Key
Average Household Size in Manasota Key is 1.9 People.
What is Per Capita Income in Manasota Key?
Per Capita income in Manasota Key is $81,642.
What is the Median Family Income in Manasota Key?
Median Family Income in Manasota Key is $183,508.
What is the Median Household income in Manasota Key?
Median Household Income in Manasota Key is $111,250.
What is Income or Wage Gap in Manasota Key?
Income or Wage Gap in Manasota Key is 80.8%.
Women in Manasota Key earn 19.2 cents for every dollar earned by a man.
What is Inequality or Gini Index in Manasota Key?
Inequality or Gini Index in Manasota Key is 0.44.
How Large is the Labor Force in Manasota Key?
There are 496 People in the Labor Forcein in Manasota Key.
What is the Percentage of People in the Labor Force in Manasota Key?
29.1% of People are in the Labor Force in Manasota Key.
What is the Unemployment Rate in Manasota Key?
Unemployment Rate in Manasota Key is 6.3%.