Loughman, FL
Loughman Map
Loughman Overview
6,296
TOTAL POPULATION
3,177
MALE POPULATION
3,119
FEMALE POPULATION
101.86
MALES / 100 FEMALES
98.17
FEMALES / 100 MALES
27.9
MEDIAN AGE
3.0
AVG FAMILY SIZE
2.8
AVG HOUSEHOLD SIZE
$25,860
PER CAPITA INCOME
$51,360
AVG FAMILY INCOME
$54,944
AVG HOUSEHOLD INCOME
41.1%
WAGE / INCOME GAP [ % ]
58.9¢/ $1
WAGE / INCOME GAP [ $ ]
0.32
INEQUALITY / GINI INDEX
3,805
LABOR FORCE [ PEOPLE ]
73.2%
PERCENT IN LABOR FORCE
2.4%
UNEMPLOYMENT RATE
Loughman Zip Codes
Loughman Area Codes
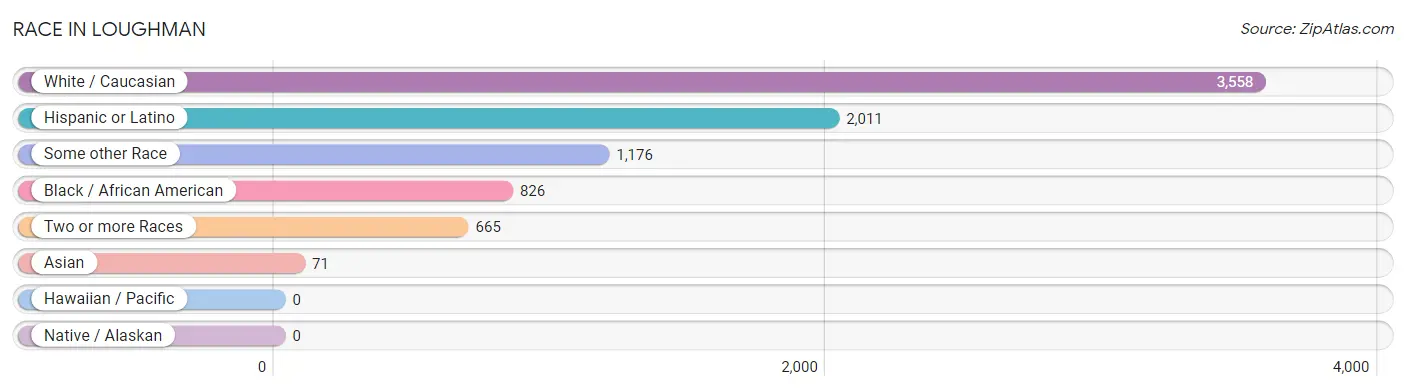
Race in Loughman
The most populous races in Loughman are White / Caucasian (3,558 | 56.5%), Hispanic or Latino (2,011 | 31.9%), and Some other Race (1,176 | 18.7%).
| Race | # Population | % Population |
| Asian | 71 | 1.1% |
| Black / African American | 826 | 13.1% |
| Hawaiian / Pacific | 0 | 0.0% |
| Hispanic or Latino | 2,011 | 31.9% |
| Native / Alaskan | 0 | 0.0% |
| White / Caucasian | 3,558 | 56.5% |
| Two or more Races | 665 | 10.6% |
| Some other Race | 1,176 | 18.7% |
| Total | 6,296 | 100.0% |
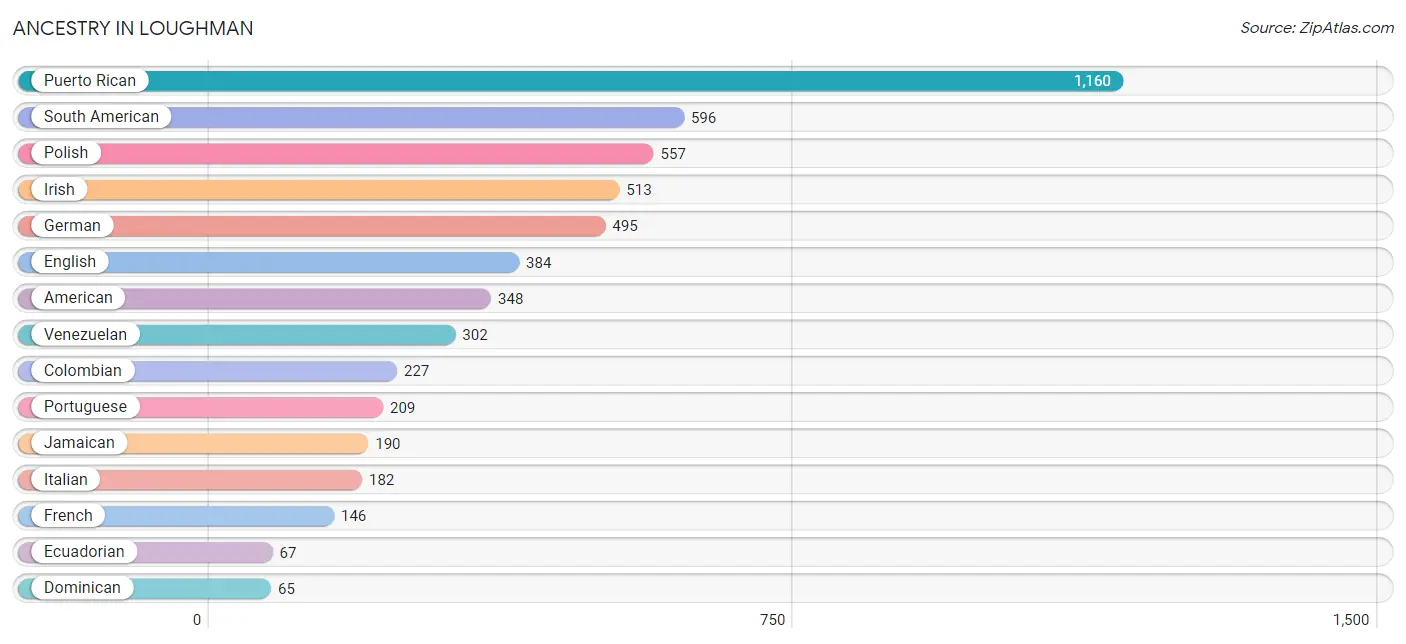
Ancestry in Loughman
The most populous ancestries reported in Loughman are Puerto Rican (1,160 | 18.4%), South American (596 | 9.5%), Polish (557 | 8.8%), Irish (513 | 8.2%), and German (495 | 7.9%), together accounting for 52.8% of all Loughman residents.
| Ancestry | # Population | % Population |
| American | 348 | 5.5% |
| Arab | 10 | 0.2% |
| Belgian | 20 | 0.3% |
| Bhutanese | 41 | 0.6% |
| Brazilian | 10 | 0.2% |
| British | 20 | 0.3% |
| Central American | 47 | 0.7% |
| Central American Indian | 14 | 0.2% |
| Cherokee | 36 | 0.6% |
| Colombian | 227 | 3.6% |
| Croatian | 26 | 0.4% |
| Cuban | 23 | 0.4% |
| Czech | 34 | 0.5% |
| Czechoslovakian | 18 | 0.3% |
| Danish | 57 | 0.9% |
| Dominican | 65 | 1.0% |
| Eastern European | 10 | 0.2% |
| Ecuadorian | 67 | 1.1% |
| English | 384 | 6.1% |
| European | 56 | 0.9% |
| French | 146 | 2.3% |
| German | 495 | 7.9% |
| Honduran | 47 | 0.7% |
| Indian (Asian) | 29 | 0.5% |
| Irish | 513 | 8.2% |
| Italian | 182 | 2.9% |
| Jamaican | 190 | 3.0% |
| Korean | 34 | 0.5% |
| Lithuanian | 37 | 0.6% |
| Mexican | 58 | 0.9% |
| Moroccan | 10 | 0.2% |
| Norwegian | 19 | 0.3% |
| Polish | 557 | 8.8% |
| Portuguese | 209 | 3.3% |
| Puerto Rican | 1,160 | 18.4% |
| Scotch-Irish | 19 | 0.3% |
| Scottish | 34 | 0.5% |
| South American | 596 | 9.5% |
| Spaniard | 62 | 1.0% |
| Thai | 19 | 0.3% |
| Ukrainian | 12 | 0.2% |
| Venezuelan | 302 | 4.8% | View All 42 Rows |
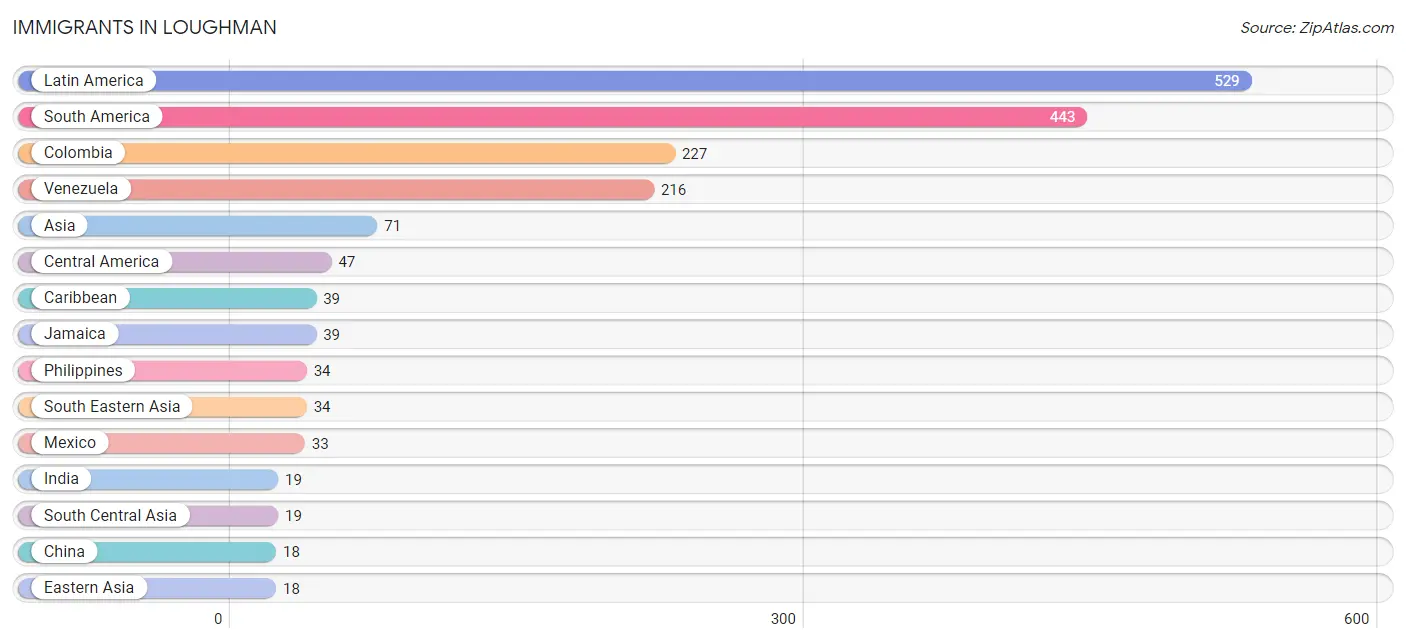
Immigrants in Loughman
The most numerous immigrant groups reported in Loughman came from Latin America (529 | 8.4%), South America (443 | 7.0%), Colombia (227 | 3.6%), Venezuela (216 | 3.4%), and Asia (71 | 1.1%), together accounting for 23.6% of all Loughman residents.
| Immigration Origin | # Population | % Population |
| Africa | 10 | 0.2% |
| Asia | 71 | 1.1% |
| Caribbean | 39 | 0.6% |
| Central America | 47 | 0.7% |
| China | 18 | 0.3% |
| Colombia | 227 | 3.6% |
| Eastern Asia | 18 | 0.3% |
| Honduras | 14 | 0.2% |
| India | 19 | 0.3% |
| Jamaica | 39 | 0.6% |
| Latin America | 529 | 8.4% |
| Mexico | 33 | 0.5% |
| Morocco | 10 | 0.2% |
| Northern Africa | 10 | 0.2% |
| Philippines | 34 | 0.5% |
| South America | 443 | 7.0% |
| South Central Asia | 19 | 0.3% |
| South Eastern Asia | 34 | 0.5% |
| Venezuela | 216 | 3.4% | View All 19 Rows |
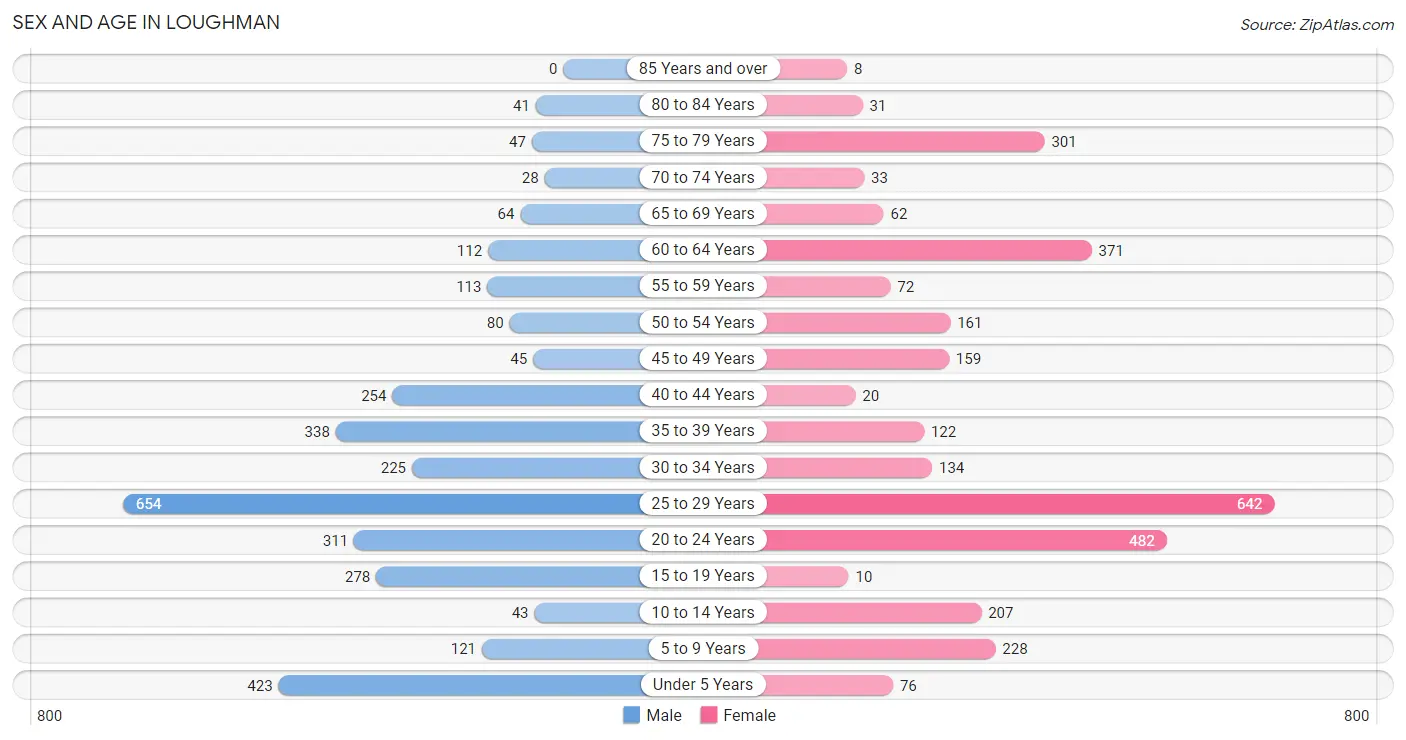
Sex and Age in Loughman
Sex and Age in Loughman
The most populous age groups in Loughman are 25 to 29 Years (654 | 20.6%) for men and 25 to 29 Years (642 | 20.6%) for women.
| Age Bracket | Male | Female |
| Under 5 Years | 423 (13.3%) | 76 (2.4%) |
| 5 to 9 Years | 121 (3.8%) | 228 (7.3%) |
| 10 to 14 Years | 43 (1.3%) | 207 (6.6%) |
| 15 to 19 Years | 278 (8.7%) | 10 (0.3%) |
| 20 to 24 Years | 311 (9.8%) | 482 (15.4%) |
| 25 to 29 Years | 654 (20.6%) | 642 (20.6%) |
| 30 to 34 Years | 225 (7.1%) | 134 (4.3%) |
| 35 to 39 Years | 338 (10.6%) | 122 (3.9%) |
| 40 to 44 Years | 254 (8.0%) | 20 (0.6%) |
| 45 to 49 Years | 45 (1.4%) | 159 (5.1%) |
| 50 to 54 Years | 80 (2.5%) | 161 (5.2%) |
| 55 to 59 Years | 113 (3.6%) | 72 (2.3%) |
| 60 to 64 Years | 112 (3.5%) | 371 (11.9%) |
| 65 to 69 Years | 64 (2.0%) | 62 (2.0%) |
| 70 to 74 Years | 28 (0.9%) | 33 (1.1%) |
| 75 to 79 Years | 47 (1.5%) | 301 (9.7%) |
| 80 to 84 Years | 41 (1.3%) | 31 (1.0%) |
| 85 Years and over | 0 (0.0%) | 8 (0.3%) |
| Total | 3,177 (100.0%) | 3,119 (100.0%) |
Families and Households in Loughman
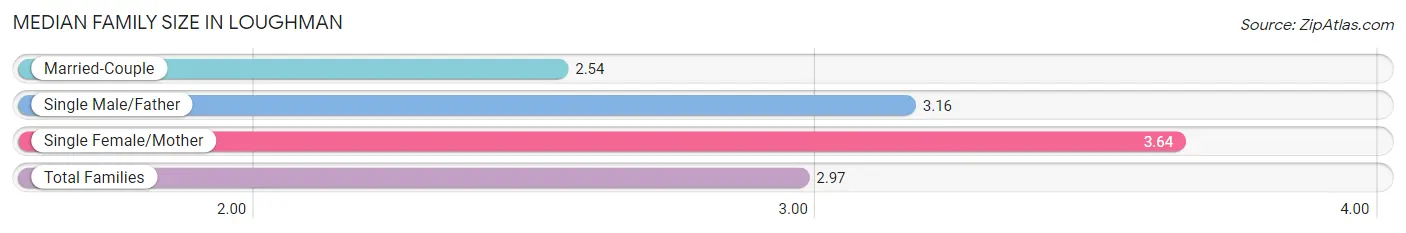
Median Family Size in Loughman
The median family size in Loughman is 2.97 persons per family, with single female/mother families (336 | 26.1%) accounting for the largest median family size of 3.64 persons per family. On the other hand, married-couple families (661 | 51.4%) represent the smallest median family size with 2.54 persons per family.
| Family Type | # Families | Family Size |
| Married-Couple | 661 (51.4%) | 2.54 |
| Single Male/Father | 290 (22.5%) | 3.16 |
| Single Female/Mother | 336 (26.1%) | 3.64 |
| Total Families | 1,287 (100.0%) | 2.97 |
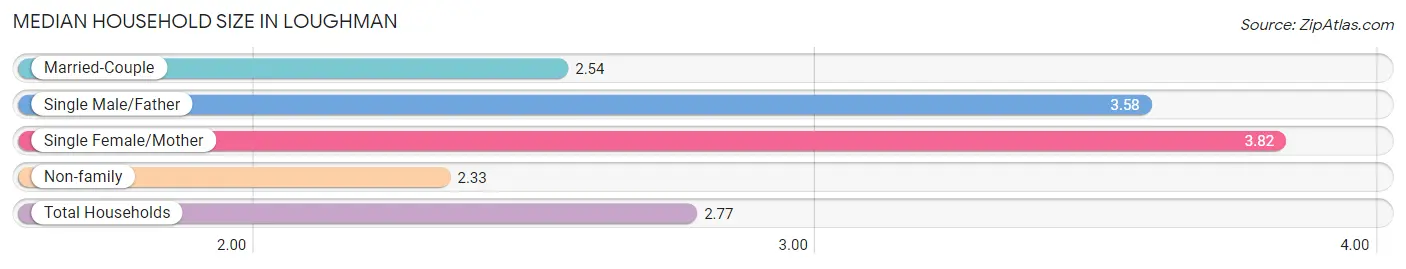
Median Household Size in Loughman
The median household size in Loughman is 2.77 persons per household, with single female/mother households (336 | 14.8%) accounting for the largest median household size of 3.82 persons per household. non-family households (985 | 43.3%) represent the smallest median household size with 2.33 persons per household.
| Household Type | # Households | Household Size |
| Married-Couple | 661 (29.1%) | 2.54 |
| Single Male/Father | 290 (12.8%) | 3.58 |
| Single Female/Mother | 336 (14.8%) | 3.82 |
| Non-family | 985 (43.3%) | 2.33 |
| Total Households | 2,272 (100.0%) | 2.77 |
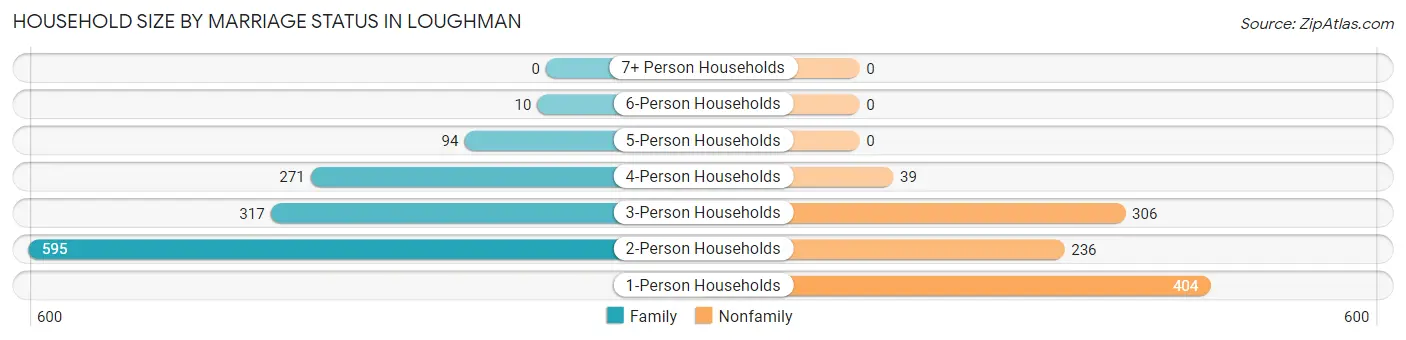
Household Size by Marriage Status in Loughman
Out of a total of 2,272 households in Loughman, 1,287 (56.7%) are family households, while 985 (43.3%) are nonfamily households. The most numerous type of family households are 2-person households, comprising 595, and the most common type of nonfamily households are 1-person households, comprising 404.
| Household Size | Family Households | Nonfamily Households |
| 1-Person Households | - | 404 (17.8%) |
| 2-Person Households | 595 (26.2%) | 236 (10.4%) |
| 3-Person Households | 317 (14.0%) | 306 (13.5%) |
| 4-Person Households | 271 (11.9%) | 39 (1.7%) |
| 5-Person Households | 94 (4.1%) | 0 (0.0%) |
| 6-Person Households | 10 (0.4%) | 0 (0.0%) |
| 7+ Person Households | 0 (0.0%) | 0 (0.0%) |
| Total | 1,287 (56.7%) | 985 (43.3%) |
Female Fertility in Loughman
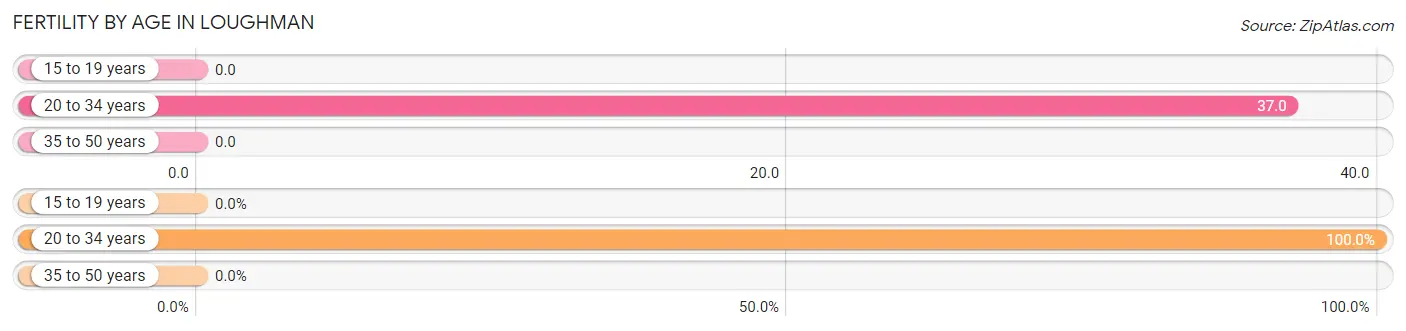
Fertility by Age in Loughman
Average fertility rate in Loughman is 29.0 births per 1,000 women. Women in the age bracket of 20 to 34 years have the highest fertility rate with 37.0 births per 1,000 women. Women in the age bracket of 20 to 34 years acount for 100.0% of all women with births.
| Age Bracket | Women with Births | Births / 1,000 Women |
| 15 to 19 years | 0 (0.0%) | 0.0 |
| 20 to 34 years | 46 (100.0%) | 37.0 |
| 35 to 50 years | 0 (0.0%) | 0.0 |
| Total | 46 (100.0%) | 29.0 |
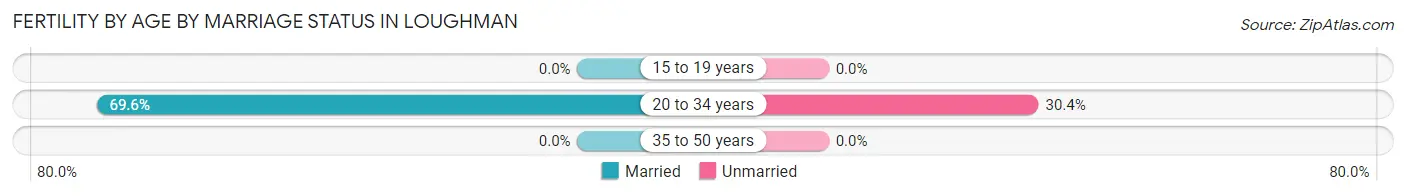
Fertility by Age by Marriage Status in Loughman
69.6% of women with births (46) in Loughman are married. The highest percentage of unmarried women with births falls into 20 to 34 years age bracket with 30.4% of them unmarried at the time of birth, while the lowest percentage of unmarried women with births belong to 20 to 34 years age bracket with 30.4% of them unmarried.
| Age Bracket | Married | Unmarried |
| 15 to 19 years | 0 (0.0%) | 0 (0.0%) |
| 20 to 34 years | 32 (69.6%) | 14 (30.4%) |
| 35 to 50 years | 0 (0.0%) | 0 (0.0%) |
| Total | 32 (69.6%) | 14 (30.4%) |
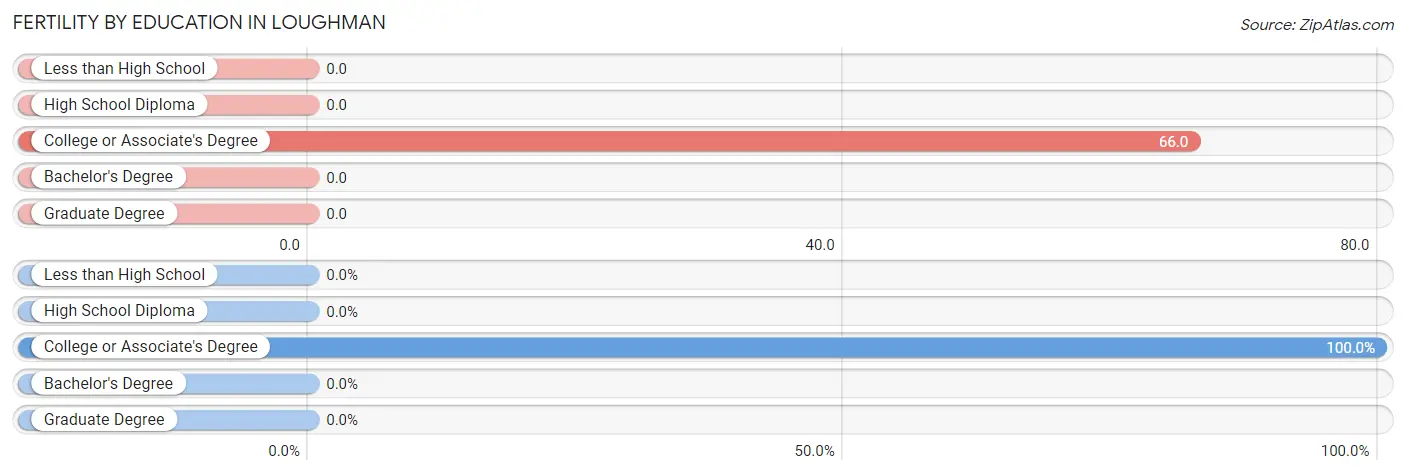
Fertility by Education in Loughman
| Educational Attainment | Women with Births | Births / 1,000 Women |
| Less than High School | 0 (0.0%) | 0.0 |
| High School Diploma | 0 (0.0%) | 0.0 |
| College or Associate's Degree | 46 (100.0%) | 66.0 |
| Bachelor's Degree | 0 (0.0%) | 0.0 |
| Graduate Degree | 0 (0.0%) | 0.0 |
| Total | 46 (100.0%) | 29.0 |
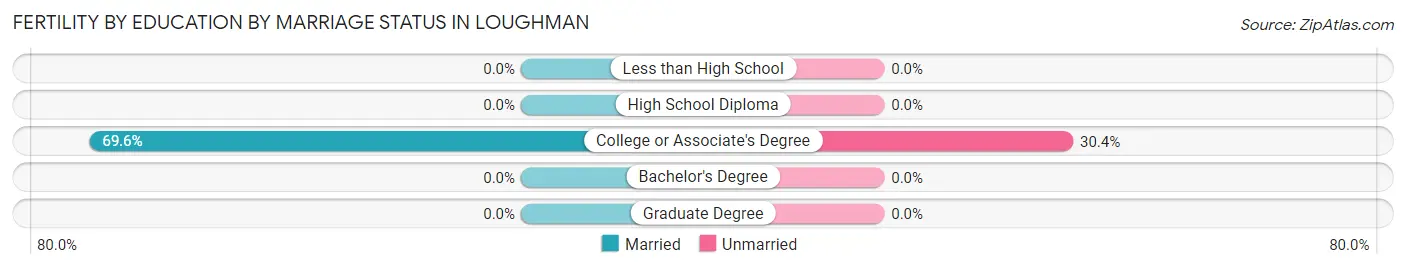
Fertility by Education by Marriage Status in Loughman
30.4% of women with births in Loughman are unmarried. Women with the educational attainment of college or associate's degree are most likely to be married with 69.6% of them married at childbirth, while women with the educational attainment of college or associate's degree are least likely to be married with 30.4% of them unmarried at childbirth.
| Educational Attainment | Married | Unmarried |
| Less than High School | 0 (0.0%) | 0 (0.0%) |
| High School Diploma | 0 (0.0%) | 0 (0.0%) |
| College or Associate's Degree | 32 (69.6%) | 14 (30.4%) |
| Bachelor's Degree | 0 (0.0%) | 0 (0.0%) |
| Graduate Degree | 0 (0.0%) | 0 (0.0%) |
| Total | 32 (69.6%) | 14 (30.4%) |
Income in Loughman
Income Overview in Loughman
Per Capita Income in Loughman is $25,860, while median incomes of families and households are $51,360 and $54,944 respectively.
| Characteristic | Number | Measure |
| Per Capita Income | 6,296 | $25,860 |
| Median Family Income | 1,287 | $51,360 |
| Mean Family Income | 1,287 | $56,040 |
| Median Household Income | 2,272 | $54,944 |
| Mean Household Income | 2,272 | $65,757 |
| Income Deficit | 1,287 | $0 |
| Wage / Income Gap (%) | 6,296 | 41.13% |
| Wage / Income Gap ($) | 6,296 | 58.87¢ per $1 |
| Gini / Inequality Index | 6,296 | 0.32 |
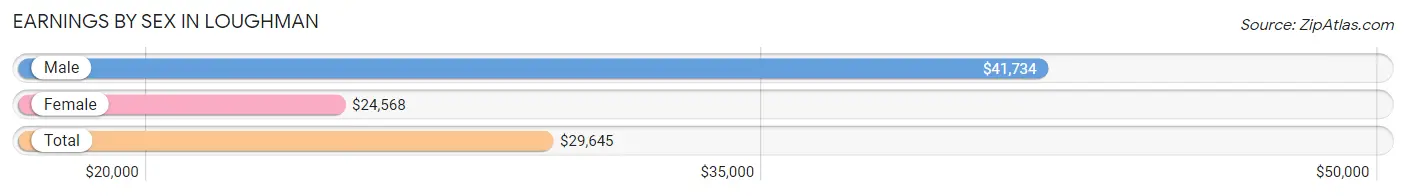
Earnings by Sex in Loughman
Average Earnings in Loughman are $29,645, $41,734 for men and $24,568 for women, a difference of 41.1%.
| Sex | Number | Average Earnings |
| Male | 2,061 (50.9%) | $41,734 |
| Female | 1,990 (49.1%) | $24,568 |
| Total | 4,051 (100.0%) | $29,645 |
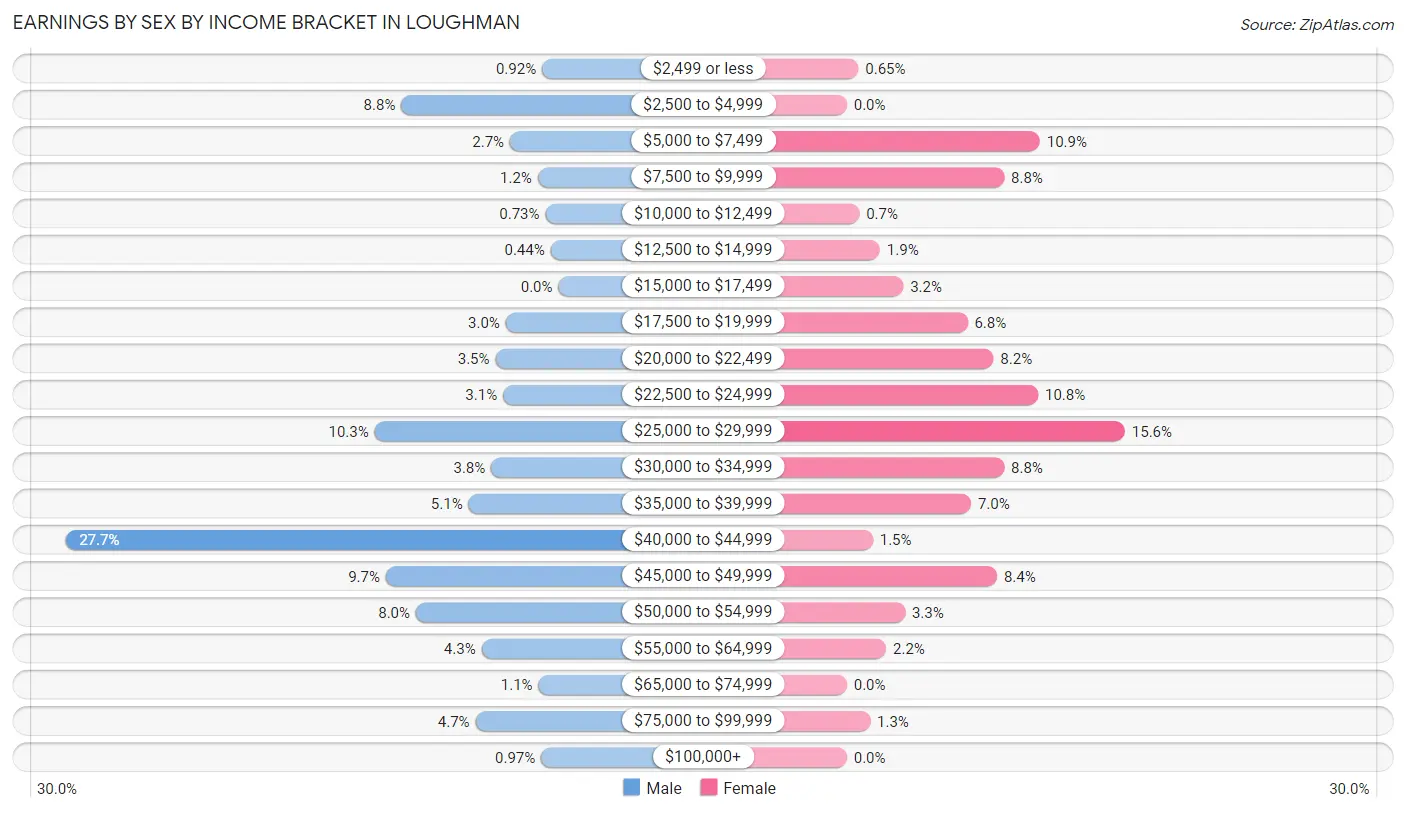
Earnings by Sex by Income Bracket in Loughman
The most common earnings brackets in Loughman are $40,000 to $44,999 for men (570 | 27.7%) and $25,000 to $29,999 for women (311 | 15.6%).
| Income | Male | Female |
| $2,499 or less | 19 (0.9%) | 13 (0.6%) |
| $2,500 to $4,999 | 182 (8.8%) | 0 (0.0%) |
| $5,000 to $7,499 | 56 (2.7%) | 216 (10.8%) |
| $7,500 to $9,999 | 24 (1.2%) | 176 (8.8%) |
| $10,000 to $12,499 | 15 (0.7%) | 14 (0.7%) |
| $12,500 to $14,999 | 9 (0.4%) | 37 (1.9%) |
| $15,000 to $17,499 | 0 (0.0%) | 63 (3.2%) |
| $17,500 to $19,999 | 61 (3.0%) | 135 (6.8%) |
| $20,000 to $22,499 | 73 (3.5%) | 164 (8.2%) |
| $22,500 to $24,999 | 64 (3.1%) | 214 (10.7%) |
| $25,000 to $29,999 | 213 (10.3%) | 311 (15.6%) |
| $30,000 to $34,999 | 78 (3.8%) | 176 (8.8%) |
| $35,000 to $39,999 | 104 (5.1%) | 139 (7.0%) |
| $40,000 to $44,999 | 570 (27.7%) | 29 (1.5%) |
| $45,000 to $49,999 | 200 (9.7%) | 168 (8.4%) |
| $50,000 to $54,999 | 165 (8.0%) | 65 (3.3%) |
| $55,000 to $64,999 | 89 (4.3%) | 44 (2.2%) |
| $65,000 to $74,999 | 23 (1.1%) | 0 (0.0%) |
| $75,000 to $99,999 | 96 (4.7%) | 26 (1.3%) |
| $100,000+ | 20 (1.0%) | 0 (0.0%) |
| Total | 2,061 (100.0%) | 1,990 (100.0%) |
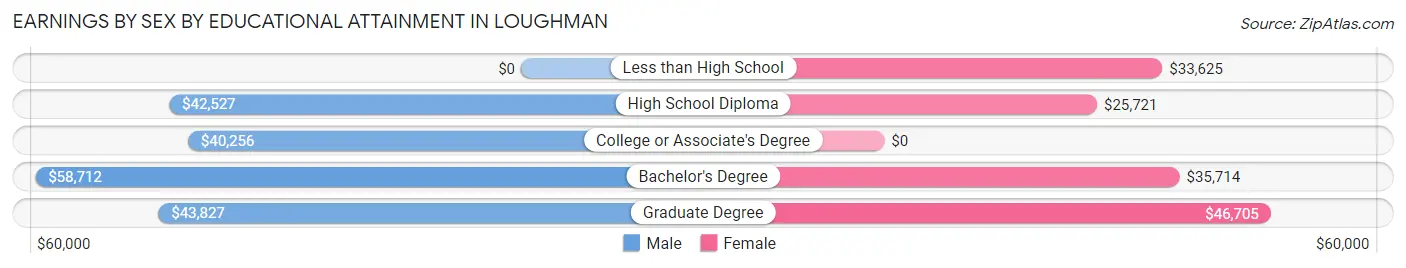
Earnings by Sex by Educational Attainment in Loughman
Average earnings in Loughman are $42,662 for men and $28,134 for women, a difference of 34.1%. Men with an educational attainment of bachelor's degree enjoy the highest average annual earnings of $58,712, while those with college or associate's degree education earn the least with $40,256. Women with an educational attainment of graduate degree earn the most with the average annual earnings of $46,705, while those with high school diploma education have the smallest earnings of $25,721.
| Educational Attainment | Male Income | Female Income |
| Less than High School | - | - |
| High School Diploma | $42,527 | $25,721 |
| College or Associate's Degree | $40,256 | $0 |
| Bachelor's Degree | $58,712 | $35,714 |
| Graduate Degree | $43,827 | $46,705 |
| Total | $42,662 | $28,134 |
Family Income in Loughman
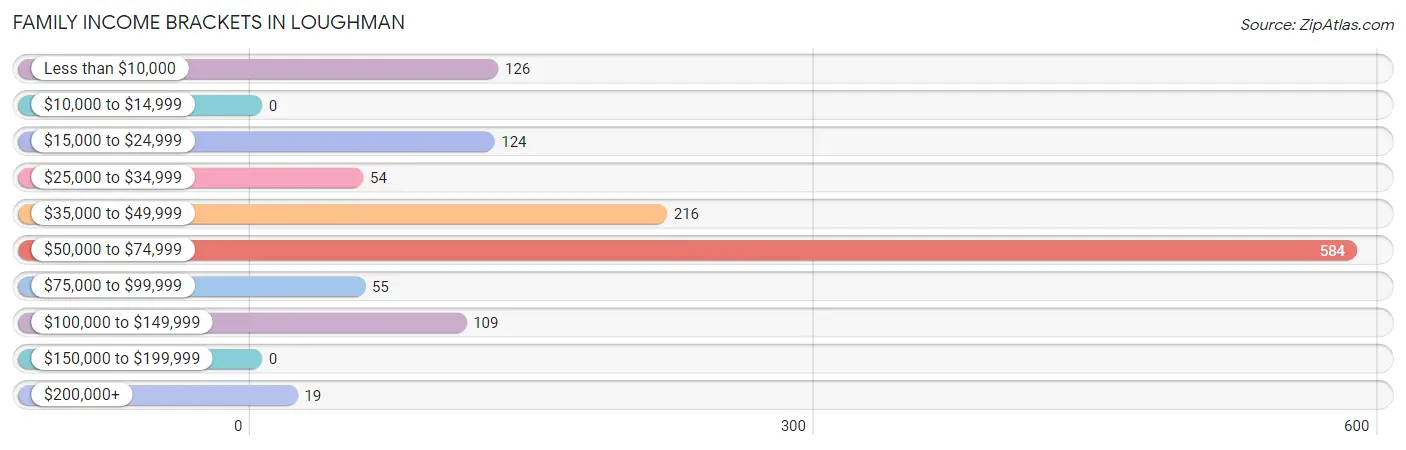
Family Income Brackets in Loughman
According to the Loughman family income data, there are 584 families falling into the $50,000 to $74,999 income range, which is the most common income bracket and makes up 45.4% of all families.
| Income Bracket | # Families | % Families |
| Less than $10,000 | 126 | 9.8% |
| $10,000 to $14,999 | 0 | 0.0% |
| $15,000 to $24,999 | 124 | 9.6% |
| $25,000 to $34,999 | 54 | 4.2% |
| $35,000 to $49,999 | 216 | 16.8% |
| $50,000 to $74,999 | 584 | 45.4% |
| $75,000 to $99,999 | 55 | 4.3% |
| $100,000 to $149,999 | 109 | 8.5% |
| $150,000 to $199,999 | 0 | 0.0% |
| $200,000+ | 19 | 1.5% |
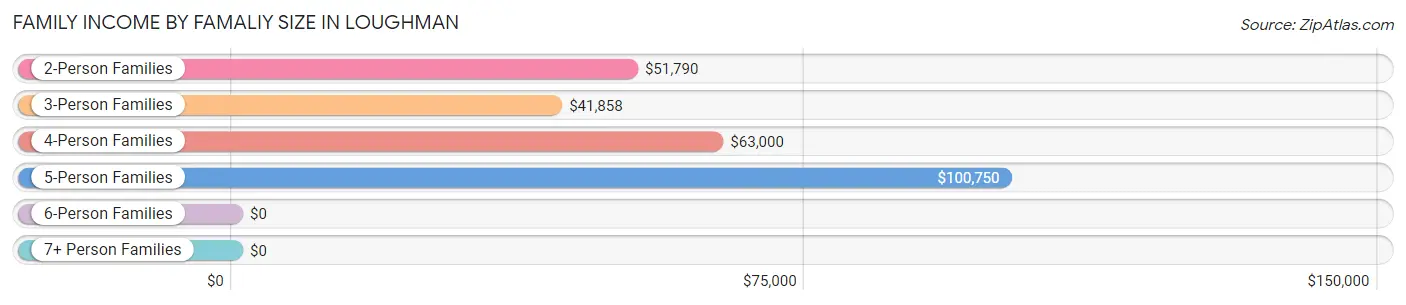
Family Income by Famaliy Size in Loughman
5-person families (69 | 5.4%) account for the highest median family income in Loughman with $100,750 per family, while 2-person families (595 | 46.2%) have the highest median income of $25,895 per family member.
| Income Bracket | # Families | Median Income |
| 2-Person Families | 595 (46.2%) | $51,790 |
| 3-Person Families | 477 (37.1%) | $41,858 |
| 4-Person Families | 136 (10.6%) | $63,000 |
| 5-Person Families | 69 (5.4%) | $100,750 |
| 6-Person Families | 10 (0.8%) | $0 |
| 7+ Person Families | 0 (0.0%) | $0 |
| Total | 1,287 (100.0%) | $51,360 |
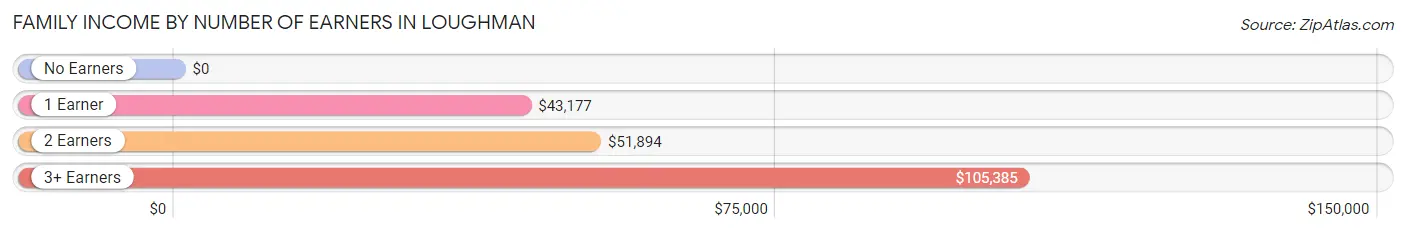
Family Income by Number of Earners in Loughman
| Number of Earners | # Families | Median Income |
| No Earners | 268 (20.8%) | $0 |
| 1 Earner | 369 (28.7%) | $43,177 |
| 2 Earners | 608 (47.2%) | $51,894 |
| 3+ Earners | 42 (3.3%) | $105,385 |
| Total | 1,287 (100.0%) | $51,360 |
Household Income in Loughman
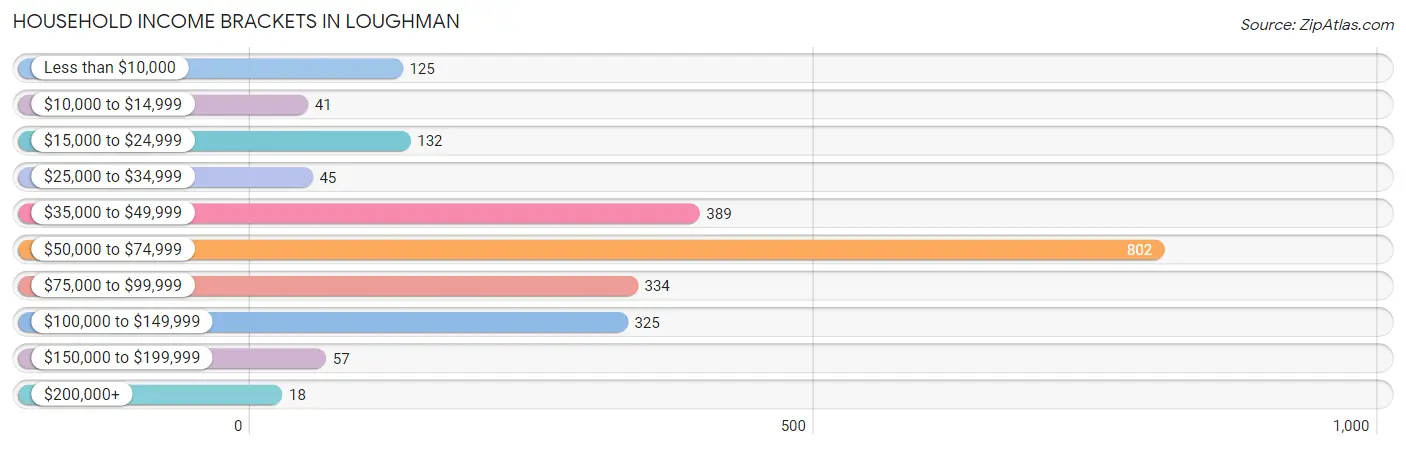
Household Income Brackets in Loughman
With 802 households falling in the category, the $50,000 to $74,999 income range is the most frequent in Loughman, accounting for 35.3% of all households. In contrast, only 18 households (0.8%) fall into the $200,000+ income bracket, making it the least populous group.
| Income Bracket | # Households | % Households |
| Less than $10,000 | 125 | 5.5% |
| $10,000 to $14,999 | 41 | 1.8% |
| $15,000 to $24,999 | 132 | 5.8% |
| $25,000 to $34,999 | 45 | 2.0% |
| $35,000 to $49,999 | 389 | 17.1% |
| $50,000 to $74,999 | 802 | 35.3% |
| $75,000 to $99,999 | 334 | 14.7% |
| $100,000 to $149,999 | 325 | 14.3% |
| $150,000 to $199,999 | 57 | 2.5% |
| $200,000+ | 18 | 0.8% |
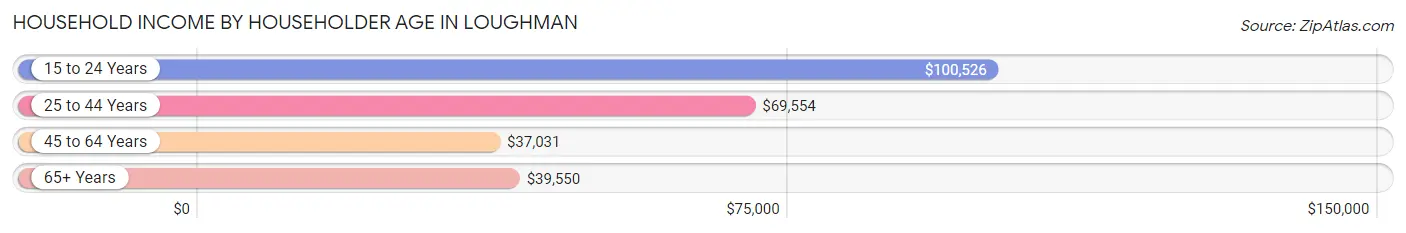
Household Income by Householder Age in Loughman
The median household income in Loughman is $54,944, with the highest median household income of $100,526 found in the 15 to 24 years age bracket for the primary householder. A total of 208 households (9.1%) fall into this category. Meanwhile, the 45 to 64 years age bracket for the primary householder has the lowest median household income of $37,031, with 663 households (29.2%) in this group.
| Income Bracket | # Households | Median Income |
| 15 to 24 Years | 208 (9.1%) | $100,526 |
| 25 to 44 Years | 1,020 (44.9%) | $69,554 |
| 45 to 64 Years | 663 (29.2%) | $37,031 |
| 65+ Years | 381 (16.8%) | $39,550 |
| Total | 2,272 (100.0%) | $54,944 |
Poverty in Loughman
Income Below Poverty by Sex and Age in Loughman
With 5.8% poverty level for males and 11.5% for females among the residents of Loughman, 6 to 11 year old males and 12 to 14 year old females are the most vulnerable to poverty, with 22 males (16.8%) and 123 females (65.8%) in their respective age groups living below the poverty level.
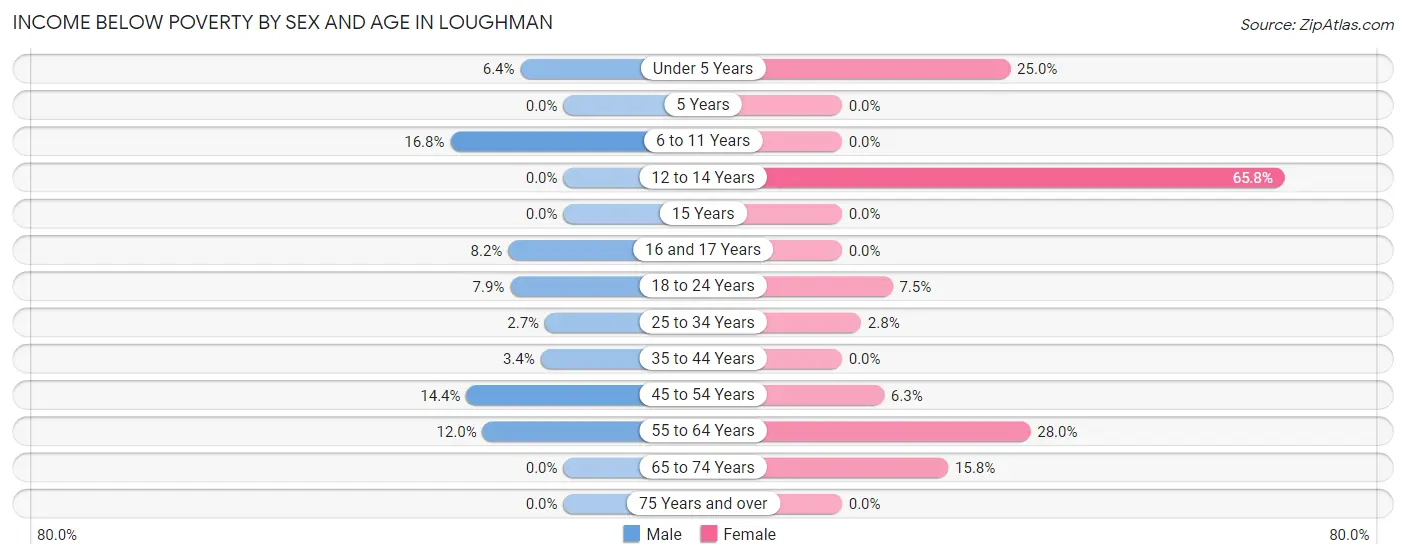
| Age Bracket | Male | Female |
| Under 5 Years | 27 (6.4%) | 19 (25.0%) |
| 5 Years | 0 (0.0%) | 0 (0.0%) |
| 6 to 11 Years | 22 (16.8%) | 0 (0.0%) |
| 12 to 14 Years | 0 (0.0%) | 123 (65.8%) |
| 15 Years | 0 (0.0%) | 0 (0.0%) |
| 16 and 17 Years | 14 (8.2%) | 0 (0.0%) |
| 18 to 24 Years | 33 (7.9%) | 37 (7.5%) |
| 25 to 34 Years | 24 (2.7%) | 22 (2.8%) |
| 35 to 44 Years | 20 (3.4%) | 0 (0.0%) |
| 45 to 54 Years | 18 (14.4%) | 20 (6.2%) |
| 55 to 64 Years | 27 (12.0%) | 124 (28.0%) |
| 65 to 74 Years | 0 (0.0%) | 15 (15.8%) |
| 75 Years and over | 0 (0.0%) | 0 (0.0%) |
| Total | 185 (5.8%) | 360 (11.5%) |
Income Above Poverty by Sex and Age in Loughman
According to the poverty statistics in Loughman, males aged 12 to 14 years and females aged 5 years are the age groups that are most secure financially, with 100.0% of males and 100.0% of females in these age groups living above the poverty line.
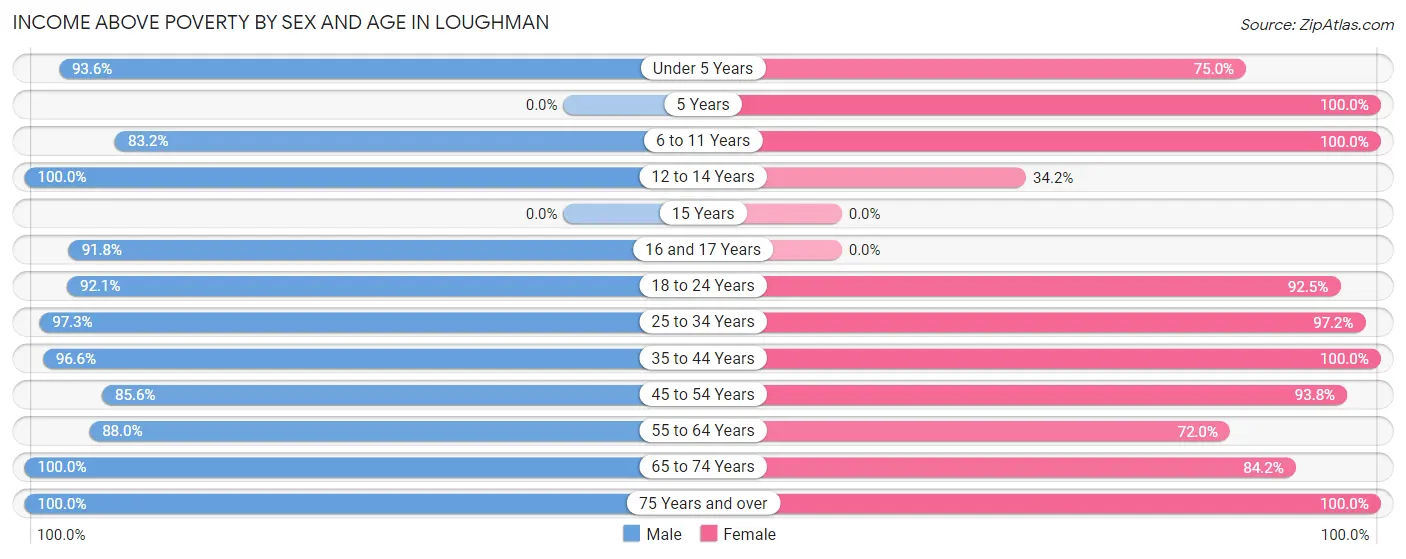
| Age Bracket | Male | Female |
| Under 5 Years | 396 (93.6%) | 57 (75.0%) |
| 5 Years | 0 (0.0%) | 32 (100.0%) |
| 6 to 11 Years | 109 (83.2%) | 216 (100.0%) |
| 12 to 14 Years | 33 (100.0%) | 64 (34.2%) |
| 15 Years | 0 (0.0%) | 0 (0.0%) |
| 16 and 17 Years | 157 (91.8%) | 0 (0.0%) |
| 18 to 24 Years | 385 (92.1%) | 455 (92.5%) |
| 25 to 34 Years | 855 (97.3%) | 754 (97.2%) |
| 35 to 44 Years | 572 (96.6%) | 142 (100.0%) |
| 45 to 54 Years | 107 (85.6%) | 300 (93.8%) |
| 55 to 64 Years | 198 (88.0%) | 319 (72.0%) |
| 65 to 74 Years | 92 (100.0%) | 80 (84.2%) |
| 75 Years and over | 88 (100.0%) | 340 (100.0%) |
| Total | 2,992 (94.2%) | 2,759 (88.5%) |
Income Below Poverty Among Married-Couple Families in Loughman
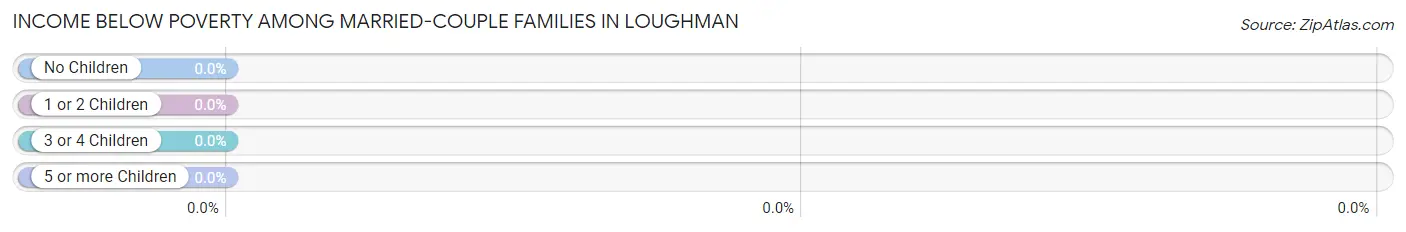
| Children | Above Poverty | Below Poverty |
| No Children | 504 (100.0%) | 0 (0.0%) |
| 1 or 2 Children | 122 (100.0%) | 0 (0.0%) |
| 3 or 4 Children | 35 (100.0%) | 0 (0.0%) |
| 5 or more Children | 0 (0.0%) | 0 (0.0%) |
| Total | 661 (100.0%) | 0 (0.0%) |
Income Below Poverty Among Single-Parent Households in Loughman
According to the poverty data in Loughman, 8.3% or 24 single-father households and 34.8% or 117 single-mother households are living below the poverty line. Among single-father households, those with 1 or 2 children have the highest poverty rate, with 24 households (9.5%) experiencing poverty. Likewise, among single-mother households, those with 1 or 2 children have the highest poverty rate, with 117 households (41.8%) falling below the poverty line.
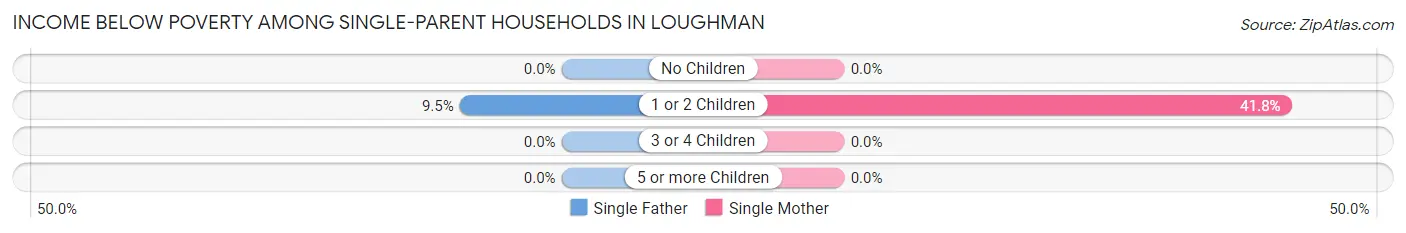
| Children | Single Father | Single Mother |
| No Children | 0 (0.0%) | 0 (0.0%) |
| 1 or 2 Children | 24 (9.5%) | 117 (41.8%) |
| 3 or 4 Children | 0 (0.0%) | 0 (0.0%) |
| 5 or more Children | 0 (0.0%) | 0 (0.0%) |
| Total | 24 (8.3%) | 117 (34.8%) |
Income Below Poverty Among Married-Couple vs Single-Parent Households in Loughman
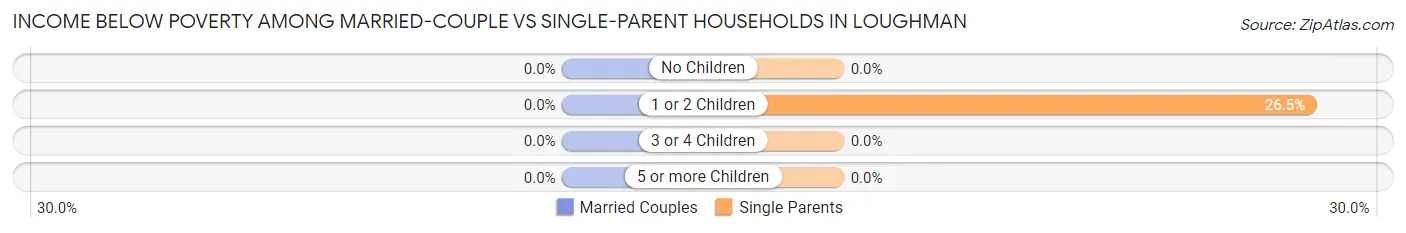
| Children | Married-Couple Families | Single-Parent Households |
| No Children | 0 (0.0%) | 0 (0.0%) |
| 1 or 2 Children | 0 (0.0%) | 141 (26.5%) |
| 3 or 4 Children | 0 (0.0%) | 0 (0.0%) |
| 5 or more Children | 0 (0.0%) | 0 (0.0%) |
| Total | 0 (0.0%) | 141 (22.5%) |
Employment Characteristics in Loughman
Employment by Class of Employer in Loughman
Among the 3,712 employed individuals in Loughman, private company employees (2,948 | 79.4%), self-employed (not incorporated) (379 | 10.2%), and local government employees (274 | 7.4%) make up the most common classes of employment.
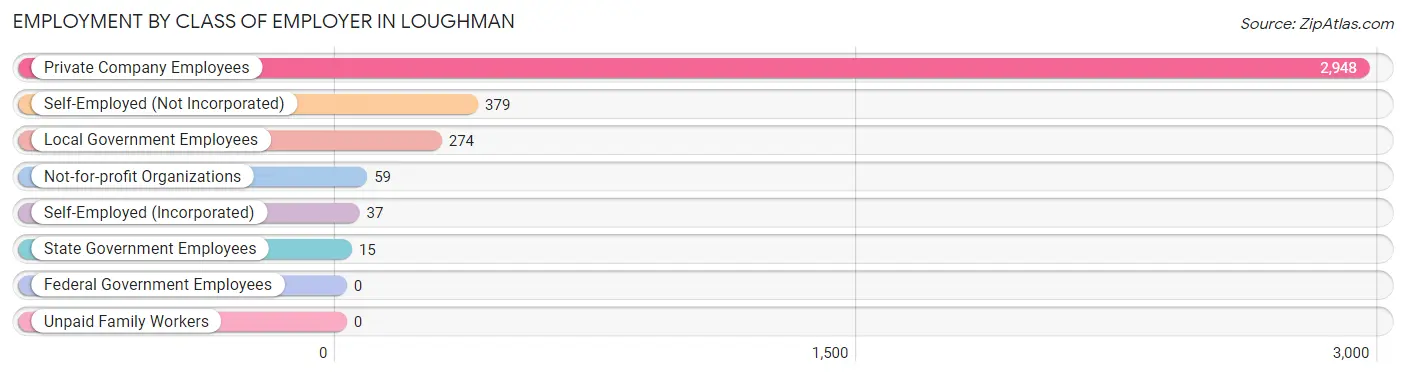
| Employer Class | # Employees | % Employees |
| Private Company Employees | 2,948 | 79.4% |
| Self-Employed (Incorporated) | 37 | 1.0% |
| Self-Employed (Not Incorporated) | 379 | 10.2% |
| Not-for-profit Organizations | 59 | 1.6% |
| Local Government Employees | 274 | 7.4% |
| State Government Employees | 15 | 0.4% |
| Federal Government Employees | 0 | 0.0% |
| Unpaid Family Workers | 0 | 0.0% |
| Total | 3,712 | 100.0% |
Employment Status by Age in Loughman
According to the labor force statistics for Loughman, out of the total population over 16 years of age (5,198), 73.2% or 3,805 individuals are in the labor force, with 2.4% or 91 of them unemployed. The age group with the highest labor force participation rate is 20 to 24 years, with 95.1% or 754 individuals in the labor force. Within the labor force, the 55 to 59 years age range has the highest percentage of unemployed individuals, with 11.1% or 13 of them being unemployed.
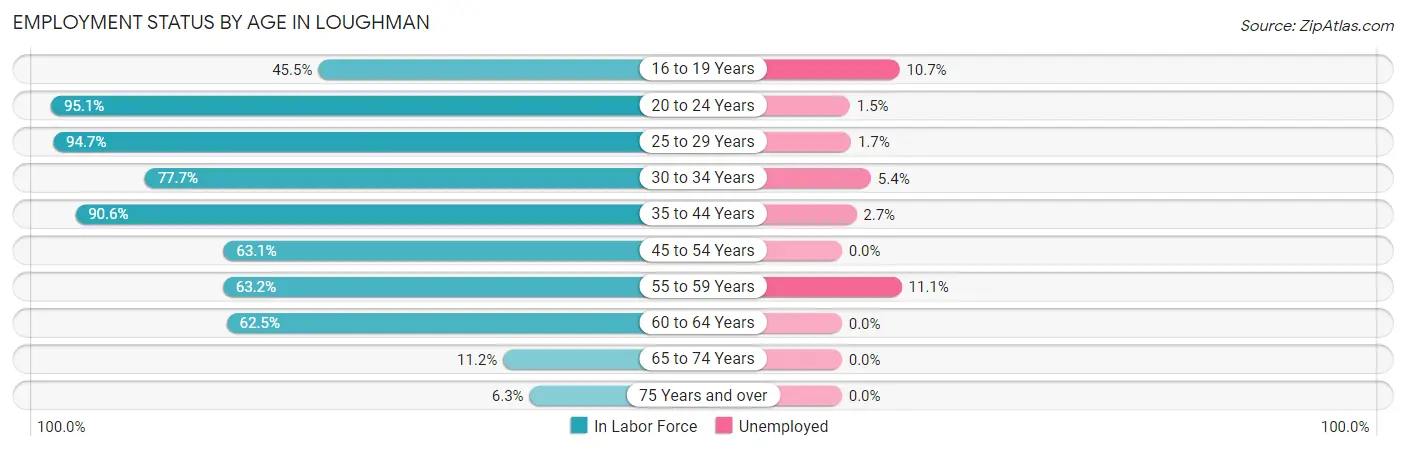
| Age Bracket | In Labor Force | Unemployed |
| 16 to 19 Years | 131 (45.5%) | 14 (10.7%) |
| 20 to 24 Years | 754 (95.1%) | 11 (1.5%) |
| 25 to 29 Years | 1,227 (94.7%) | 21 (1.7%) |
| 30 to 34 Years | 279 (77.7%) | 15 (5.4%) |
| 35 to 44 Years | 665 (90.6%) | 18 (2.7%) |
| 45 to 54 Years | 281 (63.1%) | 0 (0.0%) |
| 55 to 59 Years | 117 (63.2%) | 13 (11.1%) |
| 60 to 64 Years | 302 (62.5%) | 0 (0.0%) |
| 65 to 74 Years | 21 (11.2%) | 0 (0.0%) |
| 75 Years and over | 27 (6.3%) | 0 (0.0%) |
| Total | 3,805 (73.2%) | 91 (2.4%) |
Employment Status by Educational Attainment in Loughman
According to labor force statistics for Loughman, 82.0% of individuals (2,872) out of the total population between 25 and 64 years of age (3,502) are in the labor force, with 2.3% or 66 of them being unemployed. The group with the highest labor force participation rate are those with the educational attainment of college / associate degree, with 89.9% or 1,027 individuals in the labor force. Within the labor force, individuals with high school diploma education have the highest percentage of unemployment, with 6.4% or 54 of them being unemployed.
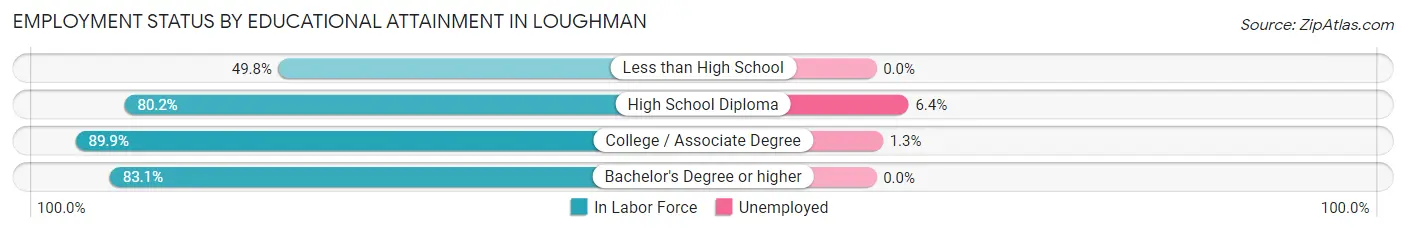
| Educational Attainment | In Labor Force | Unemployed |
| Less than High School | 129 (49.8%) | 0 (0.0%) |
| High School Diploma | 850 (80.2%) | 68 (6.4%) |
| College / Associate Degree | 1,027 (89.9%) | 15 (1.3%) |
| Bachelor's Degree or higher | 865 (83.1%) | 0 (0.0%) |
| Total | 2,872 (82.0%) | 81 (2.3%) |
Employment Occupations by Sex in Loughman
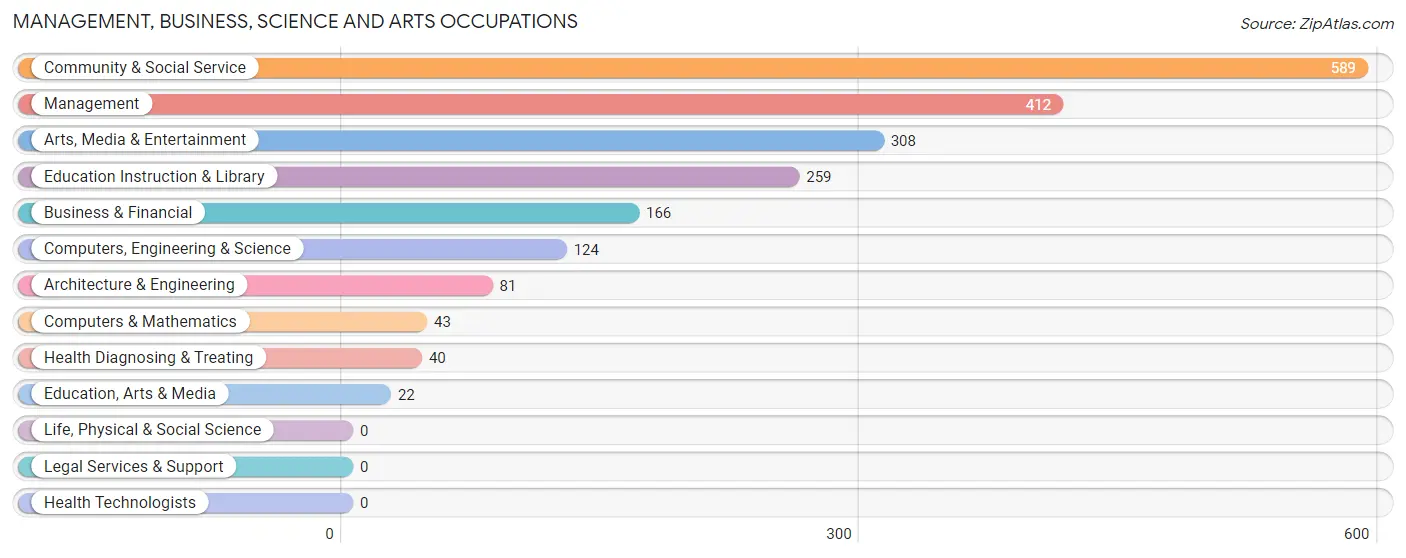
Management, Business, Science and Arts Occupations
The most common Management, Business, Science and Arts occupations in Loughman are Community & Social Service (589 | 15.9%), Management (412 | 11.1%), Arts, Media & Entertainment (308 | 8.3%), Education Instruction & Library (259 | 7.0%), and Business & Financial (166 | 4.5%).
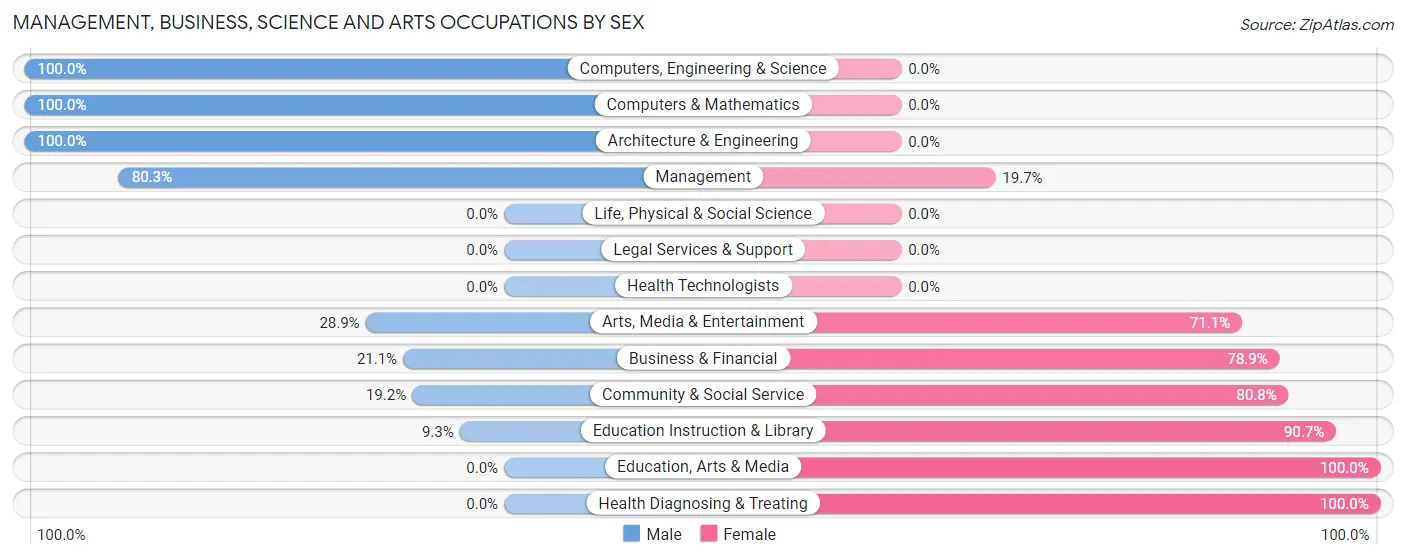
Management, Business, Science and Arts Occupations by Sex
Within the Management, Business, Science and Arts occupations in Loughman, the most male-oriented occupations are Computers, Engineering & Science (100.0%), Computers & Mathematics (100.0%), and Architecture & Engineering (100.0%), while the most female-oriented occupations are Education, Arts & Media (100.0%), Health Diagnosing & Treating (100.0%), and Education Instruction & Library (90.7%).
| Occupation | Male | Female |
| Management | 331 (80.3%) | 81 (19.7%) |
| Business & Financial | 35 (21.1%) | 131 (78.9%) |
| Computers, Engineering & Science | 124 (100.0%) | 0 (0.0%) |
| Computers & Mathematics | 43 (100.0%) | 0 (0.0%) |
| Architecture & Engineering | 81 (100.0%) | 0 (0.0%) |
| Life, Physical & Social Science | 0 (0.0%) | 0 (0.0%) |
| Community & Social Service | 113 (19.2%) | 476 (80.8%) |
| Education, Arts & Media | 0 (0.0%) | 22 (100.0%) |
| Legal Services & Support | 0 (0.0%) | 0 (0.0%) |
| Education Instruction & Library | 24 (9.3%) | 235 (90.7%) |
| Arts, Media & Entertainment | 89 (28.9%) | 219 (71.1%) |
| Health Diagnosing & Treating | 0 (0.0%) | 40 (100.0%) |
| Health Technologists | 0 (0.0%) | 0 (0.0%) |
| Total (Category) | 603 (45.3%) | 728 (54.7%) |
| Total (Overall) | 1,940 (52.3%) | 1,772 (47.7%) |
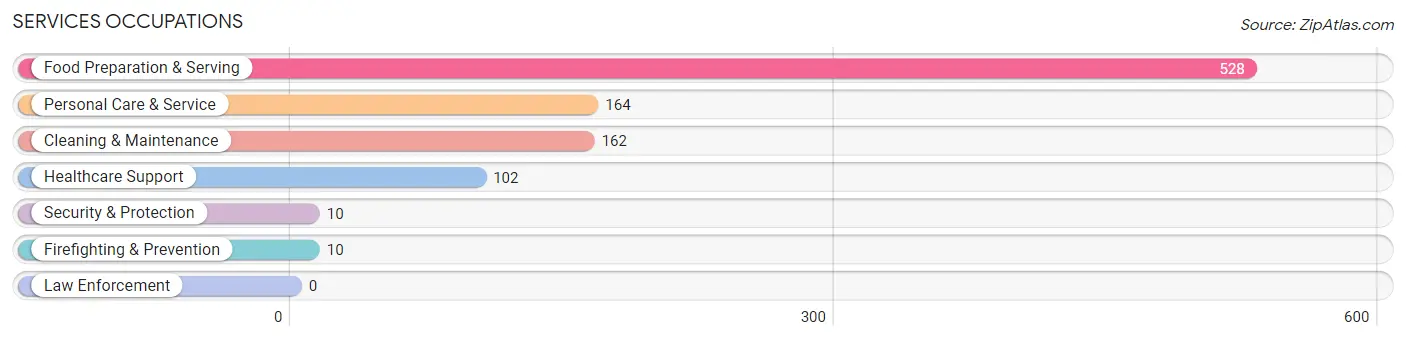
Services Occupations
The most common Services occupations in Loughman are Food Preparation & Serving (528 | 14.2%), Personal Care & Service (164 | 4.4%), Cleaning & Maintenance (162 | 4.4%), Healthcare Support (102 | 2.8%), and Security & Protection (10 | 0.3%).
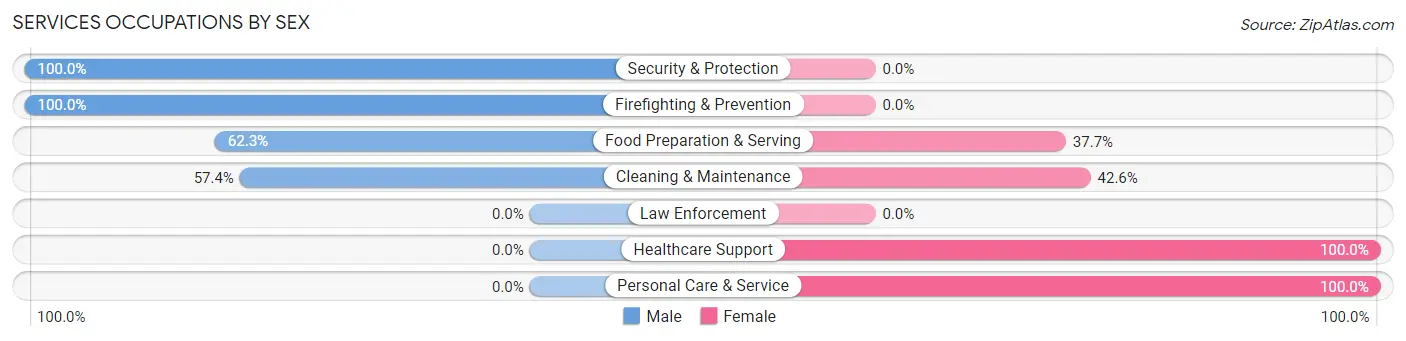
Services Occupations by Sex
Within the Services occupations in Loughman, the most male-oriented occupations are Security & Protection (100.0%), Firefighting & Prevention (100.0%), and Food Preparation & Serving (62.3%), while the most female-oriented occupations are Healthcare Support (100.0%), Personal Care & Service (100.0%), and Cleaning & Maintenance (42.6%).
| Occupation | Male | Female |
| Healthcare Support | 0 (0.0%) | 102 (100.0%) |
| Security & Protection | 10 (100.0%) | 0 (0.0%) |
| Firefighting & Prevention | 10 (100.0%) | 0 (0.0%) |
| Law Enforcement | 0 (0.0%) | 0 (0.0%) |
| Food Preparation & Serving | 329 (62.3%) | 199 (37.7%) |
| Cleaning & Maintenance | 93 (57.4%) | 69 (42.6%) |
| Personal Care & Service | 0 (0.0%) | 164 (100.0%) |
| Total (Category) | 432 (44.7%) | 534 (55.3%) |
| Total (Overall) | 1,940 (52.3%) | 1,772 (47.7%) |
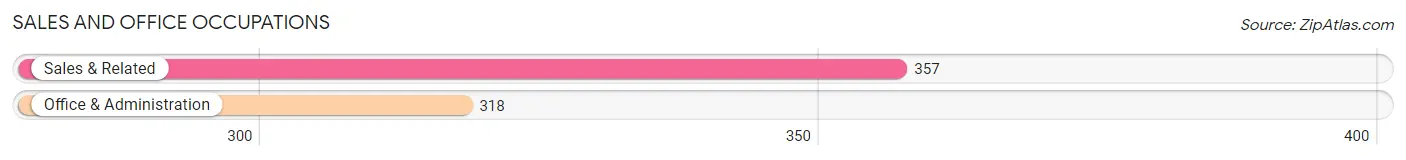
Sales and Office Occupations
The most common Sales and Office occupations in Loughman are Sales & Related (357 | 9.6%), and Office & Administration (318 | 8.6%).
Sales and Office Occupations by Sex
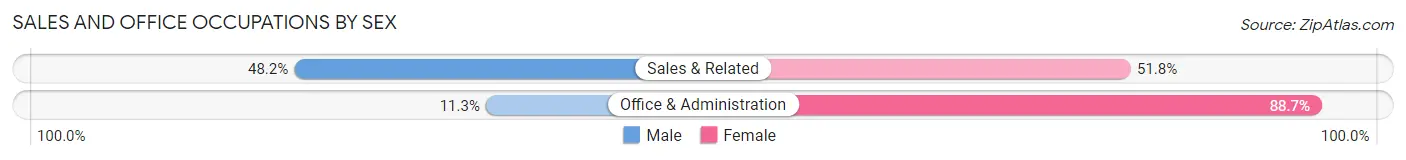
| Occupation | Male | Female |
| Sales & Related | 172 (48.2%) | 185 (51.8%) |
| Office & Administration | 36 (11.3%) | 282 (88.7%) |
| Total (Category) | 208 (30.8%) | 467 (69.2%) |
| Total (Overall) | 1,940 (52.3%) | 1,772 (47.7%) |
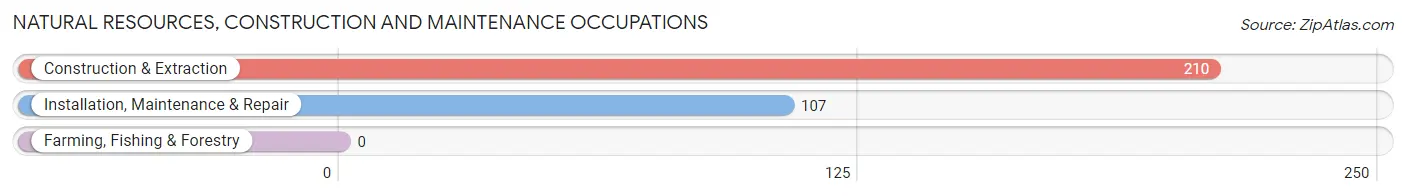
Natural Resources, Construction and Maintenance Occupations
The most common Natural Resources, Construction and Maintenance occupations in Loughman are Construction & Extraction (210 | 5.7%), and Installation, Maintenance & Repair (107 | 2.9%).
Natural Resources, Construction and Maintenance Occupations by Sex
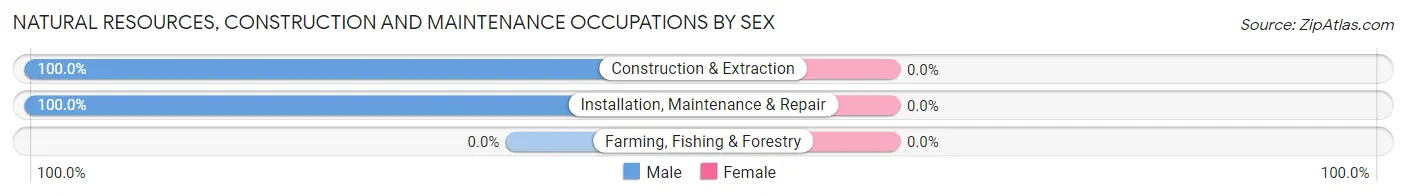
| Occupation | Male | Female |
| Farming, Fishing & Forestry | 0 (0.0%) | 0 (0.0%) |
| Construction & Extraction | 210 (100.0%) | 0 (0.0%) |
| Installation, Maintenance & Repair | 107 (100.0%) | 0 (0.0%) |
| Total (Category) | 317 (100.0%) | 0 (0.0%) |
| Total (Overall) | 1,940 (52.3%) | 1,772 (47.7%) |
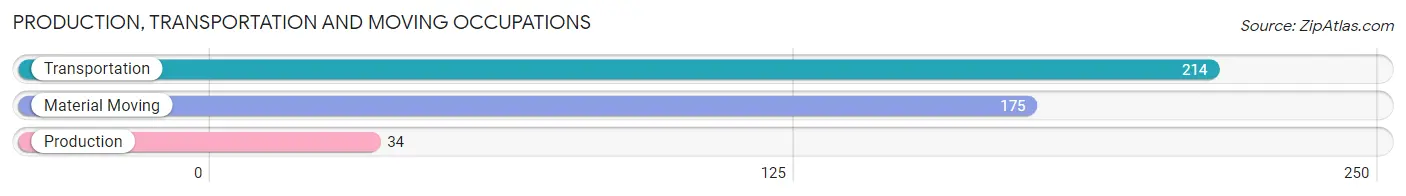
Production, Transportation and Moving Occupations
The most common Production, Transportation and Moving occupations in Loughman are Transportation (214 | 5.8%), Material Moving (175 | 4.7%), and Production (34 | 0.9%).
Production, Transportation and Moving Occupations by Sex
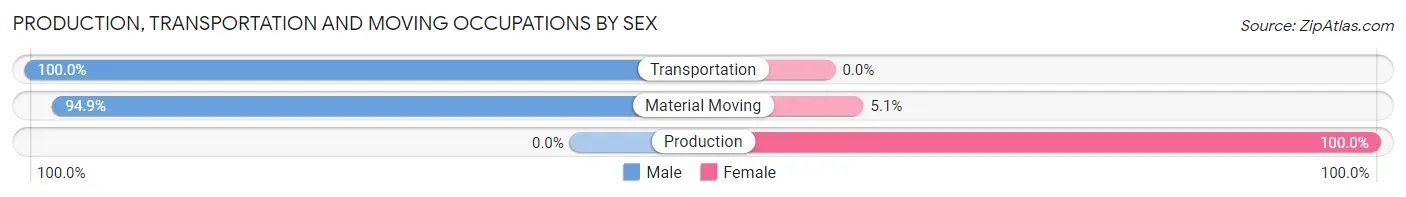
| Occupation | Male | Female |
| Production | 0 (0.0%) | 34 (100.0%) |
| Transportation | 214 (100.0%) | 0 (0.0%) |
| Material Moving | 166 (94.9%) | 9 (5.1%) |
| Total (Category) | 380 (89.8%) | 43 (10.2%) |
| Total (Overall) | 1,940 (52.3%) | 1,772 (47.7%) |
Employment Industries by Sex in Loughman
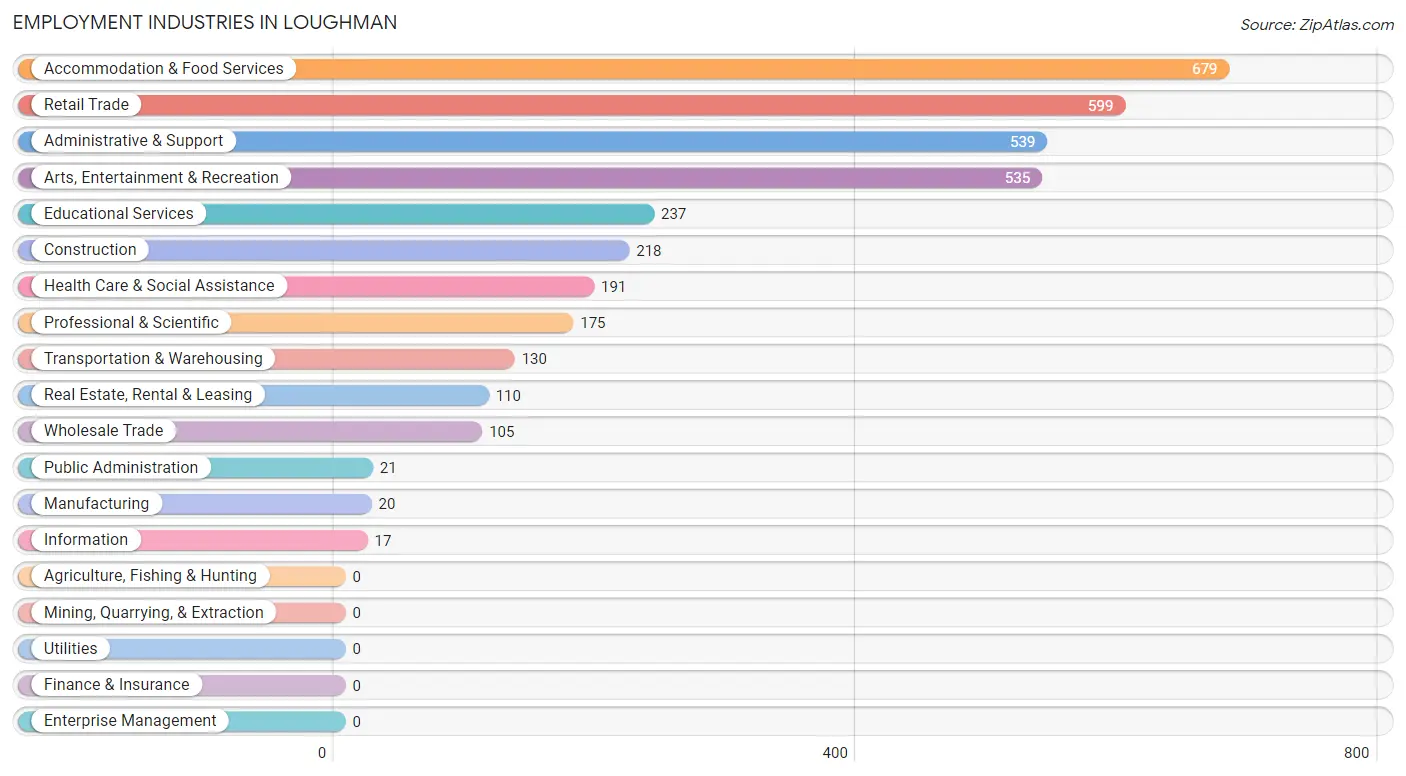
Employment Industries in Loughman
The major employment industries in Loughman include Accommodation & Food Services (679 | 18.3%), Retail Trade (599 | 16.1%), Administrative & Support (539 | 14.5%), Arts, Entertainment & Recreation (535 | 14.4%), and Educational Services (237 | 6.4%).
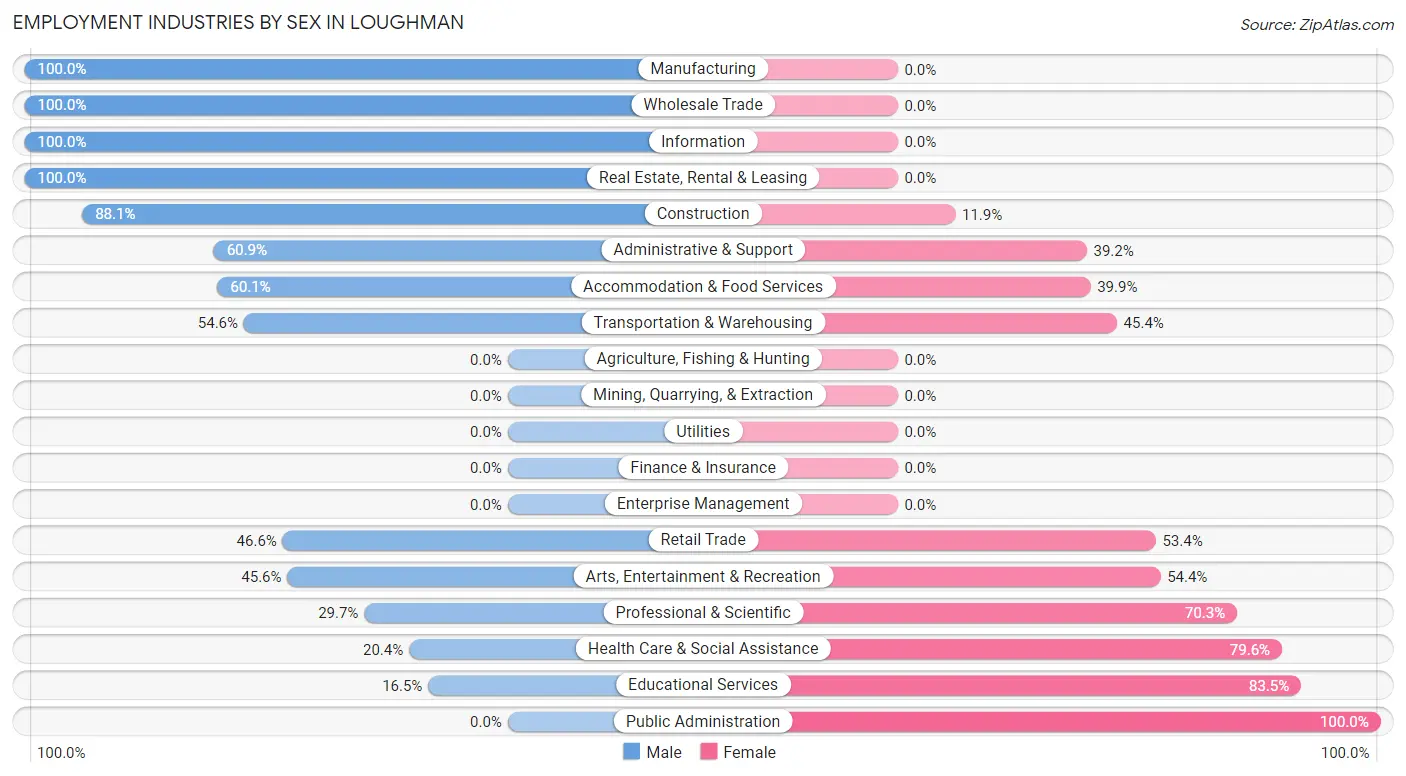
Employment Industries by Sex in Loughman
The Loughman industries that see more men than women are Manufacturing (100.0%), Wholesale Trade (100.0%), and Information (100.0%), whereas the industries that tend to have a higher number of women are Public Administration (100.0%), Educational Services (83.5%), and Health Care & Social Assistance (79.6%).
| Industry | Male | Female |
| Agriculture, Fishing & Hunting | 0 (0.0%) | 0 (0.0%) |
| Mining, Quarrying, & Extraction | 0 (0.0%) | 0 (0.0%) |
| Construction | 192 (88.1%) | 26 (11.9%) |
| Manufacturing | 20 (100.0%) | 0 (0.0%) |
| Wholesale Trade | 105 (100.0%) | 0 (0.0%) |
| Retail Trade | 279 (46.6%) | 320 (53.4%) |
| Transportation & Warehousing | 71 (54.6%) | 59 (45.4%) |
| Utilities | 0 (0.0%) | 0 (0.0%) |
| Information | 17 (100.0%) | 0 (0.0%) |
| Finance & Insurance | 0 (0.0%) | 0 (0.0%) |
| Real Estate, Rental & Leasing | 110 (100.0%) | 0 (0.0%) |
| Professional & Scientific | 52 (29.7%) | 123 (70.3%) |
| Enterprise Management | 0 (0.0%) | 0 (0.0%) |
| Administrative & Support | 328 (60.9%) | 211 (39.2%) |
| Educational Services | 39 (16.5%) | 198 (83.5%) |
| Health Care & Social Assistance | 39 (20.4%) | 152 (79.6%) |
| Arts, Entertainment & Recreation | 244 (45.6%) | 291 (54.4%) |
| Accommodation & Food Services | 408 (60.1%) | 271 (39.9%) |
| Public Administration | 0 (0.0%) | 21 (100.0%) |
| Total | 1,940 (52.3%) | 1,772 (47.7%) |
Education in Loughman
School Enrollment in Loughman
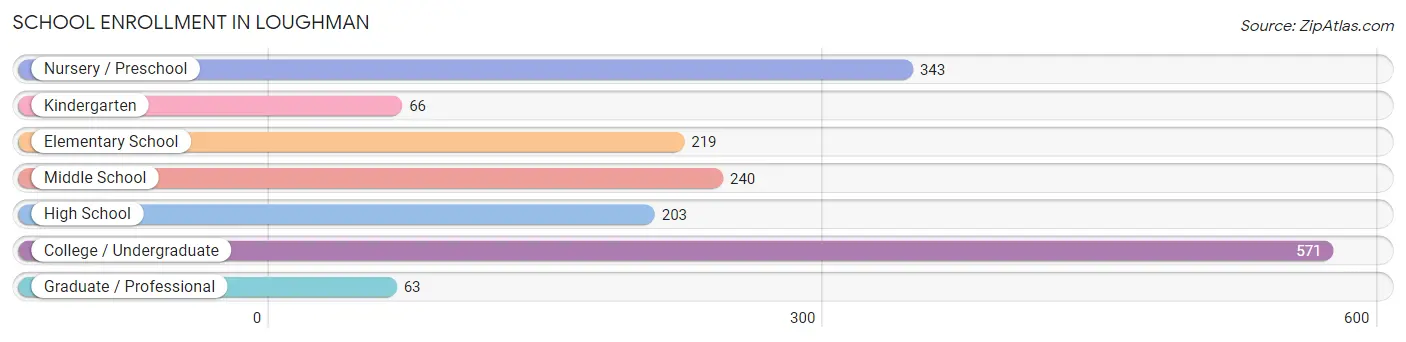
The most common levels of schooling among the 1,705 students in Loughman are college / undergraduate (571 | 33.5%), nursery / preschool (343 | 20.1%), and middle school (240 | 14.1%).
| School Level | # Students | % Students |
| Nursery / Preschool | 343 | 20.1% |
| Kindergarten | 66 | 3.9% |
| Elementary School | 219 | 12.8% |
| Middle School | 240 | 14.1% |
| High School | 203 | 11.9% |
| College / Undergraduate | 571 | 33.5% |
| Graduate / Professional | 63 | 3.7% |
| Total | 1,705 | 100.0% |
School Enrollment by Age by Funding Source in Loughman
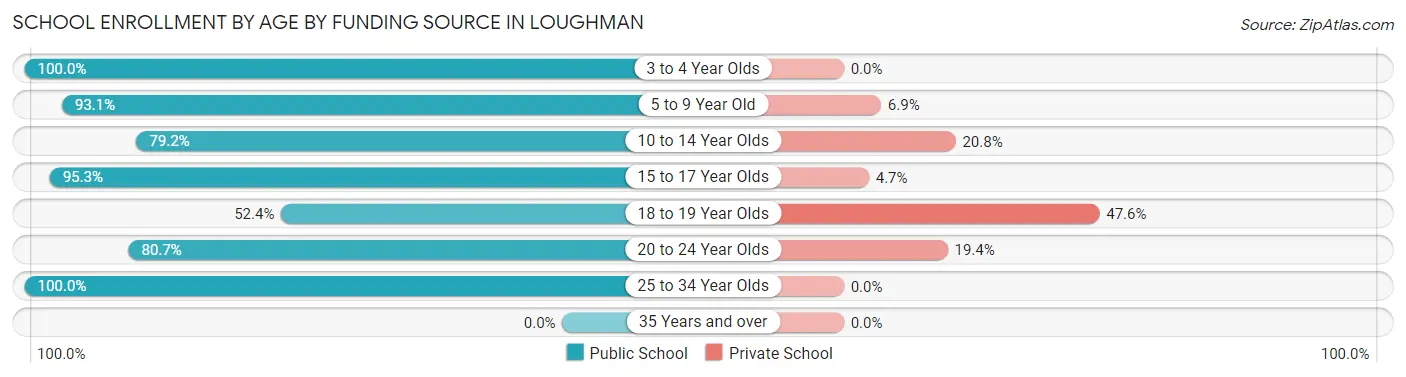
Out of a total of 1,705 students who are enrolled in schools in Loughman, 119 (7.0%) attend a private institution, while the remaining 1,586 (93.0%) are enrolled in public schools. The age group of 18 to 19 year olds has the highest likelihood of being enrolled in private schools, with 10 (47.6% in the age bracket) enrolled. Conversely, the age group of 3 to 4 year olds has the lowest likelihood of being enrolled in a private school, with 311 (100.0% in the age bracket) attending a public institution.
| Age Bracket | Public School | Private School |
| 3 to 4 Year Olds | 311 (100.0%) | 0 (0.0%) |
| 5 to 9 Year Old | 295 (93.1%) | 22 (6.9%) |
| 10 to 14 Year Olds | 190 (79.2%) | 50 (20.8%) |
| 15 to 17 Year Olds | 163 (95.3%) | 8 (4.7%) |
| 18 to 19 Year Olds | 11 (52.4%) | 10 (47.6%) |
| 20 to 24 Year Olds | 125 (80.6%) | 30 (19.4%) |
| 25 to 34 Year Olds | 490 (100.0%) | 0 (0.0%) |
| 35 Years and over | 0 (0.0%) | 0 (0.0%) |
| Total | 1,586 (93.0%) | 119 (7.0%) |
Educational Attainment by Field of Study in Loughman
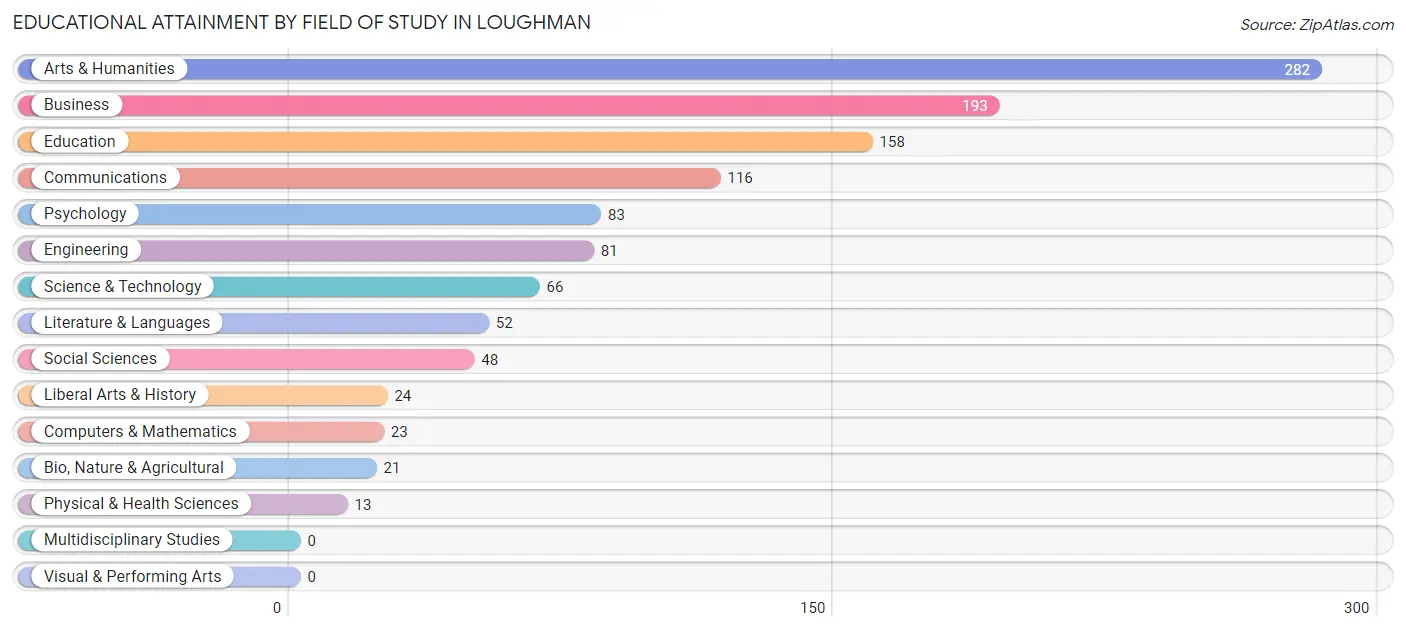
Arts & humanities (282 | 24.3%), business (193 | 16.6%), education (158 | 13.6%), communications (116 | 10.0%), and psychology (83 | 7.2%) are the most common fields of study among 1,160 individuals in Loughman who have obtained a bachelor's degree or higher.
| Field of Study | # Graduates | % Graduates |
| Computers & Mathematics | 23 | 2.0% |
| Bio, Nature & Agricultural | 21 | 1.8% |
| Physical & Health Sciences | 13 | 1.1% |
| Psychology | 83 | 7.2% |
| Social Sciences | 48 | 4.1% |
| Engineering | 81 | 7.0% |
| Multidisciplinary Studies | 0 | 0.0% |
| Science & Technology | 66 | 5.7% |
| Business | 193 | 16.6% |
| Education | 158 | 13.6% |
| Literature & Languages | 52 | 4.5% |
| Liberal Arts & History | 24 | 2.1% |
| Visual & Performing Arts | 0 | 0.0% |
| Communications | 116 | 10.0% |
| Arts & Humanities | 282 | 24.3% |
| Total | 1,160 | 100.0% |
Transportation & Commute in Loughman
Vehicle Availability by Sex in Loughman
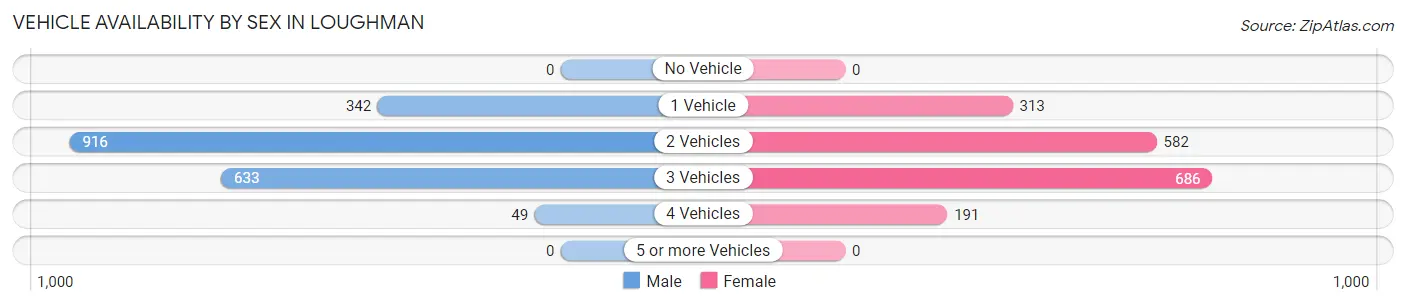
The most prevalent vehicle ownership categories in Loughman are males with 2 vehicles (916, accounting for 47.2%) and females with 2 vehicles (582, making up 51.7%).
| Vehicles Available | Male | Female |
| No Vehicle | 0 (0.0%) | 0 (0.0%) |
| 1 Vehicle | 342 (17.6%) | 313 (17.7%) |
| 2 Vehicles | 916 (47.2%) | 582 (32.8%) |
| 3 Vehicles | 633 (32.6%) | 686 (38.7%) |
| 4 Vehicles | 49 (2.5%) | 191 (10.8%) |
| 5 or more Vehicles | 0 (0.0%) | 0 (0.0%) |
| Total | 1,940 (100.0%) | 1,772 (100.0%) |
Commute Time in Loughman
The most frequently occuring commute durations in Loughman are 30 to 34 minutes (759 commuters, 23.1%), 25 to 29 minutes (566 commuters, 17.2%), and 20 to 24 minutes (549 commuters, 16.7%).
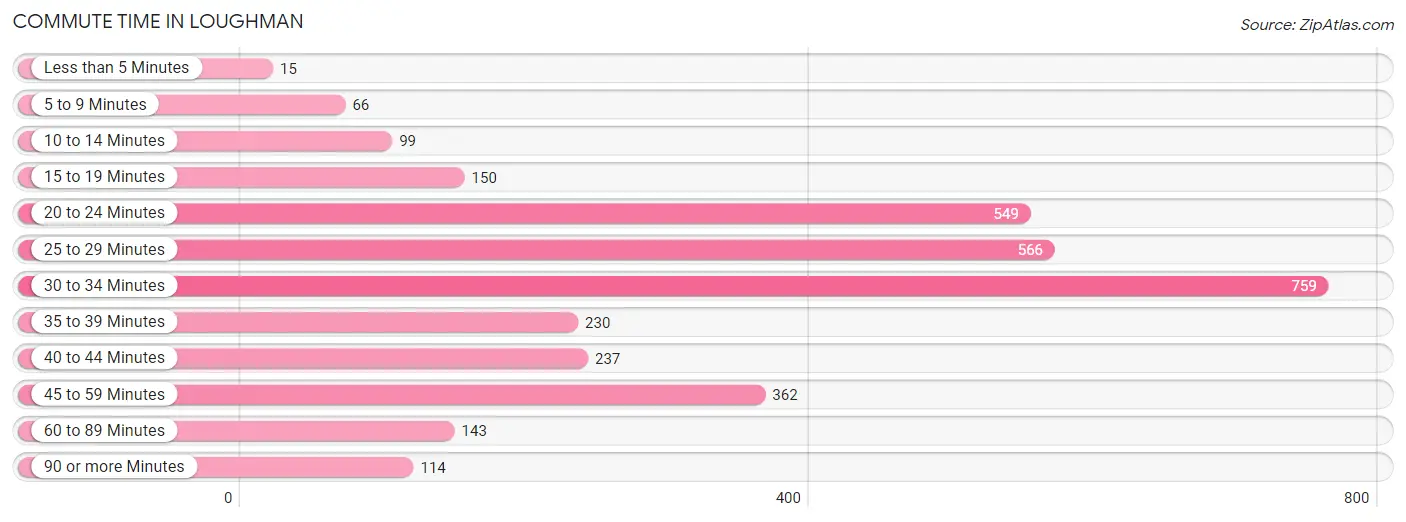
| Commute Time | # Commuters | % Commuters |
| Less than 5 Minutes | 15 | 0.5% |
| 5 to 9 Minutes | 66 | 2.0% |
| 10 to 14 Minutes | 99 | 3.0% |
| 15 to 19 Minutes | 150 | 4.6% |
| 20 to 24 Minutes | 549 | 16.7% |
| 25 to 29 Minutes | 566 | 17.2% |
| 30 to 34 Minutes | 759 | 23.1% |
| 35 to 39 Minutes | 230 | 7.0% |
| 40 to 44 Minutes | 237 | 7.2% |
| 45 to 59 Minutes | 362 | 11.0% |
| 60 to 89 Minutes | 143 | 4.3% |
| 90 or more Minutes | 114 | 3.5% |
Commute Time by Sex in Loughman
The most common commute times in Loughman are 30 to 34 minutes (327 commuters, 19.6%) for males and 30 to 34 minutes (432 commuters, 26.6%) for females.
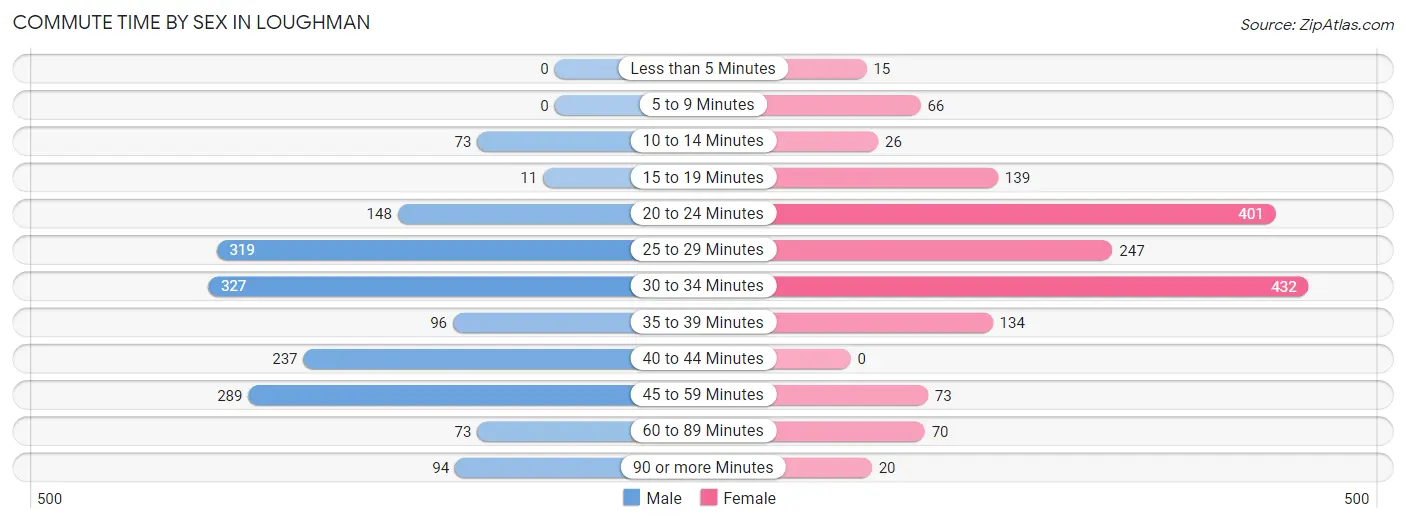
| Commute Time | Male | Female |
| Less than 5 Minutes | 0 (0.0%) | 15 (0.9%) |
| 5 to 9 Minutes | 0 (0.0%) | 66 (4.1%) |
| 10 to 14 Minutes | 73 (4.4%) | 26 (1.6%) |
| 15 to 19 Minutes | 11 (0.7%) | 139 (8.6%) |
| 20 to 24 Minutes | 148 (8.9%) | 401 (24.7%) |
| 25 to 29 Minutes | 319 (19.1%) | 247 (15.2%) |
| 30 to 34 Minutes | 327 (19.6%) | 432 (26.6%) |
| 35 to 39 Minutes | 96 (5.8%) | 134 (8.3%) |
| 40 to 44 Minutes | 237 (14.2%) | 0 (0.0%) |
| 45 to 59 Minutes | 289 (17.3%) | 73 (4.5%) |
| 60 to 89 Minutes | 73 (4.4%) | 70 (4.3%) |
| 90 or more Minutes | 94 (5.6%) | 20 (1.2%) |
Time of Departure to Work by Sex in Loughman
The most frequent times of departure to work in Loughman are 5:00 AM to 5:29 AM (374, 22.4%) for males and 12:00 PM to 3:59 PM (292, 18.0%) for females.
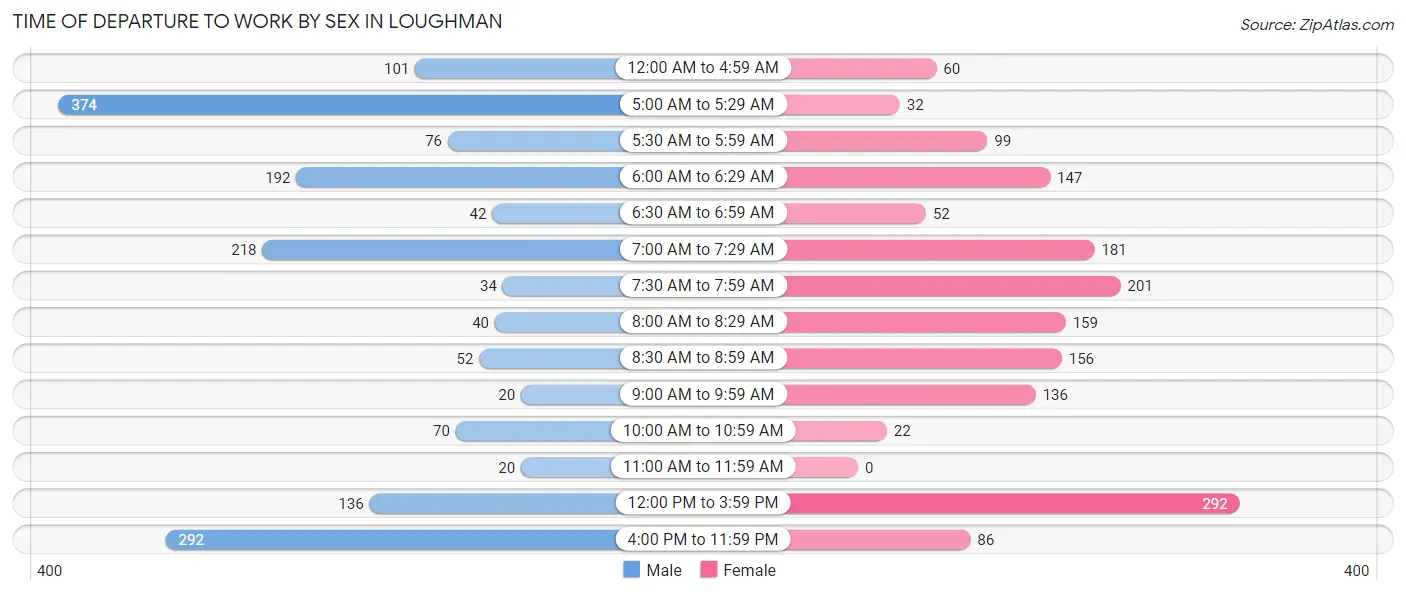
| Time of Departure | Male | Female |
| 12:00 AM to 4:59 AM | 101 (6.1%) | 60 (3.7%) |
| 5:00 AM to 5:29 AM | 374 (22.4%) | 32 (2.0%) |
| 5:30 AM to 5:59 AM | 76 (4.6%) | 99 (6.1%) |
| 6:00 AM to 6:29 AM | 192 (11.5%) | 147 (9.1%) |
| 6:30 AM to 6:59 AM | 42 (2.5%) | 52 (3.2%) |
| 7:00 AM to 7:29 AM | 218 (13.1%) | 181 (11.2%) |
| 7:30 AM to 7:59 AM | 34 (2.0%) | 201 (12.4%) |
| 8:00 AM to 8:29 AM | 40 (2.4%) | 159 (9.8%) |
| 8:30 AM to 8:59 AM | 52 (3.1%) | 156 (9.6%) |
| 9:00 AM to 9:59 AM | 20 (1.2%) | 136 (8.4%) |
| 10:00 AM to 10:59 AM | 70 (4.2%) | 22 (1.4%) |
| 11:00 AM to 11:59 AM | 20 (1.2%) | 0 (0.0%) |
| 12:00 PM to 3:59 PM | 136 (8.2%) | 292 (18.0%) |
| 4:00 PM to 11:59 PM | 292 (17.5%) | 86 (5.3%) |
| Total | 1,667 (100.0%) | 1,623 (100.0%) |
Housing Occupancy in Loughman
Occupancy by Ownership in Loughman
Of the total 2,272 dwellings in Loughman, owner-occupied units account for 800 (35.2%), while renter-occupied units make up 1,472 (64.8%).
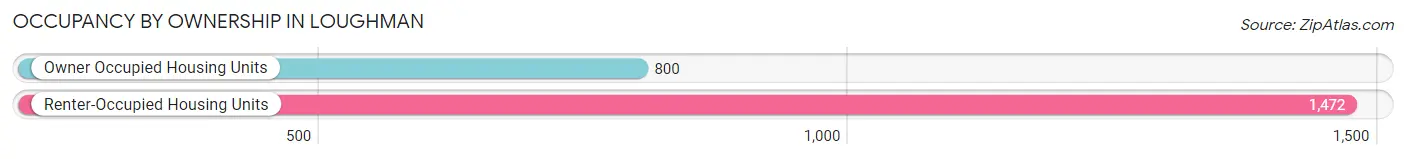
| Occupancy | # Housing Units | % Housing Units |
| Owner Occupied Housing Units | 800 | 35.2% |
| Renter-Occupied Housing Units | 1,472 | 64.8% |
| Total Occupied Housing Units | 2,272 | 100.0% |
Occupancy by Household Size in Loughman
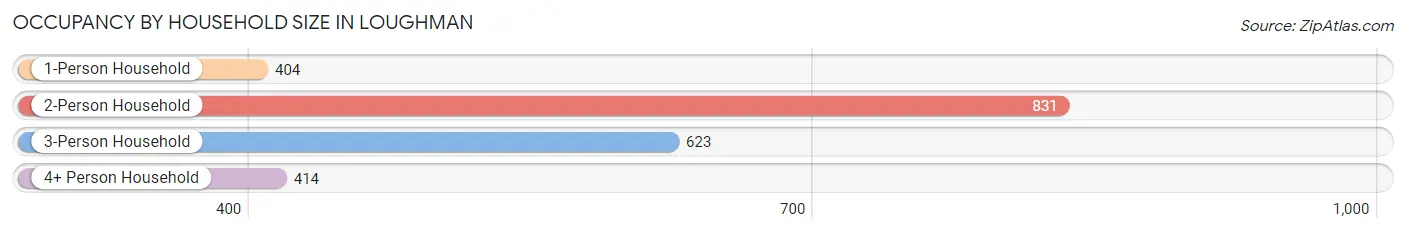
| Household Size | # Housing Units | % Housing Units |
| 1-Person Household | 404 | 17.8% |
| 2-Person Household | 831 | 36.6% |
| 3-Person Household | 623 | 27.4% |
| 4+ Person Household | 414 | 18.2% |
| Total Housing Units | 2,272 | 100.0% |
Occupancy by Ownership by Household Size in Loughman
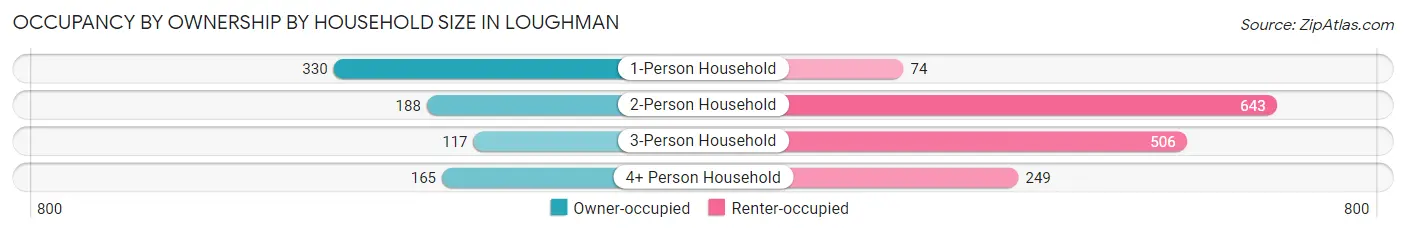
| Household Size | Owner-occupied | Renter-occupied |
| 1-Person Household | 330 (81.7%) | 74 (18.3%) |
| 2-Person Household | 188 (22.6%) | 643 (77.4%) |
| 3-Person Household | 117 (18.8%) | 506 (81.2%) |
| 4+ Person Household | 165 (39.9%) | 249 (60.1%) |
| Total Housing Units | 800 (35.2%) | 1,472 (64.8%) |
Occupancy by Educational Attainment in Loughman
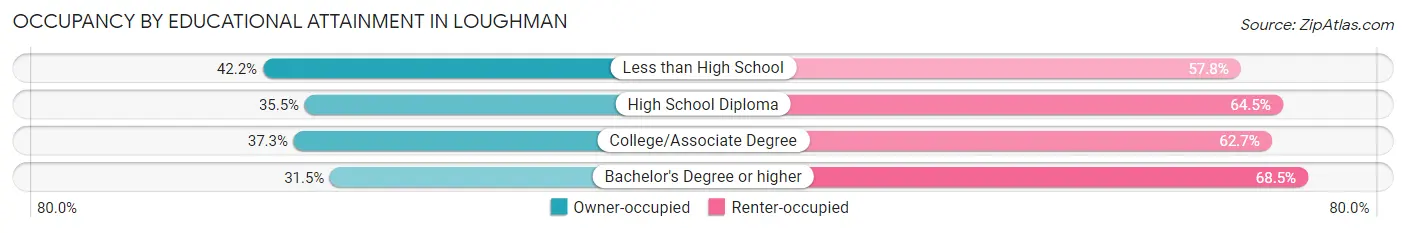
| Household Size | Owner-occupied | Renter-occupied |
| Less than High School | 46 (42.2%) | 63 (57.8%) |
| High School Diploma | 226 (35.5%) | 410 (64.5%) |
| College/Associate Degree | 301 (37.3%) | 506 (62.7%) |
| Bachelor's Degree or higher | 227 (31.5%) | 493 (68.5%) |
Occupancy by Age of Householder in Loughman
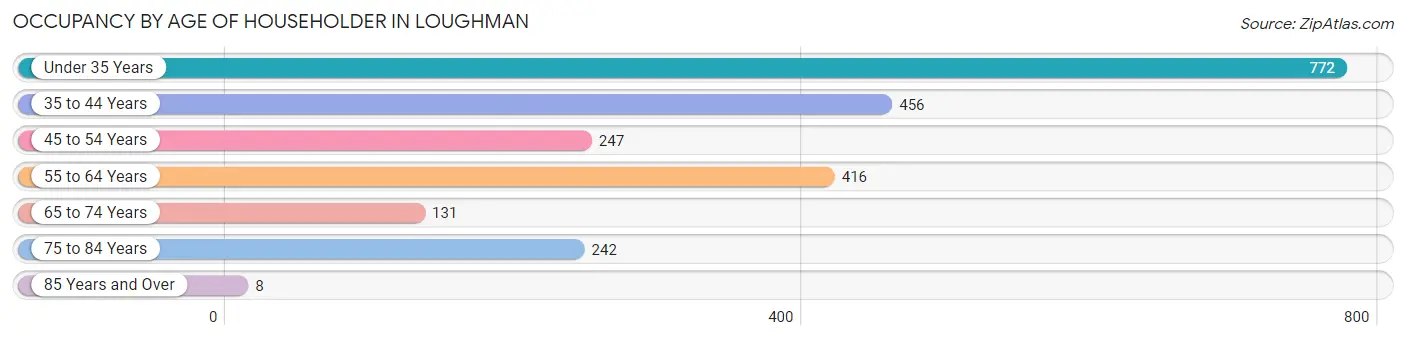
| Age Bracket | # Households | % Households |
| Under 35 Years | 772 | 34.0% |
| 35 to 44 Years | 456 | 20.1% |
| 45 to 54 Years | 247 | 10.9% |
| 55 to 64 Years | 416 | 18.3% |
| 65 to 74 Years | 131 | 5.8% |
| 75 to 84 Years | 242 | 10.6% |
| 85 Years and Over | 8 | 0.4% |
| Total | 2,272 | 100.0% |
Housing Finances in Loughman
Median Income by Occupancy in Loughman
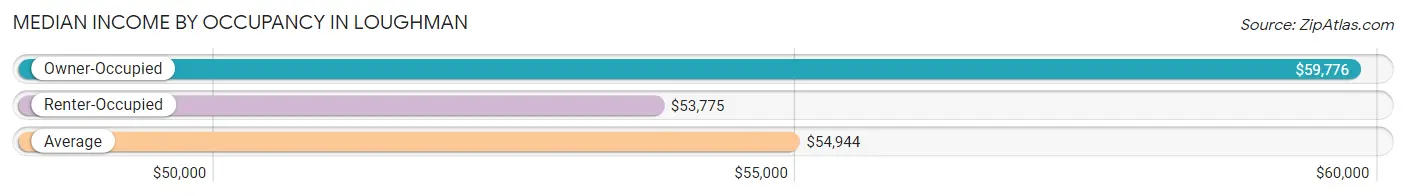
| Occupancy Type | # Households | Median Income |
| Owner-Occupied | 800 (35.2%) | $59,776 |
| Renter-Occupied | 1,472 (64.8%) | $53,775 |
| Average | 2,272 (100.0%) | $54,944 |
Occupancy by Householder Income Bracket in Loughman
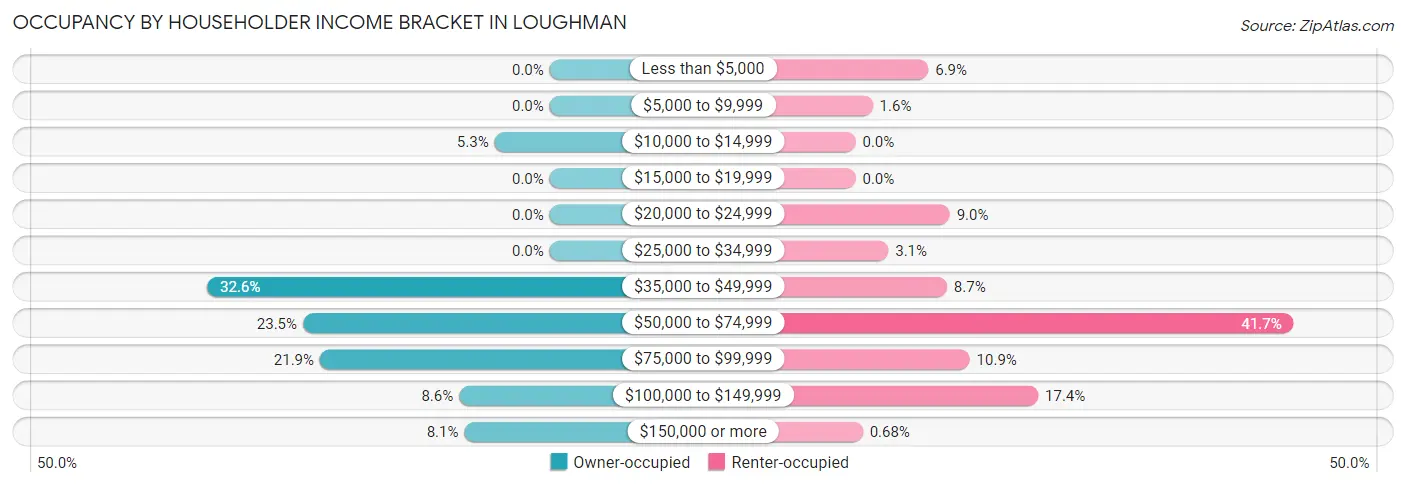
| Income Bracket | Owner-occupied | Renter-occupied |
| Less than $5,000 | 0 (0.0%) | 102 (6.9%) |
| $5,000 to $9,999 | 0 (0.0%) | 24 (1.6%) |
| $10,000 to $14,999 | 42 (5.2%) | 0 (0.0%) |
| $15,000 to $19,999 | 0 (0.0%) | 0 (0.0%) |
| $20,000 to $24,999 | 0 (0.0%) | 132 (9.0%) |
| $25,000 to $34,999 | 0 (0.0%) | 46 (3.1%) |
| $35,000 to $49,999 | 261 (32.6%) | 128 (8.7%) |
| $50,000 to $74,999 | 188 (23.5%) | 614 (41.7%) |
| $75,000 to $99,999 | 175 (21.9%) | 160 (10.9%) |
| $100,000 to $149,999 | 69 (8.6%) | 256 (17.4%) |
| $150,000 or more | 65 (8.1%) | 10 (0.7%) |
| Total | 800 (100.0%) | 1,472 (100.0%) |
Monthly Housing Cost Tiers in Loughman
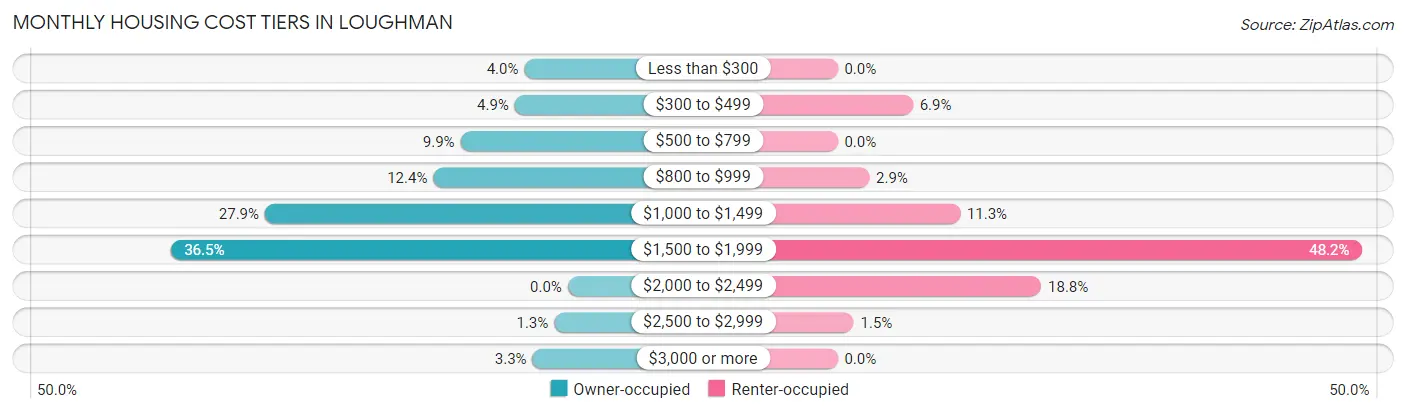
| Monthly Cost | Owner-occupied | Renter-occupied |
| Less than $300 | 32 (4.0%) | 0 (0.0%) |
| $300 to $499 | 39 (4.9%) | 102 (6.9%) |
| $500 to $799 | 79 (9.9%) | 0 (0.0%) |
| $800 to $999 | 99 (12.4%) | 43 (2.9%) |
| $1,000 to $1,499 | 223 (27.9%) | 166 (11.3%) |
| $1,500 to $1,999 | 292 (36.5%) | 710 (48.2%) |
| $2,000 to $2,499 | 0 (0.0%) | 276 (18.8%) |
| $2,500 to $2,999 | 10 (1.3%) | 22 (1.5%) |
| $3,000 or more | 26 (3.3%) | 0 (0.0%) |
| Total | 800 (100.0%) | 1,472 (100.0%) |
Physical Housing Characteristics in Loughman
Housing Structures in Loughman
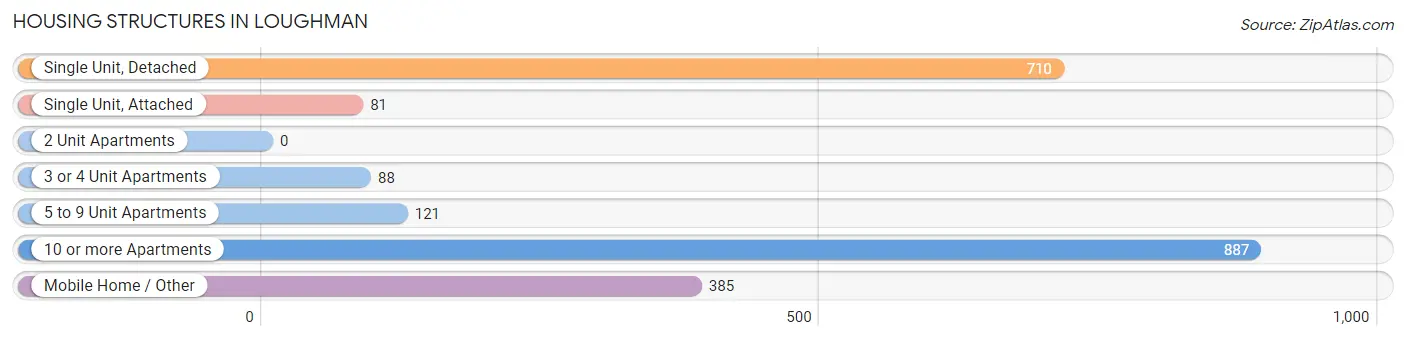
| Structure Type | # Housing Units | % Housing Units |
| Single Unit, Detached | 710 | 31.2% |
| Single Unit, Attached | 81 | 3.6% |
| 2 Unit Apartments | 0 | 0.0% |
| 3 or 4 Unit Apartments | 88 | 3.9% |
| 5 to 9 Unit Apartments | 121 | 5.3% |
| 10 or more Apartments | 887 | 39.0% |
| Mobile Home / Other | 385 | 17.0% |
| Total | 2,272 | 100.0% |
Housing Structures by Occupancy in Loughman
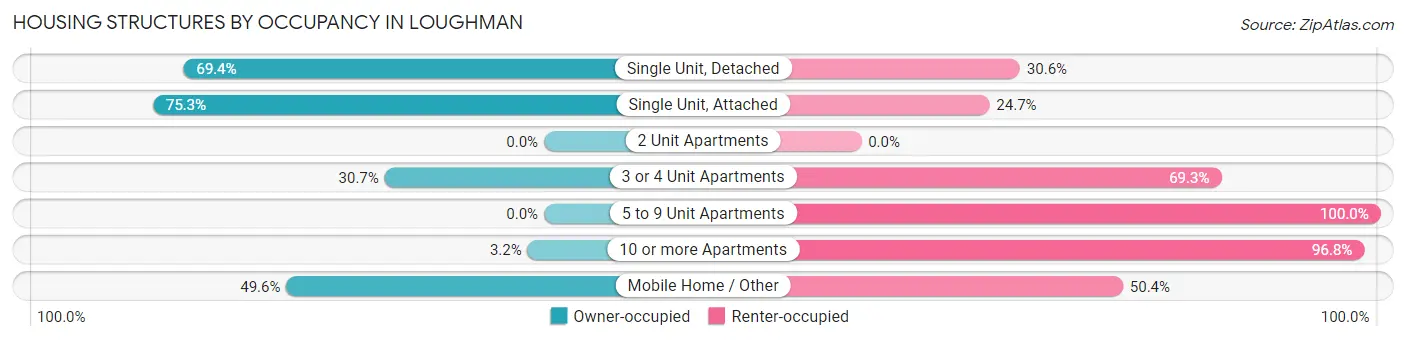
| Structure Type | Owner-occupied | Renter-occupied |
| Single Unit, Detached | 493 (69.4%) | 217 (30.6%) |
| Single Unit, Attached | 61 (75.3%) | 20 (24.7%) |
| 2 Unit Apartments | 0 (0.0%) | 0 (0.0%) |
| 3 or 4 Unit Apartments | 27 (30.7%) | 61 (69.3%) |
| 5 to 9 Unit Apartments | 0 (0.0%) | 121 (100.0%) |
| 10 or more Apartments | 28 (3.2%) | 859 (96.8%) |
| Mobile Home / Other | 191 (49.6%) | 194 (50.4%) |
| Total | 800 (35.2%) | 1,472 (64.8%) |
Housing Structures by Number of Rooms in Loughman
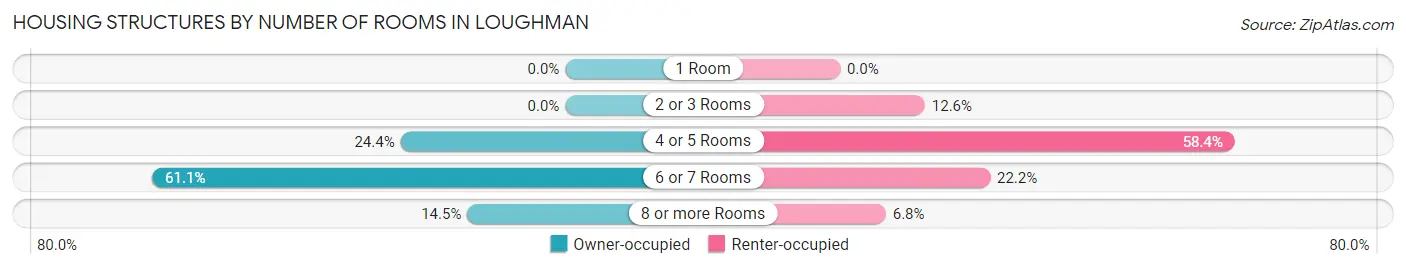
| Number of Rooms | Owner-occupied | Renter-occupied |
| 1 Room | 0 (0.0%) | 0 (0.0%) |
| 2 or 3 Rooms | 0 (0.0%) | 185 (12.6%) |
| 4 or 5 Rooms | 195 (24.4%) | 860 (58.4%) |
| 6 or 7 Rooms | 489 (61.1%) | 327 (22.2%) |
| 8 or more Rooms | 116 (14.5%) | 100 (6.8%) |
| Total | 800 (100.0%) | 1,472 (100.0%) |
Housing Structure by Heating Type in Loughman
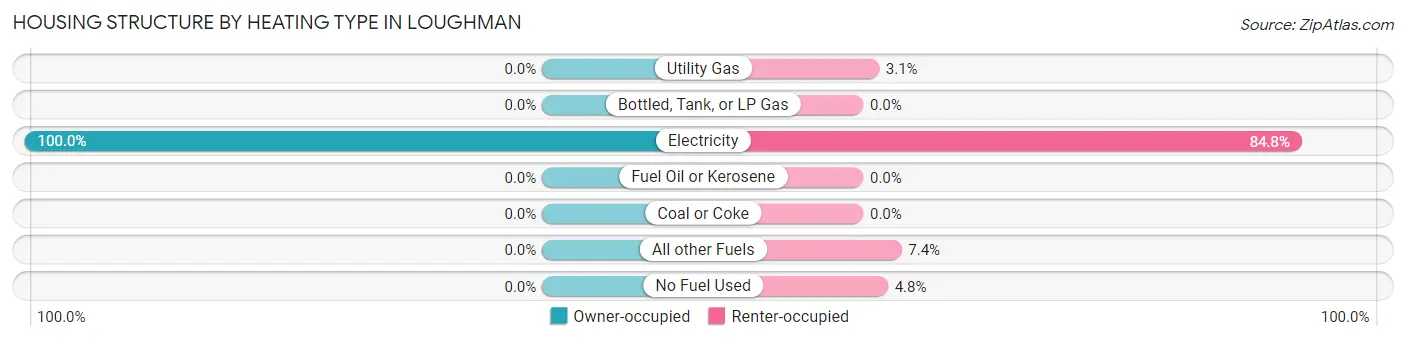
| Heating Type | Owner-occupied | Renter-occupied |
| Utility Gas | 0 (0.0%) | 45 (3.1%) |
| Bottled, Tank, or LP Gas | 0 (0.0%) | 0 (0.0%) |
| Electricity | 800 (100.0%) | 1,248 (84.8%) |
| Fuel Oil or Kerosene | 0 (0.0%) | 0 (0.0%) |
| Coal or Coke | 0 (0.0%) | 0 (0.0%) |
| All other Fuels | 0 (0.0%) | 109 (7.4%) |
| No Fuel Used | 0 (0.0%) | 70 (4.8%) |
| Total | 800 (100.0%) | 1,472 (100.0%) |
Household Vehicle Usage in Loughman
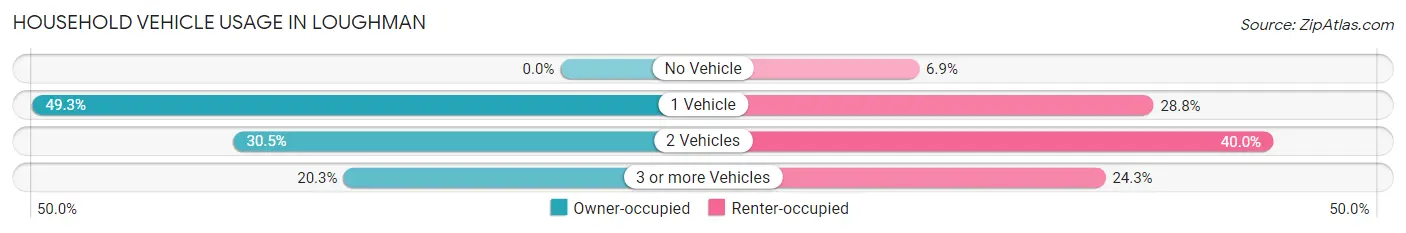
| Vehicles per Household | Owner-occupied | Renter-occupied |
| No Vehicle | 0 (0.0%) | 102 (6.9%) |
| 1 Vehicle | 394 (49.2%) | 424 (28.8%) |
| 2 Vehicles | 244 (30.5%) | 588 (40.0%) |
| 3 or more Vehicles | 162 (20.3%) | 358 (24.3%) |
| Total | 800 (100.0%) | 1,472 (100.0%) |
Real Estate & Mortgages in Loughman
Real Estate and Mortgage Overview in Loughman
| Characteristic | Without Mortgage | With Mortgage |
| Housing Units | 187 | 613 |
| Median Property Value | $221,700 | $274,200 |
| Median Household Income | $59,125 | $65 |
| Monthly Housing Costs | $727 | $26 |
| Real Estate Taxes | $2,413 | $125 |
Property Value by Mortgage Status in Loughman
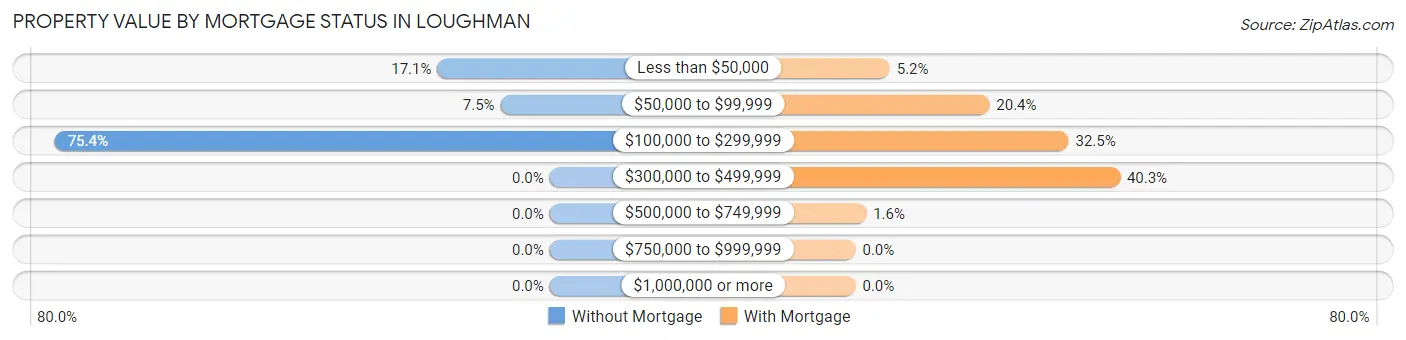
| Property Value | Without Mortgage | With Mortgage |
| Less than $50,000 | 32 (17.1%) | 32 (5.2%) |
| $50,000 to $99,999 | 14 (7.5%) | 125 (20.4%) |
| $100,000 to $299,999 | 141 (75.4%) | 199 (32.5%) |
| $300,000 to $499,999 | 0 (0.0%) | 247 (40.3%) |
| $500,000 to $749,999 | 0 (0.0%) | 10 (1.6%) |
| $750,000 to $999,999 | 0 (0.0%) | 0 (0.0%) |
| $1,000,000 or more | 0 (0.0%) | 0 (0.0%) |
| Total | 187 (100.0%) | 613 (100.0%) |
Household Income by Mortgage Status in Loughman
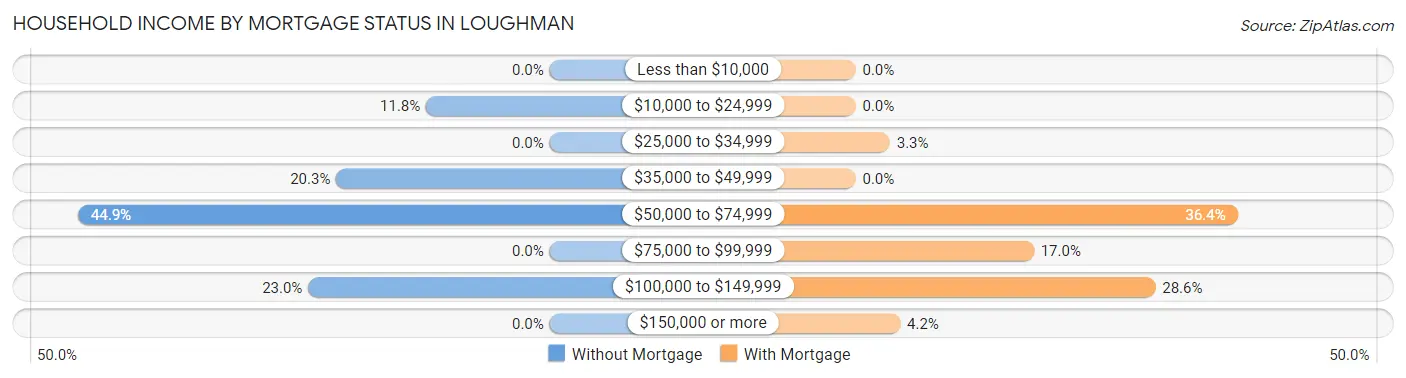
| Household Income | Without Mortgage | With Mortgage |
| Less than $10,000 | 0 (0.0%) | 0 (0.0%) |
| $10,000 to $24,999 | 22 (11.8%) | 0 (0.0%) |
| $25,000 to $34,999 | 0 (0.0%) | 20 (3.3%) |
| $35,000 to $49,999 | 38 (20.3%) | 0 (0.0%) |
| $50,000 to $74,999 | 84 (44.9%) | 223 (36.4%) |
| $75,000 to $99,999 | 0 (0.0%) | 104 (17.0%) |
| $100,000 to $149,999 | 43 (23.0%) | 175 (28.5%) |
| $150,000 or more | 0 (0.0%) | 26 (4.2%) |
| Total | 187 (100.0%) | 613 (100.0%) |
Property Value to Household Income Ratio in Loughman
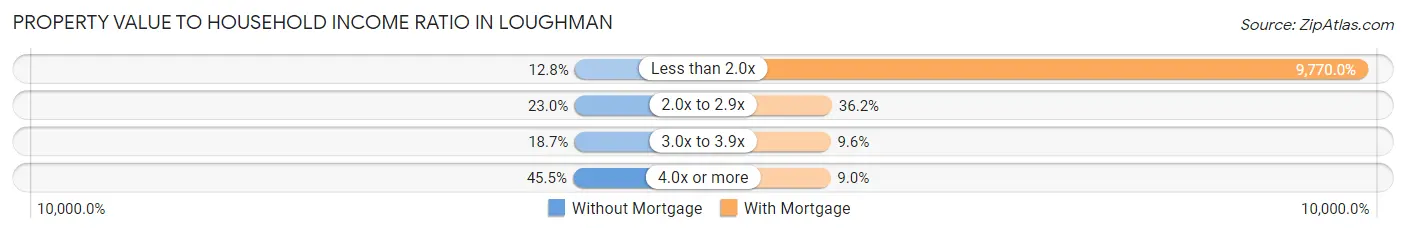
| Value-to-Income Ratio | Without Mortgage | With Mortgage |
| Less than 2.0x | 24 (12.8%) | 59,890 (9,770.0%) |
| 2.0x to 2.9x | 43 (23.0%) | 222 (36.2%) |
| 3.0x to 3.9x | 35 (18.7%) | 59 (9.6%) |
| 4.0x or more | 85 (45.5%) | 55 (9.0%) |
| Total | 187 (100.0%) | 613 (100.0%) |
Real Estate Taxes by Mortgage Status in Loughman
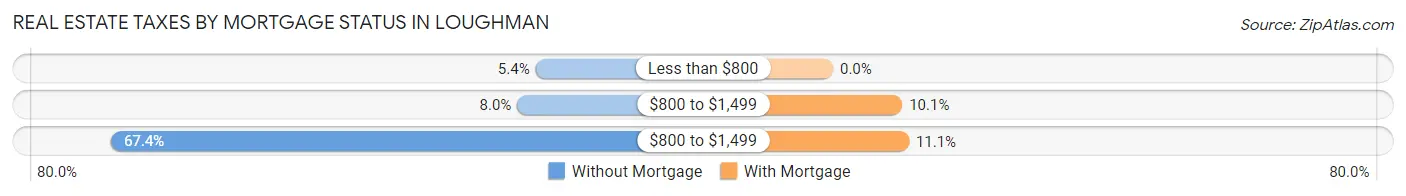
| Property Taxes | Without Mortgage | With Mortgage |
| Less than $800 | 10 (5.3%) | 0 (0.0%) |
| $800 to $1,499 | 15 (8.0%) | 62 (10.1%) |
| $800 to $1,499 | 126 (67.4%) | 68 (11.1%) |
| Total | 187 (100.0%) | 613 (100.0%) |
Health & Disability in Loughman
Health Insurance Coverage by Age in Loughman
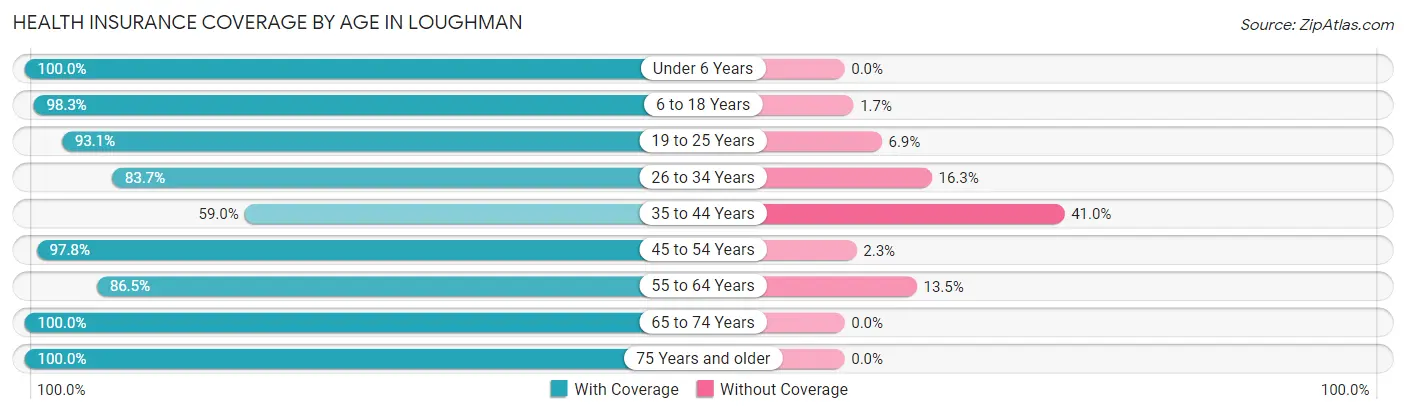
| Age Bracket | With Coverage | Without Coverage |
| Under 6 Years | 531 (100.0%) | 0 (0.0%) |
| 6 to 18 Years | 830 (98.3%) | 14 (1.7%) |
| 19 to 25 Years | 1,059 (93.1%) | 79 (6.9%) |
| 26 to 34 Years | 1,106 (83.7%) | 215 (16.3%) |
| 35 to 44 Years | 433 (59.0%) | 301 (41.0%) |
| 45 to 54 Years | 435 (97.8%) | 10 (2.2%) |
| 55 to 64 Years | 578 (86.5%) | 90 (13.5%) |
| 65 to 74 Years | 187 (100.0%) | 0 (0.0%) |
| 75 Years and older | 428 (100.0%) | 0 (0.0%) |
| Total | 5,587 (88.7%) | 709 (11.3%) |
Health Insurance Coverage by Citizenship Status in Loughman
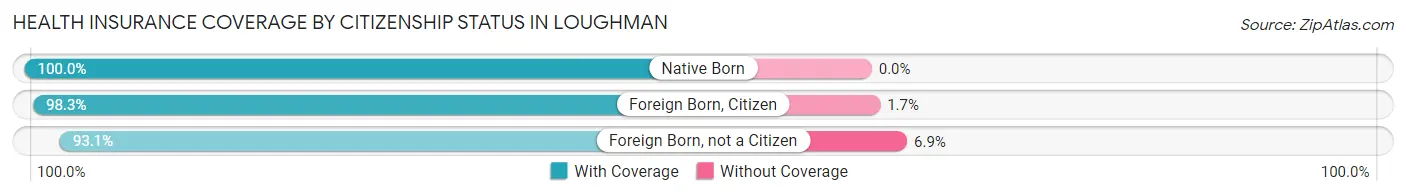
| Citizenship Status | With Coverage | Without Coverage |
| Native Born | 531 (100.0%) | 0 (0.0%) |
| Foreign Born, Citizen | 830 (98.3%) | 14 (1.7%) |
| Foreign Born, not a Citizen | 1,059 (93.1%) | 79 (6.9%) |
Health Insurance Coverage by Household Income in Loughman
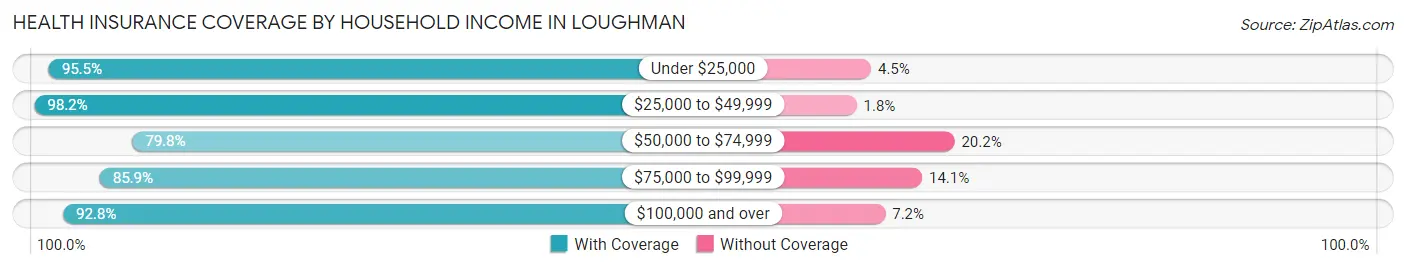
| Household Income | With Coverage | Without Coverage |
| Under $25,000 | 925 (95.5%) | 44 (4.5%) |
| $25,000 to $49,999 | 803 (98.2%) | 15 (1.8%) |
| $50,000 to $74,999 | 1,578 (79.8%) | 399 (20.2%) |
| $75,000 to $99,999 | 853 (85.9%) | 140 (14.1%) |
| $100,000 and over | 1,428 (92.8%) | 111 (7.2%) |
Public vs Private Health Insurance Coverage by Age in Loughman
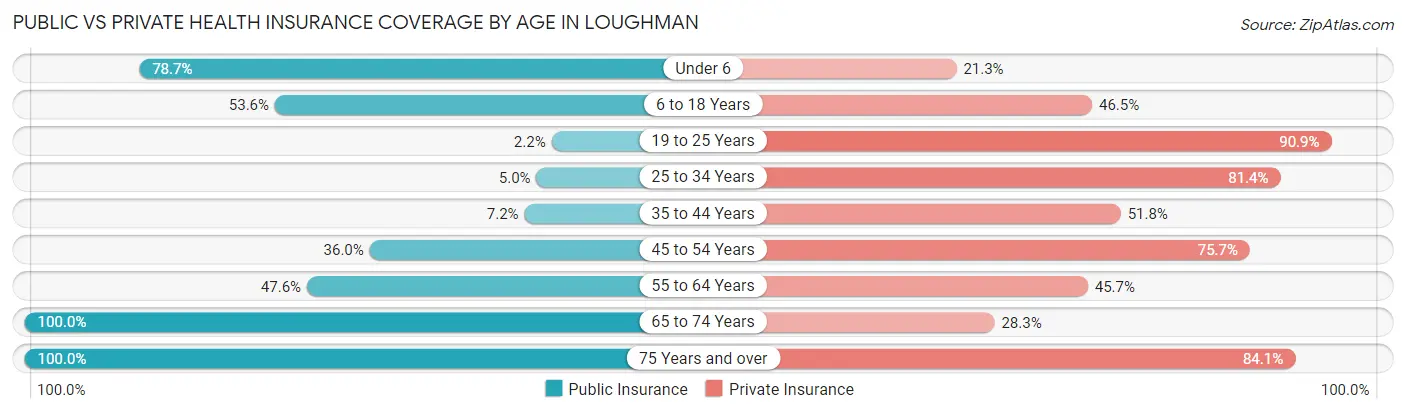
| Age Bracket | Public Insurance | Private Insurance |
| Under 6 | 418 (78.7%) | 113 (21.3%) |
| 6 to 18 Years | 452 (53.5%) | 392 (46.5%) |
| 19 to 25 Years | 25 (2.2%) | 1,034 (90.9%) |
| 25 to 34 Years | 66 (5.0%) | 1,075 (81.4%) |
| 35 to 44 Years | 53 (7.2%) | 380 (51.8%) |
| 45 to 54 Years | 160 (36.0%) | 337 (75.7%) |
| 55 to 64 Years | 318 (47.6%) | 305 (45.7%) |
| 65 to 74 Years | 187 (100.0%) | 53 (28.3%) |
| 75 Years and over | 428 (100.0%) | 360 (84.1%) |
| Total | 2,107 (33.5%) | 4,049 (64.3%) |
Disability Status by Sex by Age in Loughman
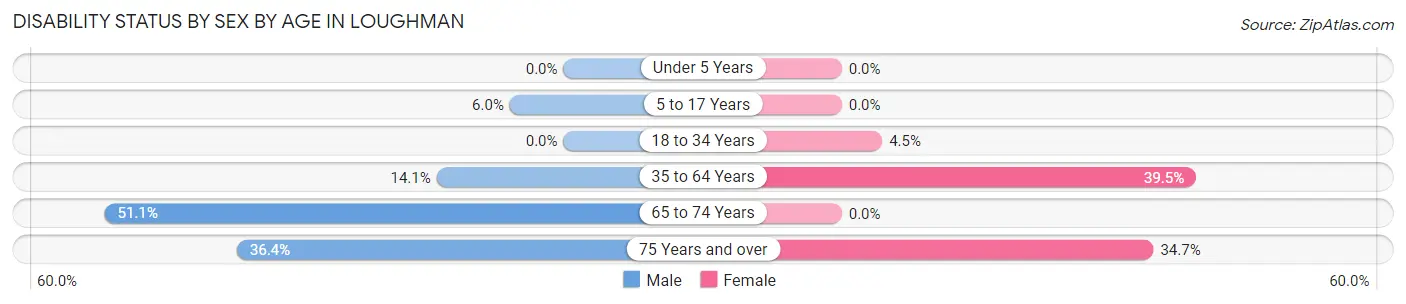
| Age Bracket | Male | Female |
| Under 5 Years | 0 (0.0%) | 0 (0.0%) |
| 5 to 17 Years | 20 (6.0%) | 0 (0.0%) |
| 18 to 34 Years | 0 (0.0%) | 57 (4.5%) |
| 35 to 64 Years | 133 (14.1%) | 357 (39.5%) |
| 65 to 74 Years | 47 (51.1%) | 0 (0.0%) |
| 75 Years and over | 32 (36.4%) | 118 (34.7%) |
Disability Class by Sex by Age in Loughman
Disability Class: Hearing Difficulty
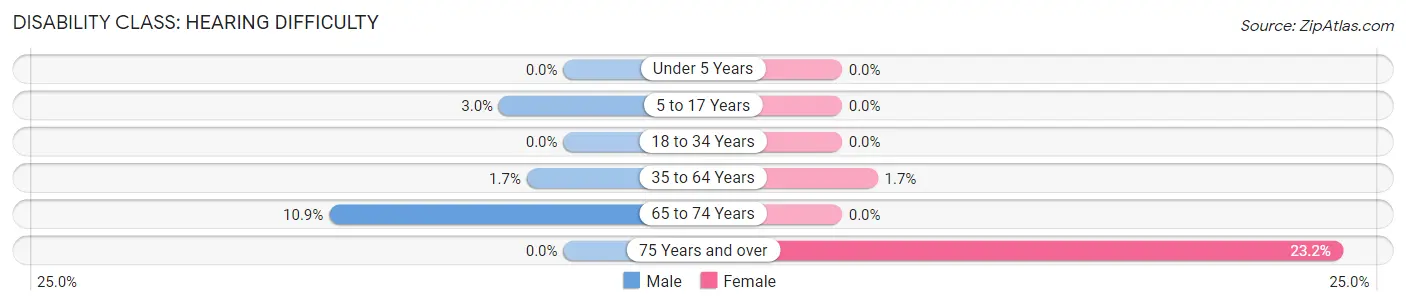
| Age Bracket | Male | Female |
| Under 5 Years | 0 (0.0%) | 0 (0.0%) |
| 5 to 17 Years | 10 (3.0%) | 0 (0.0%) |
| 18 to 34 Years | 0 (0.0%) | 0 (0.0%) |
| 35 to 64 Years | 16 (1.7%) | 15 (1.7%) |
| 65 to 74 Years | 10 (10.9%) | 0 (0.0%) |
| 75 Years and over | 0 (0.0%) | 79 (23.2%) |
Disability Class: Vision Difficulty
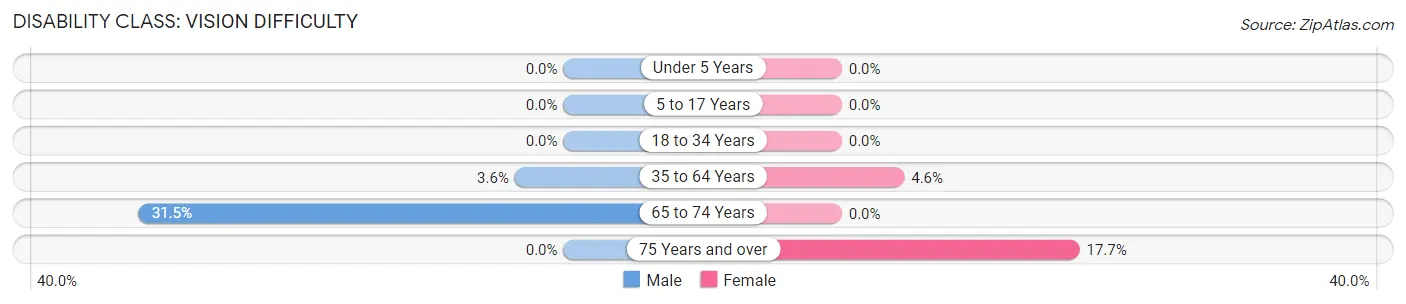
| Age Bracket | Male | Female |
| Under 5 Years | 0 (0.0%) | 0 (0.0%) |
| 5 to 17 Years | 0 (0.0%) | 0 (0.0%) |
| 18 to 34 Years | 0 (0.0%) | 0 (0.0%) |
| 35 to 64 Years | 34 (3.6%) | 42 (4.6%) |
| 65 to 74 Years | 29 (31.5%) | 0 (0.0%) |
| 75 Years and over | 0 (0.0%) | 60 (17.6%) |
Disability Class: Cognitive Difficulty
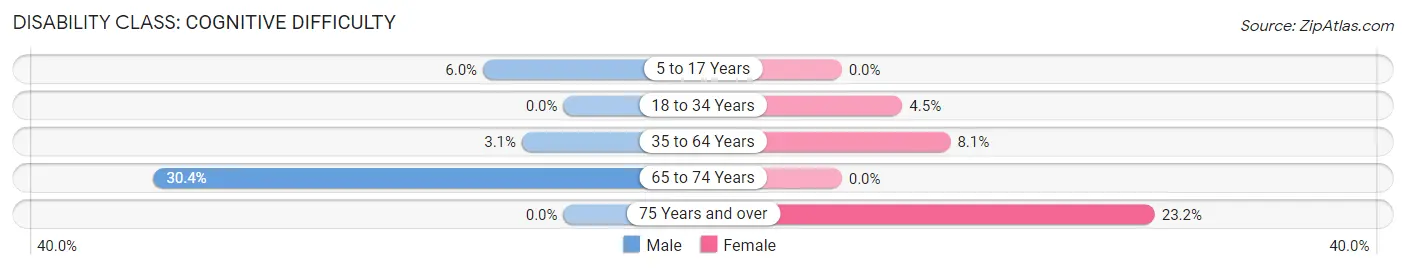
| Age Bracket | Male | Female |
| 5 to 17 Years | 20 (6.0%) | 0 (0.0%) |
| 18 to 34 Years | 0 (0.0%) | 57 (4.5%) |
| 35 to 64 Years | 29 (3.1%) | 73 (8.1%) |
| 65 to 74 Years | 28 (30.4%) | 0 (0.0%) |
| 75 Years and over | 0 (0.0%) | 79 (23.2%) |
Disability Class: Ambulatory Difficulty
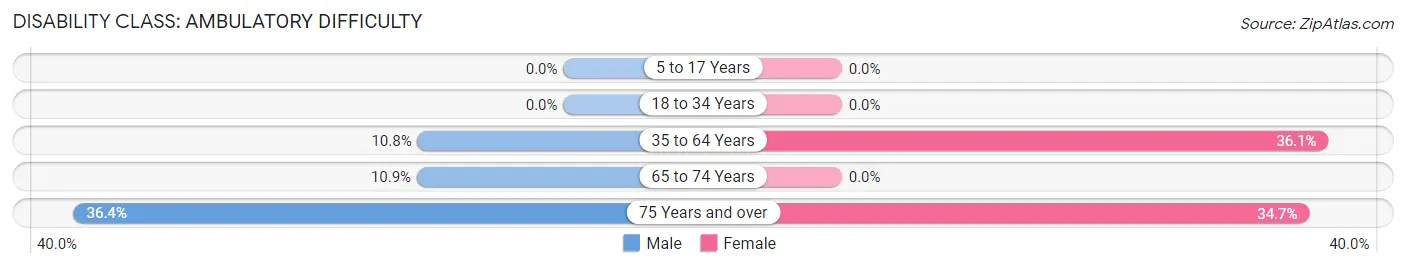
| Age Bracket | Male | Female |
| 5 to 17 Years | 0 (0.0%) | 0 (0.0%) |
| 18 to 34 Years | 0 (0.0%) | 0 (0.0%) |
| 35 to 64 Years | 102 (10.8%) | 327 (36.1%) |
| 65 to 74 Years | 10 (10.9%) | 0 (0.0%) |
| 75 Years and over | 32 (36.4%) | 118 (34.7%) |
Disability Class: Self-Care Difficulty
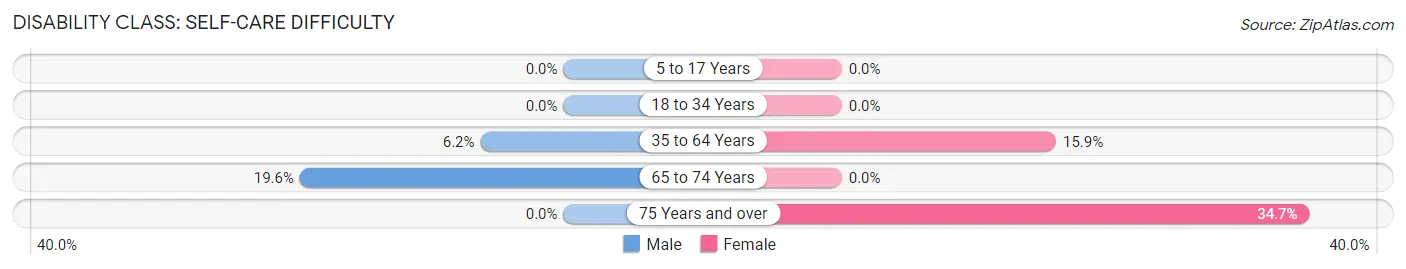
| Age Bracket | Male | Female |
| 5 to 17 Years | 0 (0.0%) | 0 (0.0%) |
| 18 to 34 Years | 0 (0.0%) | 0 (0.0%) |
| 35 to 64 Years | 58 (6.2%) | 144 (15.9%) |
| 65 to 74 Years | 18 (19.6%) | 0 (0.0%) |
| 75 Years and over | 0 (0.0%) | 118 (34.7%) |
Technology Access in Loughman
Computing Device Access in Loughman
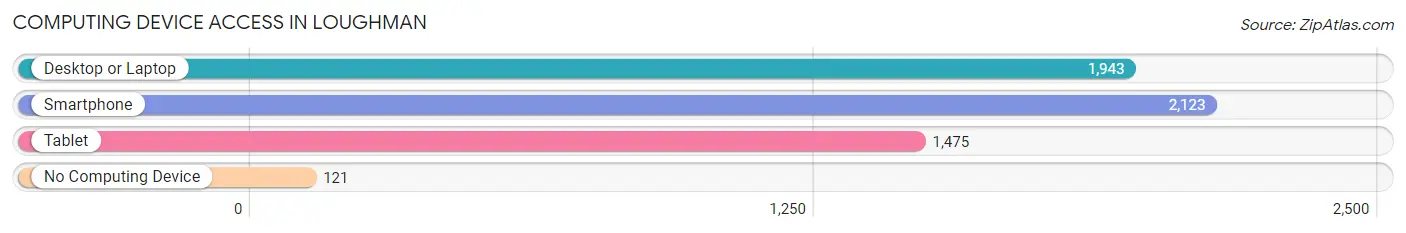
| Device Type | # Households | % Households |
| Desktop or Laptop | 1,943 | 85.5% |
| Smartphone | 2,123 | 93.4% |
| Tablet | 1,475 | 64.9% |
| No Computing Device | 121 | 5.3% |
| Total | 2,272 | 100.0% |
Internet Access in Loughman
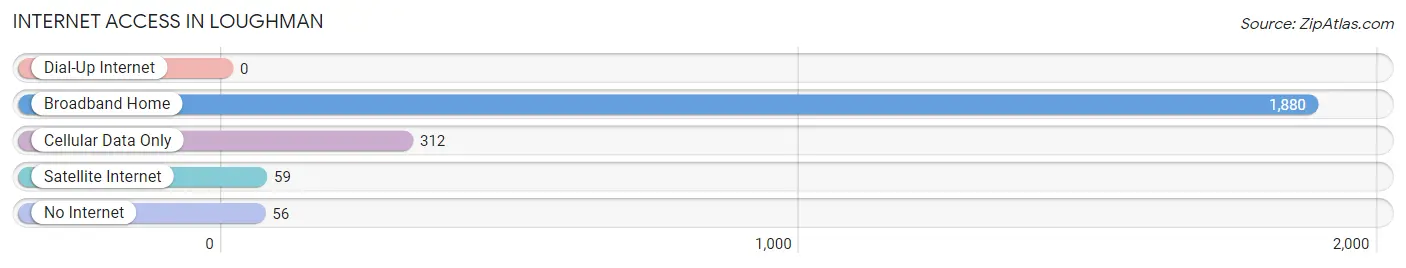
| Internet Type | # Households | % Households |
| Dial-Up Internet | 0 | 0.0% |
| Broadband Home | 1,880 | 82.8% |
| Cellular Data Only | 312 | 13.7% |
| Satellite Internet | 59 | 2.6% |
| No Internet | 56 | 2.5% |
| Total | 2,272 | 100.0% |
Loughman Summary
Loughman is a small unincorporated community located in Polk County, Florida. It is situated on the eastern shore of Lake Marion, approximately 20 miles south of Orlando. The population of Loughman was estimated to be 1,845 in 2019.
History
Loughman was founded in 1883 by William Loughman, a former Confederate soldier. He purchased a large tract of land in the area and began to develop it into a farming community. The town was named after him and was incorporated in 1887.
In the early 1900s, Loughman was a thriving agricultural community. The town was home to several citrus groves, vegetable farms, and cattle ranches. The town also had a sawmill, a general store, and a post office.
In the 1950s, the town began to decline as the citrus industry moved away from the area. The population decreased and many of the businesses closed.
In the late 1970s, the town began to experience a resurgence as people began to move to the area for its rural charm and proximity to Orlando. The population began to grow and new businesses opened.
Geography
Loughman is located in central Florida, approximately 20 miles south of Orlando. It is situated on the eastern shore of Lake Marion, a large freshwater lake. The town is surrounded by citrus groves, vegetable farms, and cattle ranches.
The climate in Loughman is humid subtropical, with hot, humid summers and mild winters. The average temperature in the summer is around 90°F and the average temperature in the winter is around 60°F.
Economy
The economy of Loughman is largely based on agriculture. The town is home to several citrus groves, vegetable farms, and cattle ranches. The town also has a few small businesses, including a general store, a post office, and a few restaurants.
The town is also home to a few tourist attractions, including a wildlife refuge and a state park. These attractions bring in visitors from all over the state and help to boost the local economy.
Demographics
As of 2019, the population of Loughman was estimated to be 1,845. The racial makeup of the town was 79.3% White, 15.2% Hispanic or Latino, 2.2% African American, and 3.3% other.
The median household income in Loughman was $45,000 in 2019. The median home value was $150,000. The town has a poverty rate of 11.3%.
Conclusion
Loughman is a small unincorporated community located in Polk County, Florida. It was founded in 1883 and has a population of 1,845. The economy of the town is largely based on agriculture, with several citrus groves, vegetable farms, and cattle ranches. The town also has a few small businesses and tourist attractions. The racial makeup of the town is 79.3% White, 15.2% Hispanic or Latino, 2.2% African American, and 3.3% other. The median household income is $45,000 and the median home value is $150,000.
Common Questions
What is the Total Population of Loughman?
Total Population of Loughman is 6,296.
What is the Total Male Population of Loughman?
Total Male Population of Loughman is 3,177.
What is the Total Female Population of Loughman?
Total Female Population of Loughman is 3,119.
What is the Ratio of Males per 100 Females in Loughman?
There are 101.86 Males per 100 Females in Loughman.
What is the Ratio of Females per 100 Males in Loughman?
There are 98.17 Females per 100 Males in Loughman.
What is the Median Population Age in Loughman?
Median Population Age in Loughman is 27.9 Years.
What is the Average Family Size in Loughman
Average Family Size in Loughman is 3.0 People.
What is the Average Household Size in Loughman
Average Household Size in Loughman is 2.8 People.
What is Per Capita Income in Loughman?
Per Capita income in Loughman is $25,860.
What is the Median Family Income in Loughman?
Median Family Income in Loughman is $51,360.
What is the Median Household income in Loughman?
Median Household Income in Loughman is $54,944.
What is Income or Wage Gap in Loughman?
Income or Wage Gap in Loughman is 41.1%.
Women in Loughman earn 58.9 cents for every dollar earned by a man.
What is Inequality or Gini Index in Loughman?
Inequality or Gini Index in Loughman is 0.32.
How Large is the Labor Force in Loughman?
There are 3,805 People in the Labor Forcein in Loughman.
What is the Percentage of People in the Labor Force in Loughman?
73.2% of People are in the Labor Force in Loughman.
What is the Unemployment Rate in Loughman?
Unemployment Rate in Loughman is 2.4%.