Kenwood Estates, FL
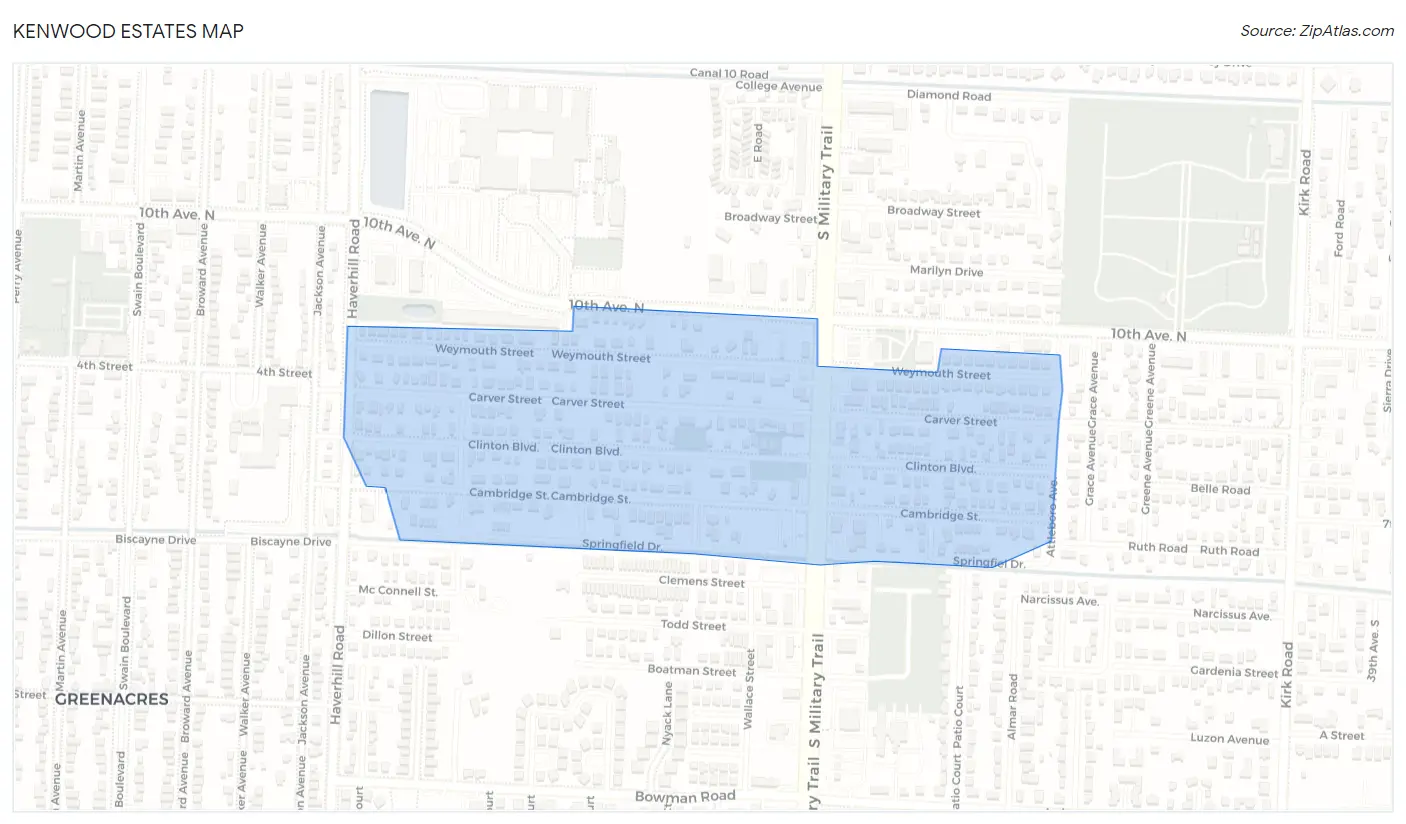
Kenwood Estates Map
Kenwood Estates Overview
1,252
TOTAL POPULATION
615
MALE POPULATION
637
FEMALE POPULATION
96.55
MALES / 100 FEMALES
103.58
FEMALES / 100 MALES
34.8
MEDIAN AGE
3.6
AVG FAMILY SIZE
3.4
AVG HOUSEHOLD SIZE
$22,094
PER CAPITA INCOME
$72,344
AVG FAMILY INCOME
$63,214
AVG HOUSEHOLD INCOME
14.8%
WAGE / INCOME GAP [ % ]
85.2¢/ $1
WAGE / INCOME GAP [ $ ]
0.35
INEQUALITY / GINI INDEX
678
LABOR FORCE [ PEOPLE ]
70.1%
PERCENT IN LABOR FORCE
0.6%
UNEMPLOYMENT RATE
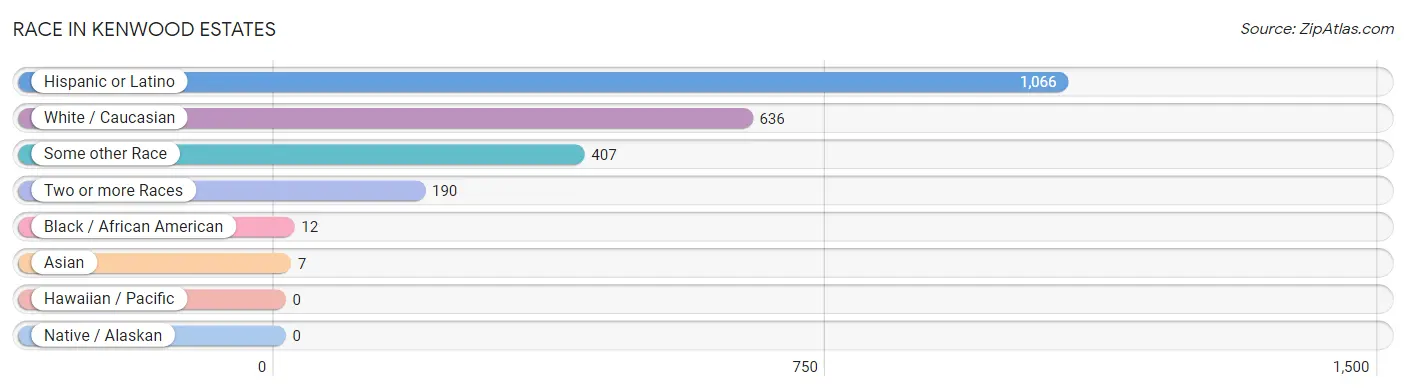
Race in Kenwood Estates
The most populous races in Kenwood Estates are Hispanic or Latino (1,066 | 85.1%), White / Caucasian (636 | 50.8%), and Some other Race (407 | 32.5%).
| Race | # Population | % Population |
| Asian | 7 | 0.6% |
| Black / African American | 12 | 1.0% |
| Hawaiian / Pacific | 0 | 0.0% |
| Hispanic or Latino | 1,066 | 85.1% |
| Native / Alaskan | 0 | 0.0% |
| White / Caucasian | 636 | 50.8% |
| Two or more Races | 190 | 15.2% |
| Some other Race | 407 | 32.5% |
| Total | 1,252 | 100.0% |
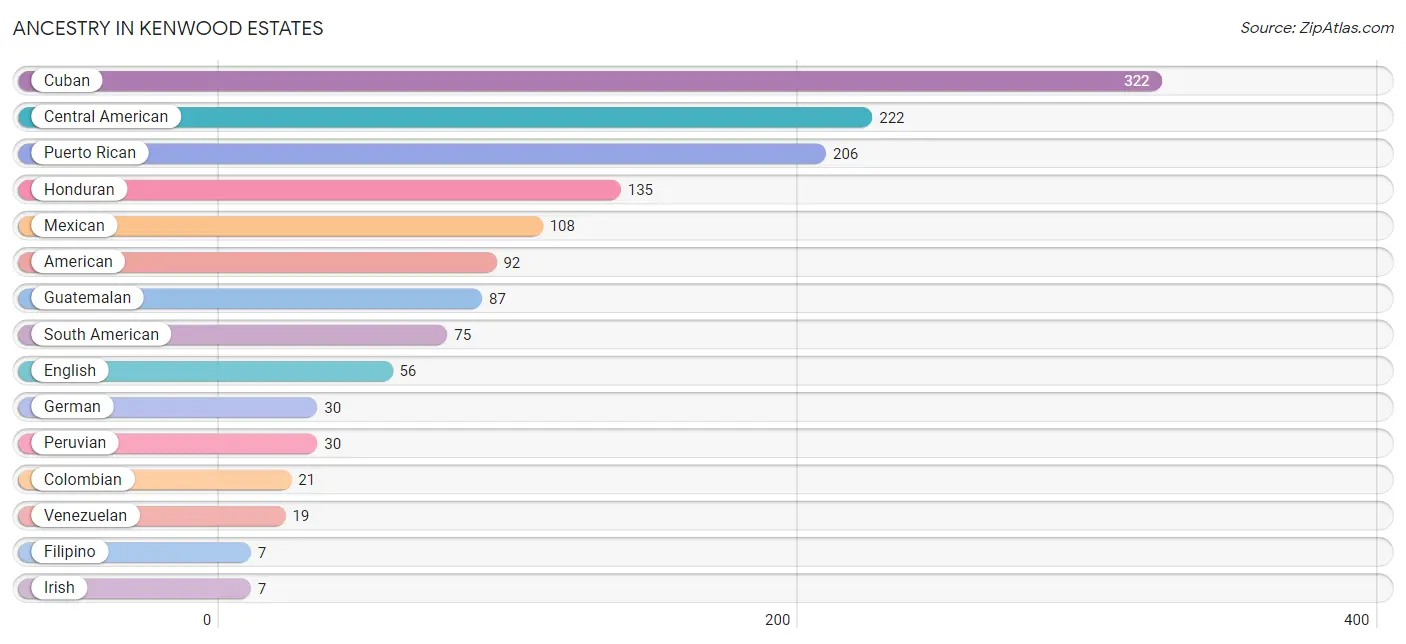
Ancestry in Kenwood Estates
The most populous ancestries reported in Kenwood Estates are Cuban (322 | 25.7%), Central American (222 | 17.7%), Puerto Rican (206 | 16.5%), Honduran (135 | 10.8%), and Mexican (108 | 8.6%), together accounting for 79.3% of all Kenwood Estates residents.
| Ancestry | # Population | % Population |
| American | 92 | 7.3% |
| Argentinean | 5 | 0.4% |
| Central American | 222 | 17.7% |
| Colombian | 21 | 1.7% |
| Cuban | 322 | 25.7% |
| English | 56 | 4.5% |
| Filipino | 7 | 0.6% |
| German | 30 | 2.4% |
| Guatemalan | 87 | 7.0% |
| Haitian | 6 | 0.5% |
| Honduran | 135 | 10.8% |
| Irish | 7 | 0.6% |
| Jamaican | 6 | 0.5% |
| Mexican | 108 | 8.6% |
| Peruvian | 30 | 2.4% |
| Puerto Rican | 206 | 16.5% |
| South American | 75 | 6.0% |
| Venezuelan | 19 | 1.5% | View All 18 Rows |
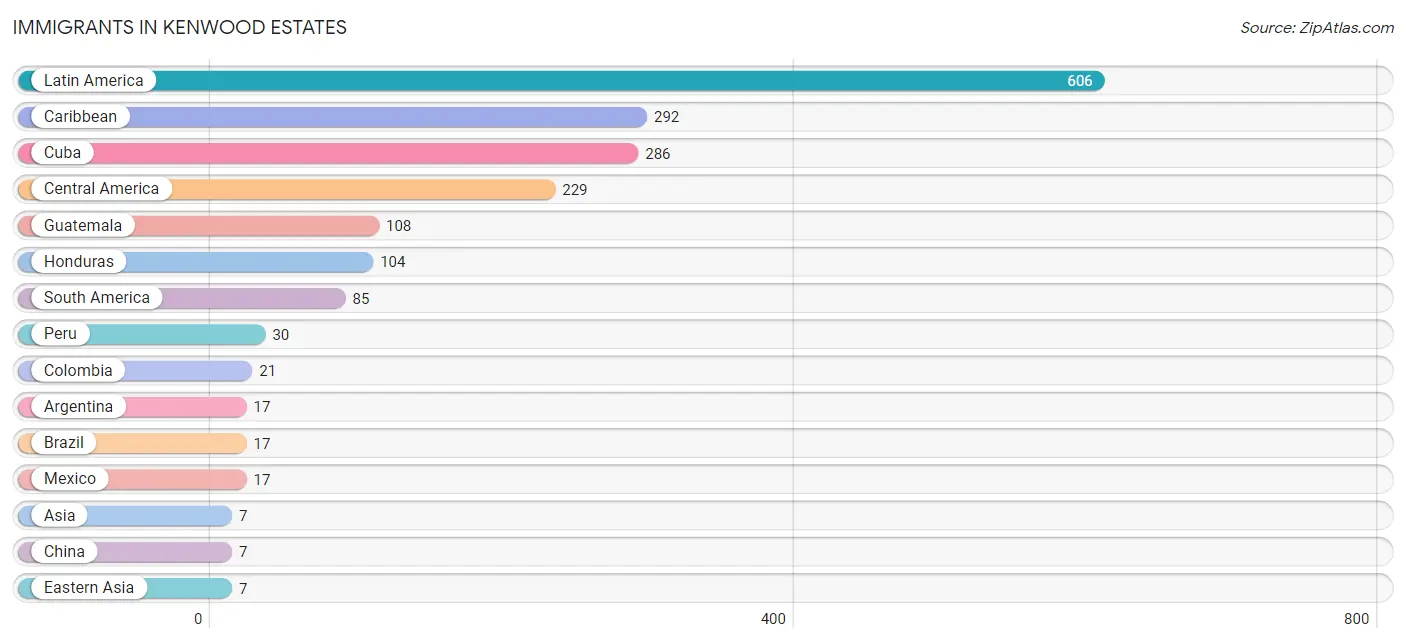
Immigrants in Kenwood Estates
The most numerous immigrant groups reported in Kenwood Estates came from Latin America (606 | 48.4%), Caribbean (292 | 23.3%), Cuba (286 | 22.8%), Central America (229 | 18.3%), and Guatemala (108 | 8.6%), together accounting for 121.5% of all Kenwood Estates residents.
| Immigration Origin | # Population | % Population |
| Argentina | 17 | 1.4% |
| Asia | 7 | 0.6% |
| Brazil | 17 | 1.4% |
| Caribbean | 292 | 23.3% |
| Central America | 229 | 18.3% |
| China | 7 | 0.6% |
| Colombia | 21 | 1.7% |
| Cuba | 286 | 22.8% |
| Eastern Asia | 7 | 0.6% |
| Guatemala | 108 | 8.6% |
| Honduras | 104 | 8.3% |
| Jamaica | 6 | 0.5% |
| Latin America | 606 | 48.4% |
| Mexico | 17 | 1.4% |
| Peru | 30 | 2.4% |
| South America | 85 | 6.8% |
| Taiwan | 7 | 0.6% | View All 17 Rows |
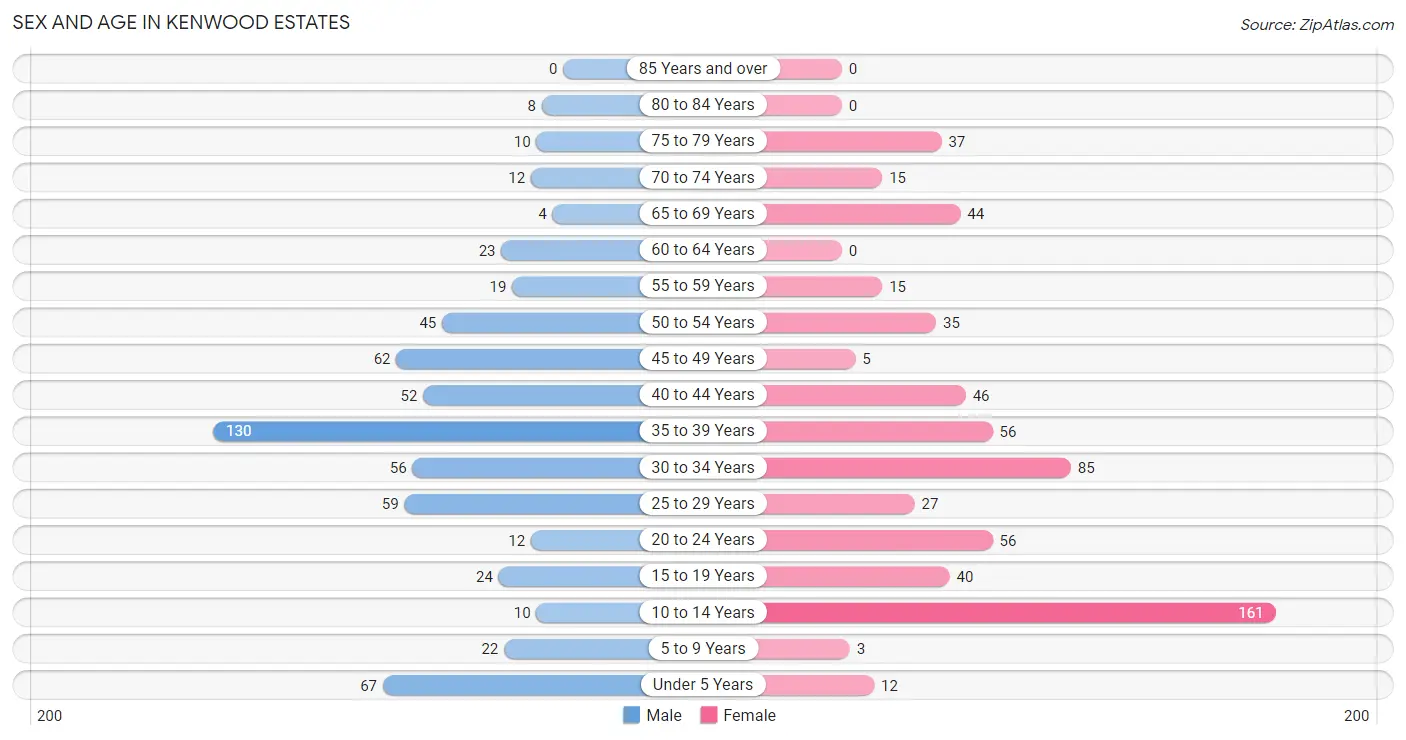
Sex and Age in Kenwood Estates
Sex and Age in Kenwood Estates
The most populous age groups in Kenwood Estates are 35 to 39 Years (130 | 21.1%) for men and 10 to 14 Years (161 | 25.3%) for women.
| Age Bracket | Male | Female |
| Under 5 Years | 67 (10.9%) | 12 (1.9%) |
| 5 to 9 Years | 22 (3.6%) | 3 (0.5%) |
| 10 to 14 Years | 10 (1.6%) | 161 (25.3%) |
| 15 to 19 Years | 24 (3.9%) | 40 (6.3%) |
| 20 to 24 Years | 12 (1.9%) | 56 (8.8%) |
| 25 to 29 Years | 59 (9.6%) | 27 (4.2%) |
| 30 to 34 Years | 56 (9.1%) | 85 (13.3%) |
| 35 to 39 Years | 130 (21.1%) | 56 (8.8%) |
| 40 to 44 Years | 52 (8.5%) | 46 (7.2%) |
| 45 to 49 Years | 62 (10.1%) | 5 (0.8%) |
| 50 to 54 Years | 45 (7.3%) | 35 (5.5%) |
| 55 to 59 Years | 19 (3.1%) | 15 (2.4%) |
| 60 to 64 Years | 23 (3.7%) | 0 (0.0%) |
| 65 to 69 Years | 4 (0.6%) | 44 (6.9%) |
| 70 to 74 Years | 12 (1.9%) | 15 (2.4%) |
| 75 to 79 Years | 10 (1.6%) | 37 (5.8%) |
| 80 to 84 Years | 8 (1.3%) | 0 (0.0%) |
| 85 Years and over | 0 (0.0%) | 0 (0.0%) |
| Total | 615 (100.0%) | 637 (100.0%) |
Families and Households in Kenwood Estates
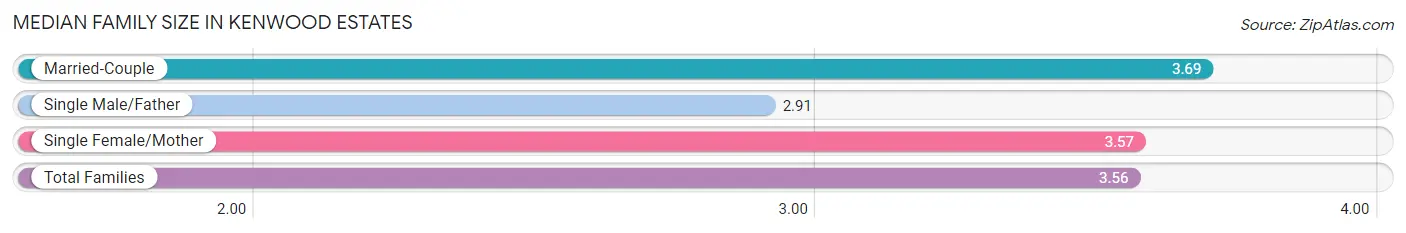
Median Family Size in Kenwood Estates
The median family size in Kenwood Estates is 3.56 persons per family, with married-couple families (101 | 34.7%) accounting for the largest median family size of 3.69 persons per family. On the other hand, single male/father families (22 | 7.6%) represent the smallest median family size with 2.91 persons per family.
| Family Type | # Families | Family Size |
| Married-Couple | 101 (34.7%) | 3.69 |
| Single Male/Father | 22 (7.6%) | 2.91 |
| Single Female/Mother | 168 (57.7%) | 3.57 |
| Total Families | 291 (100.0%) | 3.56 |
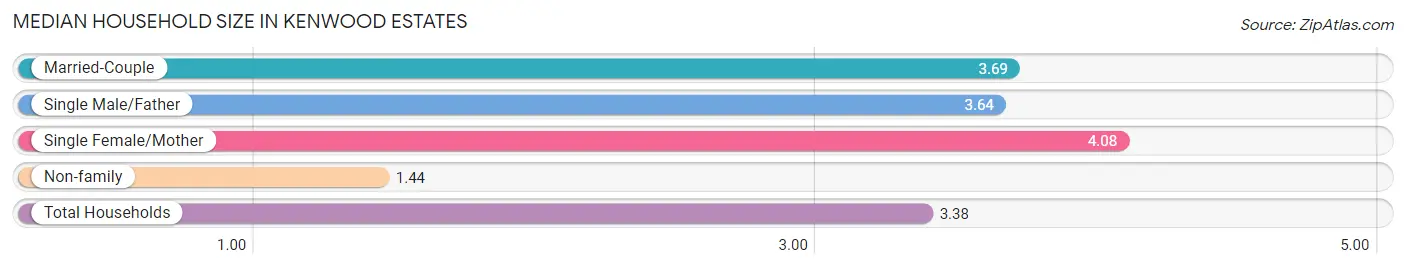
Median Household Size in Kenwood Estates
The median household size in Kenwood Estates is 3.38 persons per household, with single female/mother households (168 | 45.4%) accounting for the largest median household size of 4.08 persons per household. non-family households (79 | 21.3%) represent the smallest median household size with 1.44 persons per household.
| Household Type | # Households | Household Size |
| Married-Couple | 101 (27.3%) | 3.69 |
| Single Male/Father | 22 (5.9%) | 3.64 |
| Single Female/Mother | 168 (45.4%) | 4.08 |
| Non-family | 79 (21.3%) | 1.44 |
| Total Households | 370 (100.0%) | 3.38 |
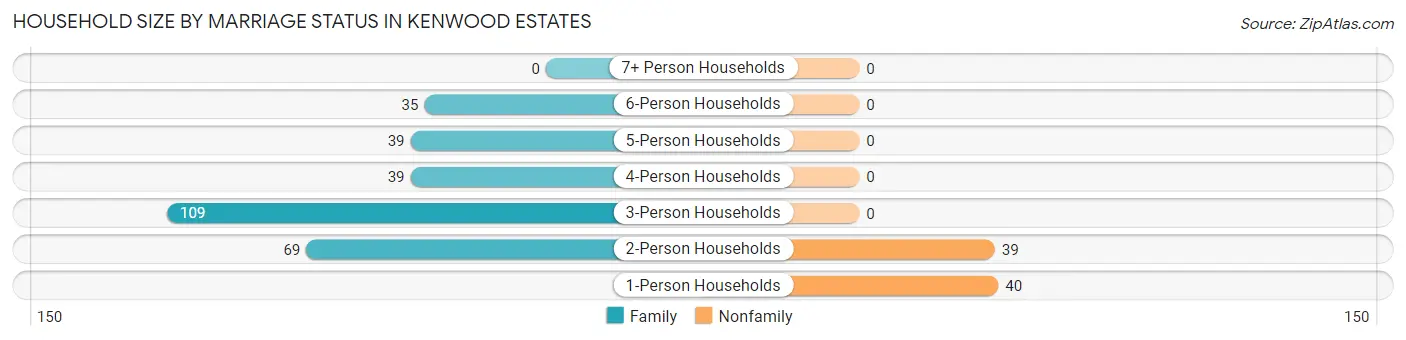
Household Size by Marriage Status in Kenwood Estates
Out of a total of 370 households in Kenwood Estates, 291 (78.6%) are family households, while 79 (21.3%) are nonfamily households. The most numerous type of family households are 3-person households, comprising 109, and the most common type of nonfamily households are 1-person households, comprising 40.
| Household Size | Family Households | Nonfamily Households |
| 1-Person Households | - | 40 (10.8%) |
| 2-Person Households | 69 (18.6%) | 39 (10.5%) |
| 3-Person Households | 109 (29.5%) | 0 (0.0%) |
| 4-Person Households | 39 (10.5%) | 0 (0.0%) |
| 5-Person Households | 39 (10.5%) | 0 (0.0%) |
| 6-Person Households | 35 (9.5%) | 0 (0.0%) |
| 7+ Person Households | 0 (0.0%) | 0 (0.0%) |
| Total | 291 (78.6%) | 79 (21.3%) |
Female Fertility in Kenwood Estates
Fertility by Age in Kenwood Estates
| Age Bracket | Women with Births | Births / 1,000 Women |
| 15 to 19 years | 0 (0.0%) | 0.0 |
| 20 to 34 years | 0 (0.0%) | 0.0 |
| 35 to 50 years | 0 (0.0%) | 0.0 |
| Total | 0 (0.0%) | 0.0 |
Fertility by Age by Marriage Status in Kenwood Estates
| Age Bracket | Married | Unmarried |
| 15 to 19 years | 0 (0.0%) | 0 (0.0%) |
| 20 to 34 years | 0 (0.0%) | 0 (0.0%) |
| 35 to 50 years | 0 (0.0%) | 0 (0.0%) |
| Total | 0 (0.0%) | 0 (0.0%) |
Fertility by Education in Kenwood Estates
| Educational Attainment | Women with Births | Births / 1,000 Women |
| Less than High School | 0 (0.0%) | 0.0 |
| High School Diploma | 0 (0.0%) | 0.0 |
| College or Associate's Degree | 0 (0.0%) | 0.0 |
| Bachelor's Degree | 0 (0.0%) | 0.0 |
| Graduate Degree | 0 (0.0%) | 0.0 |
| Total | 0 (0.0%) | 0.0 |
Fertility by Education by Marriage Status in Kenwood Estates
| Educational Attainment | Married | Unmarried |
| Less than High School | 0 (0.0%) | 0 (0.0%) |
| High School Diploma | 0 (0.0%) | 0 (0.0%) |
| College or Associate's Degree | 0 (0.0%) | 0 (0.0%) |
| Bachelor's Degree | 0 (0.0%) | 0 (0.0%) |
| Graduate Degree | 0 (0.0%) | 0 (0.0%) |
| Total | 0 (0.0%) | 0 (0.0%) |
Income in Kenwood Estates
Income Overview in Kenwood Estates
Per Capita Income in Kenwood Estates is $22,094, while median incomes of families and households are $72,344 and $63,214 respectively.
| Characteristic | Number | Measure |
| Per Capita Income | 1,252 | $22,094 |
| Median Family Income | 291 | $72,344 |
| Mean Family Income | 291 | $57,477 |
| Median Household Income | 370 | $63,214 |
| Mean Household Income | 370 | $64,925 |
| Income Deficit | 291 | $0 |
| Wage / Income Gap (%) | 1,252 | 14.77% |
| Wage / Income Gap ($) | 1,252 | 85.23¢ per $1 |
| Gini / Inequality Index | 1,252 | 0.35 |
Earnings by Sex in Kenwood Estates
Average Earnings in Kenwood Estates are $37,308, $39,500 for men and $33,667 for women, a difference of 14.8%.
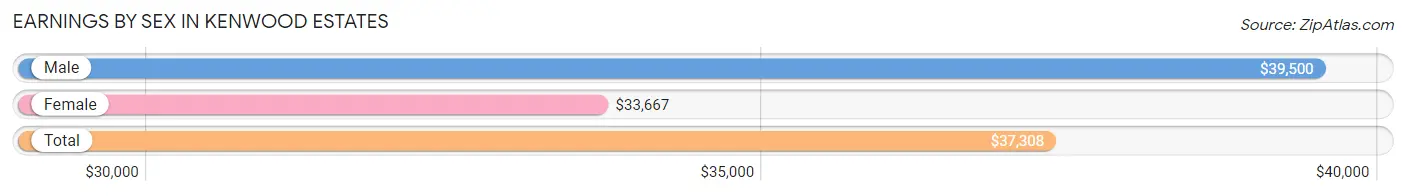
| Sex | Number | Average Earnings |
| Male | 452 (67.1%) | $39,500 |
| Female | 222 (32.9%) | $33,667 |
| Total | 674 (100.0%) | $37,308 |
Earnings by Sex by Income Bracket in Kenwood Estates
The most common earnings brackets in Kenwood Estates are $25,000 to $29,999 for men (127 | 28.1%) and $65,000 to $74,999 for women (47 | 21.2%).
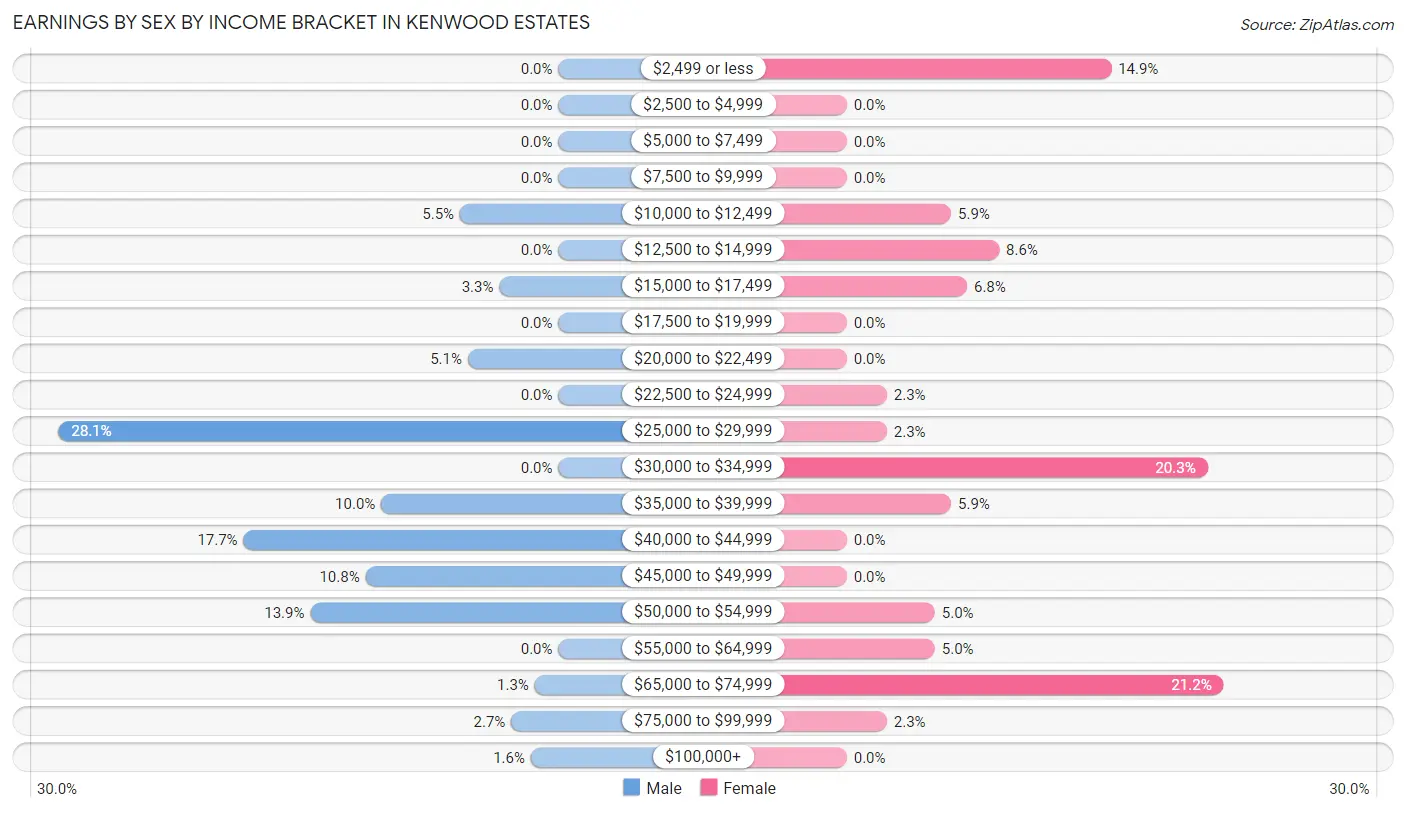
| Income | Male | Female |
| $2,499 or less | 0 (0.0%) | 33 (14.9%) |
| $2,500 to $4,999 | 0 (0.0%) | 0 (0.0%) |
| $5,000 to $7,499 | 0 (0.0%) | 0 (0.0%) |
| $7,500 to $9,999 | 0 (0.0%) | 0 (0.0%) |
| $10,000 to $12,499 | 25 (5.5%) | 13 (5.9%) |
| $12,500 to $14,999 | 0 (0.0%) | 19 (8.6%) |
| $15,000 to $17,499 | 15 (3.3%) | 15 (6.8%) |
| $17,500 to $19,999 | 0 (0.0%) | 0 (0.0%) |
| $20,000 to $22,499 | 23 (5.1%) | 0 (0.0%) |
| $22,500 to $24,999 | 0 (0.0%) | 5 (2.2%) |
| $25,000 to $29,999 | 127 (28.1%) | 5 (2.2%) |
| $30,000 to $34,999 | 0 (0.0%) | 45 (20.3%) |
| $35,000 to $39,999 | 45 (10.0%) | 13 (5.9%) |
| $40,000 to $44,999 | 80 (17.7%) | 0 (0.0%) |
| $45,000 to $49,999 | 49 (10.8%) | 0 (0.0%) |
| $50,000 to $54,999 | 63 (13.9%) | 11 (5.0%) |
| $55,000 to $64,999 | 0 (0.0%) | 11 (5.0%) |
| $65,000 to $74,999 | 6 (1.3%) | 47 (21.2%) |
| $75,000 to $99,999 | 12 (2.6%) | 5 (2.2%) |
| $100,000+ | 7 (1.5%) | 0 (0.0%) |
| Total | 452 (100.0%) | 222 (100.0%) |
Earnings by Sex by Educational Attainment in Kenwood Estates
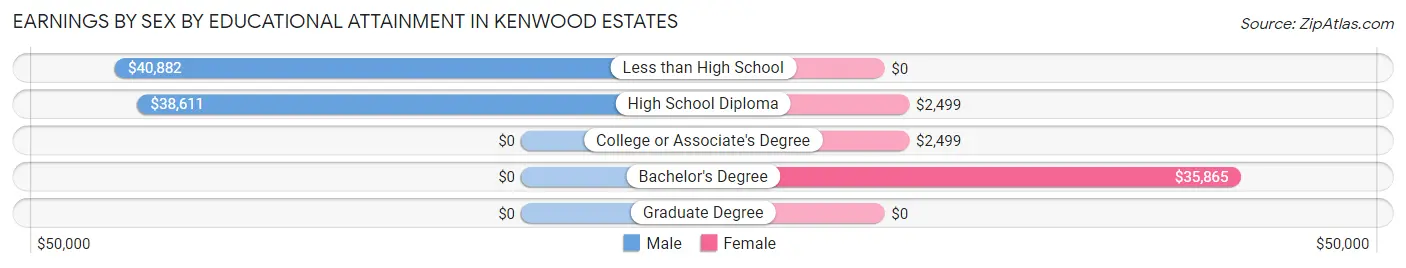
| Educational Attainment | Male Income | Female Income |
| Less than High School | $40,882 | $0 |
| High School Diploma | $38,611 | $2,499 |
| College or Associate's Degree | - | - |
| Bachelor's Degree | - | - |
| Graduate Degree | - | - |
| Total | $39,667 | $0 |
Family Income in Kenwood Estates
Family Income Brackets in Kenwood Estates
According to the Kenwood Estates family income data, there are 68 families falling into the $50,000 to $74,999 income range, which is the most common income bracket and makes up 23.4% of all families.
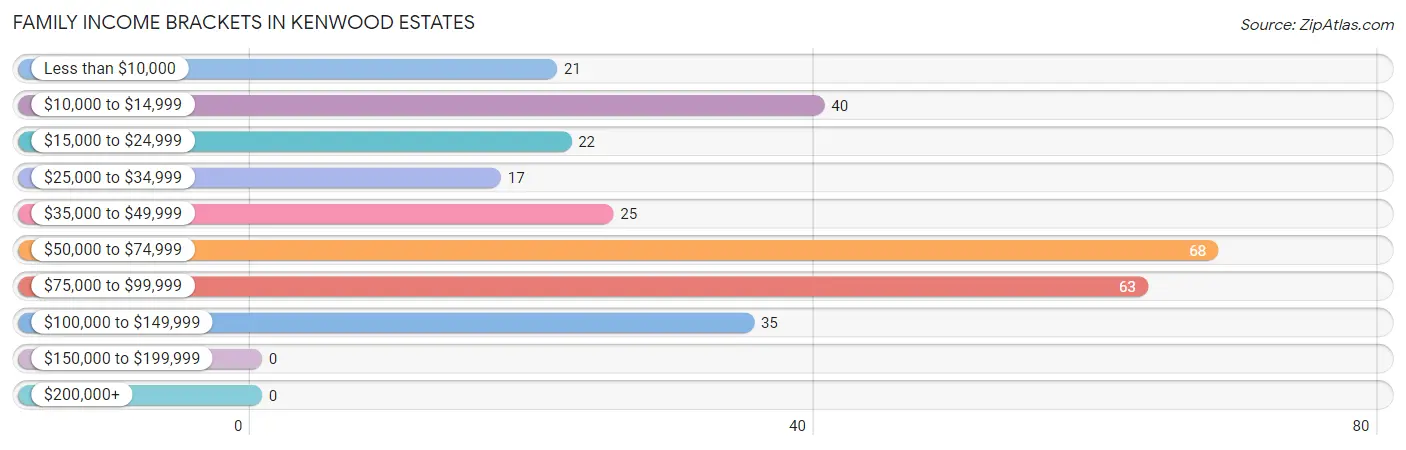
| Income Bracket | # Families | % Families |
| Less than $10,000 | 21 | 7.2% |
| $10,000 to $14,999 | 40 | 13.7% |
| $15,000 to $24,999 | 22 | 7.6% |
| $25,000 to $34,999 | 17 | 5.8% |
| $35,000 to $49,999 | 25 | 8.6% |
| $50,000 to $74,999 | 68 | 23.4% |
| $75,000 to $99,999 | 63 | 21.6% |
| $100,000 to $149,999 | 35 | 12.0% |
| $150,000 to $199,999 | 0 | 0.0% |
| $200,000+ | 0 | 0.0% |
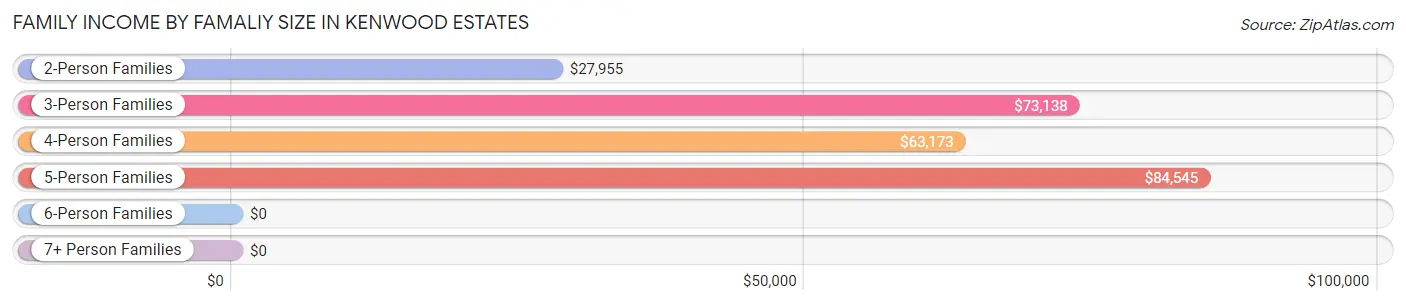
Family Income by Famaliy Size in Kenwood Estates
5-person families (74 | 25.4%) account for the highest median family income in Kenwood Estates with $84,545 per family, while 3-person families (94 | 32.3%) have the highest median income of $24,379 per family member.
| Income Bracket | # Families | Median Income |
| 2-Person Families | 96 (33.0%) | $27,955 |
| 3-Person Families | 94 (32.3%) | $73,138 |
| 4-Person Families | 27 (9.3%) | $63,173 |
| 5-Person Families | 74 (25.4%) | $84,545 |
| 6-Person Families | 0 (0.0%) | $0 |
| 7+ Person Families | 0 (0.0%) | $0 |
| Total | 291 (100.0%) | $72,344 |
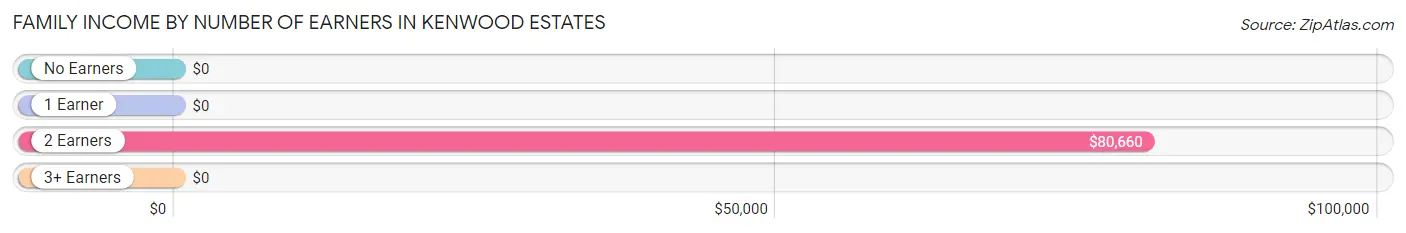
Family Income by Number of Earners in Kenwood Estates
| Number of Earners | # Families | Median Income |
| No Earners | 39 (13.4%) | $0 |
| 1 Earner | 153 (52.6%) | $0 |
| 2 Earners | 53 (18.2%) | $80,660 |
| 3+ Earners | 46 (15.8%) | $0 |
| Total | 291 (100.0%) | $72,344 |
Household Income in Kenwood Estates
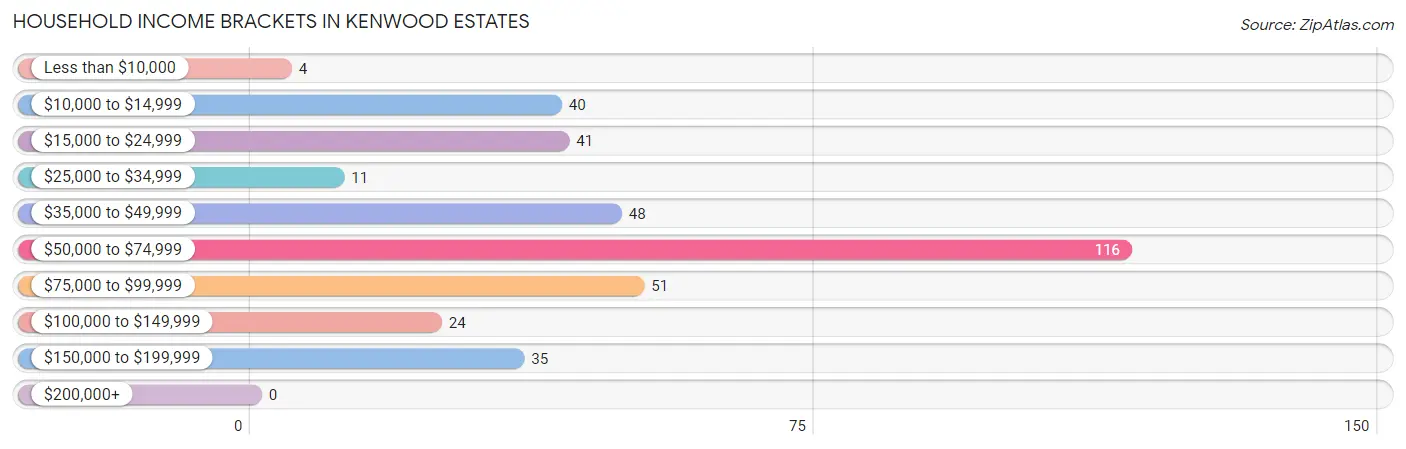
Household Income Brackets in Kenwood Estates
With 116 households falling in the category, the $50,000 to $74,999 income range is the most frequent in Kenwood Estates, accounting for 31.4% of all households.
| Income Bracket | # Households | % Households |
| Less than $10,000 | 4 | 1.1% |
| $10,000 to $14,999 | 40 | 10.8% |
| $15,000 to $24,999 | 41 | 11.1% |
| $25,000 to $34,999 | 11 | 3.0% |
| $35,000 to $49,999 | 48 | 13.0% |
| $50,000 to $74,999 | 116 | 31.4% |
| $75,000 to $99,999 | 51 | 13.8% |
| $100,000 to $149,999 | 24 | 6.5% |
| $150,000 to $199,999 | 35 | 9.5% |
| $200,000+ | 0 | 0.0% |
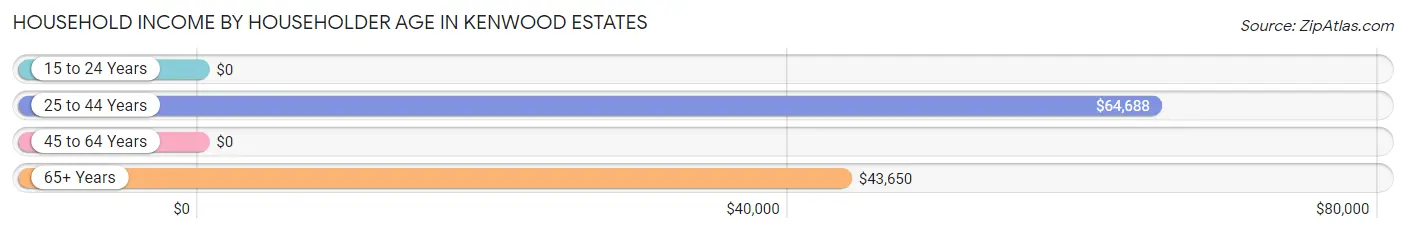
Household Income by Householder Age in Kenwood Estates
The median household income in Kenwood Estates is $63,214, with the highest median household income of $64,688 found in the 25 to 44 years age bracket for the primary householder. A total of 171 households (46.2%) fall into this category. Meanwhile, the 15 to 24 years age bracket for the primary householder has the lowest median household income of $0, with 4 households (1.1%) in this group.
| Income Bracket | # Households | Median Income |
| 15 to 24 Years | 4 (1.1%) | $0 |
| 25 to 44 Years | 171 (46.2%) | $64,688 |
| 45 to 64 Years | 128 (34.6%) | $0 |
| 65+ Years | 67 (18.1%) | $43,650 |
| Total | 370 (100.0%) | $63,214 |
Poverty in Kenwood Estates
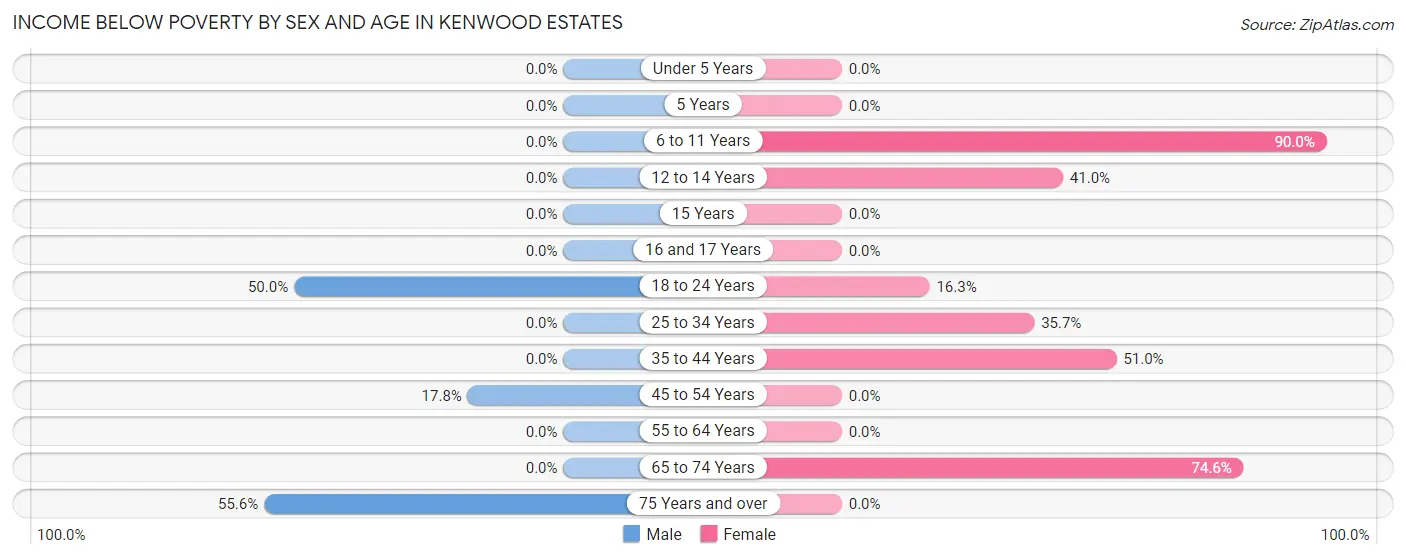
Income Below Poverty by Sex and Age in Kenwood Estates
With 5.7% poverty level for males and 36.4% for females among the residents of Kenwood Estates, 75 year old and over males and 6 to 11 year old females are the most vulnerable to poverty, with 10 males (55.6%) and 27 females (90.0%) in their respective age groups living below the poverty level.
| Age Bracket | Male | Female |
| Under 5 Years | 0 (0.0%) | 0 (0.0%) |
| 5 Years | 0 (0.0%) | 0 (0.0%) |
| 6 to 11 Years | 0 (0.0%) | 27 (90.0%) |
| 12 to 14 Years | 0 (0.0%) | 55 (41.0%) |
| 15 Years | 0 (0.0%) | 0 (0.0%) |
| 16 and 17 Years | 0 (0.0%) | 0 (0.0%) |
| 18 to 24 Years | 6 (50.0%) | 14 (16.3%) |
| 25 to 34 Years | 0 (0.0%) | 40 (35.7%) |
| 35 to 44 Years | 0 (0.0%) | 52 (51.0%) |
| 45 to 54 Years | 19 (17.8%) | 0 (0.0%) |
| 55 to 64 Years | 0 (0.0%) | 0 (0.0%) |
| 65 to 74 Years | 0 (0.0%) | 44 (74.6%) |
| 75 Years and over | 10 (55.6%) | 0 (0.0%) |
| Total | 35 (5.7%) | 232 (36.4%) |
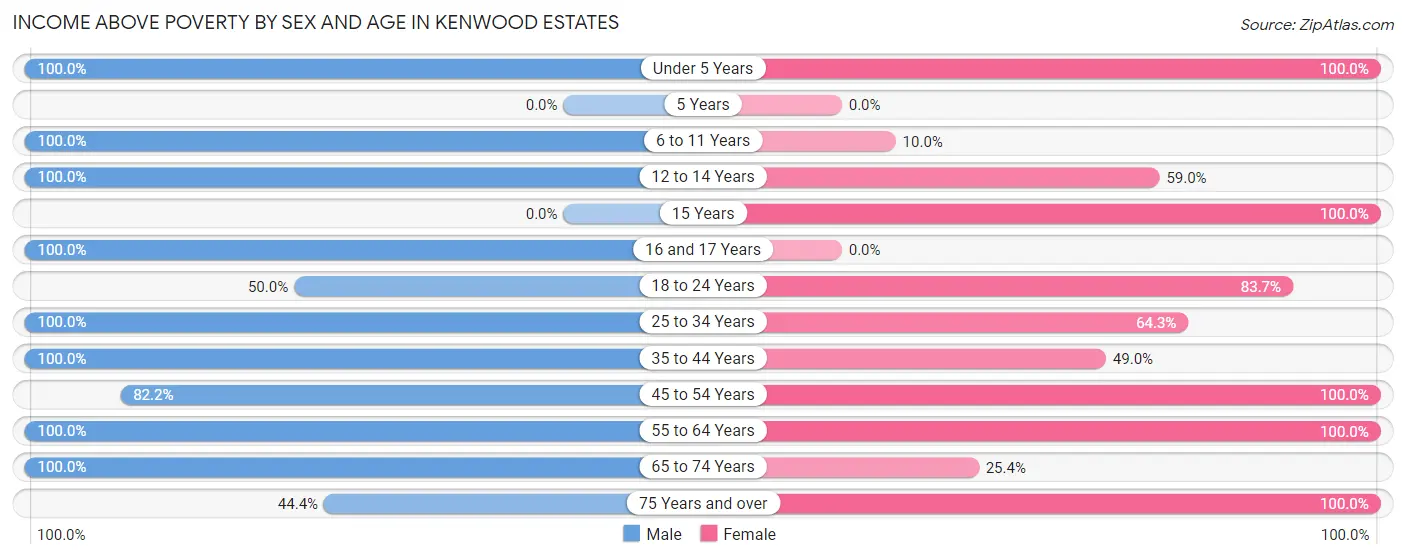
Income Above Poverty by Sex and Age in Kenwood Estates
According to the poverty statistics in Kenwood Estates, males aged under 5 years and females aged under 5 years are the age groups that are most secure financially, with 100.0% of males and 100.0% of females in these age groups living above the poverty line.
| Age Bracket | Male | Female |
| Under 5 Years | 67 (100.0%) | 12 (100.0%) |
| 5 Years | 0 (0.0%) | 0 (0.0%) |
| 6 to 11 Years | 22 (100.0%) | 3 (10.0%) |
| 12 to 14 Years | 10 (100.0%) | 79 (59.0%) |
| 15 Years | 0 (0.0%) | 10 (100.0%) |
| 16 and 17 Years | 24 (100.0%) | 0 (0.0%) |
| 18 to 24 Years | 6 (50.0%) | 72 (83.7%) |
| 25 to 34 Years | 115 (100.0%) | 72 (64.3%) |
| 35 to 44 Years | 182 (100.0%) | 50 (49.0%) |
| 45 to 54 Years | 88 (82.2%) | 40 (100.0%) |
| 55 to 64 Years | 42 (100.0%) | 15 (100.0%) |
| 65 to 74 Years | 16 (100.0%) | 15 (25.4%) |
| 75 Years and over | 8 (44.4%) | 37 (100.0%) |
| Total | 580 (94.3%) | 405 (63.6%) |
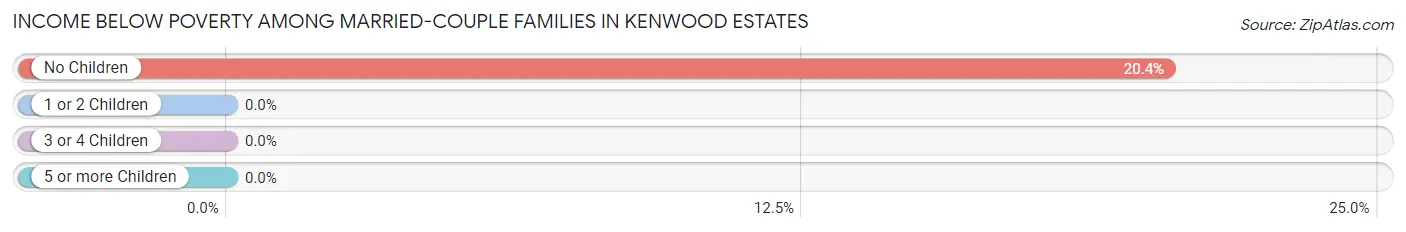
Income Below Poverty Among Married-Couple Families in Kenwood Estates
The poverty statistics for married-couple families in Kenwood Estates show that 9.9% or 10 of the total 101 families live below the poverty line. Families with no children have the highest poverty rate of 20.4%, comprising of 10 families. On the other hand, families with 1 or 2 children have the lowest poverty rate of 0.0%, which includes 0 families.
| Children | Above Poverty | Below Poverty |
| No Children | 39 (79.6%) | 10 (20.4%) |
| 1 or 2 Children | 52 (100.0%) | 0 (0.0%) |
| 3 or 4 Children | 0 (0.0%) | 0 (0.0%) |
| 5 or more Children | 0 (0.0%) | 0 (0.0%) |
| Total | 91 (90.1%) | 10 (9.9%) |
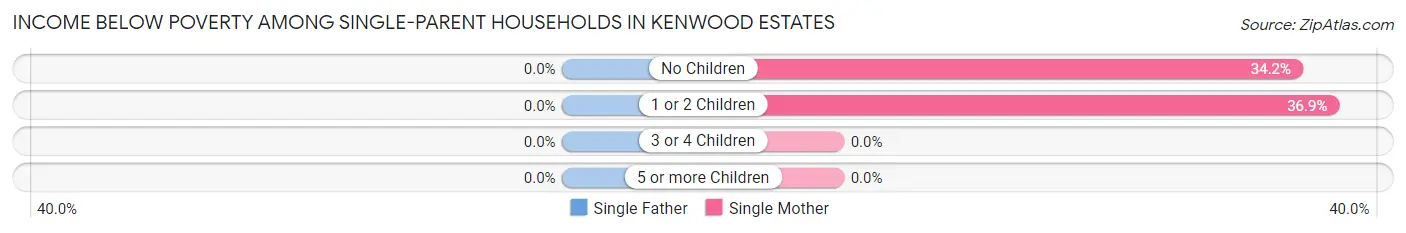
Income Below Poverty Among Single-Parent Households in Kenwood Estates
| Children | Single Father | Single Mother |
| No Children | 0 (0.0%) | 13 (34.2%) |
| 1 or 2 Children | 0 (0.0%) | 48 (36.9%) |
| 3 or 4 Children | 0 (0.0%) | 0 (0.0%) |
| 5 or more Children | 0 (0.0%) | 0 (0.0%) |
| Total | 0 (0.0%) | 61 (36.3%) |
Income Below Poverty Among Married-Couple vs Single-Parent Households in Kenwood Estates
The poverty data for Kenwood Estates shows that 10 of the married-couple family households (9.9%) and 61 of the single-parent households (32.1%) are living below the poverty level. Within the married-couple family households, those with no children have the highest poverty rate, with 10 households (20.4%) falling below the poverty line. Among the single-parent households, those with 1 or 2 children have the highest poverty rate, with 48 household (32.9%) living below poverty.
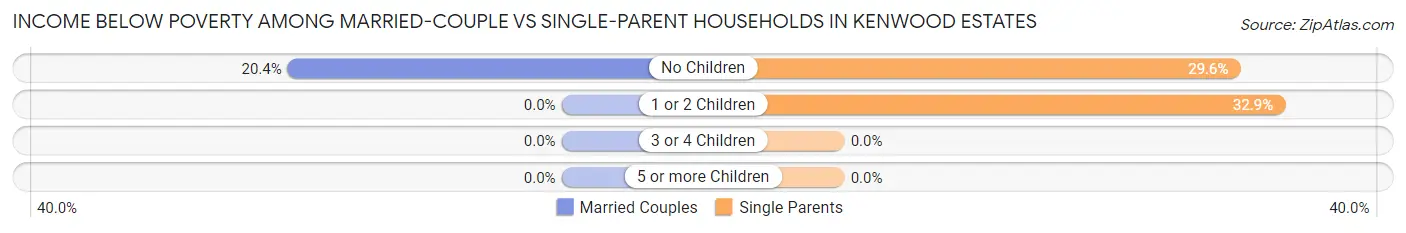
| Children | Married-Couple Families | Single-Parent Households |
| No Children | 10 (20.4%) | 13 (29.5%) |
| 1 or 2 Children | 0 (0.0%) | 48 (32.9%) |
| 3 or 4 Children | 0 (0.0%) | 0 (0.0%) |
| 5 or more Children | 0 (0.0%) | 0 (0.0%) |
| Total | 10 (9.9%) | 61 (32.1%) |
Employment Characteristics in Kenwood Estates
Employment by Class of Employer in Kenwood Estates
Among the 674 employed individuals in Kenwood Estates, private company employees (563 | 83.5%), local government employees (53 | 7.9%), and not-for-profit organizations (25 | 3.7%) make up the most common classes of employment.
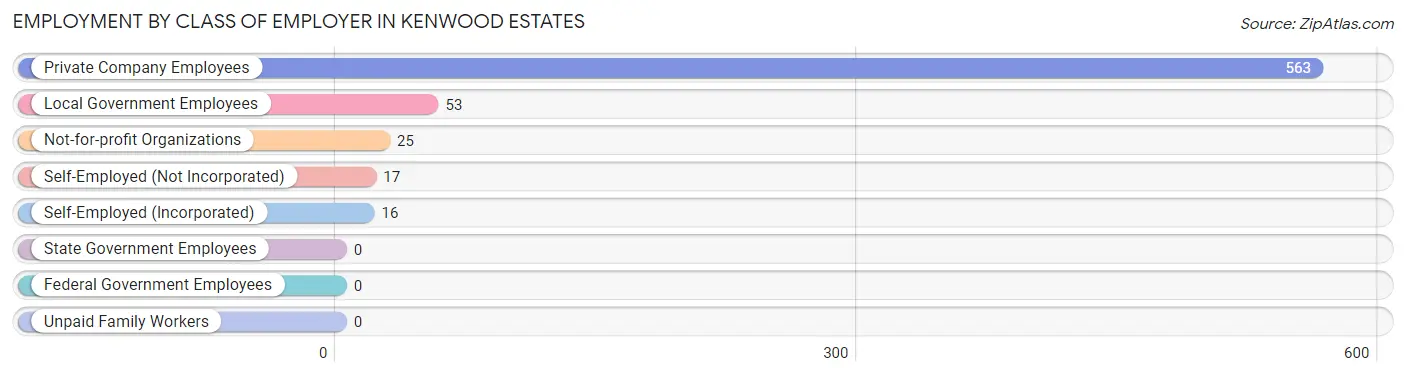
| Employer Class | # Employees | % Employees |
| Private Company Employees | 563 | 83.5% |
| Self-Employed (Incorporated) | 16 | 2.4% |
| Self-Employed (Not Incorporated) | 17 | 2.5% |
| Not-for-profit Organizations | 25 | 3.7% |
| Local Government Employees | 53 | 7.9% |
| State Government Employees | 0 | 0.0% |
| Federal Government Employees | 0 | 0.0% |
| Unpaid Family Workers | 0 | 0.0% |
| Total | 674 | 100.0% |
Employment Status by Age in Kenwood Estates
According to the labor force statistics for Kenwood Estates, out of the total population over 16 years of age (967), 70.1% or 678 individuals are in the labor force, with 0.6% or 4 of them unemployed. The age group with the highest labor force participation rate is 60 to 64 years, with 100.0% or 23 individuals in the labor force. Within the labor force, the 65 to 74 years age range has the highest percentage of unemployed individuals, with 33.3% or 4 of them being unemployed.
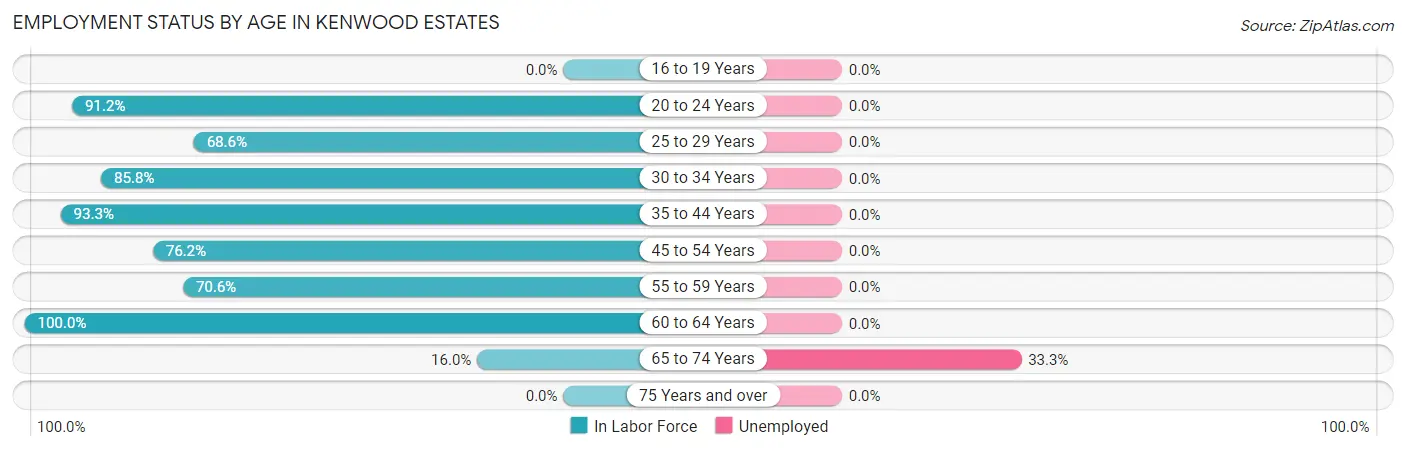
| Age Bracket | In Labor Force | Unemployed |
| 16 to 19 Years | 0 (0.0%) | 0 (0.0%) |
| 20 to 24 Years | 62 (91.2%) | 0 (0.0%) |
| 25 to 29 Years | 59 (68.6%) | 0 (0.0%) |
| 30 to 34 Years | 121 (85.8%) | 0 (0.0%) |
| 35 to 44 Years | 265 (93.3%) | 0 (0.0%) |
| 45 to 54 Years | 112 (76.2%) | 0 (0.0%) |
| 55 to 59 Years | 24 (70.6%) | 0 (0.0%) |
| 60 to 64 Years | 23 (100.0%) | 0 (0.0%) |
| 65 to 74 Years | 12 (16.0%) | 4 (33.3%) |
| 75 Years and over | 0 (0.0%) | 0 (0.0%) |
| Total | 678 (70.1%) | 4 (0.6%) |
Employment Status by Educational Attainment in Kenwood Estates
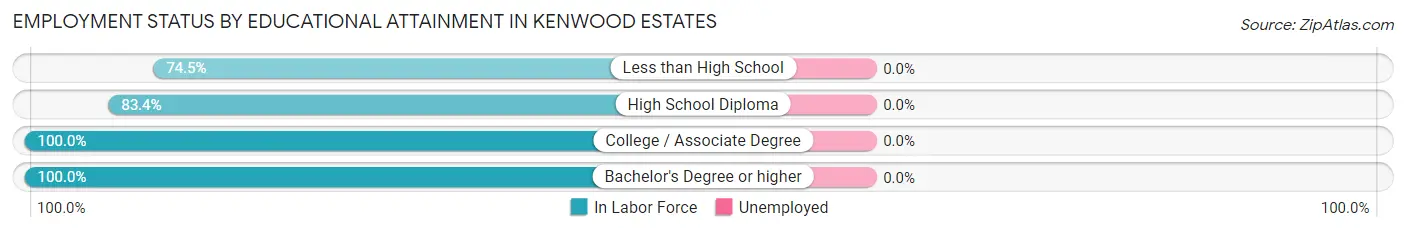
| Educational Attainment | In Labor Force | Unemployed |
| Less than High School | 246 (74.5%) | 0 (0.0%) |
| High School Diploma | 136 (83.4%) | 0 (0.0%) |
| College / Associate Degree | 71 (100.0%) | 0 (0.0%) |
| Bachelor's Degree or higher | 151 (100.0%) | 0 (0.0%) |
| Total | 604 (84.5%) | 0 (0.0%) |
Employment Occupations by Sex in Kenwood Estates
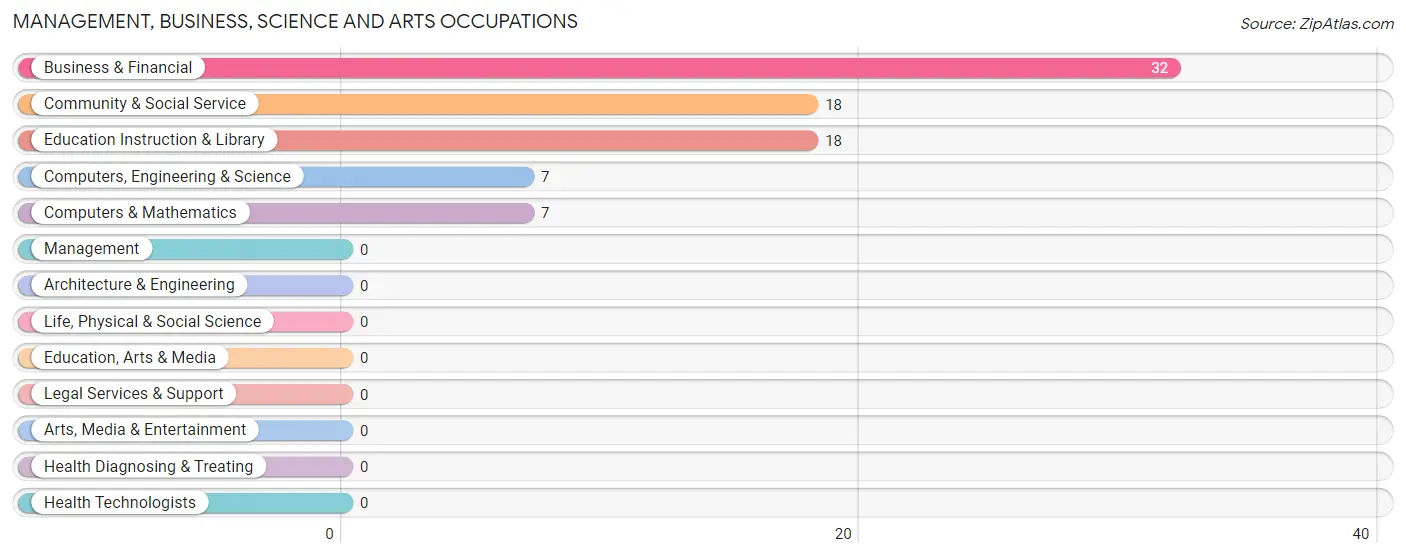
Management, Business, Science and Arts Occupations
The most common Management, Business, Science and Arts occupations in Kenwood Estates are Business & Financial (32 | 4.8%), Community & Social Service (18 | 2.7%), Education Instruction & Library (18 | 2.7%), Computers, Engineering & Science (7 | 1.0%), and Computers & Mathematics (7 | 1.0%).
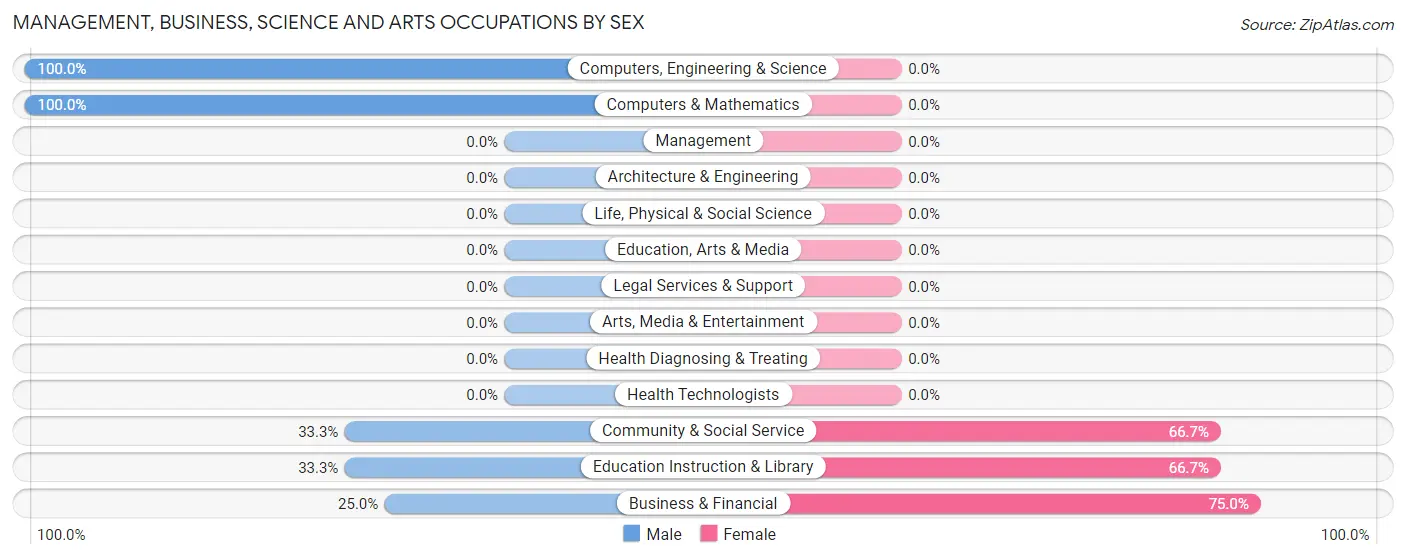
Management, Business, Science and Arts Occupations by Sex
Within the Management, Business, Science and Arts occupations in Kenwood Estates, the most male-oriented occupations are Computers, Engineering & Science (100.0%), Computers & Mathematics (100.0%), and Community & Social Service (33.3%), while the most female-oriented occupations are Business & Financial (75.0%), Community & Social Service (66.7%), and Education Instruction & Library (66.7%).
| Occupation | Male | Female |
| Management | 0 (0.0%) | 0 (0.0%) |
| Business & Financial | 8 (25.0%) | 24 (75.0%) |
| Computers, Engineering & Science | 7 (100.0%) | 0 (0.0%) |
| Computers & Mathematics | 7 (100.0%) | 0 (0.0%) |
| Architecture & Engineering | 0 (0.0%) | 0 (0.0%) |
| Life, Physical & Social Science | 0 (0.0%) | 0 (0.0%) |
| Community & Social Service | 6 (33.3%) | 12 (66.7%) |
| Education, Arts & Media | 0 (0.0%) | 0 (0.0%) |
| Legal Services & Support | 0 (0.0%) | 0 (0.0%) |
| Education Instruction & Library | 6 (33.3%) | 12 (66.7%) |
| Arts, Media & Entertainment | 0 (0.0%) | 0 (0.0%) |
| Health Diagnosing & Treating | 0 (0.0%) | 0 (0.0%) |
| Health Technologists | 0 (0.0%) | 0 (0.0%) |
| Total (Category) | 21 (36.8%) | 36 (63.2%) |
| Total (Overall) | 452 (67.1%) | 222 (32.9%) |
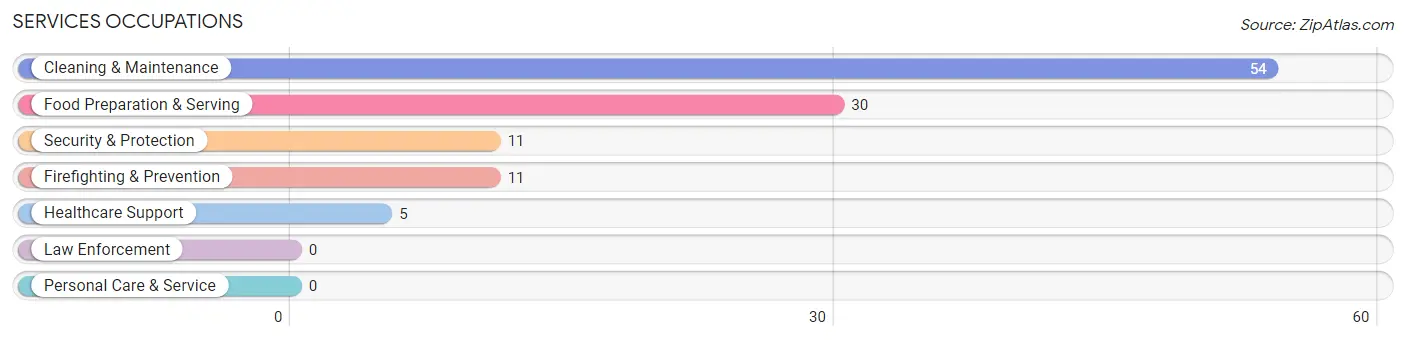
Services Occupations
The most common Services occupations in Kenwood Estates are Cleaning & Maintenance (54 | 8.0%), Food Preparation & Serving (30 | 4.4%), Security & Protection (11 | 1.6%), Firefighting & Prevention (11 | 1.6%), and Healthcare Support (5 | 0.7%).
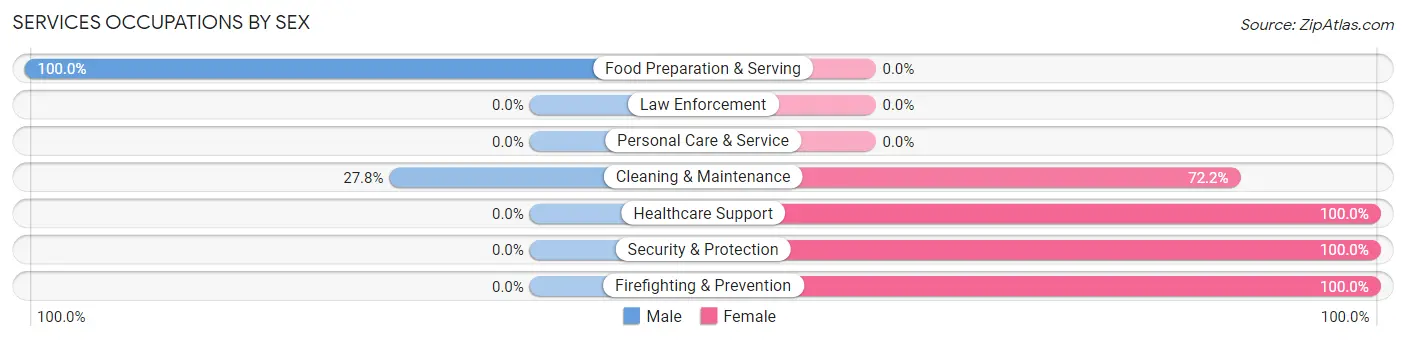
Services Occupations by Sex
Within the Services occupations in Kenwood Estates, the most male-oriented occupations are Food Preparation & Serving (100.0%), and Cleaning & Maintenance (27.8%), while the most female-oriented occupations are Healthcare Support (100.0%), Security & Protection (100.0%), and Firefighting & Prevention (100.0%).
| Occupation | Male | Female |
| Healthcare Support | 0 (0.0%) | 5 (100.0%) |
| Security & Protection | 0 (0.0%) | 11 (100.0%) |
| Firefighting & Prevention | 0 (0.0%) | 11 (100.0%) |
| Law Enforcement | 0 (0.0%) | 0 (0.0%) |
| Food Preparation & Serving | 30 (100.0%) | 0 (0.0%) |
| Cleaning & Maintenance | 15 (27.8%) | 39 (72.2%) |
| Personal Care & Service | 0 (0.0%) | 0 (0.0%) |
| Total (Category) | 45 (45.0%) | 55 (55.0%) |
| Total (Overall) | 452 (67.1%) | 222 (32.9%) |
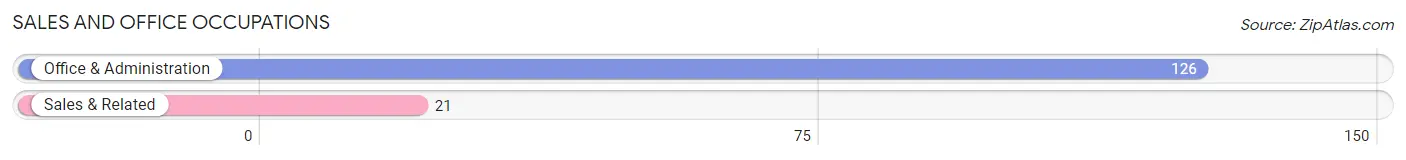
Sales and Office Occupations
The most common Sales and Office occupations in Kenwood Estates are Office & Administration (126 | 18.7%), and Sales & Related (21 | 3.1%).
Sales and Office Occupations by Sex
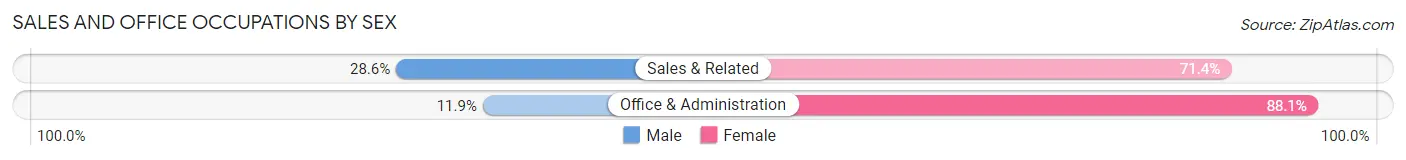
| Occupation | Male | Female |
| Sales & Related | 6 (28.6%) | 15 (71.4%) |
| Office & Administration | 15 (11.9%) | 111 (88.1%) |
| Total (Category) | 21 (14.3%) | 126 (85.7%) |
| Total (Overall) | 452 (67.1%) | 222 (32.9%) |
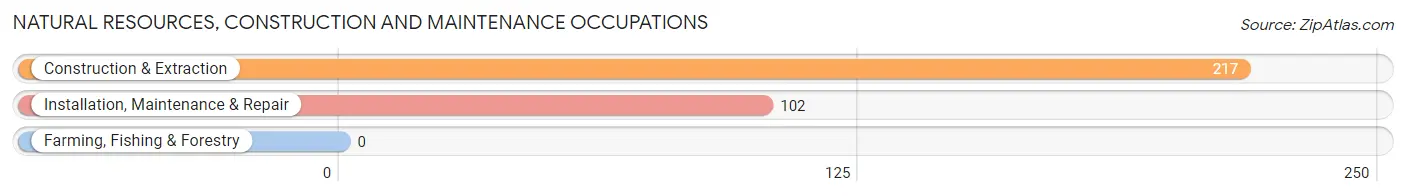
Natural Resources, Construction and Maintenance Occupations
The most common Natural Resources, Construction and Maintenance occupations in Kenwood Estates are Construction & Extraction (217 | 32.2%), and Installation, Maintenance & Repair (102 | 15.1%).
Natural Resources, Construction and Maintenance Occupations by Sex
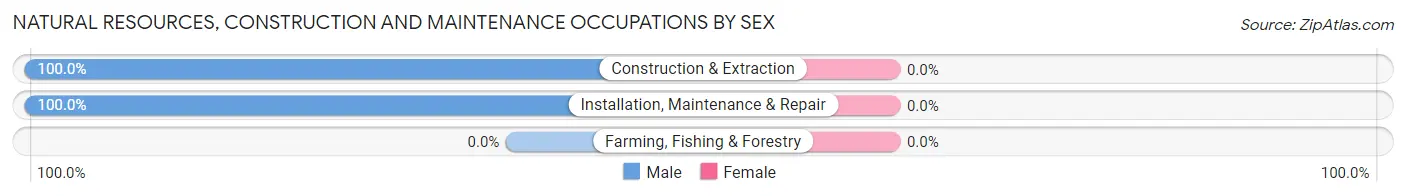
| Occupation | Male | Female |
| Farming, Fishing & Forestry | 0 (0.0%) | 0 (0.0%) |
| Construction & Extraction | 217 (100.0%) | 0 (0.0%) |
| Installation, Maintenance & Repair | 102 (100.0%) | 0 (0.0%) |
| Total (Category) | 319 (100.0%) | 0 (0.0%) |
| Total (Overall) | 452 (67.1%) | 222 (32.9%) |
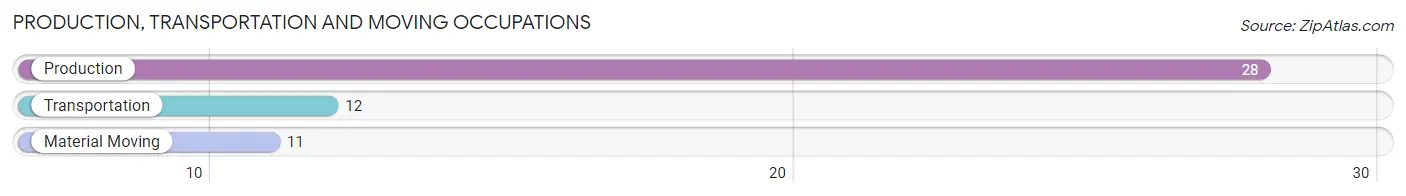
Production, Transportation and Moving Occupations
The most common Production, Transportation and Moving occupations in Kenwood Estates are Production (28 | 4.2%), Transportation (12 | 1.8%), and Material Moving (11 | 1.6%).
Production, Transportation and Moving Occupations by Sex
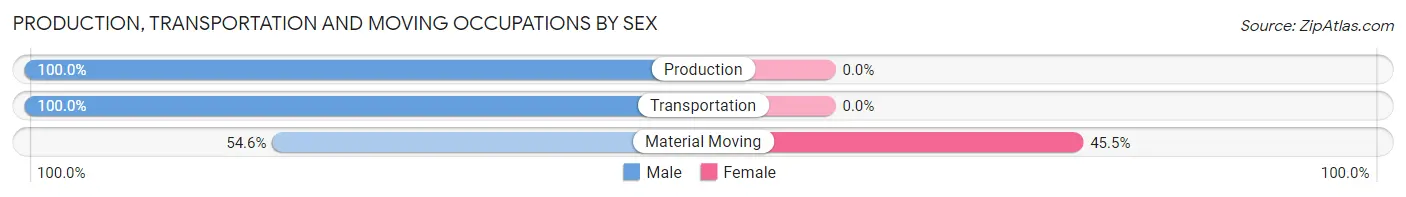
| Occupation | Male | Female |
| Production | 28 (100.0%) | 0 (0.0%) |
| Transportation | 12 (100.0%) | 0 (0.0%) |
| Material Moving | 6 (54.5%) | 5 (45.5%) |
| Total (Category) | 46 (90.2%) | 5 (9.8%) |
| Total (Overall) | 452 (67.1%) | 222 (32.9%) |
Employment Industries by Sex in Kenwood Estates
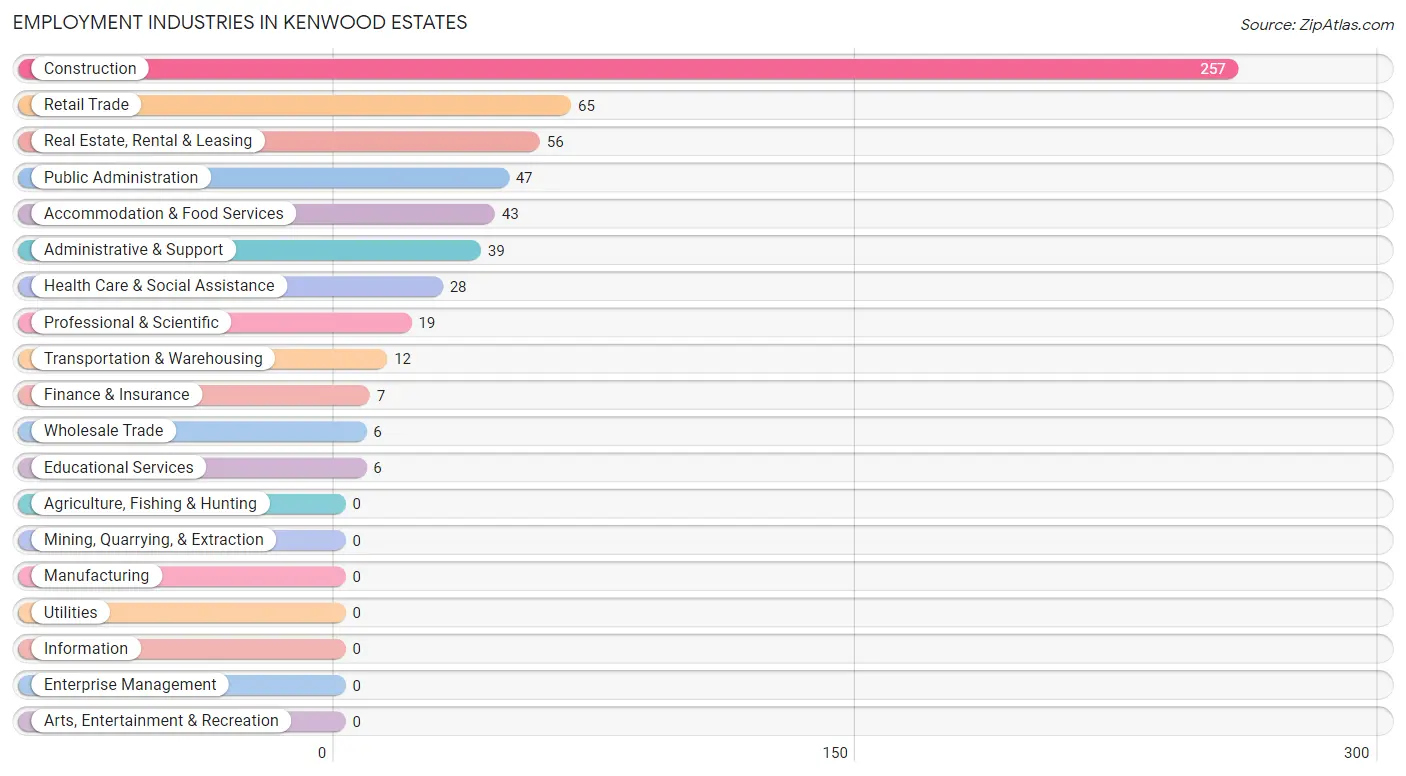
Employment Industries in Kenwood Estates
The major employment industries in Kenwood Estates include Construction (257 | 38.1%), Retail Trade (65 | 9.6%), Real Estate, Rental & Leasing (56 | 8.3%), Public Administration (47 | 7.0%), and Accommodation & Food Services (43 | 6.4%).
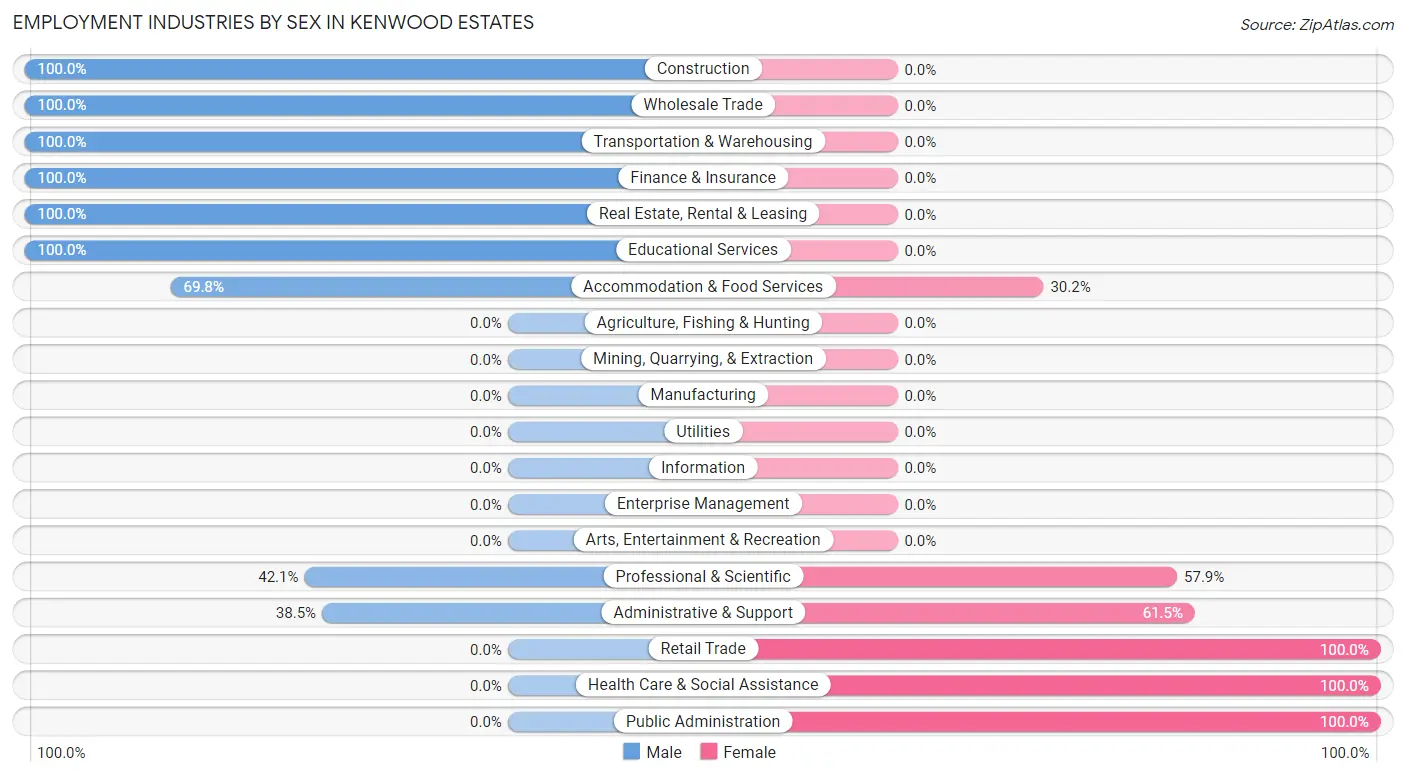
Employment Industries by Sex in Kenwood Estates
The Kenwood Estates industries that see more men than women are Construction (100.0%), Wholesale Trade (100.0%), and Transportation & Warehousing (100.0%), whereas the industries that tend to have a higher number of women are Retail Trade (100.0%), Health Care & Social Assistance (100.0%), and Public Administration (100.0%).
| Industry | Male | Female |
| Agriculture, Fishing & Hunting | 0 (0.0%) | 0 (0.0%) |
| Mining, Quarrying, & Extraction | 0 (0.0%) | 0 (0.0%) |
| Construction | 257 (100.0%) | 0 (0.0%) |
| Manufacturing | 0 (0.0%) | 0 (0.0%) |
| Wholesale Trade | 6 (100.0%) | 0 (0.0%) |
| Retail Trade | 0 (0.0%) | 65 (100.0%) |
| Transportation & Warehousing | 12 (100.0%) | 0 (0.0%) |
| Utilities | 0 (0.0%) | 0 (0.0%) |
| Information | 0 (0.0%) | 0 (0.0%) |
| Finance & Insurance | 7 (100.0%) | 0 (0.0%) |
| Real Estate, Rental & Leasing | 56 (100.0%) | 0 (0.0%) |
| Professional & Scientific | 8 (42.1%) | 11 (57.9%) |
| Enterprise Management | 0 (0.0%) | 0 (0.0%) |
| Administrative & Support | 15 (38.5%) | 24 (61.5%) |
| Educational Services | 6 (100.0%) | 0 (0.0%) |
| Health Care & Social Assistance | 0 (0.0%) | 28 (100.0%) |
| Arts, Entertainment & Recreation | 0 (0.0%) | 0 (0.0%) |
| Accommodation & Food Services | 30 (69.8%) | 13 (30.2%) |
| Public Administration | 0 (0.0%) | 47 (100.0%) |
| Total | 452 (67.1%) | 222 (32.9%) |
Education in Kenwood Estates
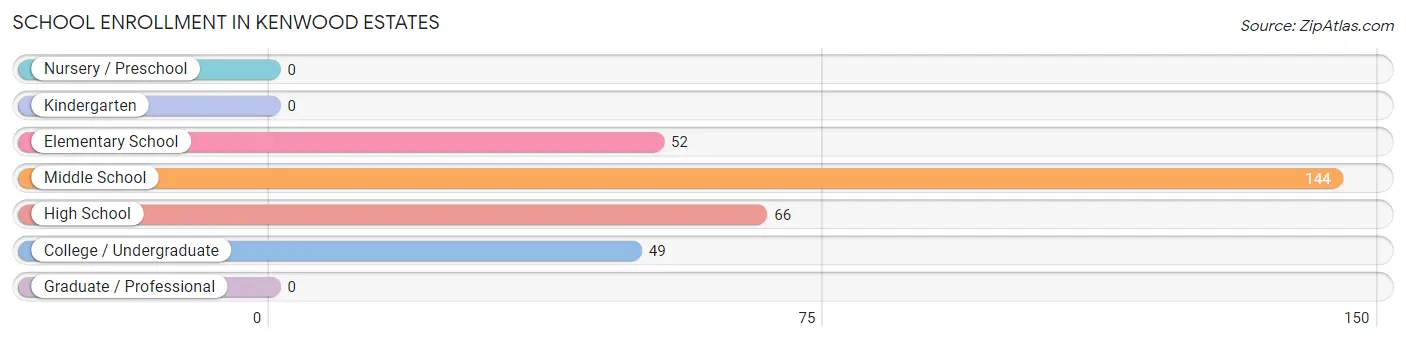
School Enrollment in Kenwood Estates
The most common levels of schooling among the 311 students in Kenwood Estates are middle school (144 | 46.3%), high school (66 | 21.2%), and elementary school (52 | 16.7%).
| School Level | # Students | % Students |
| Nursery / Preschool | 0 | 0.0% |
| Kindergarten | 0 | 0.0% |
| Elementary School | 52 | 16.7% |
| Middle School | 144 | 46.3% |
| High School | 66 | 21.2% |
| College / Undergraduate | 49 | 15.8% |
| Graduate / Professional | 0 | 0.0% |
| Total | 311 | 100.0% |
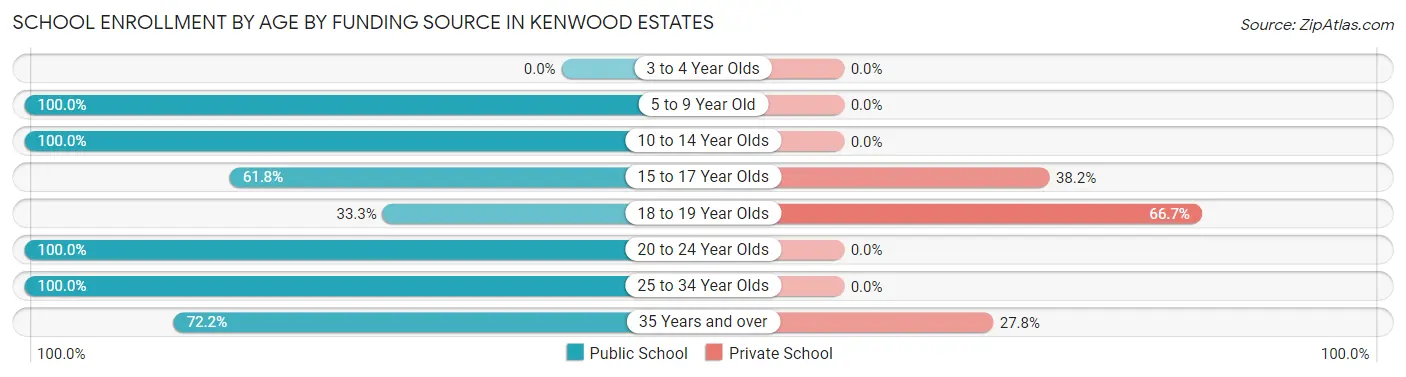
School Enrollment by Age by Funding Source in Kenwood Estates
Out of a total of 311 students who are enrolled in schools in Kenwood Estates, 38 (12.2%) attend a private institution, while the remaining 273 (87.8%) are enrolled in public schools. The age group of 18 to 19 year olds has the highest likelihood of being enrolled in private schools, with 20 (66.7% in the age bracket) enrolled. Conversely, the age group of 5 to 9 year old has the lowest likelihood of being enrolled in a private school, with 25 (100.0% in the age bracket) attending a public institution.
| Age Bracket | Public School | Private School |
| 3 to 4 Year Olds | 0 (0.0%) | 0 (0.0%) |
| 5 to 9 Year Old | 25 (100.0%) | 0 (0.0%) |
| 10 to 14 Year Olds | 171 (100.0%) | 0 (0.0%) |
| 15 to 17 Year Olds | 21 (61.8%) | 13 (38.2%) |
| 18 to 19 Year Olds | 10 (33.3%) | 20 (66.7%) |
| 20 to 24 Year Olds | 6 (100.0%) | 0 (0.0%) |
| 25 to 34 Year Olds | 27 (100.0%) | 0 (0.0%) |
| 35 Years and over | 13 (72.2%) | 5 (27.8%) |
| Total | 273 (87.8%) | 38 (12.2%) |
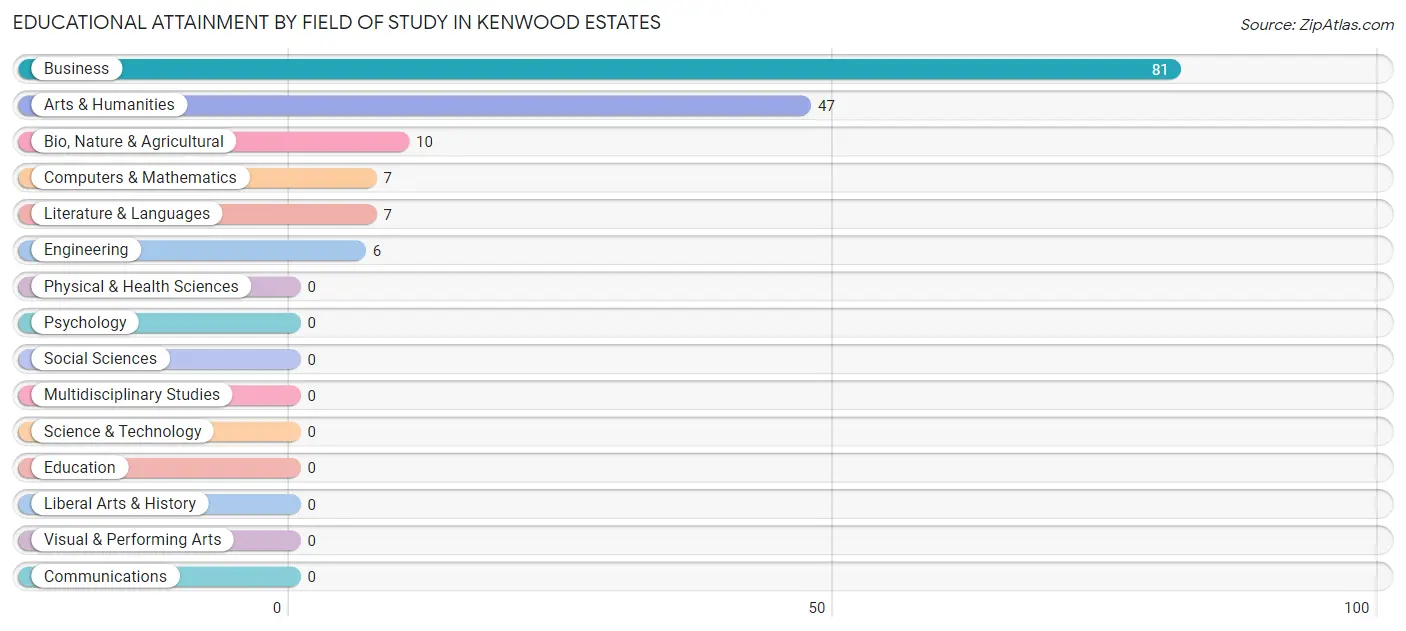
Educational Attainment by Field of Study in Kenwood Estates
Business (81 | 51.3%), arts & humanities (47 | 29.7%), bio, nature & agricultural (10 | 6.3%), computers & mathematics (7 | 4.4%), and literature & languages (7 | 4.4%) are the most common fields of study among 158 individuals in Kenwood Estates who have obtained a bachelor's degree or higher.
| Field of Study | # Graduates | % Graduates |
| Computers & Mathematics | 7 | 4.4% |
| Bio, Nature & Agricultural | 10 | 6.3% |
| Physical & Health Sciences | 0 | 0.0% |
| Psychology | 0 | 0.0% |
| Social Sciences | 0 | 0.0% |
| Engineering | 6 | 3.8% |
| Multidisciplinary Studies | 0 | 0.0% |
| Science & Technology | 0 | 0.0% |
| Business | 81 | 51.3% |
| Education | 0 | 0.0% |
| Literature & Languages | 7 | 4.4% |
| Liberal Arts & History | 0 | 0.0% |
| Visual & Performing Arts | 0 | 0.0% |
| Communications | 0 | 0.0% |
| Arts & Humanities | 47 | 29.7% |
| Total | 158 | 100.0% |
Transportation & Commute in Kenwood Estates
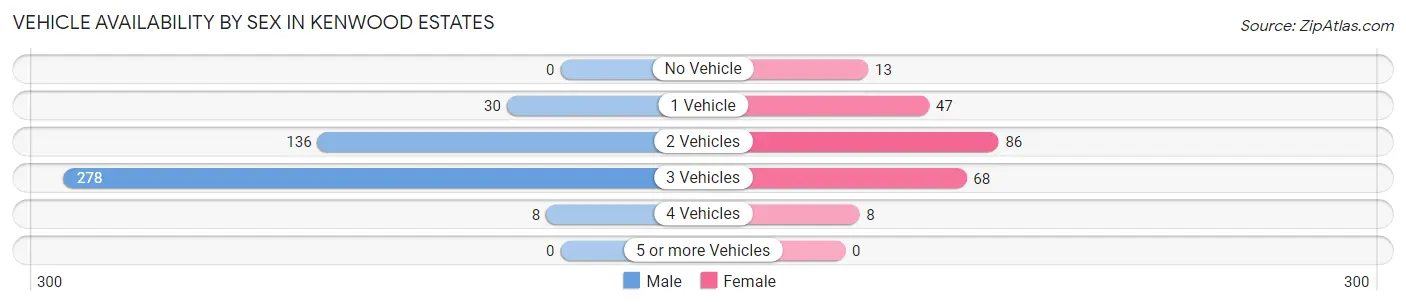
Vehicle Availability by Sex in Kenwood Estates
The most prevalent vehicle ownership categories in Kenwood Estates are males with 3 vehicles (278, accounting for 61.5%) and females with 3 vehicles (68, making up 125.2%).
| Vehicles Available | Male | Female |
| No Vehicle | 0 (0.0%) | 13 (5.9%) |
| 1 Vehicle | 30 (6.6%) | 47 (21.2%) |
| 2 Vehicles | 136 (30.1%) | 86 (38.7%) |
| 3 Vehicles | 278 (61.5%) | 68 (30.6%) |
| 4 Vehicles | 8 (1.8%) | 8 (3.6%) |
| 5 or more Vehicles | 0 (0.0%) | 0 (0.0%) |
| Total | 452 (100.0%) | 222 (100.0%) |
Commute Time in Kenwood Estates
The most frequently occuring commute durations in Kenwood Estates are 20 to 24 minutes (234 commuters, 34.7%), 30 to 34 minutes (198 commuters, 29.4%), and 10 to 14 minutes (87 commuters, 12.9%).
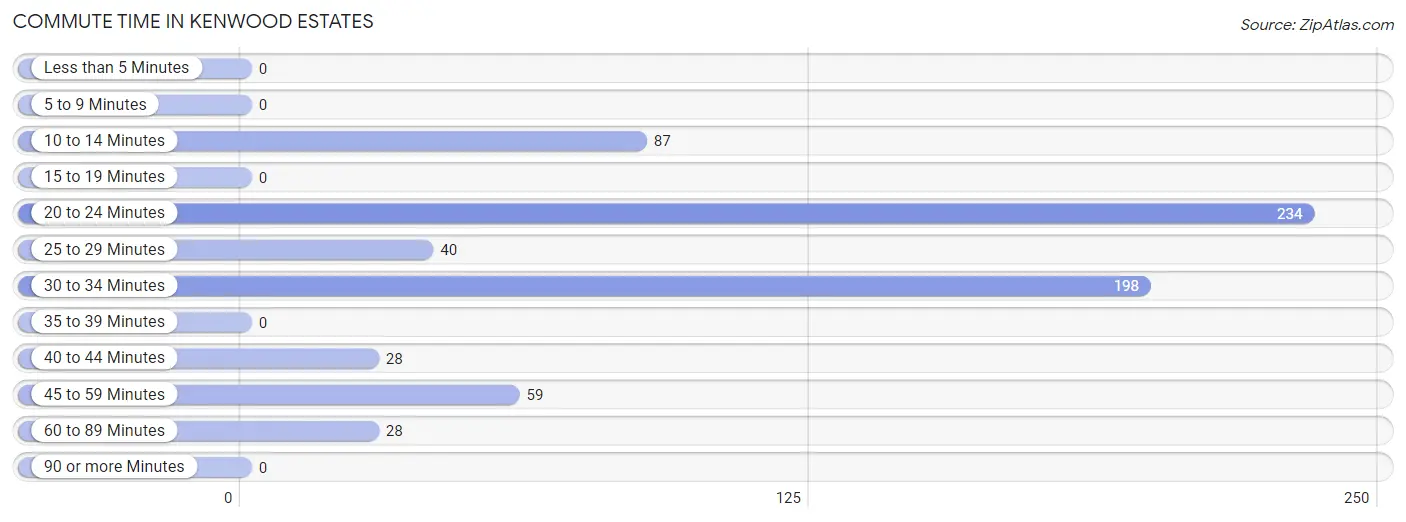
| Commute Time | # Commuters | % Commuters |
| Less than 5 Minutes | 0 | 0.0% |
| 5 to 9 Minutes | 0 | 0.0% |
| 10 to 14 Minutes | 87 | 12.9% |
| 15 to 19 Minutes | 0 | 0.0% |
| 20 to 24 Minutes | 234 | 34.7% |
| 25 to 29 Minutes | 40 | 5.9% |
| 30 to 34 Minutes | 198 | 29.4% |
| 35 to 39 Minutes | 0 | 0.0% |
| 40 to 44 Minutes | 28 | 4.2% |
| 45 to 59 Minutes | 59 | 8.7% |
| 60 to 89 Minutes | 28 | 4.2% |
| 90 or more Minutes | 0 | 0.0% |
Commute Time by Sex in Kenwood Estates
The most common commute times in Kenwood Estates are 30 to 34 minutes (162 commuters, 35.8%) for males and 20 to 24 minutes (91 commuters, 41.0%) for females.
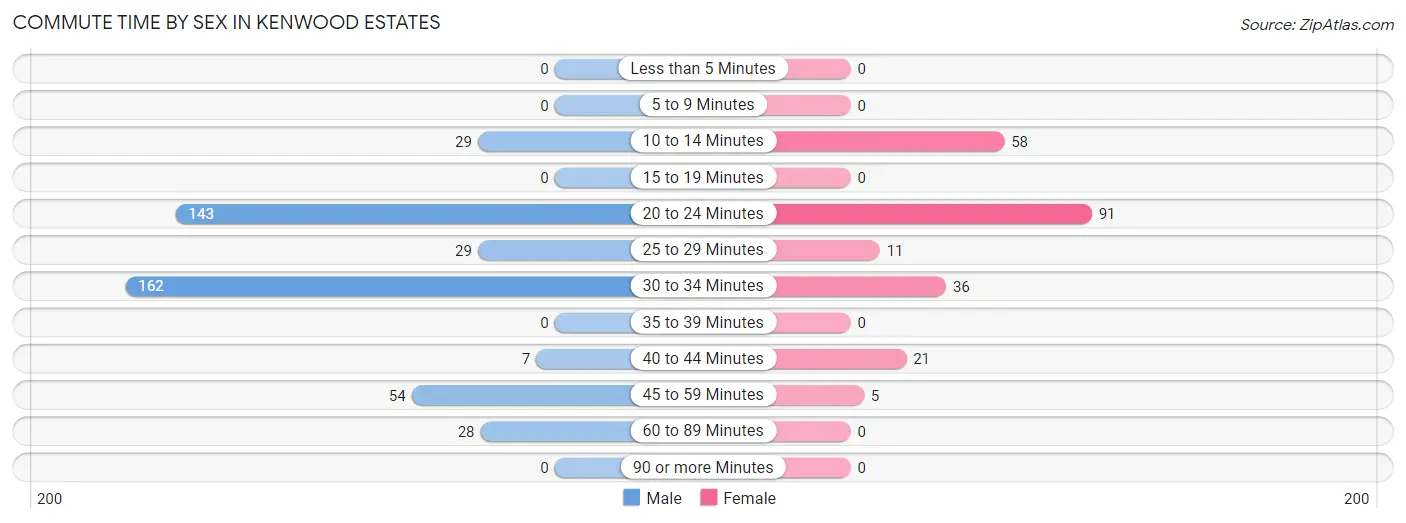
| Commute Time | Male | Female |
| Less than 5 Minutes | 0 (0.0%) | 0 (0.0%) |
| 5 to 9 Minutes | 0 (0.0%) | 0 (0.0%) |
| 10 to 14 Minutes | 29 (6.4%) | 58 (26.1%) |
| 15 to 19 Minutes | 0 (0.0%) | 0 (0.0%) |
| 20 to 24 Minutes | 143 (31.6%) | 91 (41.0%) |
| 25 to 29 Minutes | 29 (6.4%) | 11 (5.0%) |
| 30 to 34 Minutes | 162 (35.8%) | 36 (16.2%) |
| 35 to 39 Minutes | 0 (0.0%) | 0 (0.0%) |
| 40 to 44 Minutes | 7 (1.5%) | 21 (9.5%) |
| 45 to 59 Minutes | 54 (11.9%) | 5 (2.2%) |
| 60 to 89 Minutes | 28 (6.2%) | 0 (0.0%) |
| 90 or more Minutes | 0 (0.0%) | 0 (0.0%) |
Time of Departure to Work by Sex in Kenwood Estates
The most frequent times of departure to work in Kenwood Estates are 8:00 AM to 8:29 AM (179, 39.6%) for males and 7:00 AM to 7:29 AM (52, 23.4%) for females.
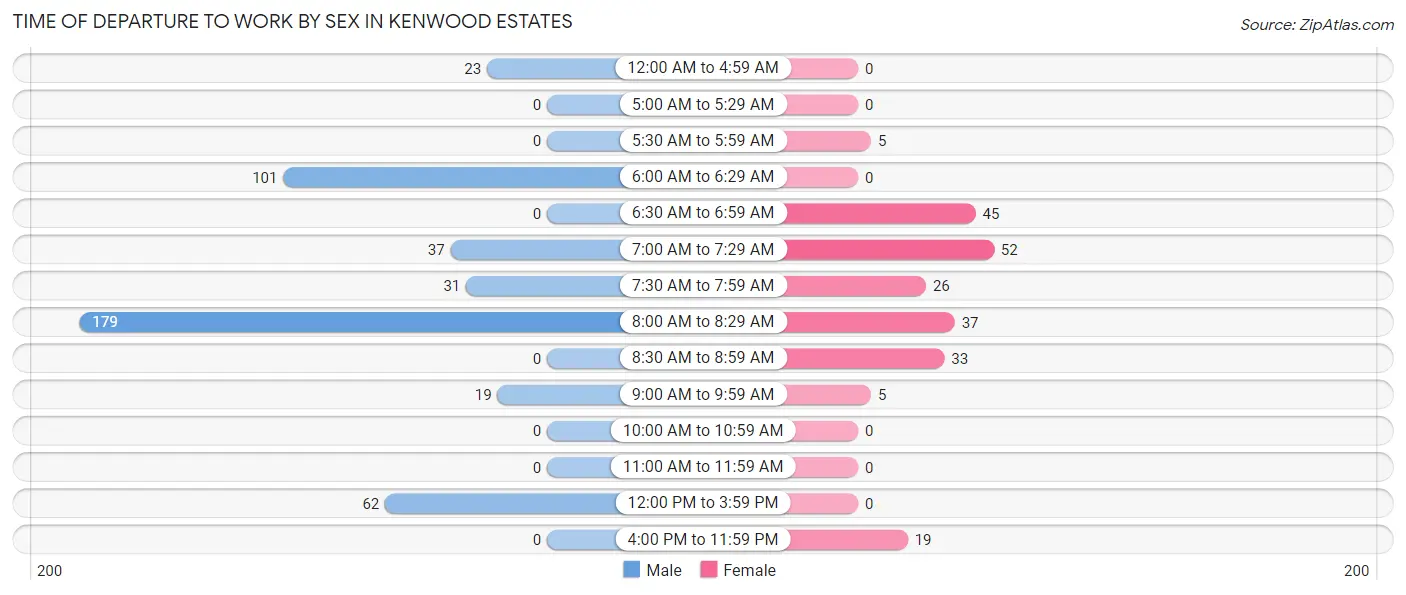
| Time of Departure | Male | Female |
| 12:00 AM to 4:59 AM | 23 (5.1%) | 0 (0.0%) |
| 5:00 AM to 5:29 AM | 0 (0.0%) | 0 (0.0%) |
| 5:30 AM to 5:59 AM | 0 (0.0%) | 5 (2.2%) |
| 6:00 AM to 6:29 AM | 101 (22.4%) | 0 (0.0%) |
| 6:30 AM to 6:59 AM | 0 (0.0%) | 45 (20.3%) |
| 7:00 AM to 7:29 AM | 37 (8.2%) | 52 (23.4%) |
| 7:30 AM to 7:59 AM | 31 (6.9%) | 26 (11.7%) |
| 8:00 AM to 8:29 AM | 179 (39.6%) | 37 (16.7%) |
| 8:30 AM to 8:59 AM | 0 (0.0%) | 33 (14.9%) |
| 9:00 AM to 9:59 AM | 19 (4.2%) | 5 (2.2%) |
| 10:00 AM to 10:59 AM | 0 (0.0%) | 0 (0.0%) |
| 11:00 AM to 11:59 AM | 0 (0.0%) | 0 (0.0%) |
| 12:00 PM to 3:59 PM | 62 (13.7%) | 0 (0.0%) |
| 4:00 PM to 11:59 PM | 0 (0.0%) | 19 (8.6%) |
| Total | 452 (100.0%) | 222 (100.0%) |
Housing Occupancy in Kenwood Estates
Occupancy by Ownership in Kenwood Estates
Of the total 370 dwellings in Kenwood Estates, owner-occupied units account for 223 (60.3%), while renter-occupied units make up 147 (39.7%).
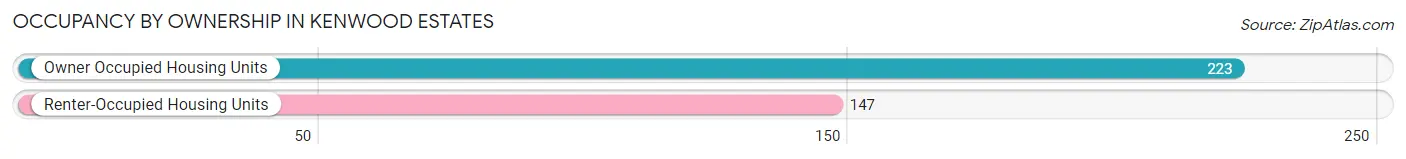
| Occupancy | # Housing Units | % Housing Units |
| Owner Occupied Housing Units | 223 | 60.3% |
| Renter-Occupied Housing Units | 147 | 39.7% |
| Total Occupied Housing Units | 370 | 100.0% |
Occupancy by Household Size in Kenwood Estates
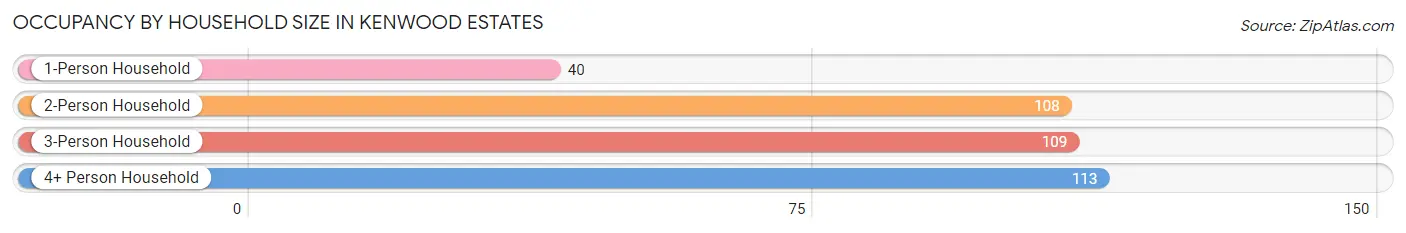
| Household Size | # Housing Units | % Housing Units |
| 1-Person Household | 40 | 10.8% |
| 2-Person Household | 108 | 29.2% |
| 3-Person Household | 109 | 29.5% |
| 4+ Person Household | 113 | 30.5% |
| Total Housing Units | 370 | 100.0% |
Occupancy by Ownership by Household Size in Kenwood Estates
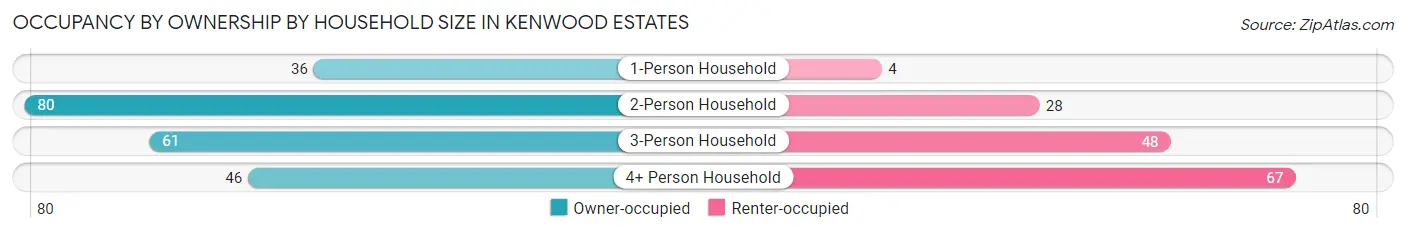
| Household Size | Owner-occupied | Renter-occupied |
| 1-Person Household | 36 (90.0%) | 4 (10.0%) |
| 2-Person Household | 80 (74.1%) | 28 (25.9%) |
| 3-Person Household | 61 (56.0%) | 48 (44.0%) |
| 4+ Person Household | 46 (40.7%) | 67 (59.3%) |
| Total Housing Units | 223 (60.3%) | 147 (39.7%) |
Occupancy by Educational Attainment in Kenwood Estates
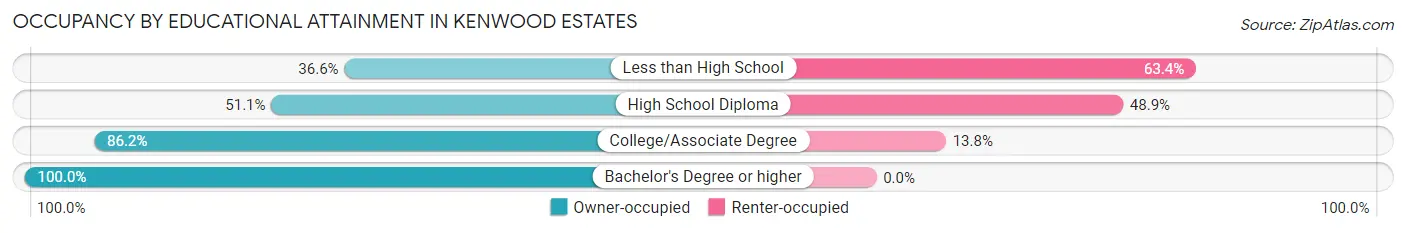
| Household Size | Owner-occupied | Renter-occupied |
| Less than High School | 30 (36.6%) | 52 (63.4%) |
| High School Diploma | 95 (51.1%) | 91 (48.9%) |
| College/Associate Degree | 25 (86.2%) | 4 (13.8%) |
| Bachelor's Degree or higher | 73 (100.0%) | 0 (0.0%) |
Occupancy by Age of Householder in Kenwood Estates
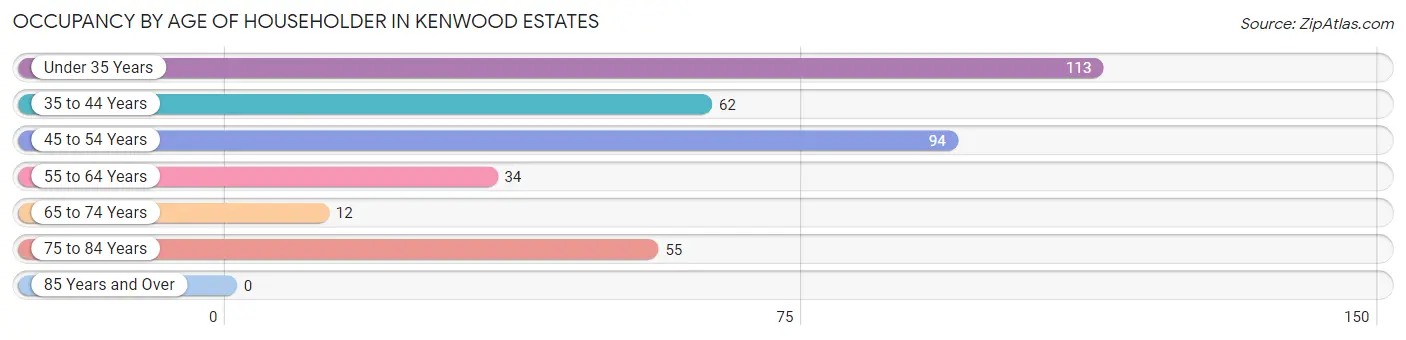
| Age Bracket | # Households | % Households |
| Under 35 Years | 113 | 30.5% |
| 35 to 44 Years | 62 | 16.8% |
| 45 to 54 Years | 94 | 25.4% |
| 55 to 64 Years | 34 | 9.2% |
| 65 to 74 Years | 12 | 3.2% |
| 75 to 84 Years | 55 | 14.9% |
| 85 Years and Over | 0 | 0.0% |
| Total | 370 | 100.0% |
Housing Finances in Kenwood Estates
Median Income by Occupancy in Kenwood Estates
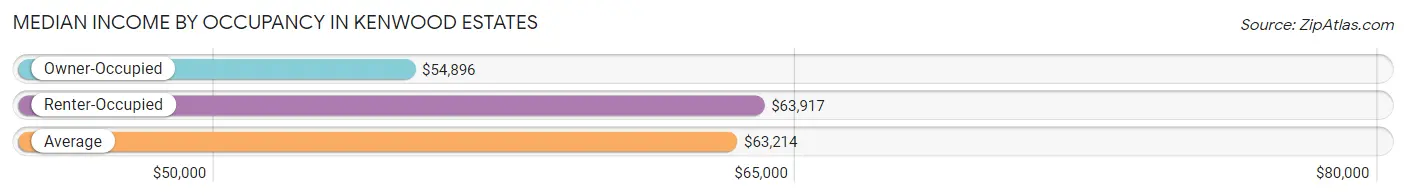
| Occupancy Type | # Households | Median Income |
| Owner-Occupied | 223 (60.3%) | $54,896 |
| Renter-Occupied | 147 (39.7%) | $63,917 |
| Average | 370 (100.0%) | $63,214 |
Occupancy by Householder Income Bracket in Kenwood Estates
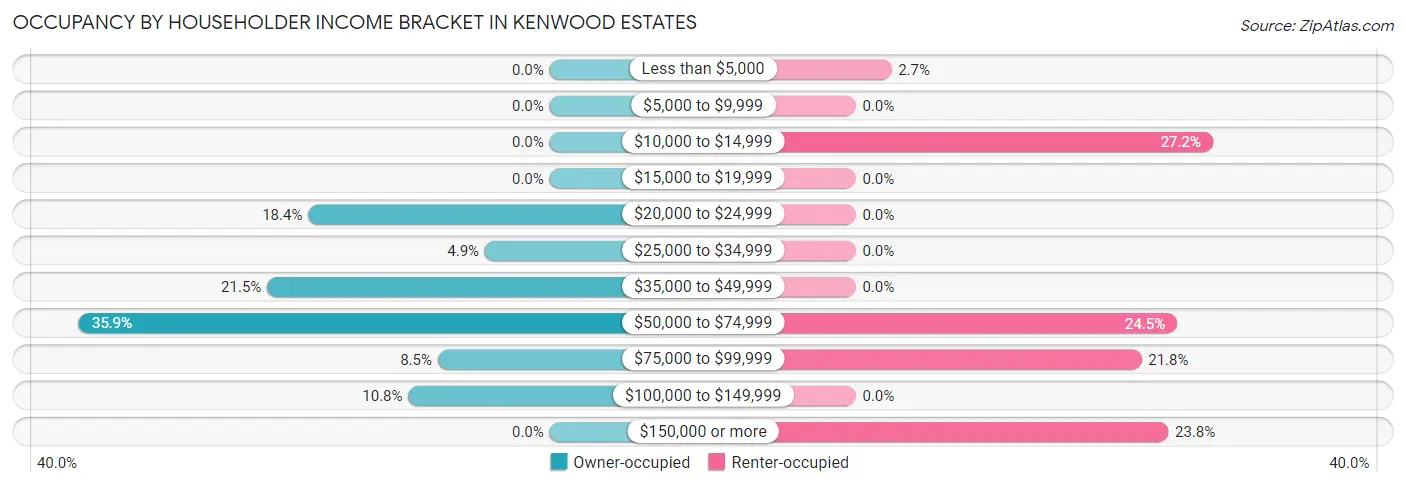
| Income Bracket | Owner-occupied | Renter-occupied |
| Less than $5,000 | 0 (0.0%) | 4 (2.7%) |
| $5,000 to $9,999 | 0 (0.0%) | 0 (0.0%) |
| $10,000 to $14,999 | 0 (0.0%) | 40 (27.2%) |
| $15,000 to $19,999 | 0 (0.0%) | 0 (0.0%) |
| $20,000 to $24,999 | 41 (18.4%) | 0 (0.0%) |
| $25,000 to $34,999 | 11 (4.9%) | 0 (0.0%) |
| $35,000 to $49,999 | 48 (21.5%) | 0 (0.0%) |
| $50,000 to $74,999 | 80 (35.9%) | 36 (24.5%) |
| $75,000 to $99,999 | 19 (8.5%) | 32 (21.8%) |
| $100,000 to $149,999 | 24 (10.8%) | 0 (0.0%) |
| $150,000 or more | 0 (0.0%) | 35 (23.8%) |
| Total | 223 (100.0%) | 147 (100.0%) |
Monthly Housing Cost Tiers in Kenwood Estates
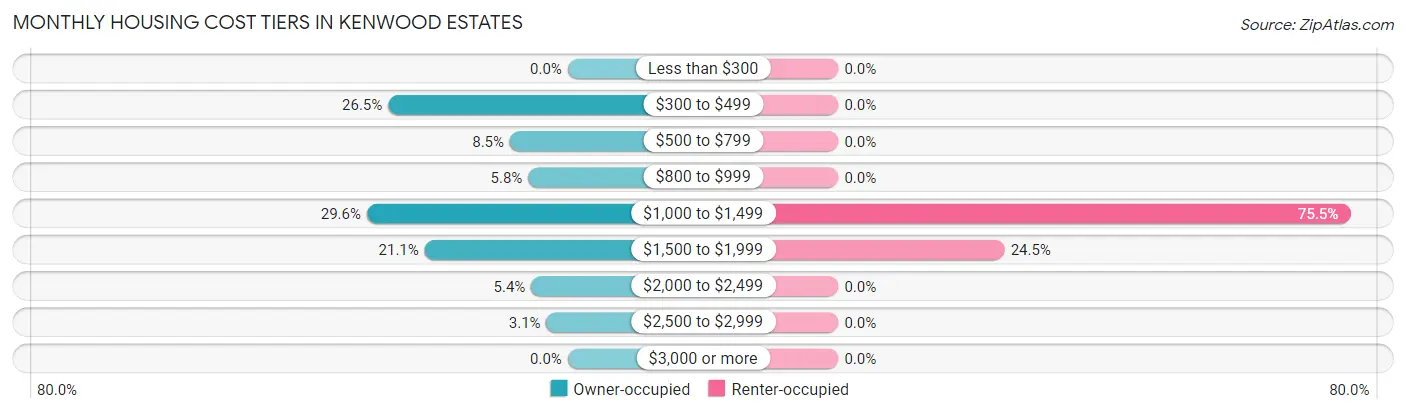
| Monthly Cost | Owner-occupied | Renter-occupied |
| Less than $300 | 0 (0.0%) | 0 (0.0%) |
| $300 to $499 | 59 (26.5%) | 0 (0.0%) |
| $500 to $799 | 19 (8.5%) | 0 (0.0%) |
| $800 to $999 | 13 (5.8%) | 0 (0.0%) |
| $1,000 to $1,499 | 66 (29.6%) | 111 (75.5%) |
| $1,500 to $1,999 | 47 (21.1%) | 36 (24.5%) |
| $2,000 to $2,499 | 12 (5.4%) | 0 (0.0%) |
| $2,500 to $2,999 | 7 (3.1%) | 0 (0.0%) |
| $3,000 or more | 0 (0.0%) | 0 (0.0%) |
| Total | 223 (100.0%) | 147 (100.0%) |
Physical Housing Characteristics in Kenwood Estates
Housing Structures in Kenwood Estates
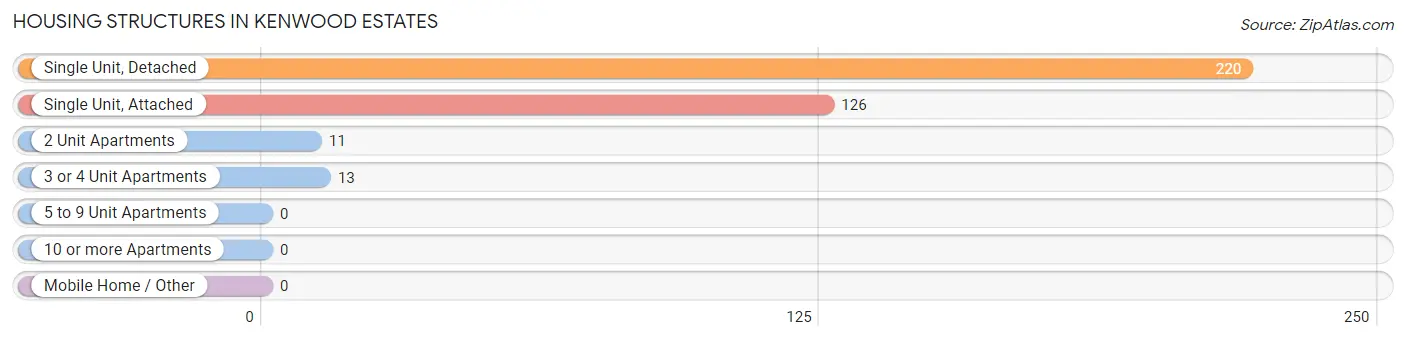
| Structure Type | # Housing Units | % Housing Units |
| Single Unit, Detached | 220 | 59.5% |
| Single Unit, Attached | 126 | 34.1% |
| 2 Unit Apartments | 11 | 3.0% |
| 3 or 4 Unit Apartments | 13 | 3.5% |
| 5 to 9 Unit Apartments | 0 | 0.0% |
| 10 or more Apartments | 0 | 0.0% |
| Mobile Home / Other | 0 | 0.0% |
| Total | 370 | 100.0% |
Housing Structures by Occupancy in Kenwood Estates
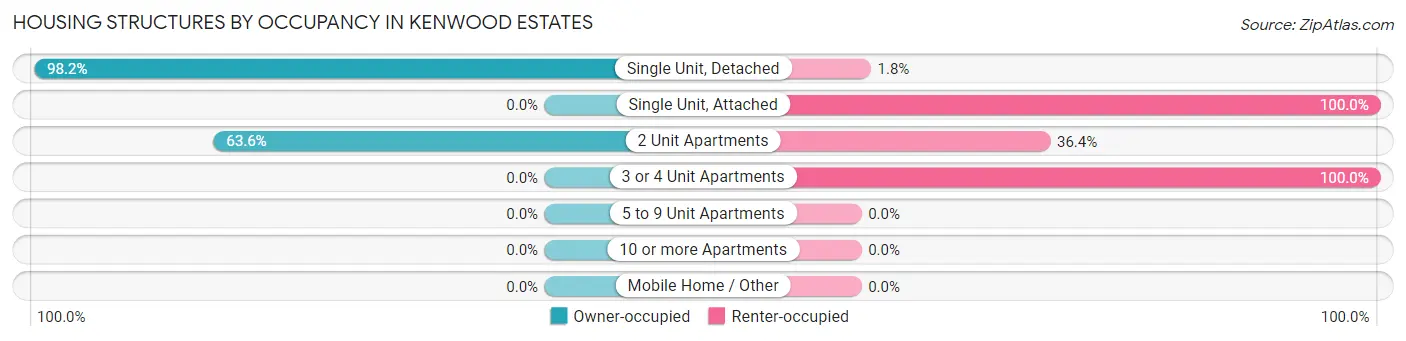
| Structure Type | Owner-occupied | Renter-occupied |
| Single Unit, Detached | 216 (98.2%) | 4 (1.8%) |
| Single Unit, Attached | 0 (0.0%) | 126 (100.0%) |
| 2 Unit Apartments | 7 (63.6%) | 4 (36.4%) |
| 3 or 4 Unit Apartments | 0 (0.0%) | 13 (100.0%) |
| 5 to 9 Unit Apartments | 0 (0.0%) | 0 (0.0%) |
| 10 or more Apartments | 0 (0.0%) | 0 (0.0%) |
| Mobile Home / Other | 0 (0.0%) | 0 (0.0%) |
| Total | 223 (60.3%) | 147 (39.7%) |
Housing Structures by Number of Rooms in Kenwood Estates
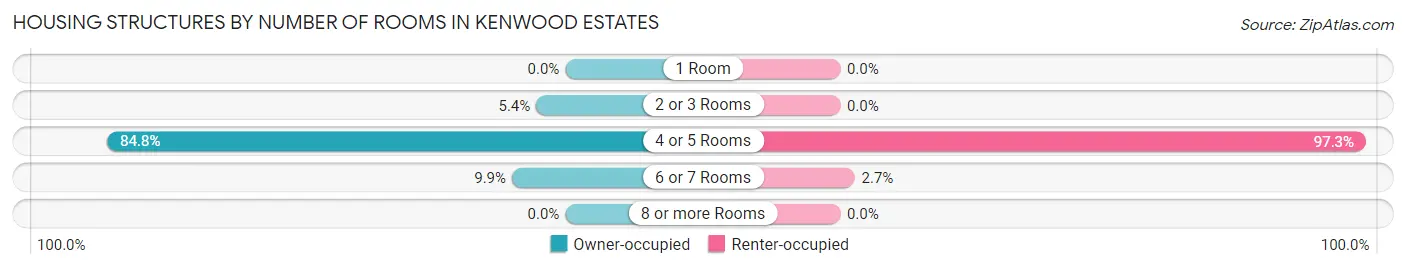
| Number of Rooms | Owner-occupied | Renter-occupied |
| 1 Room | 0 (0.0%) | 0 (0.0%) |
| 2 or 3 Rooms | 12 (5.4%) | 0 (0.0%) |
| 4 or 5 Rooms | 189 (84.8%) | 143 (97.3%) |
| 6 or 7 Rooms | 22 (9.9%) | 4 (2.7%) |
| 8 or more Rooms | 0 (0.0%) | 0 (0.0%) |
| Total | 223 (100.0%) | 147 (100.0%) |
Housing Structure by Heating Type in Kenwood Estates
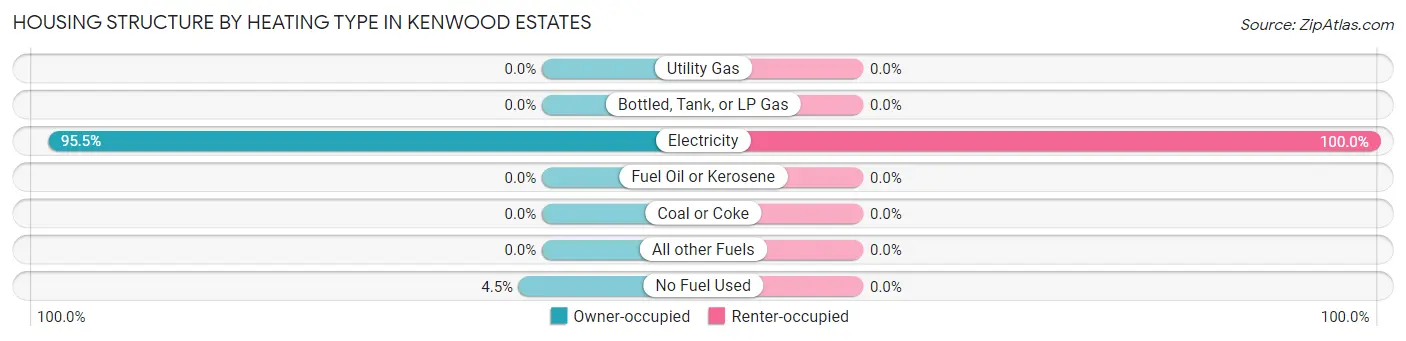
| Heating Type | Owner-occupied | Renter-occupied |
| Utility Gas | 0 (0.0%) | 0 (0.0%) |
| Bottled, Tank, or LP Gas | 0 (0.0%) | 0 (0.0%) |
| Electricity | 213 (95.5%) | 147 (100.0%) |
| Fuel Oil or Kerosene | 0 (0.0%) | 0 (0.0%) |
| Coal or Coke | 0 (0.0%) | 0 (0.0%) |
| All other Fuels | 0 (0.0%) | 0 (0.0%) |
| No Fuel Used | 10 (4.5%) | 0 (0.0%) |
| Total | 223 (100.0%) | 147 (100.0%) |
Household Vehicle Usage in Kenwood Estates
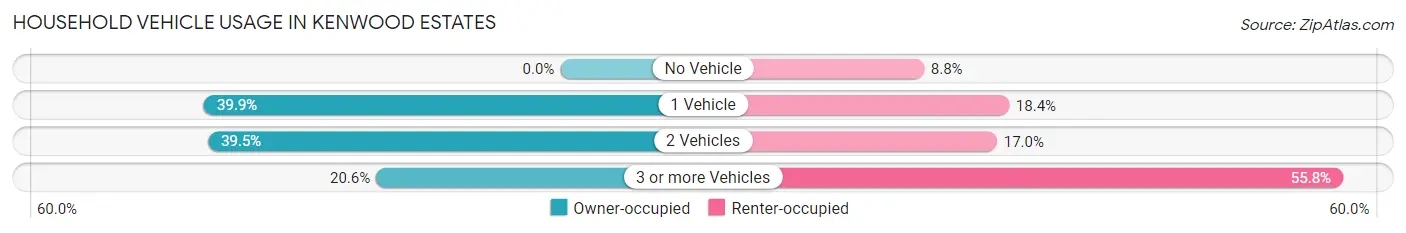
| Vehicles per Household | Owner-occupied | Renter-occupied |
| No Vehicle | 0 (0.0%) | 13 (8.8%) |
| 1 Vehicle | 89 (39.9%) | 27 (18.4%) |
| 2 Vehicles | 88 (39.5%) | 25 (17.0%) |
| 3 or more Vehicles | 46 (20.6%) | 82 (55.8%) |
| Total | 223 (100.0%) | 147 (100.0%) |
Real Estate & Mortgages in Kenwood Estates
Real Estate and Mortgage Overview in Kenwood Estates
| Characteristic | Without Mortgage | With Mortgage |
| Housing Units | 91 | 132 |
| Median Property Value | $222,400 | $314,500 |
| Median Household Income | $44,850 | $0 |
| Monthly Housing Costs | $464 | $0 |
| Real Estate Taxes | - | - |
Property Value by Mortgage Status in Kenwood Estates
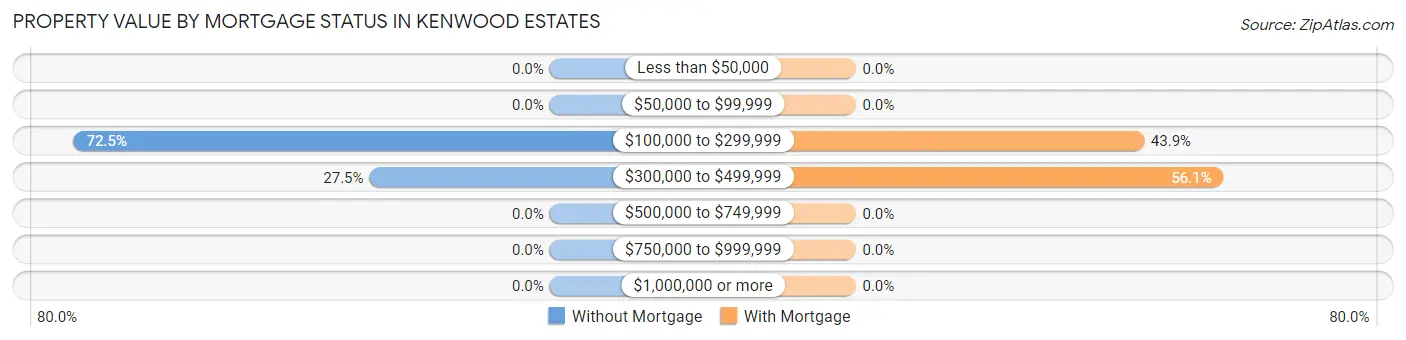
| Property Value | Without Mortgage | With Mortgage |
| Less than $50,000 | 0 (0.0%) | 0 (0.0%) |
| $50,000 to $99,999 | 0 (0.0%) | 0 (0.0%) |
| $100,000 to $299,999 | 66 (72.5%) | 58 (43.9%) |
| $300,000 to $499,999 | 25 (27.5%) | 74 (56.1%) |
| $500,000 to $749,999 | 0 (0.0%) | 0 (0.0%) |
| $750,000 to $999,999 | 0 (0.0%) | 0 (0.0%) |
| $1,000,000 or more | 0 (0.0%) | 0 (0.0%) |
| Total | 91 (100.0%) | 132 (100.0%) |
Household Income by Mortgage Status in Kenwood Estates
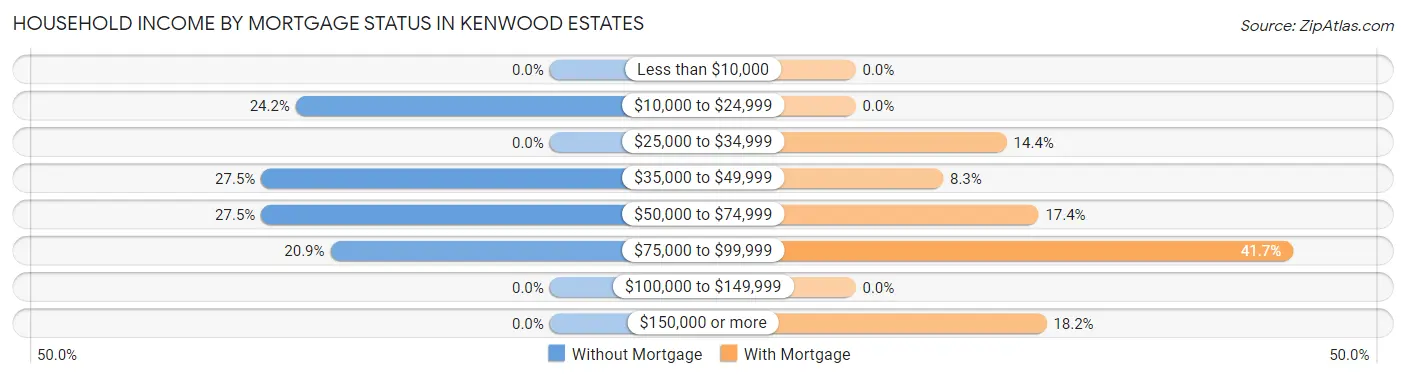
| Household Income | Without Mortgage | With Mortgage |
| Less than $10,000 | 0 (0.0%) | 0 (0.0%) |
| $10,000 to $24,999 | 22 (24.2%) | 0 (0.0%) |
| $25,000 to $34,999 | 0 (0.0%) | 19 (14.4%) |
| $35,000 to $49,999 | 25 (27.5%) | 11 (8.3%) |
| $50,000 to $74,999 | 25 (27.5%) | 23 (17.4%) |
| $75,000 to $99,999 | 19 (20.9%) | 55 (41.7%) |
| $100,000 to $149,999 | 0 (0.0%) | 0 (0.0%) |
| $150,000 or more | 0 (0.0%) | 24 (18.2%) |
| Total | 91 (100.0%) | 132 (100.0%) |
Property Value to Household Income Ratio in Kenwood Estates
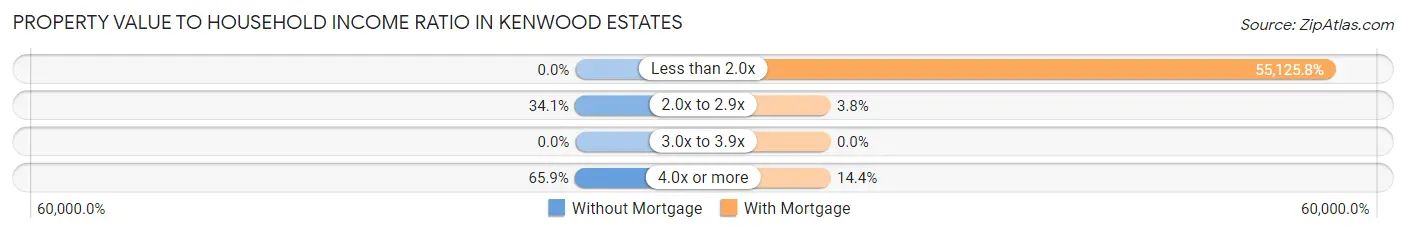
| Value-to-Income Ratio | Without Mortgage | With Mortgage |
| Less than 2.0x | 0 (0.0%) | 72,766 (55,125.8%) |
| 2.0x to 2.9x | 31 (34.1%) | 5 (3.8%) |
| 3.0x to 3.9x | 0 (0.0%) | 0 (0.0%) |
| 4.0x or more | 60 (65.9%) | 19 (14.4%) |
| Total | 91 (100.0%) | 132 (100.0%) |
Real Estate Taxes by Mortgage Status in Kenwood Estates
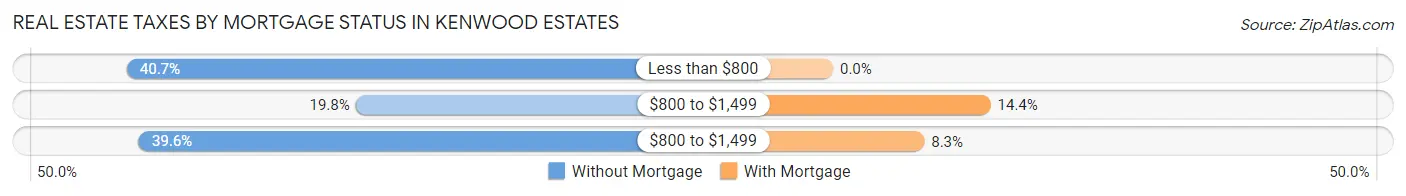
| Property Taxes | Without Mortgage | With Mortgage |
| Less than $800 | 37 (40.7%) | 0 (0.0%) |
| $800 to $1,499 | 18 (19.8%) | 19 (14.4%) |
| $800 to $1,499 | 36 (39.6%) | 11 (8.3%) |
| Total | 91 (100.0%) | 132 (100.0%) |
Health & Disability in Kenwood Estates
Health Insurance Coverage by Age in Kenwood Estates
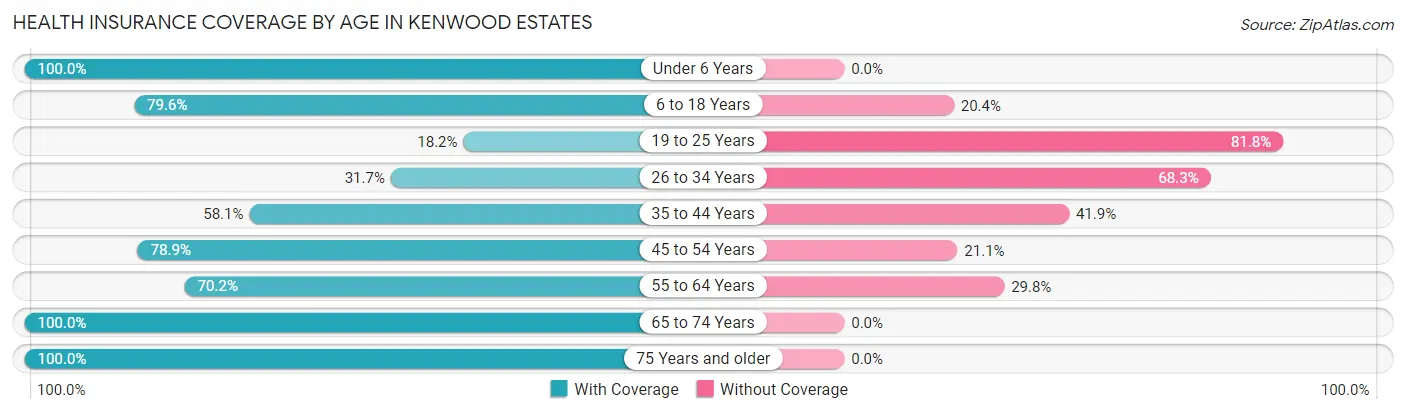
| Age Bracket | With Coverage | Without Coverage |
| Under 6 Years | 79 (100.0%) | 0 (0.0%) |
| 6 to 18 Years | 191 (79.6%) | 49 (20.4%) |
| 19 to 25 Years | 16 (18.2%) | 72 (81.8%) |
| 26 to 34 Years | 72 (31.7%) | 155 (68.3%) |
| 35 to 44 Years | 165 (58.1%) | 119 (41.9%) |
| 45 to 54 Years | 116 (78.9%) | 31 (21.1%) |
| 55 to 64 Years | 40 (70.2%) | 17 (29.8%) |
| 65 to 74 Years | 75 (100.0%) | 0 (0.0%) |
| 75 Years and older | 55 (100.0%) | 0 (0.0%) |
| Total | 809 (64.6%) | 443 (35.4%) |
Health Insurance Coverage by Citizenship Status in Kenwood Estates
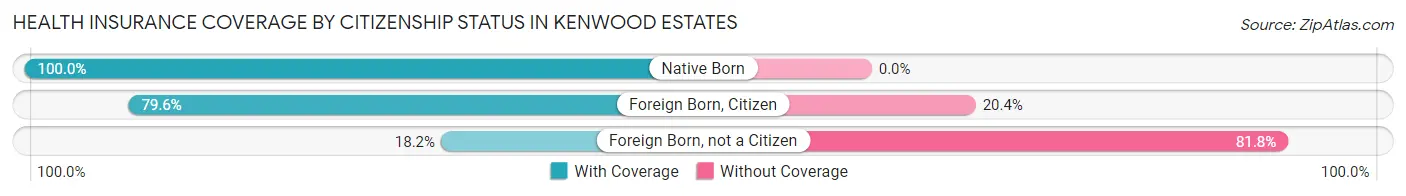
| Citizenship Status | With Coverage | Without Coverage |
| Native Born | 79 (100.0%) | 0 (0.0%) |
| Foreign Born, Citizen | 191 (79.6%) | 49 (20.4%) |
| Foreign Born, not a Citizen | 16 (18.2%) | 72 (81.8%) |
Health Insurance Coverage by Household Income in Kenwood Estates
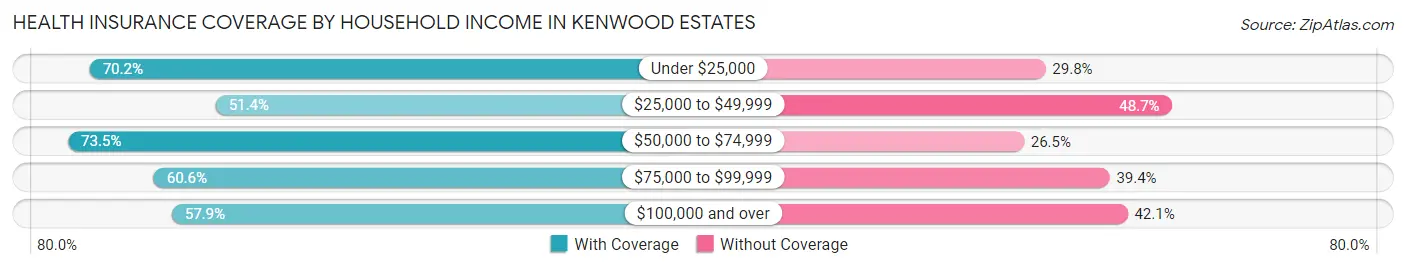
| Household Income | With Coverage | Without Coverage |
| Under $25,000 | 151 (70.2%) | 64 (29.8%) |
| $25,000 to $49,999 | 57 (51.3%) | 54 (48.6%) |
| $50,000 to $74,999 | 277 (73.5%) | 100 (26.5%) |
| $75,000 to $99,999 | 134 (60.6%) | 87 (39.4%) |
| $100,000 and over | 190 (57.9%) | 138 (42.1%) |
Public vs Private Health Insurance Coverage by Age in Kenwood Estates
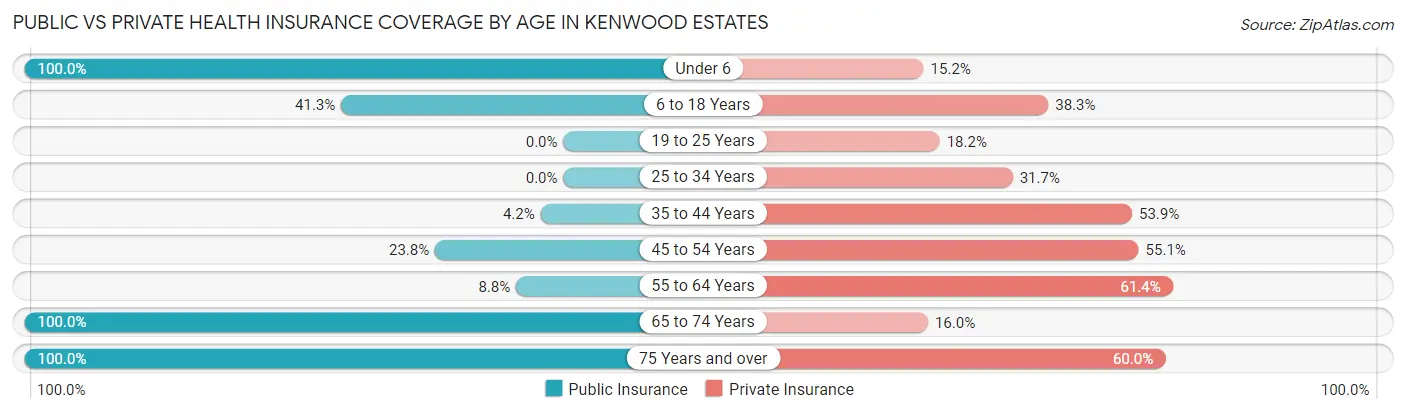
| Age Bracket | Public Insurance | Private Insurance |
| Under 6 | 79 (100.0%) | 12 (15.2%) |
| 6 to 18 Years | 99 (41.2%) | 92 (38.3%) |
| 19 to 25 Years | 0 (0.0%) | 16 (18.2%) |
| 25 to 34 Years | 0 (0.0%) | 72 (31.7%) |
| 35 to 44 Years | 12 (4.2%) | 153 (53.9%) |
| 45 to 54 Years | 35 (23.8%) | 81 (55.1%) |
| 55 to 64 Years | 5 (8.8%) | 35 (61.4%) |
| 65 to 74 Years | 75 (100.0%) | 12 (16.0%) |
| 75 Years and over | 55 (100.0%) | 33 (60.0%) |
| Total | 360 (28.7%) | 506 (40.4%) |
Disability Status by Sex by Age in Kenwood Estates
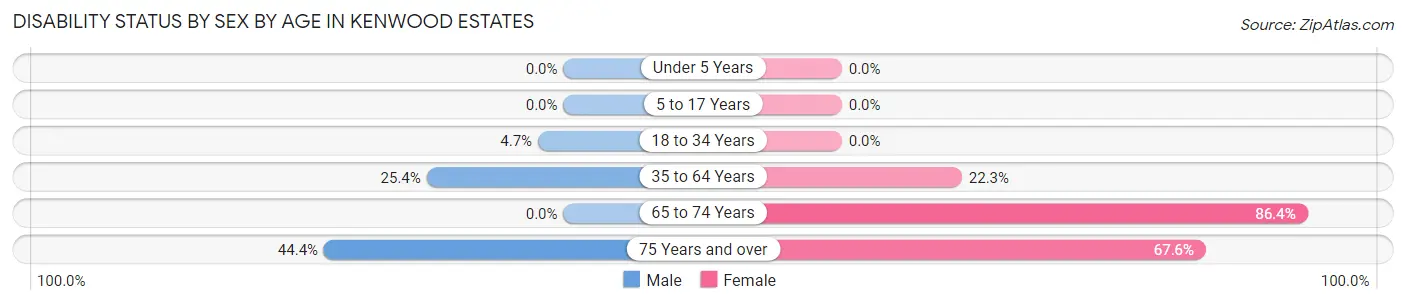
| Age Bracket | Male | Female |
| Under 5 Years | 0 (0.0%) | 0 (0.0%) |
| 5 to 17 Years | 0 (0.0%) | 0 (0.0%) |
| 18 to 34 Years | 6 (4.7%) | 0 (0.0%) |
| 35 to 64 Years | 84 (25.4%) | 35 (22.3%) |
| 65 to 74 Years | 0 (0.0%) | 51 (86.4%) |
| 75 Years and over | 8 (44.4%) | 25 (67.6%) |
Disability Class by Sex by Age in Kenwood Estates
Disability Class: Hearing Difficulty
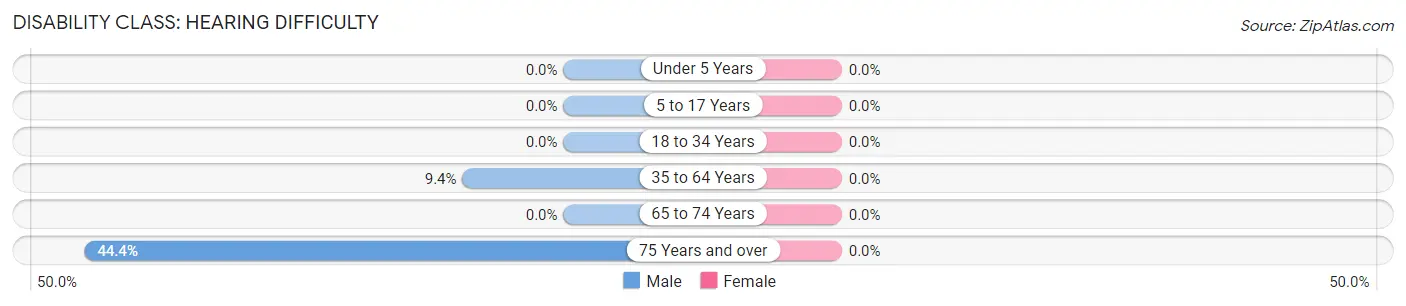
| Age Bracket | Male | Female |
| Under 5 Years | 0 (0.0%) | 0 (0.0%) |
| 5 to 17 Years | 0 (0.0%) | 0 (0.0%) |
| 18 to 34 Years | 0 (0.0%) | 0 (0.0%) |
| 35 to 64 Years | 31 (9.4%) | 0 (0.0%) |
| 65 to 74 Years | 0 (0.0%) | 0 (0.0%) |
| 75 Years and over | 8 (44.4%) | 0 (0.0%) |
Disability Class: Vision Difficulty
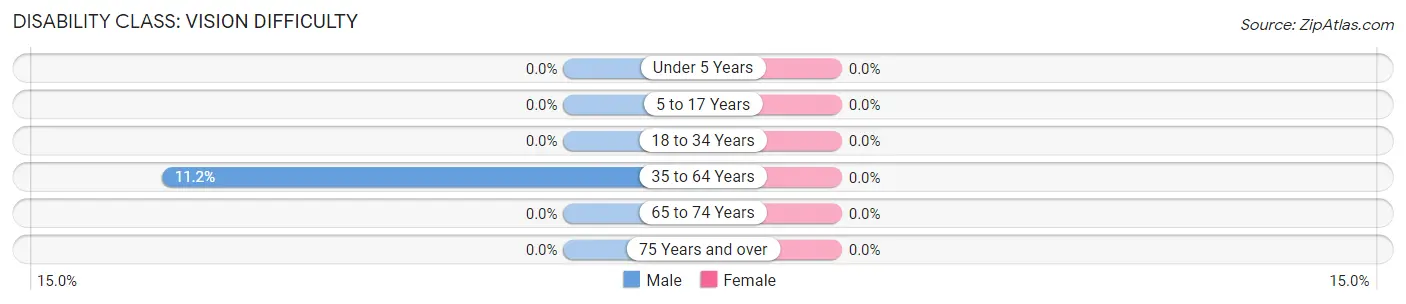
| Age Bracket | Male | Female |
| Under 5 Years | 0 (0.0%) | 0 (0.0%) |
| 5 to 17 Years | 0 (0.0%) | 0 (0.0%) |
| 18 to 34 Years | 0 (0.0%) | 0 (0.0%) |
| 35 to 64 Years | 37 (11.2%) | 0 (0.0%) |
| 65 to 74 Years | 0 (0.0%) | 0 (0.0%) |
| 75 Years and over | 0 (0.0%) | 0 (0.0%) |
Disability Class: Cognitive Difficulty
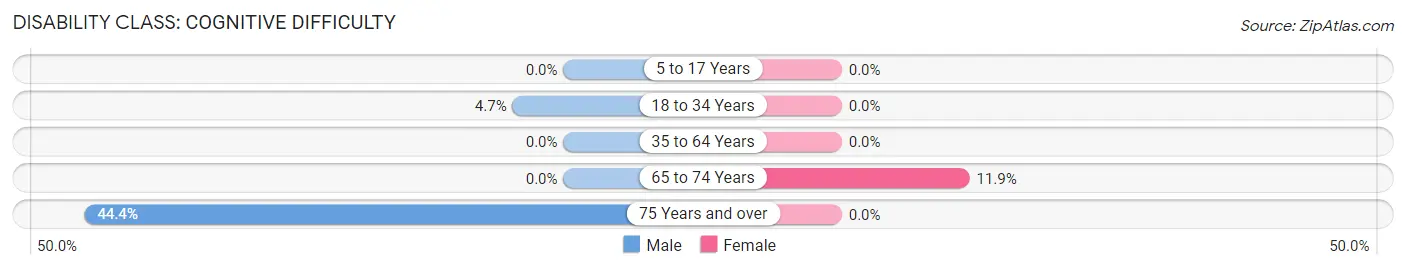
| Age Bracket | Male | Female |
| 5 to 17 Years | 0 (0.0%) | 0 (0.0%) |
| 18 to 34 Years | 6 (4.7%) | 0 (0.0%) |
| 35 to 64 Years | 0 (0.0%) | 0 (0.0%) |
| 65 to 74 Years | 0 (0.0%) | 7 (11.9%) |
| 75 Years and over | 8 (44.4%) | 0 (0.0%) |
Disability Class: Ambulatory Difficulty
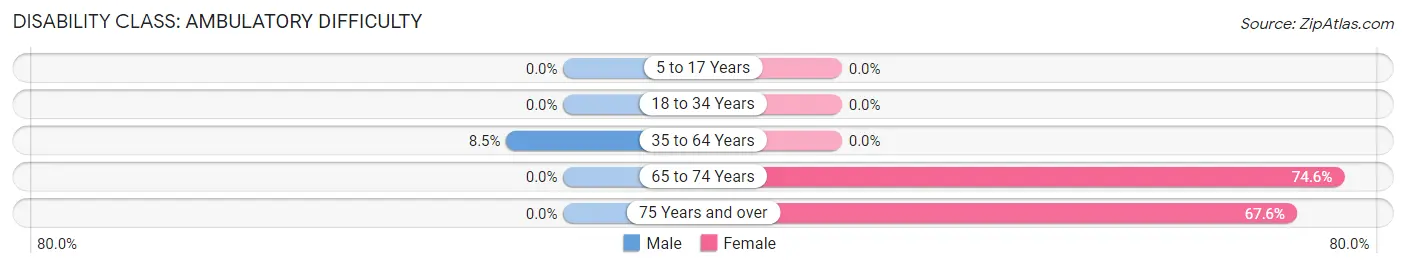
| Age Bracket | Male | Female |
| 5 to 17 Years | 0 (0.0%) | 0 (0.0%) |
| 18 to 34 Years | 0 (0.0%) | 0 (0.0%) |
| 35 to 64 Years | 28 (8.5%) | 0 (0.0%) |
| 65 to 74 Years | 0 (0.0%) | 44 (74.6%) |
| 75 Years and over | 0 (0.0%) | 25 (67.6%) |
Disability Class: Self-Care Difficulty
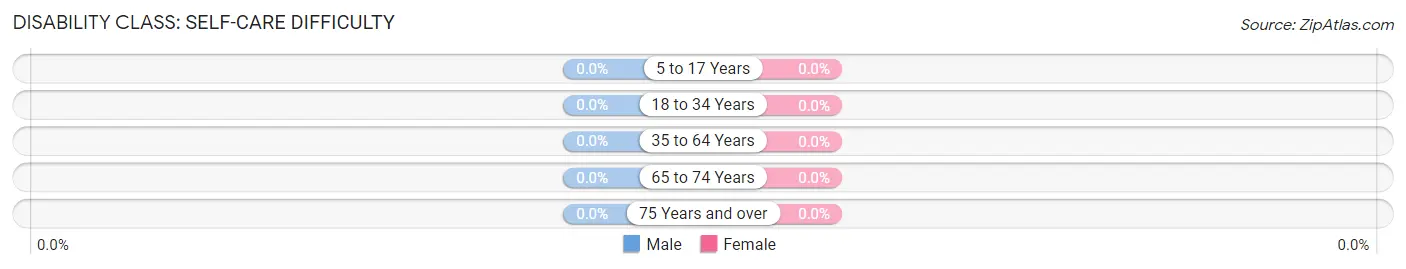
| Age Bracket | Male | Female |
| 5 to 17 Years | 0 (0.0%) | 0 (0.0%) |
| 18 to 34 Years | 0 (0.0%) | 0 (0.0%) |
| 35 to 64 Years | 0 (0.0%) | 0 (0.0%) |
| 65 to 74 Years | 0 (0.0%) | 0 (0.0%) |
| 75 Years and over | 0 (0.0%) | 0 (0.0%) |
Technology Access in Kenwood Estates
Computing Device Access in Kenwood Estates
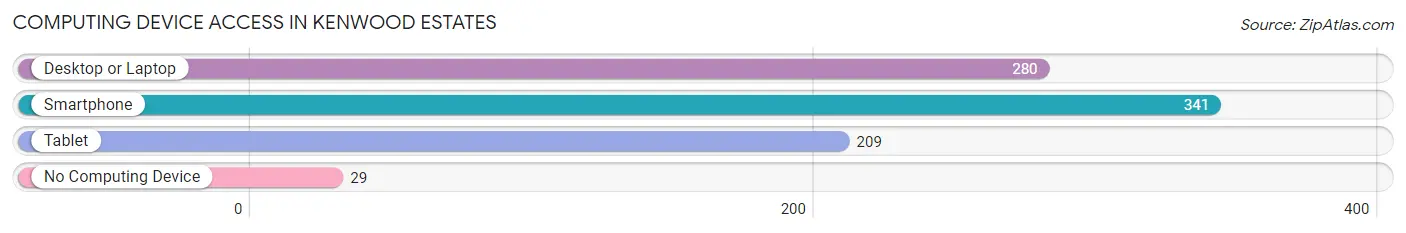
| Device Type | # Households | % Households |
| Desktop or Laptop | 280 | 75.7% |
| Smartphone | 341 | 92.2% |
| Tablet | 209 | 56.5% |
| No Computing Device | 29 | 7.8% |
| Total | 370 | 100.0% |
Internet Access in Kenwood Estates
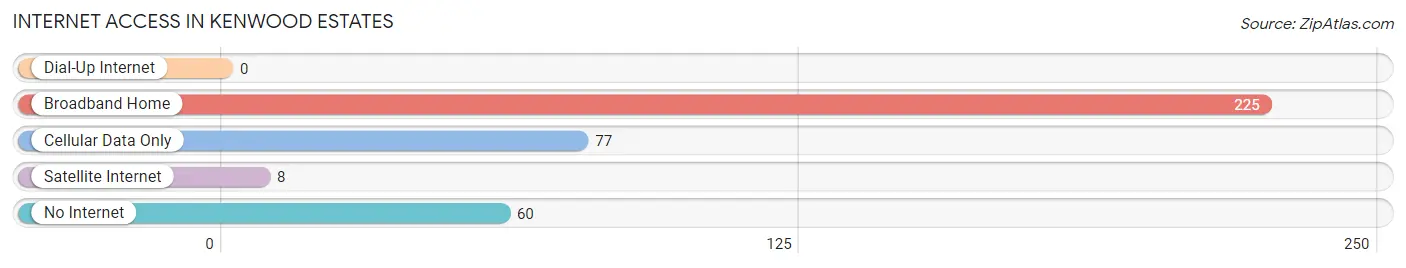
| Internet Type | # Households | % Households |
| Dial-Up Internet | 0 | 0.0% |
| Broadband Home | 225 | 60.8% |
| Cellular Data Only | 77 | 20.8% |
| Satellite Internet | 8 | 2.2% |
| No Internet | 60 | 16.2% |
| Total | 370 | 100.0% |
Kenwood Estates Summary
Kenwood Estates is a small, unincorporated community located in Hillsborough County, Florida. It is situated in the southeastern part of the county, just north of Tampa. The community is bordered by the cities of Tampa, Brandon, and Riverview.
History
Kenwood Estates was founded in the early 1950s by a group of developers who wanted to create a residential community in the area. The developers purchased a large tract of land and began to subdivide it into lots for homes. The community was named after the Kenwood Corporation, which was one of the developers involved in the project.
The first homes in Kenwood Estates were built in the mid-1950s. The community grew steadily over the next few decades, and by the early 2000s, it had become a thriving residential area.
Geography
Kenwood Estates is located in Hillsborough County, Florida. It is situated in the southeastern part of the county, just north of Tampa. The community is bordered by the cities of Tampa, Brandon, and Riverview.
The terrain of Kenwood Estates is mostly flat, with some rolling hills. The area is mostly residential, with some commercial and industrial areas. The community is served by several major roads, including US Highway 301, US Highway 41, and Interstate 75.
Economy
Kenwood Estates is primarily a residential community, but it does have some commercial and industrial businesses. The largest employers in the area are the Hillsborough County School District, the University of South Florida, and the Tampa Bay Buccaneers.
The community also has several small businesses, including restaurants, retail stores, and professional services. The median household income in Kenwood Estates is slightly higher than the national average.
Demographics
As of the 2010 census, the population of Kenwood Estates was 8,845. The racial makeup of the community was 79.3% White, 11.2% African American, 4.2% Hispanic or Latino, and 5.3% other.
The median age in Kenwood Estates is 37.3 years, and the median household income is $50,945. The unemployment rate in the community is 4.2%, which is slightly lower than the national average.
Conclusion
Kenwood Estates is a small, unincorporated community located in Hillsborough County, Florida. It is situated in the southeastern part of the county, just north of Tampa. The community is primarily residential, but it does have some commercial and industrial businesses. The population of Kenwood Estates is 8,845, and the median household income is $50,945. The unemployment rate in the community is 4.2%, which is slightly lower than the national average.
Common Questions
What is the Total Population of Kenwood Estates?
Total Population of Kenwood Estates is 1,252.
What is the Total Male Population of Kenwood Estates?
Total Male Population of Kenwood Estates is 615.
What is the Total Female Population of Kenwood Estates?
Total Female Population of Kenwood Estates is 637.
What is the Ratio of Males per 100 Females in Kenwood Estates?
There are 96.55 Males per 100 Females in Kenwood Estates.
What is the Ratio of Females per 100 Males in Kenwood Estates?
There are 103.58 Females per 100 Males in Kenwood Estates.
What is the Median Population Age in Kenwood Estates?
Median Population Age in Kenwood Estates is 34.8 Years.
What is the Average Family Size in Kenwood Estates
Average Family Size in Kenwood Estates is 3.6 People.
What is the Average Household Size in Kenwood Estates
Average Household Size in Kenwood Estates is 3.4 People.
What is Per Capita Income in Kenwood Estates?
Per Capita income in Kenwood Estates is $22,094.
What is the Median Family Income in Kenwood Estates?
Median Family Income in Kenwood Estates is $72,344.
What is the Median Household income in Kenwood Estates?
Median Household Income in Kenwood Estates is $63,214.
What is Income or Wage Gap in Kenwood Estates?
Income or Wage Gap in Kenwood Estates is 14.8%.
Women in Kenwood Estates earn 85.2 cents for every dollar earned by a man.
What is Inequality or Gini Index in Kenwood Estates?
Inequality or Gini Index in Kenwood Estates is 0.35.
How Large is the Labor Force in Kenwood Estates?
There are 678 People in the Labor Forcein in Kenwood Estates.
What is the Percentage of People in the Labor Force in Kenwood Estates?
70.1% of People are in the Labor Force in Kenwood Estates.
What is the Unemployment Rate in Kenwood Estates?
Unemployment Rate in Kenwood Estates is 0.6%.