Jupiter Inlet Colony, FL
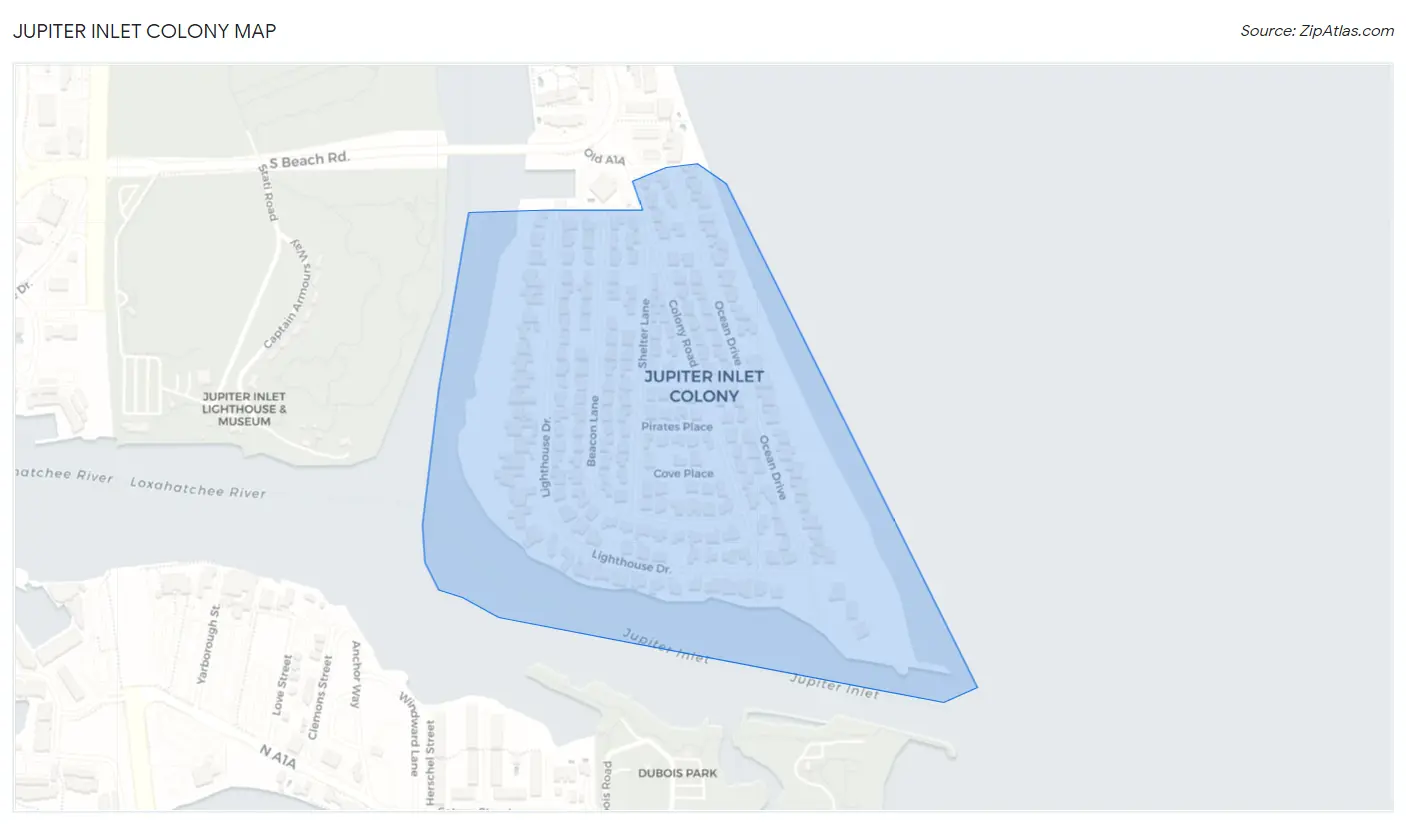
Jupiter Inlet Colony Map
Jupiter Inlet Colony Overview
461
TOTAL POPULATION
268
MALE POPULATION
193
FEMALE POPULATION
138.86
MALES / 100 FEMALES
72.01
FEMALES / 100 MALES
57.8
MEDIAN AGE
3.0
AVG FAMILY SIZE
2.4
AVG HOUSEHOLD SIZE
$111,160
PER CAPITA INCOME
$178,750
AVG FAMILY INCOME
$135,000
AVG HOUSEHOLD INCOME
0.64
INEQUALITY / GINI INDEX
138
LABOR FORCE [ PEOPLE ]
36.6%
PERCENT IN LABOR FORCE
2.9%
UNEMPLOYMENT RATE
Jupiter Inlet Colony Area Codes
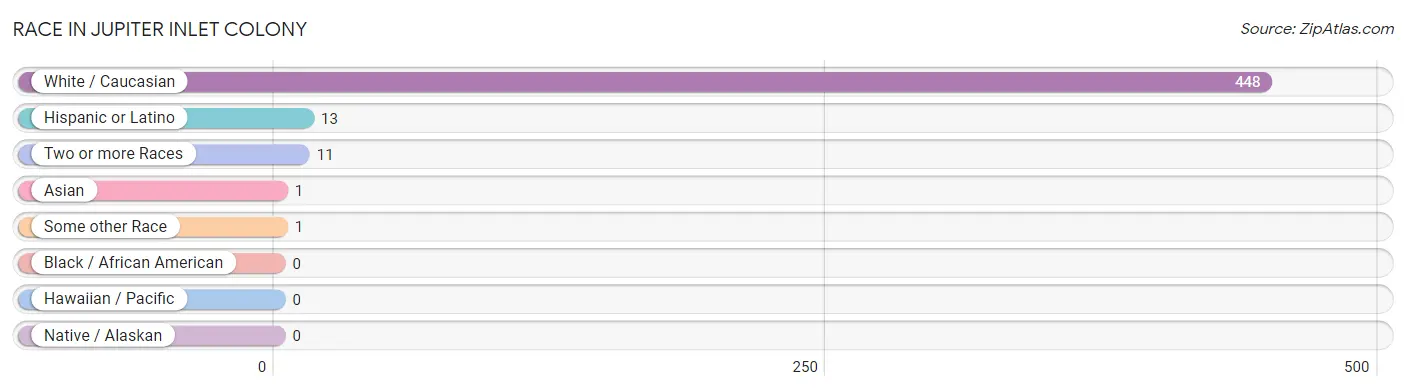
Race in Jupiter Inlet Colony
The most populous races in Jupiter Inlet Colony are White / Caucasian (448 | 97.2%), Hispanic or Latino (13 | 2.8%), and Two or more Races (11 | 2.4%).
| Race | # Population | % Population |
| Asian | 1 | 0.2% |
| Black / African American | 0 | 0.0% |
| Hawaiian / Pacific | 0 | 0.0% |
| Hispanic or Latino | 13 | 2.8% |
| Native / Alaskan | 0 | 0.0% |
| White / Caucasian | 448 | 97.2% |
| Two or more Races | 11 | 2.4% |
| Some other Race | 1 | 0.2% |
| Total | 461 | 100.0% |
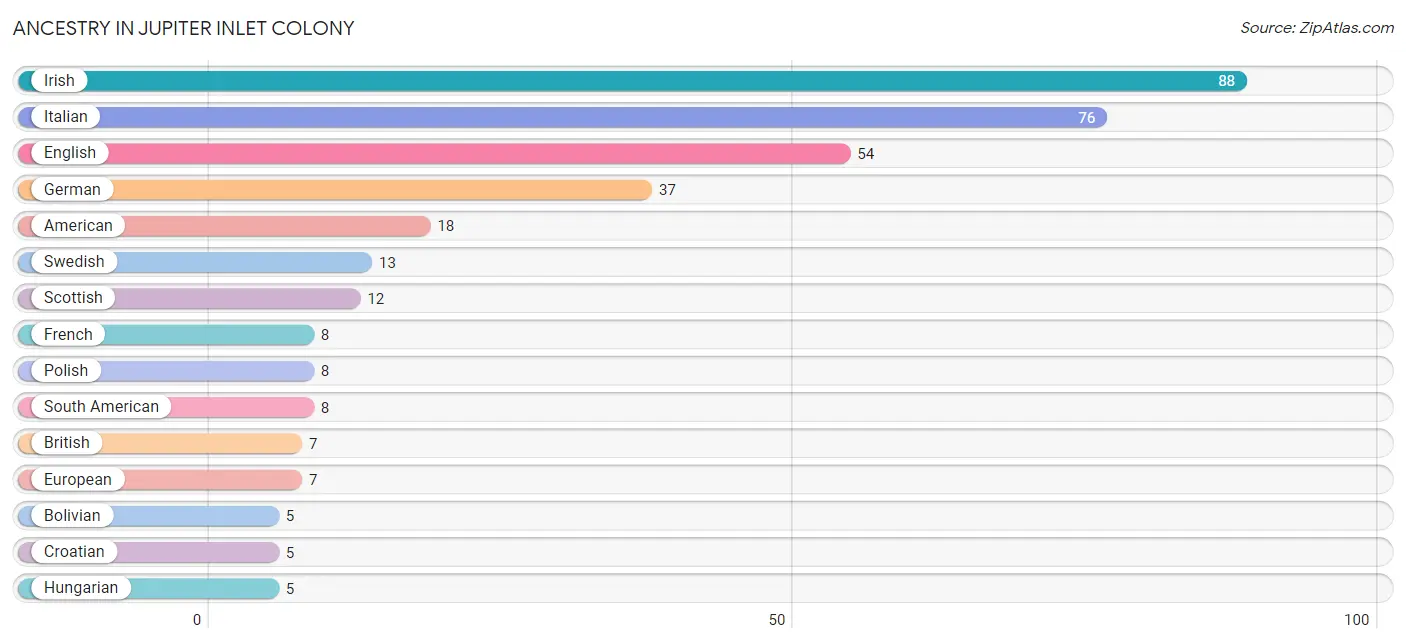
Ancestry in Jupiter Inlet Colony
The most populous ancestries reported in Jupiter Inlet Colony are Irish (88 | 19.1%), Italian (76 | 16.5%), English (54 | 11.7%), German (37 | 8.0%), and American (18 | 3.9%), together accounting for 59.2% of all Jupiter Inlet Colony residents.
| Ancestry | # Population | % Population |
| American | 18 | 3.9% |
| Arab | 2 | 0.4% |
| Belgian | 4 | 0.9% |
| Bolivian | 5 | 1.1% |
| British | 7 | 1.5% |
| Colombian | 3 | 0.6% |
| Croatian | 5 | 1.1% |
| Czechoslovakian | 2 | 0.4% |
| Dutch | 2 | 0.4% |
| Eastern European | 2 | 0.4% |
| English | 54 | 11.7% |
| European | 7 | 1.5% |
| French | 8 | 1.7% |
| German | 37 | 8.0% |
| Greek | 3 | 0.6% |
| Hungarian | 5 | 1.1% |
| Irish | 88 | 19.1% |
| Italian | 76 | 16.5% |
| Korean | 5 | 1.1% |
| Lebanese | 2 | 0.4% |
| Norwegian | 2 | 0.4% |
| Polish | 8 | 1.7% |
| Puerto Rican | 5 | 1.1% |
| Russian | 5 | 1.1% |
| Scotch-Irish | 1 | 0.2% |
| Scottish | 12 | 2.6% |
| Slovak | 5 | 1.1% |
| Slovene | 1 | 0.2% |
| South American | 8 | 1.7% |
| Swedish | 13 | 2.8% |
| Swiss | 2 | 0.4% |
| Ukrainian | 3 | 0.6% |
| Welsh | 4 | 0.9% | View All 33 Rows |
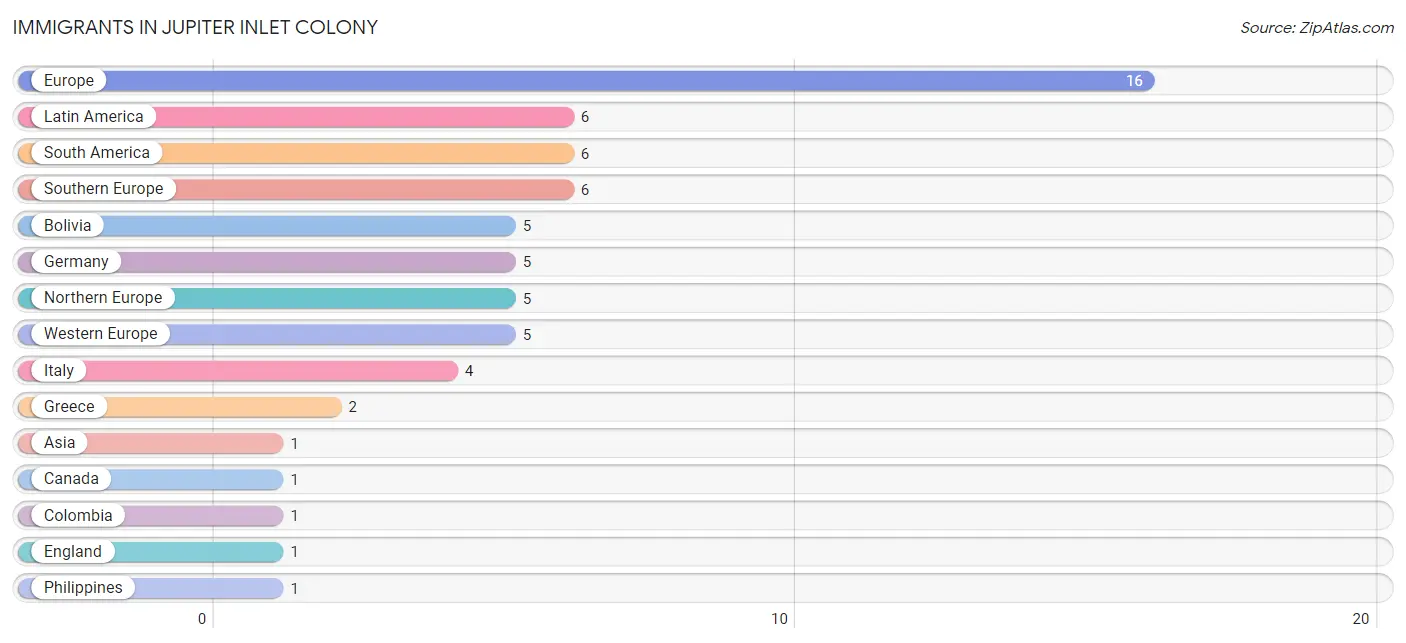
Immigrants in Jupiter Inlet Colony
The most numerous immigrant groups reported in Jupiter Inlet Colony came from Europe (16 | 3.5%), Latin America (6 | 1.3%), South America (6 | 1.3%), Southern Europe (6 | 1.3%), and Bolivia (5 | 1.1%), together accounting for 8.5% of all Jupiter Inlet Colony residents.
| Immigration Origin | # Population | % Population |
| Asia | 1 | 0.2% |
| Bolivia | 5 | 1.1% |
| Canada | 1 | 0.2% |
| Colombia | 1 | 0.2% |
| England | 1 | 0.2% |
| Europe | 16 | 3.5% |
| Germany | 5 | 1.1% |
| Greece | 2 | 0.4% |
| Italy | 4 | 0.9% |
| Latin America | 6 | 1.3% |
| Northern Europe | 5 | 1.1% |
| Philippines | 1 | 0.2% |
| South America | 6 | 1.3% |
| South Eastern Asia | 1 | 0.2% |
| Southern Europe | 6 | 1.3% |
| Western Europe | 5 | 1.1% | View All 16 Rows |
Sex and Age in Jupiter Inlet Colony
Sex and Age in Jupiter Inlet Colony
The most populous age groups in Jupiter Inlet Colony are 15 to 19 Years (75 | 28.0%) for men and 50 to 54 Years (30 | 15.5%) for women.
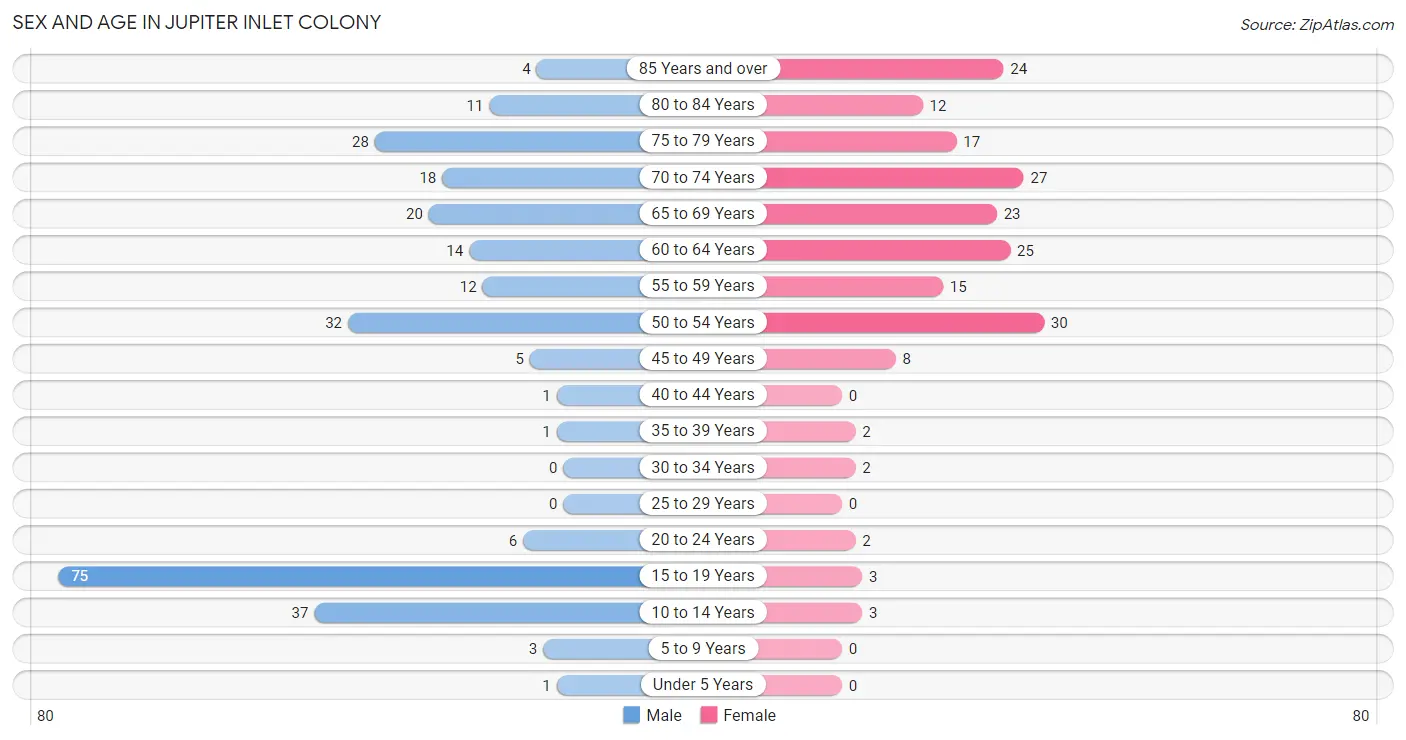
| Age Bracket | Male | Female |
| Under 5 Years | 1 (0.4%) | 0 (0.0%) |
| 5 to 9 Years | 3 (1.1%) | 0 (0.0%) |
| 10 to 14 Years | 37 (13.8%) | 3 (1.5%) |
| 15 to 19 Years | 75 (28.0%) | 3 (1.5%) |
| 20 to 24 Years | 6 (2.2%) | 2 (1.0%) |
| 25 to 29 Years | 0 (0.0%) | 0 (0.0%) |
| 30 to 34 Years | 0 (0.0%) | 2 (1.0%) |
| 35 to 39 Years | 1 (0.4%) | 2 (1.0%) |
| 40 to 44 Years | 1 (0.4%) | 0 (0.0%) |
| 45 to 49 Years | 5 (1.9%) | 8 (4.2%) |
| 50 to 54 Years | 32 (11.9%) | 30 (15.5%) |
| 55 to 59 Years | 12 (4.5%) | 15 (7.8%) |
| 60 to 64 Years | 14 (5.2%) | 25 (13.0%) |
| 65 to 69 Years | 20 (7.5%) | 23 (11.9%) |
| 70 to 74 Years | 18 (6.7%) | 27 (14.0%) |
| 75 to 79 Years | 28 (10.4%) | 17 (8.8%) |
| 80 to 84 Years | 11 (4.1%) | 12 (6.2%) |
| 85 Years and over | 4 (1.5%) | 24 (12.4%) |
| Total | 268 (100.0%) | 193 (100.0%) |
Families and Households in Jupiter Inlet Colony
Median Family Size in Jupiter Inlet Colony
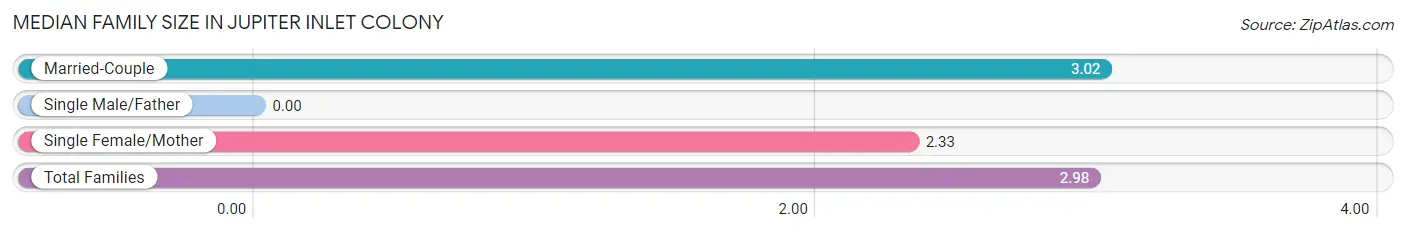
| Family Type | # Families | Family Size |
| Married-Couple | 121 (95.3%) | 3.02 |
| Single Male/Father | 0 (0.0%) | - |
| Single Female/Mother | 6 (4.7%) | 2.33 |
| Total Families | 127 (100.0%) | 2.98 |
Median Household Size in Jupiter Inlet Colony
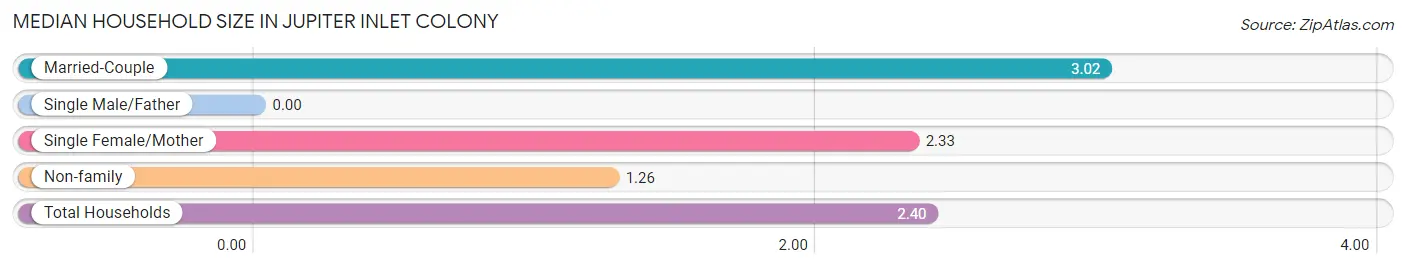
| Household Type | # Households | Household Size |
| Married-Couple | 121 (63.0%) | 3.02 |
| Single Male/Father | 0 (0.0%) | - |
| Single Female/Mother | 6 (3.1%) | 2.33 |
| Non-family | 65 (33.9%) | 1.26 |
| Total Households | 192 (100.0%) | 2.40 |
Household Size by Marriage Status in Jupiter Inlet Colony
Out of a total of 192 households in Jupiter Inlet Colony, 127 (66.1%) are family households, while 65 (33.9%) are nonfamily households. The most numerous type of family households are 2-person households, comprising 87, and the most common type of nonfamily households are 1-person households, comprising 50.
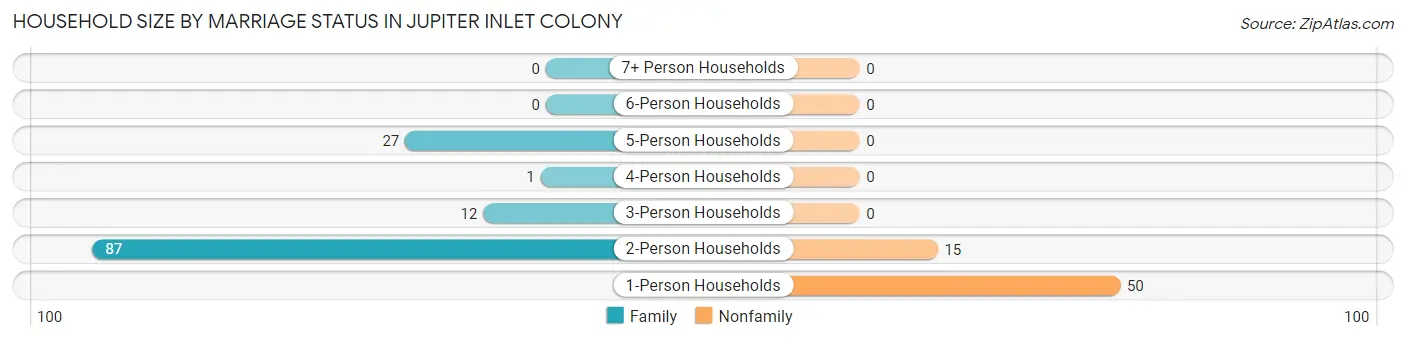
| Household Size | Family Households | Nonfamily Households |
| 1-Person Households | - | 50 (26.0%) |
| 2-Person Households | 87 (45.3%) | 15 (7.8%) |
| 3-Person Households | 12 (6.2%) | 0 (0.0%) |
| 4-Person Households | 1 (0.5%) | 0 (0.0%) |
| 5-Person Households | 27 (14.1%) | 0 (0.0%) |
| 6-Person Households | 0 (0.0%) | 0 (0.0%) |
| 7+ Person Households | 0 (0.0%) | 0 (0.0%) |
| Total | 127 (66.1%) | 65 (33.9%) |
Female Fertility in Jupiter Inlet Colony
Fertility by Age in Jupiter Inlet Colony
Average fertility rate in Jupiter Inlet Colony is 24.0 births per 1,000 women. Women in the age bracket of 20 to 34 years have the highest fertility rate with 250.0 births per 1,000 women. Women in the age bracket of 20 to 34 years acount for 100.0% of all women with births.
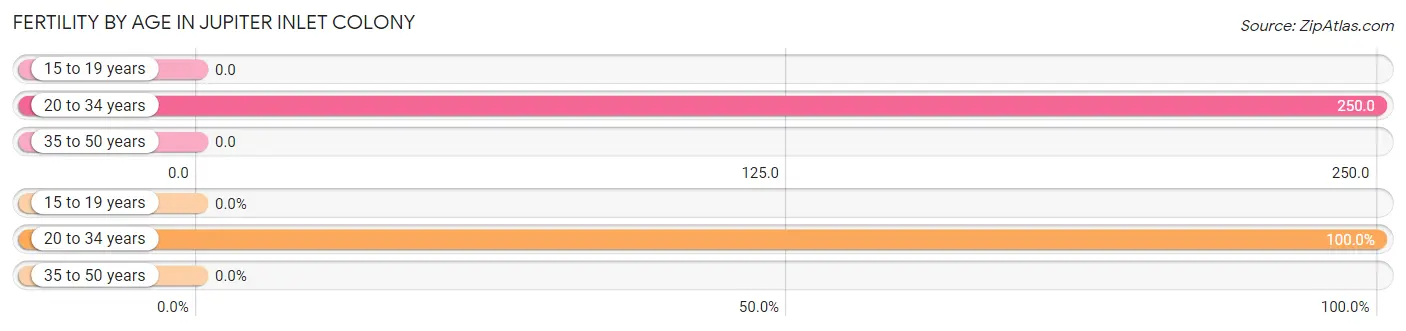
| Age Bracket | Women with Births | Births / 1,000 Women |
| 15 to 19 years | 0 (0.0%) | 0.0 |
| 20 to 34 years | 1 (100.0%) | 250.0 |
| 35 to 50 years | 0 (0.0%) | 0.0 |
| Total | 1 (100.0%) | 24.0 |
Fertility by Age by Marriage Status in Jupiter Inlet Colony
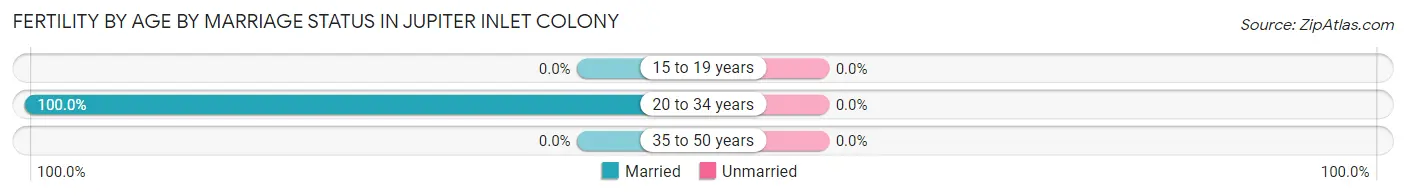
| Age Bracket | Married | Unmarried |
| 15 to 19 years | 0 (0.0%) | 0 (0.0%) |
| 20 to 34 years | 1 (100.0%) | 0 (0.0%) |
| 35 to 50 years | 0 (0.0%) | 0 (0.0%) |
| Total | 1 (100.0%) | 0 (0.0%) |
Fertility by Education in Jupiter Inlet Colony
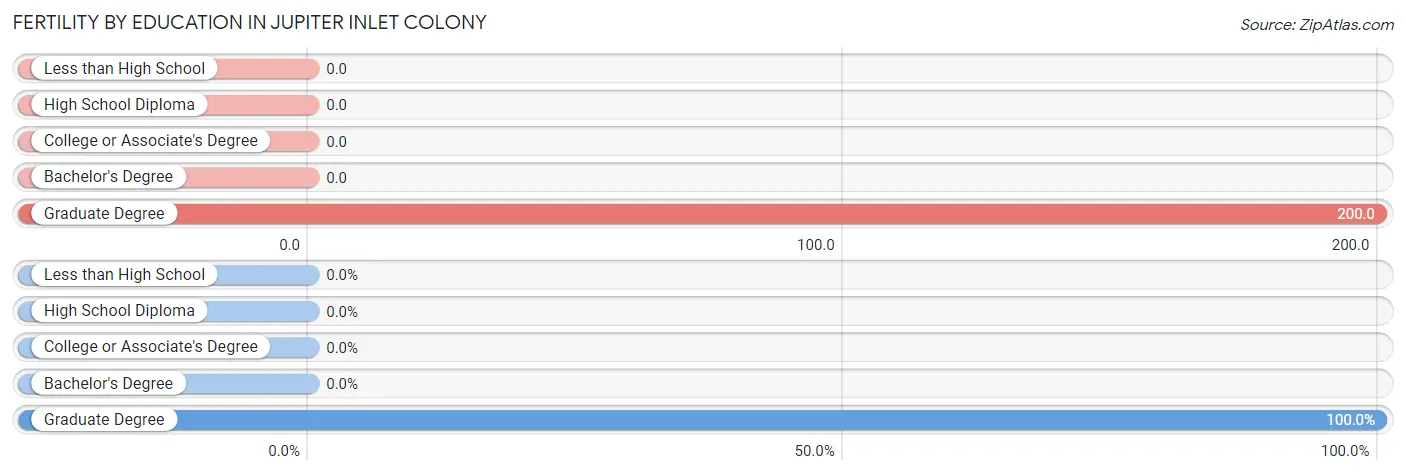
| Educational Attainment | Women with Births | Births / 1,000 Women |
| Less than High School | 0 (0.0%) | 0.0 |
| High School Diploma | 0 (0.0%) | 0.0 |
| College or Associate's Degree | 0 (0.0%) | 0.0 |
| Bachelor's Degree | 0 (0.0%) | 0.0 |
| Graduate Degree | 1 (100.0%) | 200.0 |
| Total | 1 (100.0%) | 24.0 |
Fertility by Education by Marriage Status in Jupiter Inlet Colony
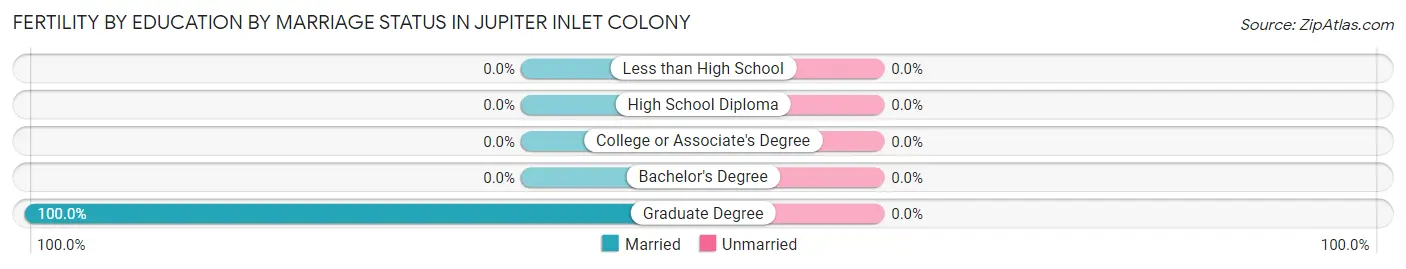
| Educational Attainment | Married | Unmarried |
| Less than High School | 0 (0.0%) | 0 (0.0%) |
| High School Diploma | 0 (0.0%) | 0 (0.0%) |
| College or Associate's Degree | 0 (0.0%) | 0 (0.0%) |
| Bachelor's Degree | 0 (0.0%) | 0 (0.0%) |
| Graduate Degree | 1 (100.0%) | 0 (0.0%) |
| Total | 1 (100.0%) | 0 (0.0%) |
Income in Jupiter Inlet Colony
Income Overview in Jupiter Inlet Colony
Per Capita Income in Jupiter Inlet Colony is $111,160, while median incomes of families and households are $178,750 and $135,000 respectively.
| Characteristic | Number | Measure |
| Per Capita Income | 461 | $111,160 |
| Median Family Income | 127 | $178,750 |
| Mean Family Income | 127 | $317,324 |
| Median Household Income | 192 | $135,000 |
| Mean Household Income | 192 | $265,348 |
| Income Deficit | 127 | $0 |
| Wage / Income Gap (%) | 461 | 0.00% |
| Wage / Income Gap ($) | 461 | 100.00¢ per $1 |
| Gini / Inequality Index | 461 | 0.64 |
Earnings by Sex in Jupiter Inlet Colony
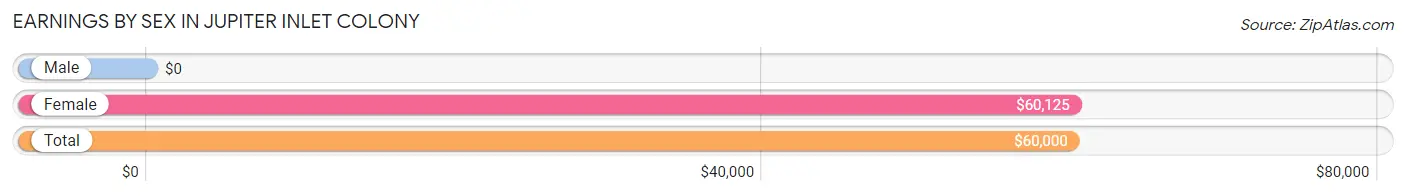
| Sex | Number | Average Earnings |
| Male | 93 (68.4%) | $0 |
| Female | 43 (31.6%) | $60,125 |
| Total | 136 (100.0%) | $60,000 |
Earnings by Sex by Income Bracket in Jupiter Inlet Colony
The most common earnings brackets in Jupiter Inlet Colony are $100,000+ for men (36 | 38.7%) and $55,000 to $64,999 for women (10 | 23.3%).
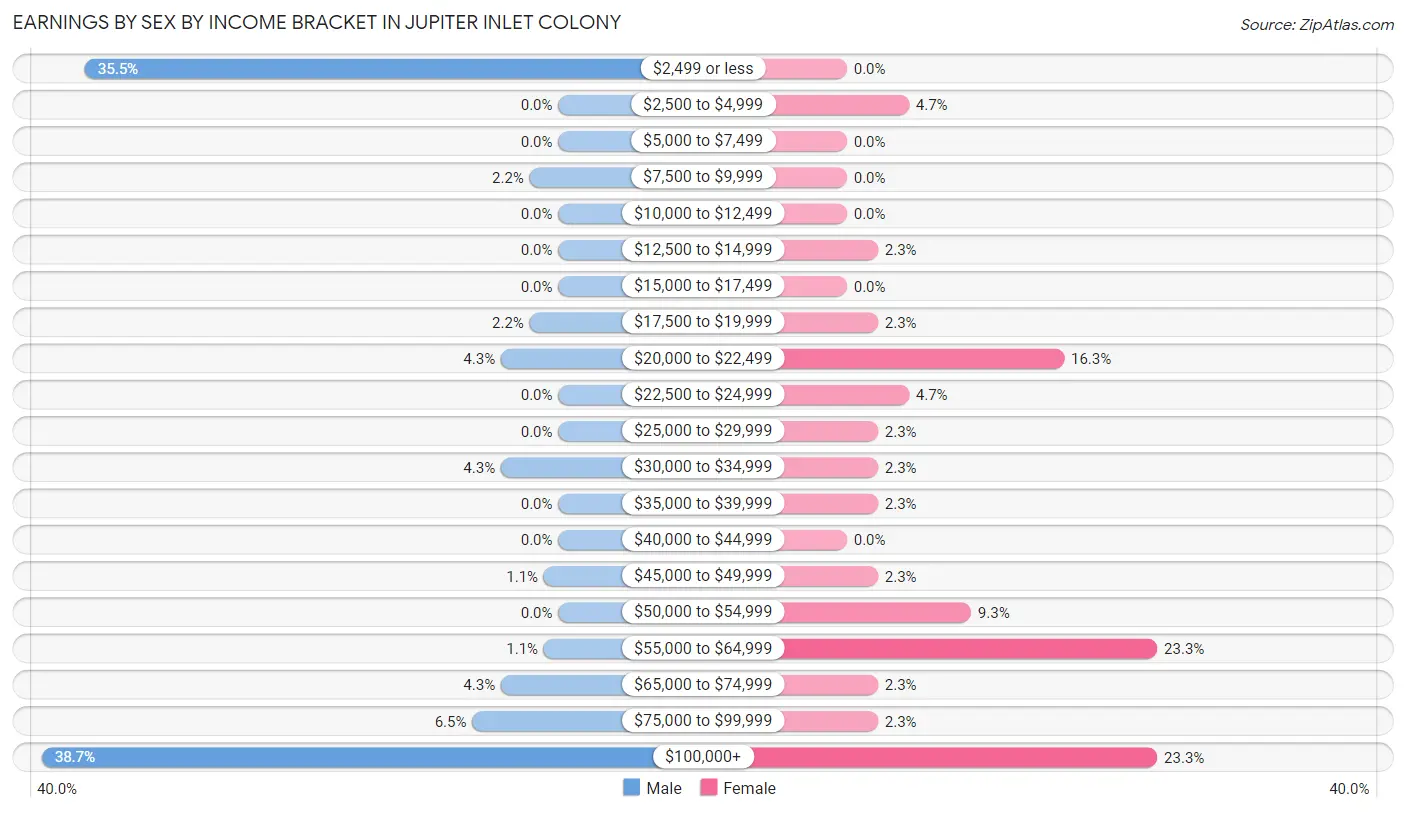
| Income | Male | Female |
| $2,499 or less | 33 (35.5%) | 0 (0.0%) |
| $2,500 to $4,999 | 0 (0.0%) | 2 (4.6%) |
| $5,000 to $7,499 | 0 (0.0%) | 0 (0.0%) |
| $7,500 to $9,999 | 2 (2.1%) | 0 (0.0%) |
| $10,000 to $12,499 | 0 (0.0%) | 0 (0.0%) |
| $12,500 to $14,999 | 0 (0.0%) | 1 (2.3%) |
| $15,000 to $17,499 | 0 (0.0%) | 0 (0.0%) |
| $17,500 to $19,999 | 2 (2.1%) | 1 (2.3%) |
| $20,000 to $22,499 | 4 (4.3%) | 7 (16.3%) |
| $22,500 to $24,999 | 0 (0.0%) | 2 (4.6%) |
| $25,000 to $29,999 | 0 (0.0%) | 1 (2.3%) |
| $30,000 to $34,999 | 4 (4.3%) | 1 (2.3%) |
| $35,000 to $39,999 | 0 (0.0%) | 1 (2.3%) |
| $40,000 to $44,999 | 0 (0.0%) | 0 (0.0%) |
| $45,000 to $49,999 | 1 (1.1%) | 1 (2.3%) |
| $50,000 to $54,999 | 0 (0.0%) | 4 (9.3%) |
| $55,000 to $64,999 | 1 (1.1%) | 10 (23.3%) |
| $65,000 to $74,999 | 4 (4.3%) | 1 (2.3%) |
| $75,000 to $99,999 | 6 (6.5%) | 1 (2.3%) |
| $100,000+ | 36 (38.7%) | 10 (23.3%) |
| Total | 93 (100.0%) | 43 (100.0%) |
Earnings by Sex by Educational Attainment in Jupiter Inlet Colony
Average earnings in Jupiter Inlet Colony are $155,500 for men and $60,125 for women, a difference of 61.3%. Men with an educational attainment of high school diploma enjoy the highest average annual earnings of $170,938, while those with college or associate's degree education earn the least with $71,250. Women with an educational attainment of bachelor's degree earn the most with the average annual earnings of $100,625, while those with bachelor's degree education have the smallest earnings of $100,625.
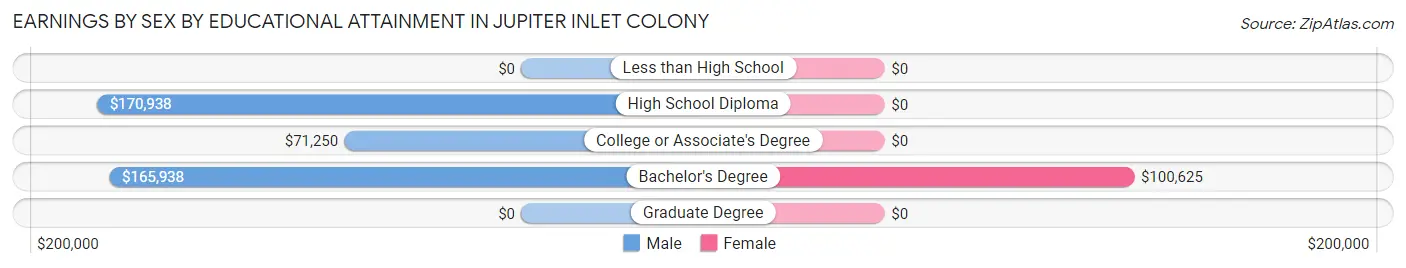
| Educational Attainment | Male Income | Female Income |
| Less than High School | - | - |
| High School Diploma | $170,938 | $0 |
| College or Associate's Degree | $71,250 | $0 |
| Bachelor's Degree | $165,938 | $100,625 |
| Graduate Degree | - | - |
| Total | $155,500 | $60,125 |
Family Income in Jupiter Inlet Colony
Family Income Brackets in Jupiter Inlet Colony
According to the Jupiter Inlet Colony family income data, there are 59 families falling into the $200,000+ income range, which is the most common income bracket and makes up 46.5% of all families.
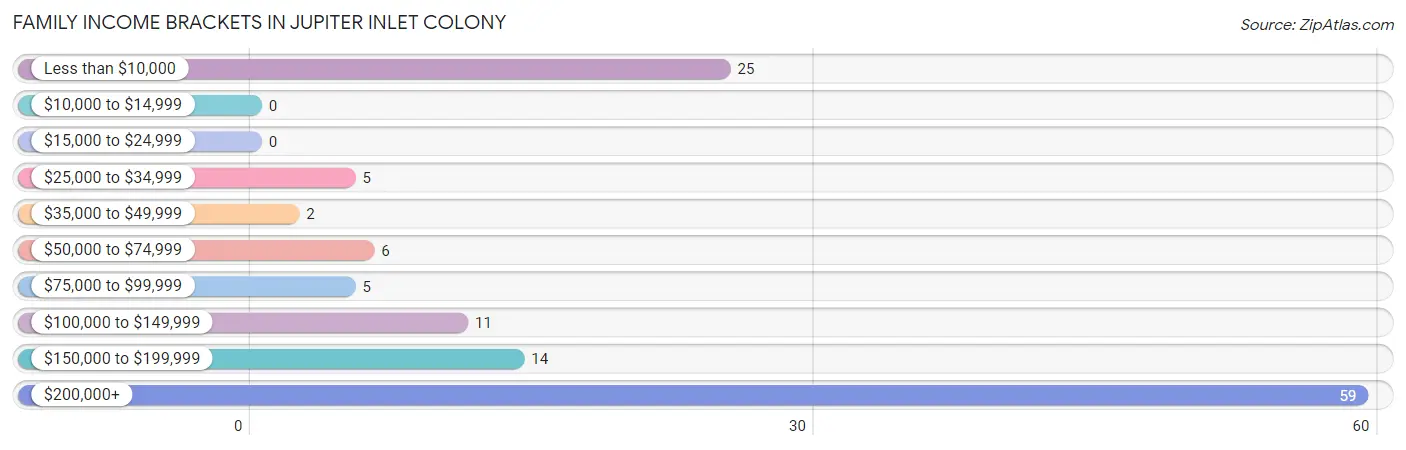
| Income Bracket | # Families | % Families |
| Less than $10,000 | 25 | 19.7% |
| $10,000 to $14,999 | 0 | 0.0% |
| $15,000 to $24,999 | 0 | 0.0% |
| $25,000 to $34,999 | 5 | 3.9% |
| $35,000 to $49,999 | 2 | 1.6% |
| $50,000 to $74,999 | 6 | 4.7% |
| $75,000 to $99,999 | 5 | 3.9% |
| $100,000 to $149,999 | 11 | 8.7% |
| $150,000 to $199,999 | 14 | 11.0% |
| $200,000+ | 59 | 46.5% |
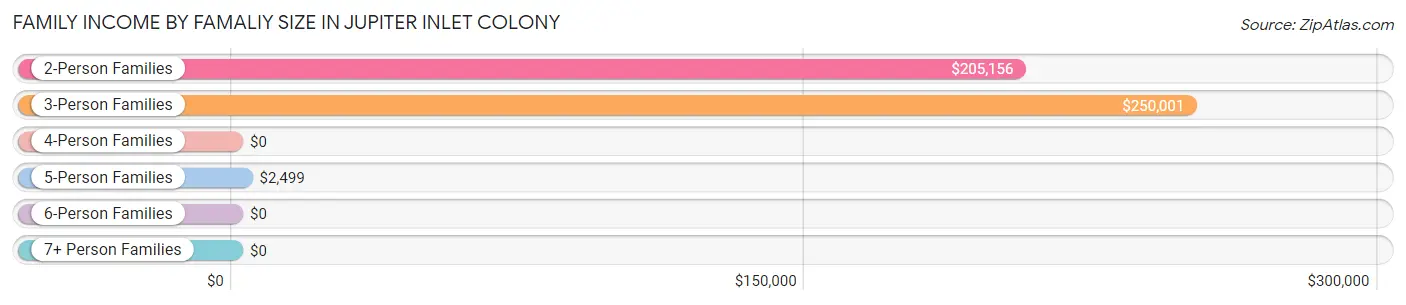
Family Income by Famaliy Size in Jupiter Inlet Colony
3-person families (12 | 9.5%) account for the highest median family income in Jupiter Inlet Colony with $250,001 per family, while 2-person families (87 | 68.5%) have the highest median income of $102,578 per family member.
| Income Bracket | # Families | Median Income |
| 2-Person Families | 87 (68.5%) | $205,156 |
| 3-Person Families | 12 (9.5%) | $250,001 |
| 4-Person Families | 1 (0.8%) | $0 |
| 5-Person Families | 27 (21.3%) | $2,499 |
| 6-Person Families | 0 (0.0%) | $0 |
| 7+ Person Families | 0 (0.0%) | $0 |
| Total | 127 (100.0%) | $178,750 |
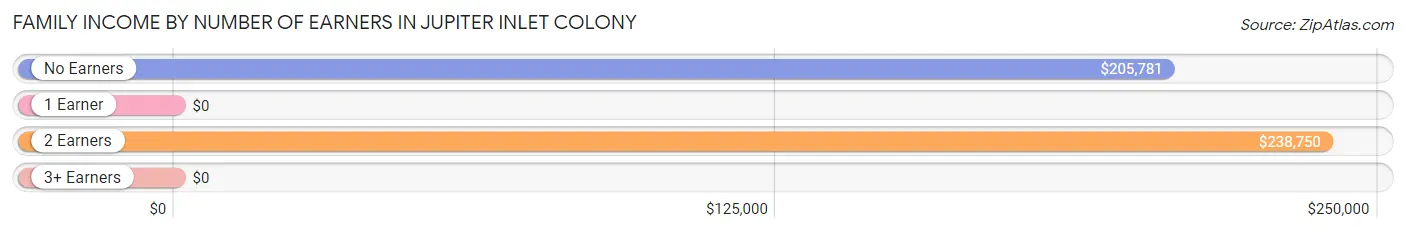
Family Income by Number of Earners in Jupiter Inlet Colony
| Number of Earners | # Families | Median Income |
| No Earners | 49 (38.6%) | $205,781 |
| 1 Earner | 56 (44.1%) | $0 |
| 2 Earners | 22 (17.3%) | $238,750 |
| 3+ Earners | 0 (0.0%) | $0 |
| Total | 127 (100.0%) | $178,750 |
Household Income in Jupiter Inlet Colony
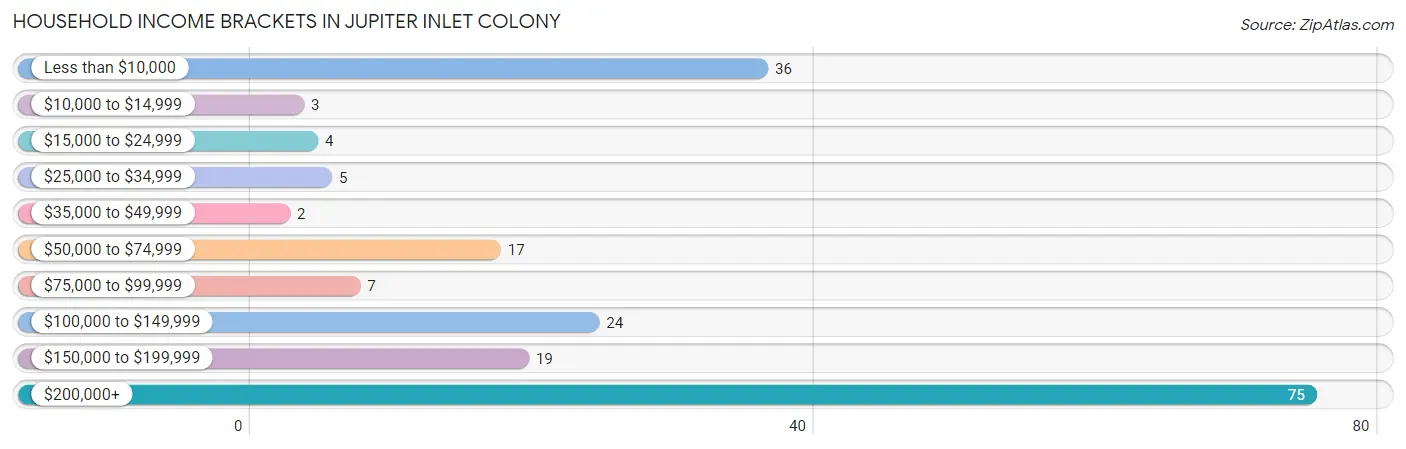
Household Income Brackets in Jupiter Inlet Colony
With 75 households falling in the category, the $200,000+ income range is the most frequent in Jupiter Inlet Colony, accounting for 39.1% of all households. In contrast, only 2 households (1.0%) fall into the $35,000 to $49,999 income bracket, making it the least populous group.
| Income Bracket | # Households | % Households |
| Less than $10,000 | 36 | 18.8% |
| $10,000 to $14,999 | 3 | 1.6% |
| $15,000 to $24,999 | 4 | 2.1% |
| $25,000 to $34,999 | 5 | 2.6% |
| $35,000 to $49,999 | 2 | 1.0% |
| $50,000 to $74,999 | 17 | 8.9% |
| $75,000 to $99,999 | 7 | 3.6% |
| $100,000 to $149,999 | 24 | 12.5% |
| $150,000 to $199,999 | 19 | 9.9% |
| $200,000+ | 75 | 39.1% |
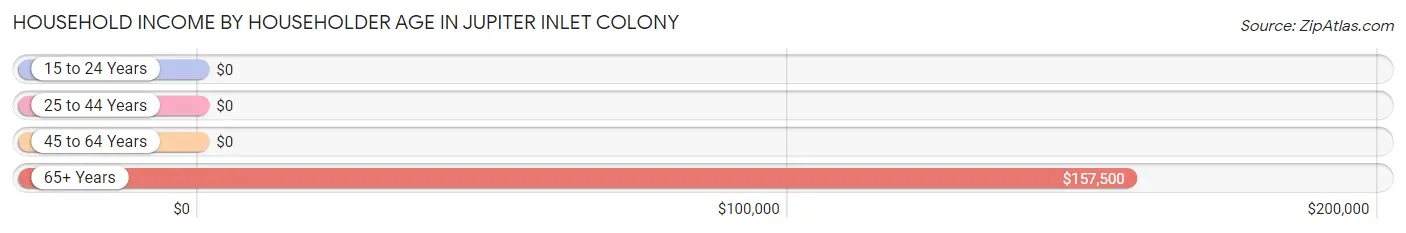
Household Income by Householder Age in Jupiter Inlet Colony
The median household income in Jupiter Inlet Colony is $135,000, with the highest median household income of $157,500 found in the 65+ years age bracket for the primary householder. A total of 120 households (62.5%) fall into this category. Meanwhile, the 15 to 24 years age bracket for the primary householder has the lowest median household income of $0, with 2 households (1.0%) in this group.
| Income Bracket | # Households | Median Income |
| 15 to 24 Years | 2 (1.0%) | $0 |
| 25 to 44 Years | 1 (0.5%) | $0 |
| 45 to 64 Years | 69 (35.9%) | $0 |
| 65+ Years | 120 (62.5%) | $157,500 |
| Total | 192 (100.0%) | $135,000 |
Poverty in Jupiter Inlet Colony
Income Below Poverty by Sex and Age in Jupiter Inlet Colony
With 46.6% poverty level for males and 19.2% for females among the residents of Jupiter Inlet Colony, 16 and 17 year old males and 45 to 54 year old females are the most vulnerable to poverty, with 33 males (100.0%) and 22 females (57.9%) in their respective age groups living below the poverty level.
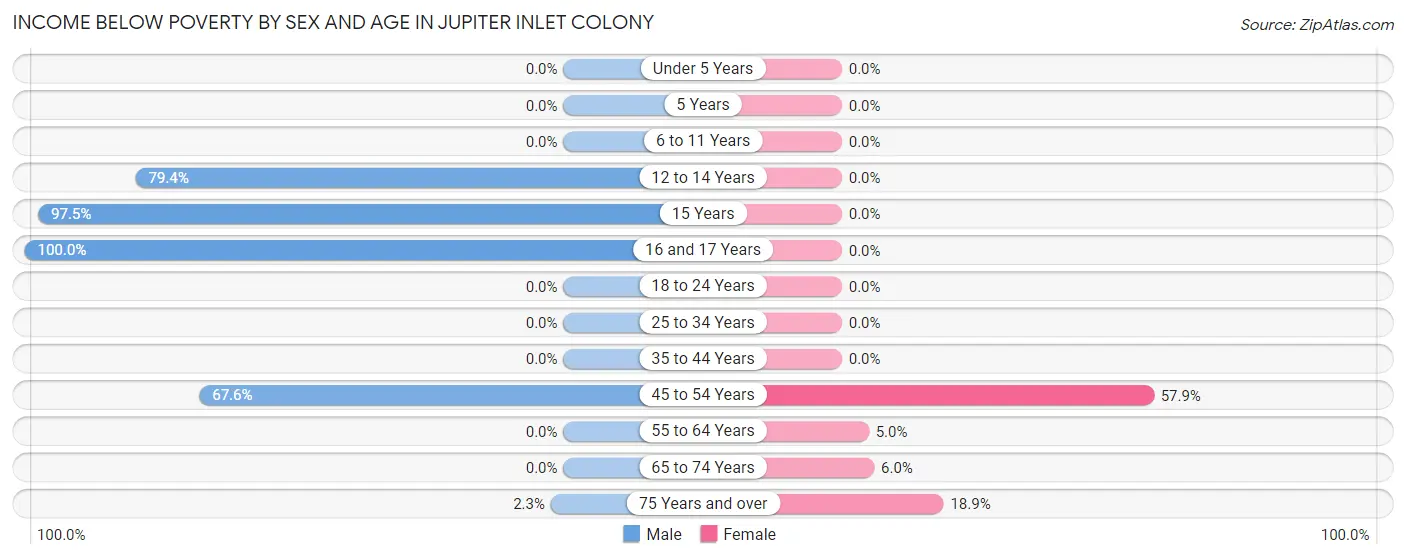
| Age Bracket | Male | Female |
| Under 5 Years | 0 (0.0%) | 0 (0.0%) |
| 5 Years | 0 (0.0%) | 0 (0.0%) |
| 6 to 11 Years | 0 (0.0%) | 0 (0.0%) |
| 12 to 14 Years | 27 (79.4%) | 0 (0.0%) |
| 15 Years | 39 (97.5%) | 0 (0.0%) |
| 16 and 17 Years | 33 (100.0%) | 0 (0.0%) |
| 18 to 24 Years | 0 (0.0%) | 0 (0.0%) |
| 25 to 34 Years | 0 (0.0%) | 0 (0.0%) |
| 35 to 44 Years | 0 (0.0%) | 0 (0.0%) |
| 45 to 54 Years | 25 (67.6%) | 22 (57.9%) |
| 55 to 64 Years | 0 (0.0%) | 2 (5.0%) |
| 65 to 74 Years | 0 (0.0%) | 3 (6.0%) |
| 75 Years and over | 1 (2.3%) | 10 (18.9%) |
| Total | 125 (46.6%) | 37 (19.2%) |
Income Above Poverty by Sex and Age in Jupiter Inlet Colony
According to the poverty statistics in Jupiter Inlet Colony, males aged under 5 years and females aged 12 to 14 years are the age groups that are most secure financially, with 100.0% of males and 100.0% of females in these age groups living above the poverty line.
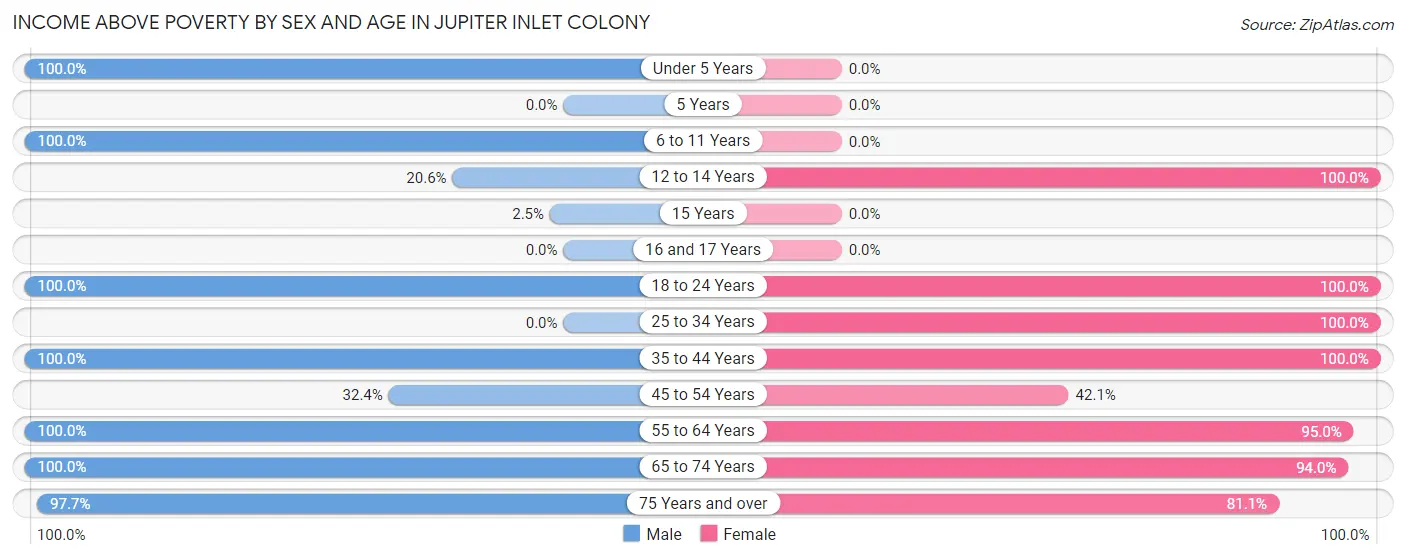
| Age Bracket | Male | Female |
| Under 5 Years | 1 (100.0%) | 0 (0.0%) |
| 5 Years | 0 (0.0%) | 0 (0.0%) |
| 6 to 11 Years | 6 (100.0%) | 0 (0.0%) |
| 12 to 14 Years | 7 (20.6%) | 3 (100.0%) |
| 15 Years | 1 (2.5%) | 0 (0.0%) |
| 16 and 17 Years | 0 (0.0%) | 0 (0.0%) |
| 18 to 24 Years | 8 (100.0%) | 5 (100.0%) |
| 25 to 34 Years | 0 (0.0%) | 2 (100.0%) |
| 35 to 44 Years | 2 (100.0%) | 2 (100.0%) |
| 45 to 54 Years | 12 (32.4%) | 16 (42.1%) |
| 55 to 64 Years | 26 (100.0%) | 38 (95.0%) |
| 65 to 74 Years | 38 (100.0%) | 47 (94.0%) |
| 75 Years and over | 42 (97.7%) | 43 (81.1%) |
| Total | 143 (53.4%) | 156 (80.8%) |
Income Below Poverty Among Married-Couple Families in Jupiter Inlet Colony
The poverty statistics for married-couple families in Jupiter Inlet Colony show that 20.7% or 25 of the total 121 families live below the poverty line. Families with 3 or 4 children have the highest poverty rate of 88.9%, comprising of 24 families. On the other hand, families with 1 or 2 children have the lowest poverty rate of 0.0%, which includes 0 families.
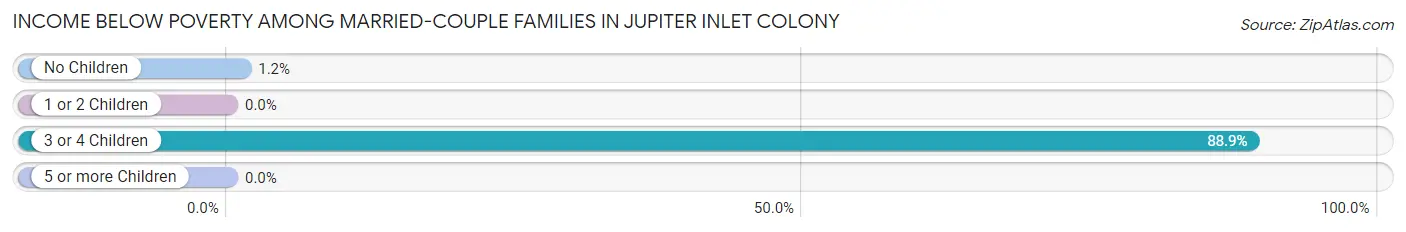
| Children | Above Poverty | Below Poverty |
| No Children | 86 (98.9%) | 1 (1.1%) |
| 1 or 2 Children | 7 (100.0%) | 0 (0.0%) |
| 3 or 4 Children | 3 (11.1%) | 24 (88.9%) |
| 5 or more Children | 0 (0.0%) | 0 (0.0%) |
| Total | 96 (79.3%) | 25 (20.7%) |
Income Below Poverty Among Single-Parent Households in Jupiter Inlet Colony
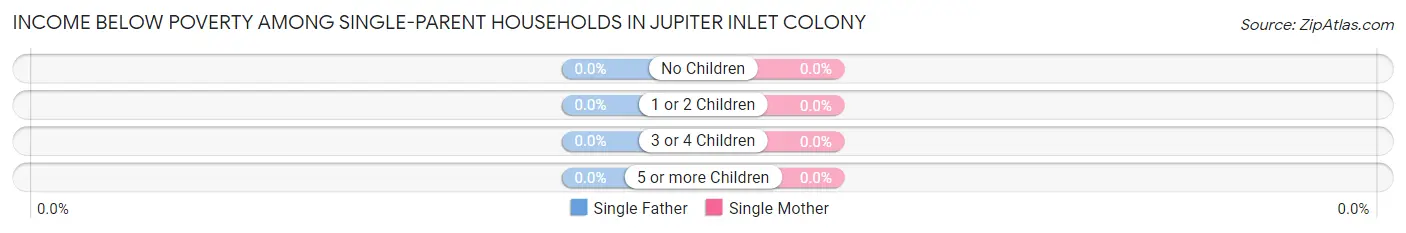
| Children | Single Father | Single Mother |
| No Children | 0 (0.0%) | 0 (0.0%) |
| 1 or 2 Children | 0 (0.0%) | 0 (0.0%) |
| 3 or 4 Children | 0 (0.0%) | 0 (0.0%) |
| 5 or more Children | 0 (0.0%) | 0 (0.0%) |
| Total | 0 (0.0%) | 0 (0.0%) |
Income Below Poverty Among Married-Couple vs Single-Parent Households in Jupiter Inlet Colony
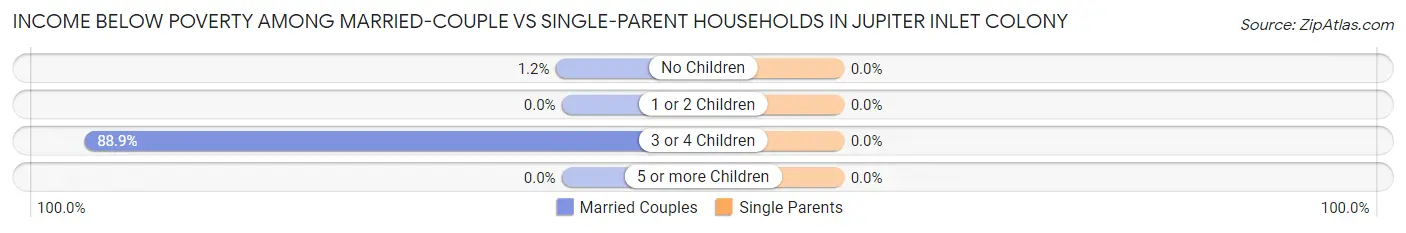
| Children | Married-Couple Families | Single-Parent Households |
| No Children | 1 (1.1%) | 0 (0.0%) |
| 1 or 2 Children | 0 (0.0%) | 0 (0.0%) |
| 3 or 4 Children | 24 (88.9%) | 0 (0.0%) |
| 5 or more Children | 0 (0.0%) | 0 (0.0%) |
| Total | 25 (20.7%) | 0 (0.0%) |
Employment Characteristics in Jupiter Inlet Colony
Employment by Class of Employer in Jupiter Inlet Colony
Among the 134 employed individuals in Jupiter Inlet Colony, private company employees (85 | 63.4%), self-employed (incorporated) (27 | 20.2%), and self-employed (not incorporated) (14 | 10.4%) make up the most common classes of employment.
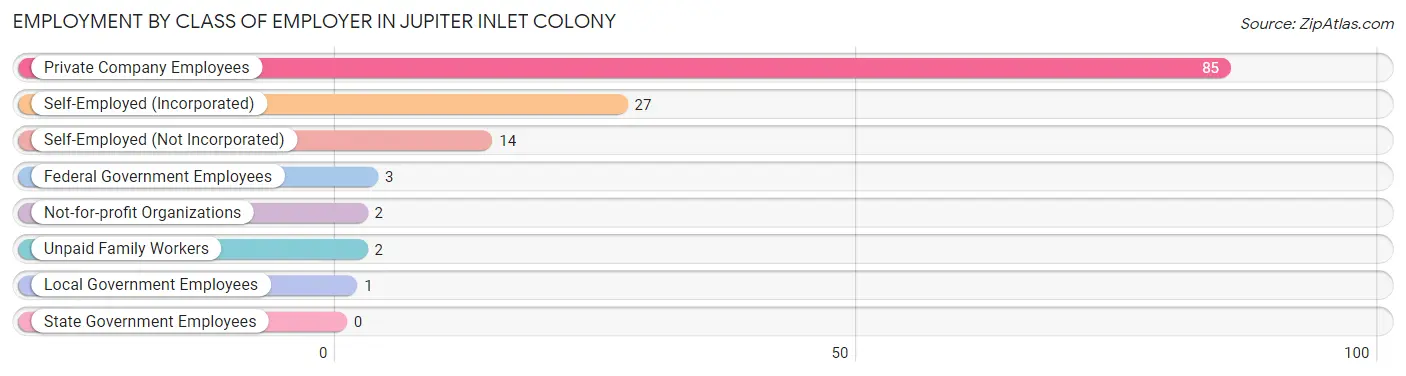
| Employer Class | # Employees | % Employees |
| Private Company Employees | 85 | 63.4% |
| Self-Employed (Incorporated) | 27 | 20.2% |
| Self-Employed (Not Incorporated) | 14 | 10.4% |
| Not-for-profit Organizations | 2 | 1.5% |
| Local Government Employees | 1 | 0.7% |
| State Government Employees | 0 | 0.0% |
| Federal Government Employees | 3 | 2.2% |
| Unpaid Family Workers | 2 | 1.5% |
| Total | 134 | 100.0% |
Employment Status by Age in Jupiter Inlet Colony
According to the labor force statistics for Jupiter Inlet Colony, out of the total population over 16 years of age (377), 36.6% or 138 individuals are in the labor force, with 2.9% or 4 of them unemployed. The age group with the highest labor force participation rate is 30 to 34 years, with 100.0% or 2 individuals in the labor force. Within the labor force, the 45 to 54 years age range has the highest percentage of unemployed individuals, with 10.0% or 2 of them being unemployed.
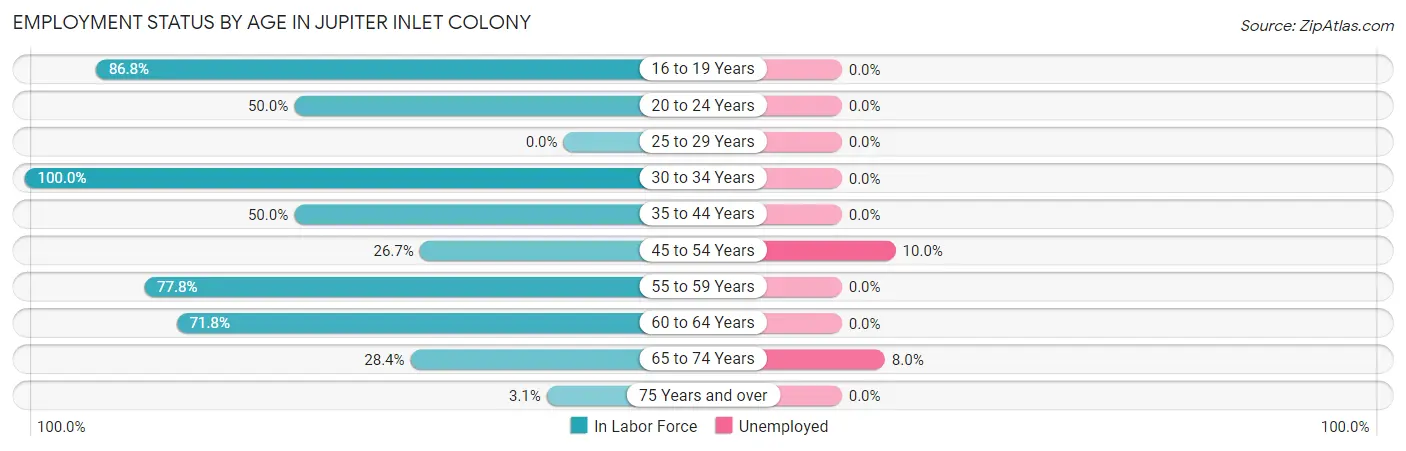
| Age Bracket | In Labor Force | Unemployed |
| 16 to 19 Years | 33 (86.8%) | 0 (0.0%) |
| 20 to 24 Years | 4 (50.0%) | 0 (0.0%) |
| 25 to 29 Years | 0 (0.0%) | 0 (0.0%) |
| 30 to 34 Years | 2 (100.0%) | 0 (0.0%) |
| 35 to 44 Years | 2 (50.0%) | 0 (0.0%) |
| 45 to 54 Years | 20 (26.7%) | 2 (10.0%) |
| 55 to 59 Years | 21 (77.8%) | 0 (0.0%) |
| 60 to 64 Years | 28 (71.8%) | 0 (0.0%) |
| 65 to 74 Years | 25 (28.4%) | 2 (8.0%) |
| 75 Years and over | 3 (3.1%) | 0 (0.0%) |
| Total | 138 (36.6%) | 4 (2.9%) |
Employment Status by Educational Attainment in Jupiter Inlet Colony
According to labor force statistics for Jupiter Inlet Colony, 49.7% of individuals (73) out of the total population between 25 and 64 years of age (147) are in the labor force, with 2.7% or 2 of them being unemployed. The group with the highest labor force participation rate are those with the educational attainment of less than high school, with 100.0% or 2 individuals in the labor force. Within the labor force, individuals with college / associate degree education have the highest percentage of unemployment, with 7.7% or 2 of them being unemployed.
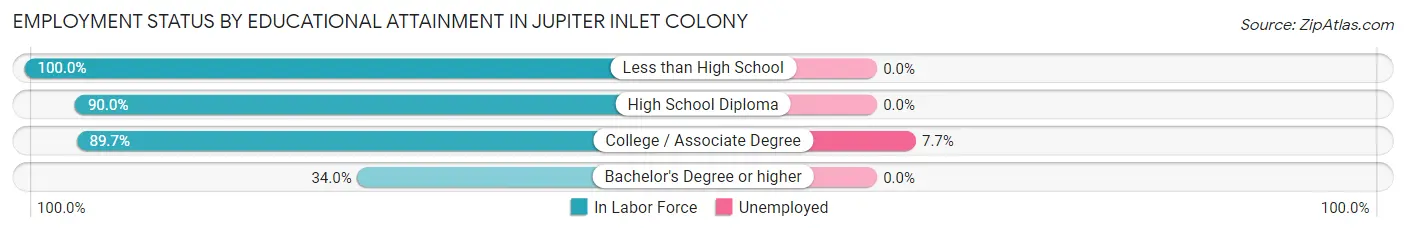
| Educational Attainment | In Labor Force | Unemployed |
| Less than High School | 2 (100.0%) | 0 (0.0%) |
| High School Diploma | 9 (90.0%) | 0 (0.0%) |
| College / Associate Degree | 26 (89.7%) | 2 (7.7%) |
| Bachelor's Degree or higher | 36 (34.0%) | 0 (0.0%) |
| Total | 73 (49.7%) | 4 (2.7%) |
Employment Occupations by Sex in Jupiter Inlet Colony
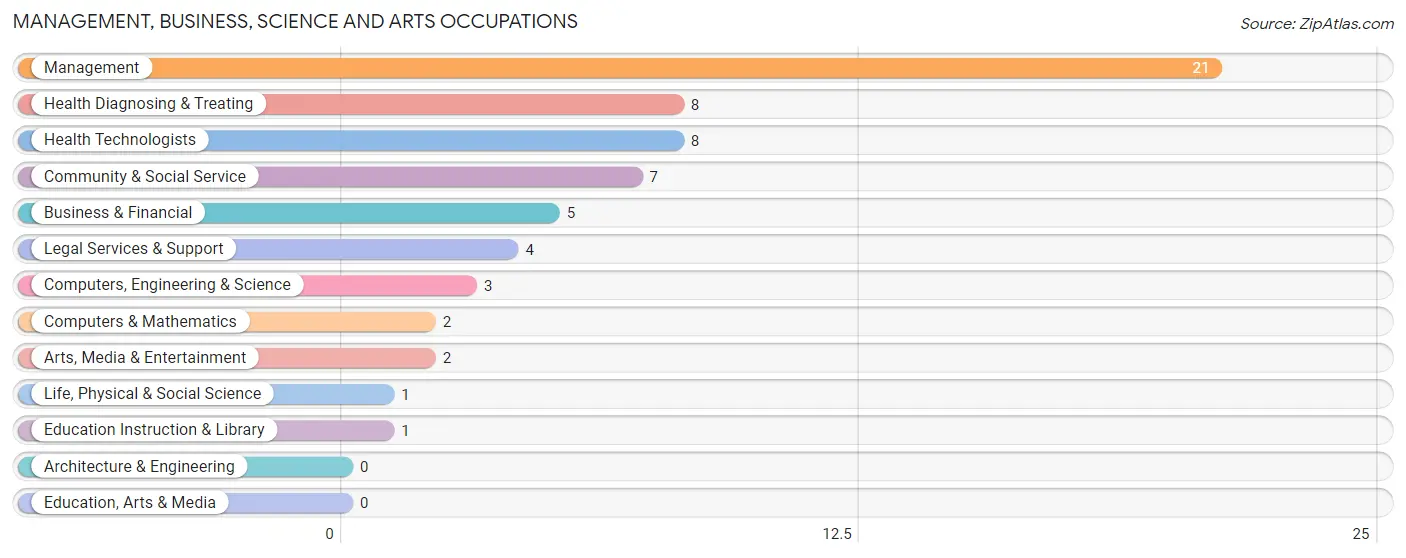
Management, Business, Science and Arts Occupations
The most common Management, Business, Science and Arts occupations in Jupiter Inlet Colony are Management (21 | 15.7%), Health Diagnosing & Treating (8 | 6.0%), Health Technologists (8 | 6.0%), Community & Social Service (7 | 5.2%), and Business & Financial (5 | 3.7%).
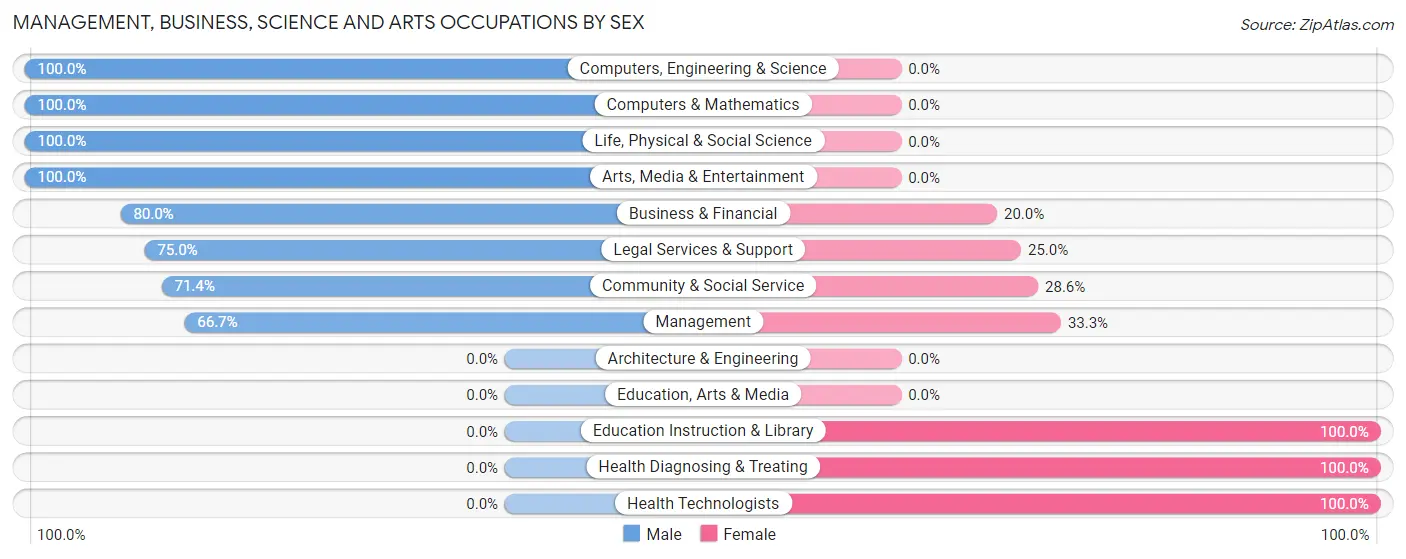
Management, Business, Science and Arts Occupations by Sex
Within the Management, Business, Science and Arts occupations in Jupiter Inlet Colony, the most male-oriented occupations are Computers, Engineering & Science (100.0%), Computers & Mathematics (100.0%), and Life, Physical & Social Science (100.0%), while the most female-oriented occupations are Education Instruction & Library (100.0%), Health Diagnosing & Treating (100.0%), and Health Technologists (100.0%).
| Occupation | Male | Female |
| Management | 14 (66.7%) | 7 (33.3%) |
| Business & Financial | 4 (80.0%) | 1 (20.0%) |
| Computers, Engineering & Science | 3 (100.0%) | 0 (0.0%) |
| Computers & Mathematics | 2 (100.0%) | 0 (0.0%) |
| Architecture & Engineering | 0 (0.0%) | 0 (0.0%) |
| Life, Physical & Social Science | 1 (100.0%) | 0 (0.0%) |
| Community & Social Service | 5 (71.4%) | 2 (28.6%) |
| Education, Arts & Media | 0 (0.0%) | 0 (0.0%) |
| Legal Services & Support | 3 (75.0%) | 1 (25.0%) |
| Education Instruction & Library | 0 (0.0%) | 1 (100.0%) |
| Arts, Media & Entertainment | 2 (100.0%) | 0 (0.0%) |
| Health Diagnosing & Treating | 0 (0.0%) | 8 (100.0%) |
| Health Technologists | 0 (0.0%) | 8 (100.0%) |
| Total (Category) | 26 (59.1%) | 18 (40.9%) |
| Total (Overall) | 91 (67.9%) | 43 (32.1%) |
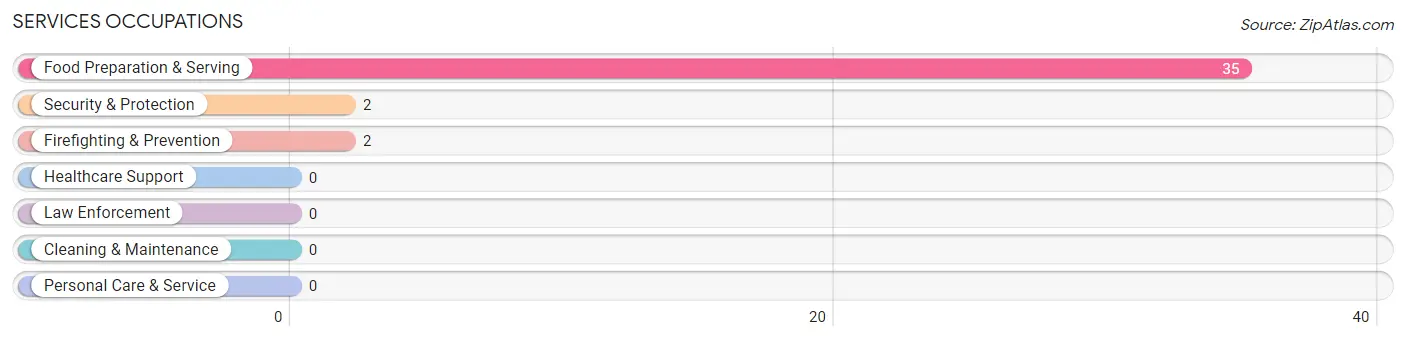
Services Occupations
The most common Services occupations in Jupiter Inlet Colony are Food Preparation & Serving (35 | 26.1%), Security & Protection (2 | 1.5%), and Firefighting & Prevention (2 | 1.5%).
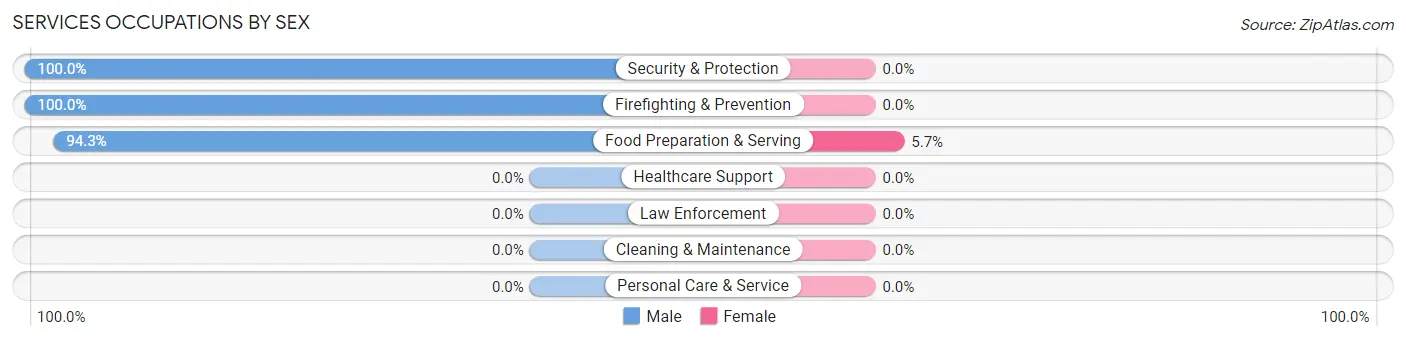
Services Occupations by Sex
| Occupation | Male | Female |
| Healthcare Support | 0 (0.0%) | 0 (0.0%) |
| Security & Protection | 2 (100.0%) | 0 (0.0%) |
| Firefighting & Prevention | 2 (100.0%) | 0 (0.0%) |
| Law Enforcement | 0 (0.0%) | 0 (0.0%) |
| Food Preparation & Serving | 33 (94.3%) | 2 (5.7%) |
| Cleaning & Maintenance | 0 (0.0%) | 0 (0.0%) |
| Personal Care & Service | 0 (0.0%) | 0 (0.0%) |
| Total (Category) | 35 (94.6%) | 2 (5.4%) |
| Total (Overall) | 91 (67.9%) | 43 (32.1%) |
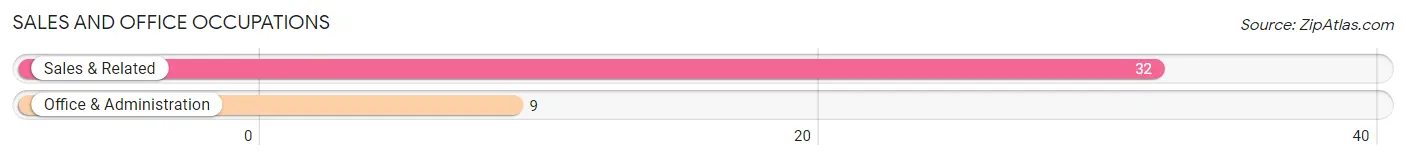
Sales and Office Occupations
The most common Sales and Office occupations in Jupiter Inlet Colony are Sales & Related (32 | 23.9%), and Office & Administration (9 | 6.7%).
Sales and Office Occupations by Sex
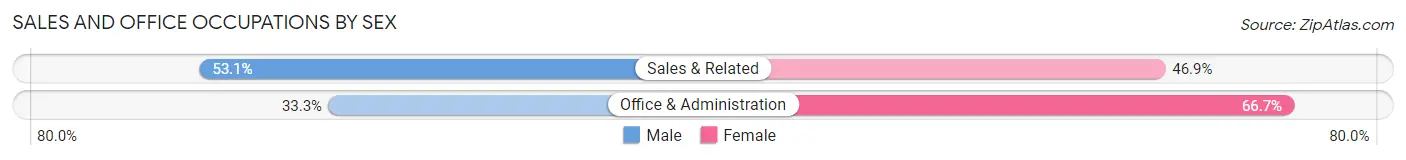
| Occupation | Male | Female |
| Sales & Related | 17 (53.1%) | 15 (46.9%) |
| Office & Administration | 3 (33.3%) | 6 (66.7%) |
| Total (Category) | 20 (48.8%) | 21 (51.2%) |
| Total (Overall) | 91 (67.9%) | 43 (32.1%) |
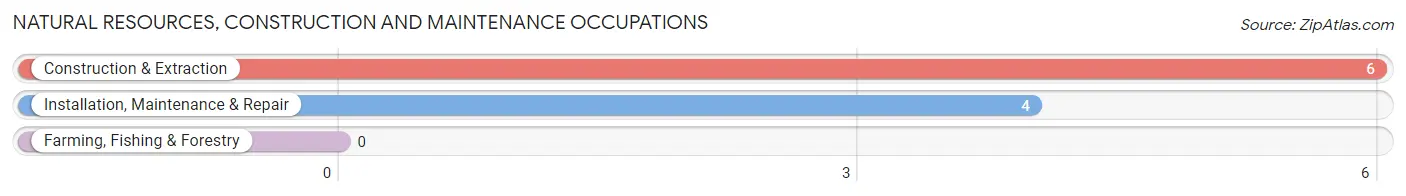
Natural Resources, Construction and Maintenance Occupations
The most common Natural Resources, Construction and Maintenance occupations in Jupiter Inlet Colony are Construction & Extraction (6 | 4.5%), and Installation, Maintenance & Repair (4 | 3.0%).
Natural Resources, Construction and Maintenance Occupations by Sex
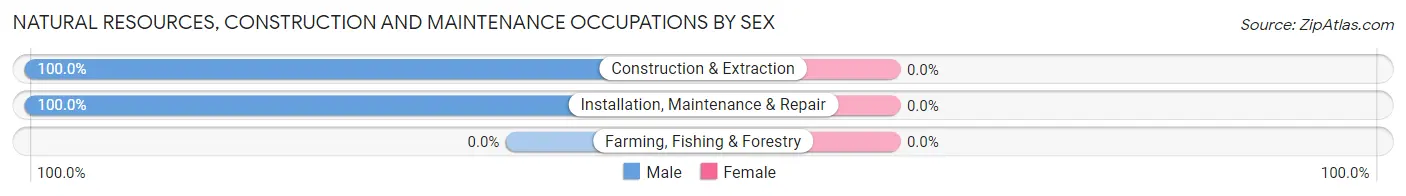
| Occupation | Male | Female |
| Farming, Fishing & Forestry | 0 (0.0%) | 0 (0.0%) |
| Construction & Extraction | 6 (100.0%) | 0 (0.0%) |
| Installation, Maintenance & Repair | 4 (100.0%) | 0 (0.0%) |
| Total (Category) | 10 (100.0%) | 0 (0.0%) |
| Total (Overall) | 91 (67.9%) | 43 (32.1%) |
Production, Transportation and Moving Occupations
The most common Production, Transportation and Moving occupations in Jupiter Inlet Colony are , and Transportation (2 | 1.5%).
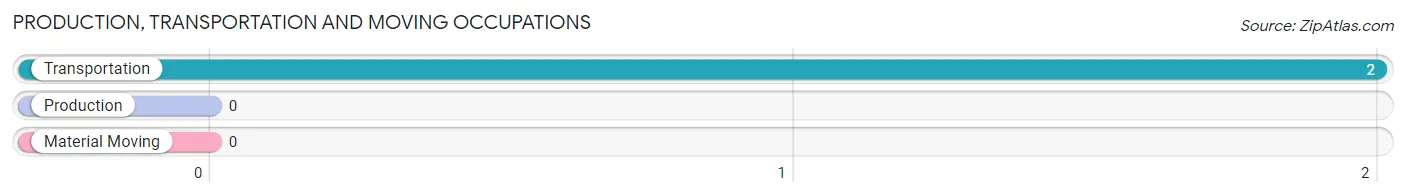
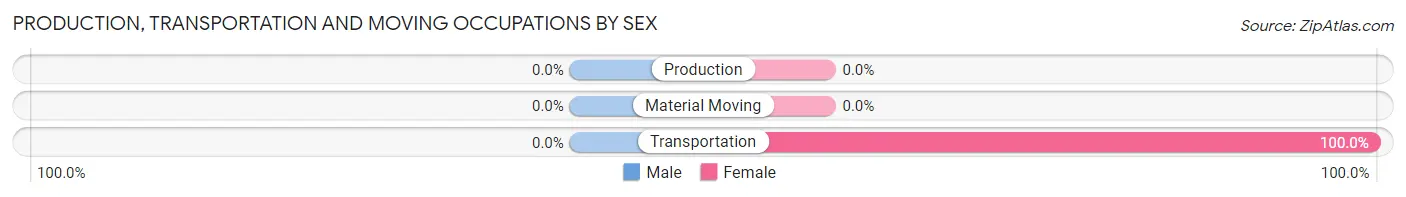
Production, Transportation and Moving Occupations by Sex
| Occupation | Male | Female |
| Production | 0 (0.0%) | 0 (0.0%) |
| Transportation | 0 (0.0%) | 2 (100.0%) |
| Material Moving | 0 (0.0%) | 0 (0.0%) |
| Total (Category) | 0 (0.0%) | 2 (100.0%) |
| Total (Overall) | 91 (67.9%) | 43 (32.1%) |
Employment Industries by Sex in Jupiter Inlet Colony
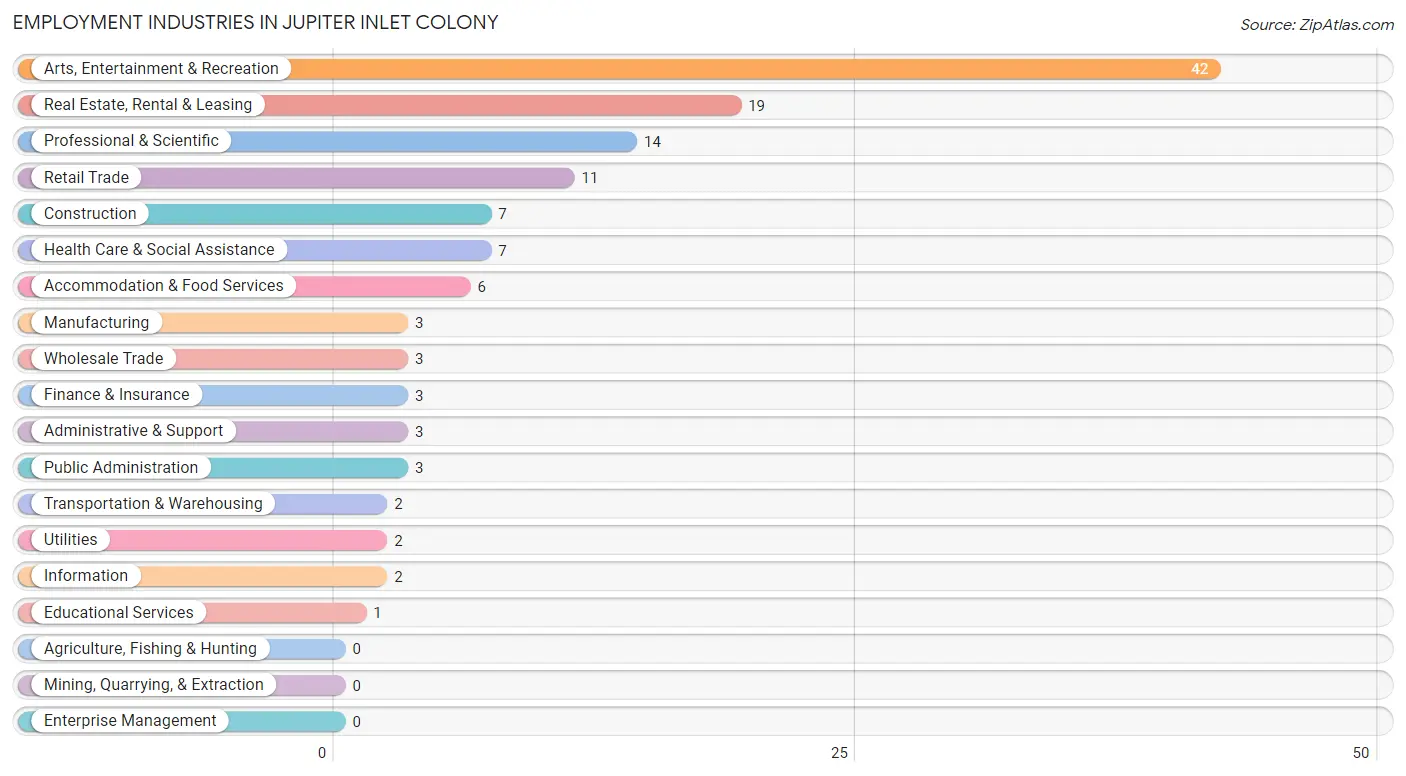
Employment Industries in Jupiter Inlet Colony
The major employment industries in Jupiter Inlet Colony include Arts, Entertainment & Recreation (42 | 31.3%), Real Estate, Rental & Leasing (19 | 14.2%), Professional & Scientific (14 | 10.4%), Retail Trade (11 | 8.2%), and Construction (7 | 5.2%).
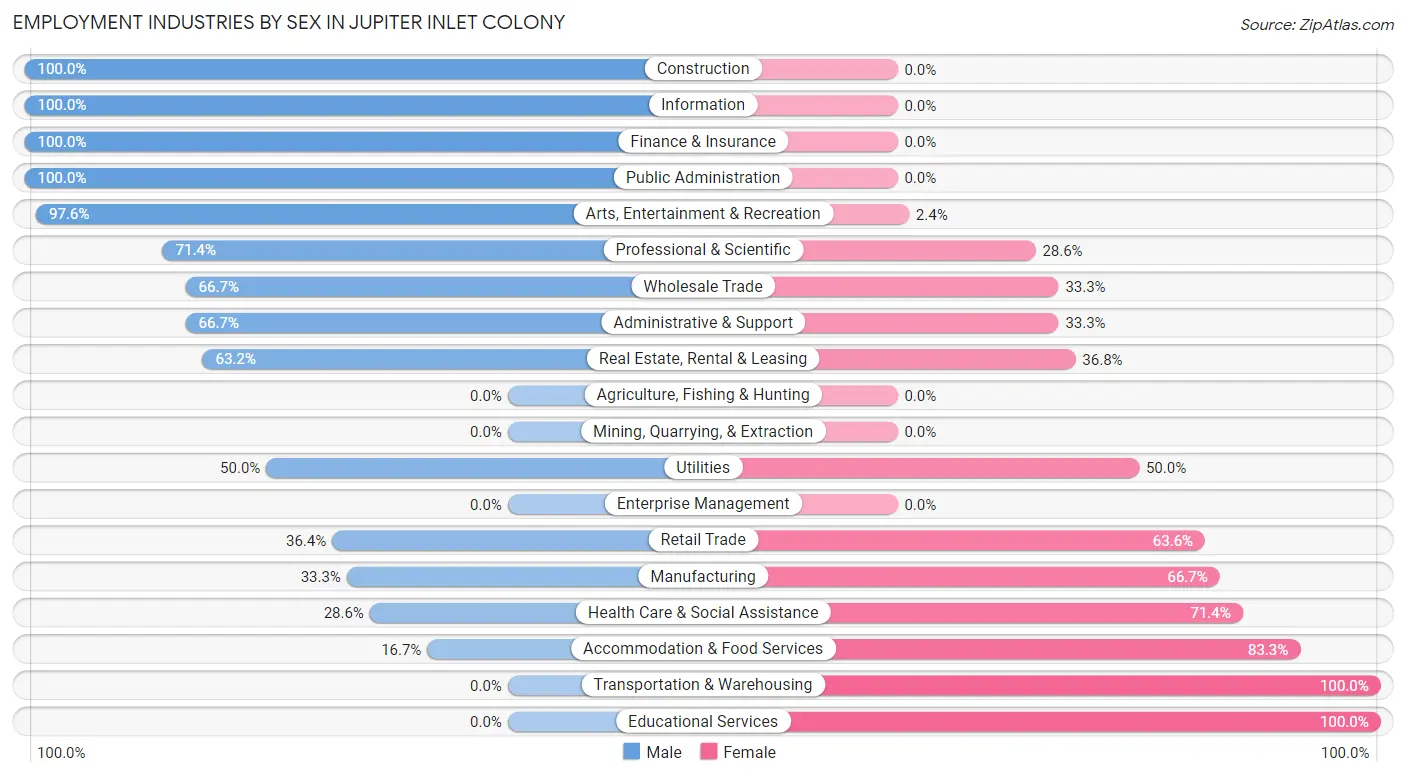
Employment Industries by Sex in Jupiter Inlet Colony
The Jupiter Inlet Colony industries that see more men than women are Construction (100.0%), Information (100.0%), and Finance & Insurance (100.0%), whereas the industries that tend to have a higher number of women are Transportation & Warehousing (100.0%), Educational Services (100.0%), and Accommodation & Food Services (83.3%).
| Industry | Male | Female |
| Agriculture, Fishing & Hunting | 0 (0.0%) | 0 (0.0%) |
| Mining, Quarrying, & Extraction | 0 (0.0%) | 0 (0.0%) |
| Construction | 7 (100.0%) | 0 (0.0%) |
| Manufacturing | 1 (33.3%) | 2 (66.7%) |
| Wholesale Trade | 2 (66.7%) | 1 (33.3%) |
| Retail Trade | 4 (36.4%) | 7 (63.6%) |
| Transportation & Warehousing | 0 (0.0%) | 2 (100.0%) |
| Utilities | 1 (50.0%) | 1 (50.0%) |
| Information | 2 (100.0%) | 0 (0.0%) |
| Finance & Insurance | 3 (100.0%) | 0 (0.0%) |
| Real Estate, Rental & Leasing | 12 (63.2%) | 7 (36.8%) |
| Professional & Scientific | 10 (71.4%) | 4 (28.6%) |
| Enterprise Management | 0 (0.0%) | 0 (0.0%) |
| Administrative & Support | 2 (66.7%) | 1 (33.3%) |
| Educational Services | 0 (0.0%) | 1 (100.0%) |
| Health Care & Social Assistance | 2 (28.6%) | 5 (71.4%) |
| Arts, Entertainment & Recreation | 41 (97.6%) | 1 (2.4%) |
| Accommodation & Food Services | 1 (16.7%) | 5 (83.3%) |
| Public Administration | 3 (100.0%) | 0 (0.0%) |
| Total | 91 (67.9%) | 43 (32.1%) |
Education in Jupiter Inlet Colony
School Enrollment in Jupiter Inlet Colony
The most common levels of schooling among the 123 students in Jupiter Inlet Colony are high school (77 | 62.6%), middle school (37 | 30.1%), and elementary school (6 | 4.9%).
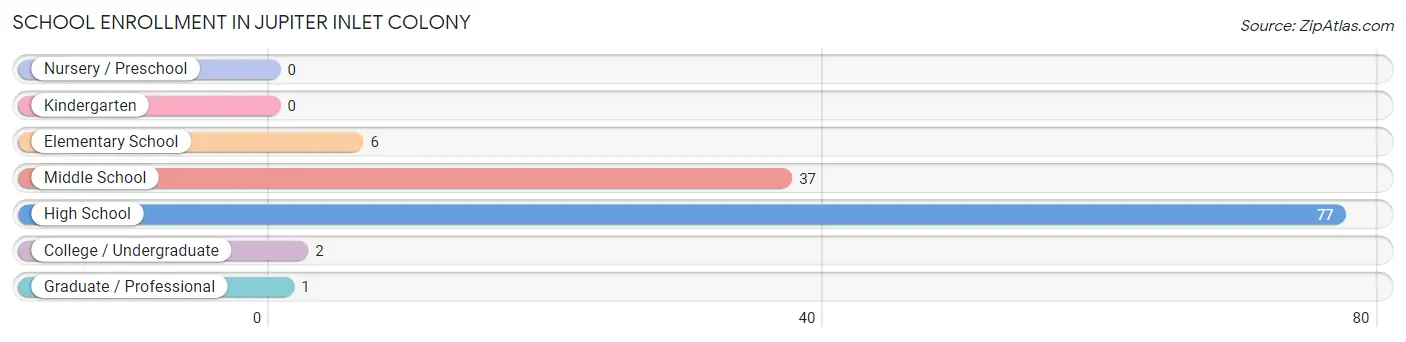
| School Level | # Students | % Students |
| Nursery / Preschool | 0 | 0.0% |
| Kindergarten | 0 | 0.0% |
| Elementary School | 6 | 4.9% |
| Middle School | 37 | 30.1% |
| High School | 77 | 62.6% |
| College / Undergraduate | 2 | 1.6% |
| Graduate / Professional | 1 | 0.8% |
| Total | 123 | 100.0% |
School Enrollment by Age by Funding Source in Jupiter Inlet Colony
Out of a total of 123 students who are enrolled in schools in Jupiter Inlet Colony, 13 (10.6%) attend a private institution, while the remaining 110 (89.4%) are enrolled in public schools. The age group of 5 to 9 year old has the highest likelihood of being enrolled in private schools, with 2 (66.7% in the age bracket) enrolled. Conversely, the age group of 20 to 24 year olds has the lowest likelihood of being enrolled in a private school, with 2 (100.0% in the age bracket) attending a public institution.
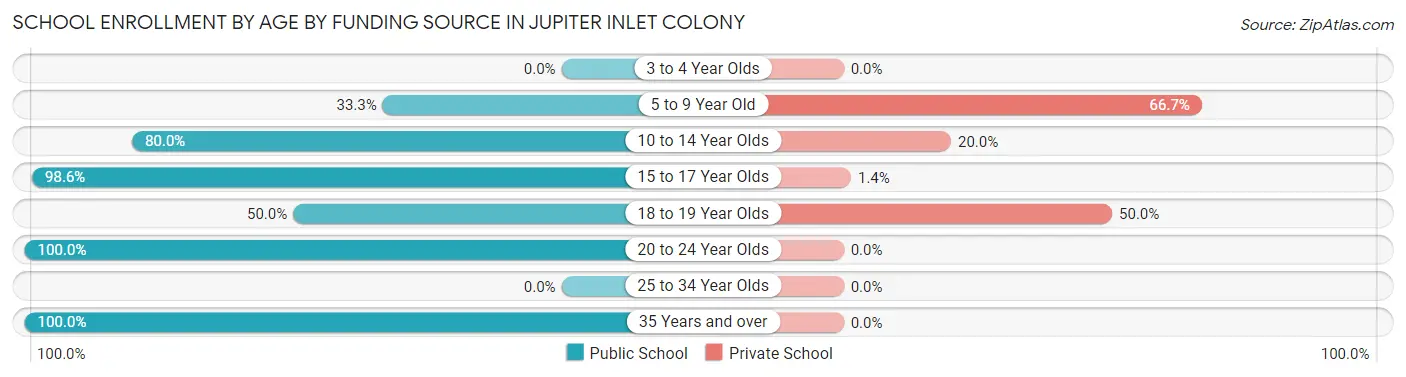
| Age Bracket | Public School | Private School |
| 3 to 4 Year Olds | 0 (0.0%) | 0 (0.0%) |
| 5 to 9 Year Old | 1 (33.3%) | 2 (66.7%) |
| 10 to 14 Year Olds | 32 (80.0%) | 8 (20.0%) |
| 15 to 17 Year Olds | 72 (98.6%) | 1 (1.4%) |
| 18 to 19 Year Olds | 2 (50.0%) | 2 (50.0%) |
| 20 to 24 Year Olds | 2 (100.0%) | 0 (0.0%) |
| 25 to 34 Year Olds | 0 (0.0%) | 0 (0.0%) |
| 35 Years and over | 1 (100.0%) | 0 (0.0%) |
| Total | 110 (89.4%) | 13 (10.6%) |
Educational Attainment by Field of Study in Jupiter Inlet Colony
Business (60 | 20.5%), psychology (38 | 13.0%), social sciences (38 | 13.0%), science & technology (31 | 10.6%), and arts & humanities (30 | 10.2%) are the most common fields of study among 293 individuals in Jupiter Inlet Colony who have obtained a bachelor's degree or higher.
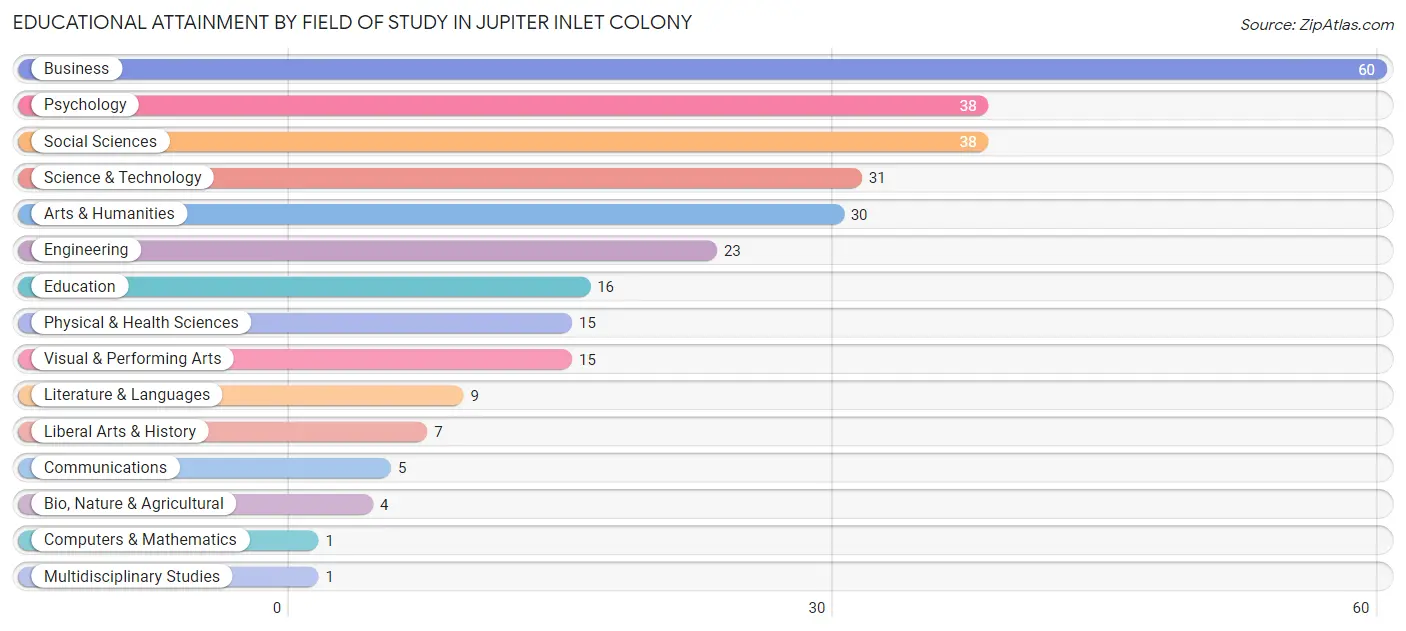
| Field of Study | # Graduates | % Graduates |
| Computers & Mathematics | 1 | 0.3% |
| Bio, Nature & Agricultural | 4 | 1.4% |
| Physical & Health Sciences | 15 | 5.1% |
| Psychology | 38 | 13.0% |
| Social Sciences | 38 | 13.0% |
| Engineering | 23 | 7.9% |
| Multidisciplinary Studies | 1 | 0.3% |
| Science & Technology | 31 | 10.6% |
| Business | 60 | 20.5% |
| Education | 16 | 5.5% |
| Literature & Languages | 9 | 3.1% |
| Liberal Arts & History | 7 | 2.4% |
| Visual & Performing Arts | 15 | 5.1% |
| Communications | 5 | 1.7% |
| Arts & Humanities | 30 | 10.2% |
| Total | 293 | 100.0% |
Transportation & Commute in Jupiter Inlet Colony
Vehicle Availability by Sex in Jupiter Inlet Colony
The most prevalent vehicle ownership categories in Jupiter Inlet Colony are males with 4 vehicles (38, accounting for 41.8%) and females with 4 vehicles (3, making up 88.4%).
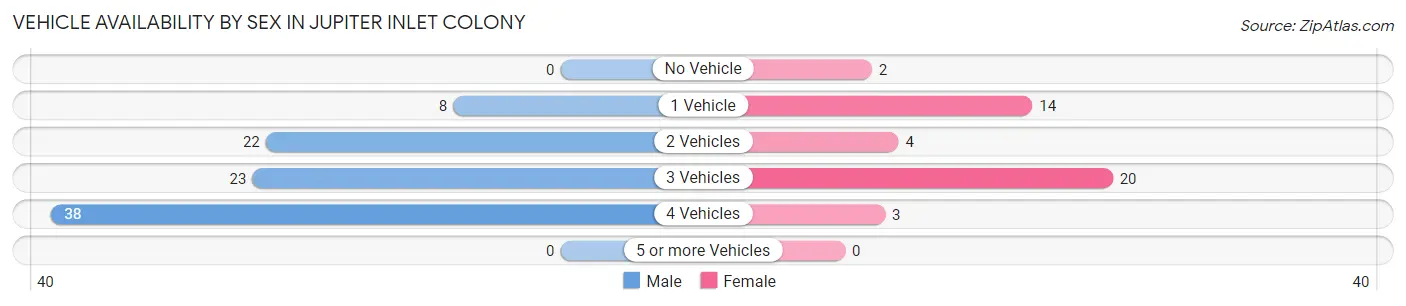
| Vehicles Available | Male | Female |
| No Vehicle | 0 (0.0%) | 2 (4.6%) |
| 1 Vehicle | 8 (8.8%) | 14 (32.6%) |
| 2 Vehicles | 22 (24.2%) | 4 (9.3%) |
| 3 Vehicles | 23 (25.3%) | 20 (46.5%) |
| 4 Vehicles | 38 (41.8%) | 3 (7.0%) |
| 5 or more Vehicles | 0 (0.0%) | 0 (0.0%) |
| Total | 91 (100.0%) | 43 (100.0%) |
Commute Time in Jupiter Inlet Colony
The most frequently occuring commute durations in Jupiter Inlet Colony are 30 to 34 minutes (17 commuters, 31.5%), 15 to 19 minutes (13 commuters, 24.1%), and 20 to 24 minutes (10 commuters, 18.5%).
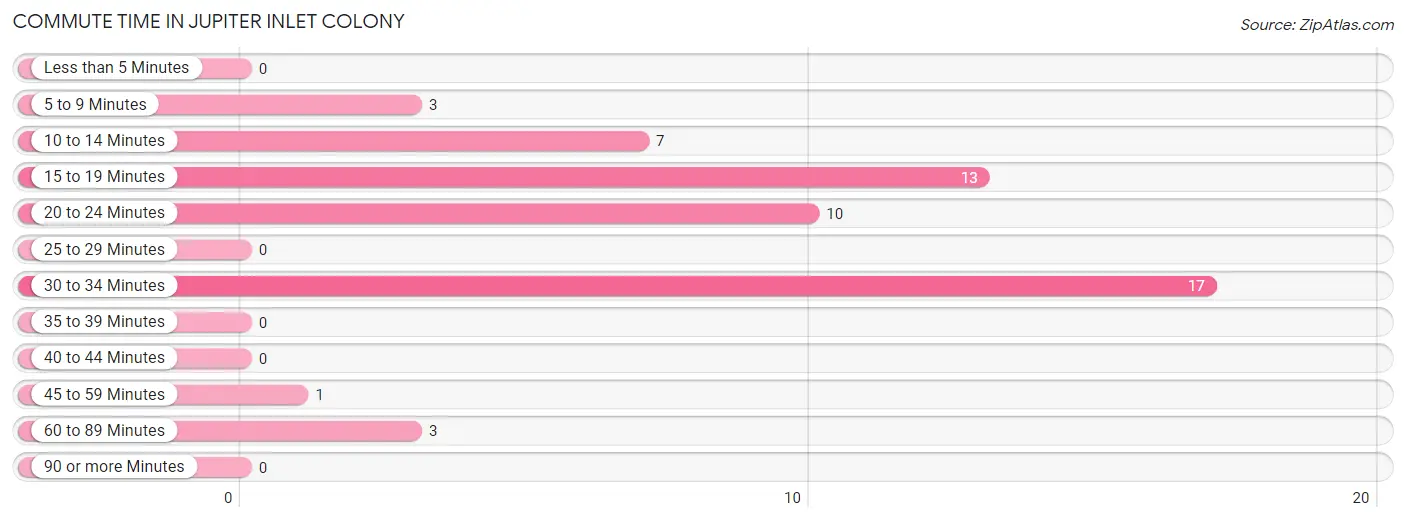
| Commute Time | # Commuters | % Commuters |
| Less than 5 Minutes | 0 | 0.0% |
| 5 to 9 Minutes | 3 | 5.6% |
| 10 to 14 Minutes | 7 | 13.0% |
| 15 to 19 Minutes | 13 | 24.1% |
| 20 to 24 Minutes | 10 | 18.5% |
| 25 to 29 Minutes | 0 | 0.0% |
| 30 to 34 Minutes | 17 | 31.5% |
| 35 to 39 Minutes | 0 | 0.0% |
| 40 to 44 Minutes | 0 | 0.0% |
| 45 to 59 Minutes | 1 | 1.8% |
| 60 to 89 Minutes | 3 | 5.6% |
| 90 or more Minutes | 0 | 0.0% |
Commute Time by Sex in Jupiter Inlet Colony
The most common commute times in Jupiter Inlet Colony are 15 to 19 minutes (9 commuters, 27.3%) for males and 30 to 34 minutes (13 commuters, 61.9%) for females.
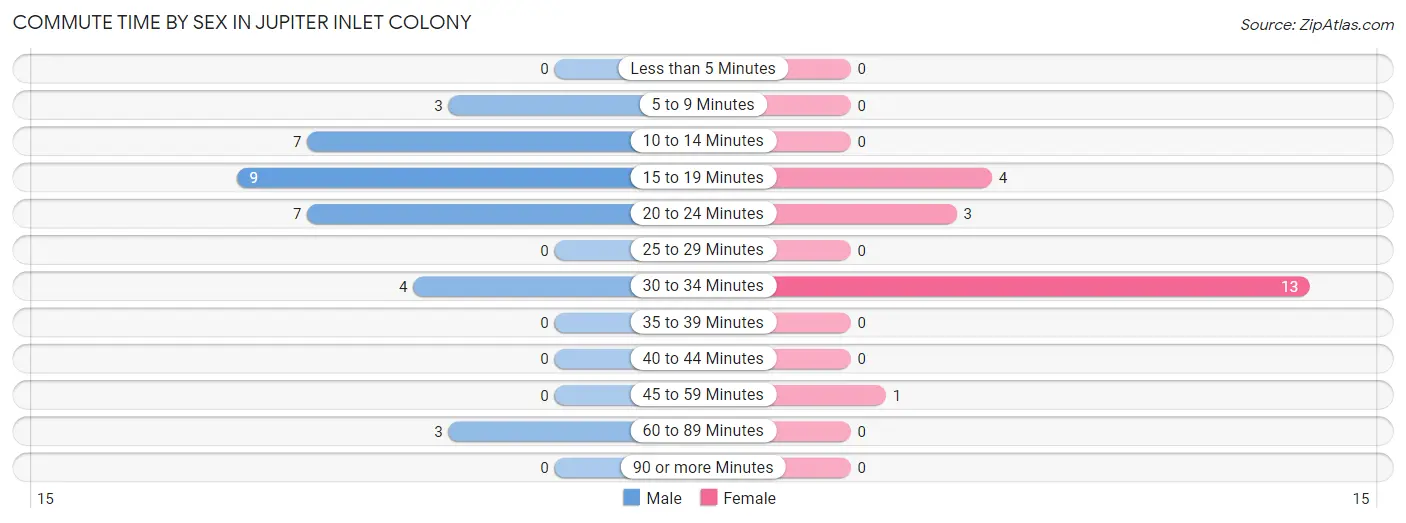
| Commute Time | Male | Female |
| Less than 5 Minutes | 0 (0.0%) | 0 (0.0%) |
| 5 to 9 Minutes | 3 (9.1%) | 0 (0.0%) |
| 10 to 14 Minutes | 7 (21.2%) | 0 (0.0%) |
| 15 to 19 Minutes | 9 (27.3%) | 4 (19.1%) |
| 20 to 24 Minutes | 7 (21.2%) | 3 (14.3%) |
| 25 to 29 Minutes | 0 (0.0%) | 0 (0.0%) |
| 30 to 34 Minutes | 4 (12.1%) | 13 (61.9%) |
| 35 to 39 Minutes | 0 (0.0%) | 0 (0.0%) |
| 40 to 44 Minutes | 0 (0.0%) | 0 (0.0%) |
| 45 to 59 Minutes | 0 (0.0%) | 1 (4.8%) |
| 60 to 89 Minutes | 3 (9.1%) | 0 (0.0%) |
| 90 or more Minutes | 0 (0.0%) | 0 (0.0%) |
Time of Departure to Work by Sex in Jupiter Inlet Colony
The most frequent times of departure to work in Jupiter Inlet Colony are 8:30 AM to 8:59 AM (10, 30.3%) for males and 9:00 AM to 9:59 AM (7, 33.3%) for females.
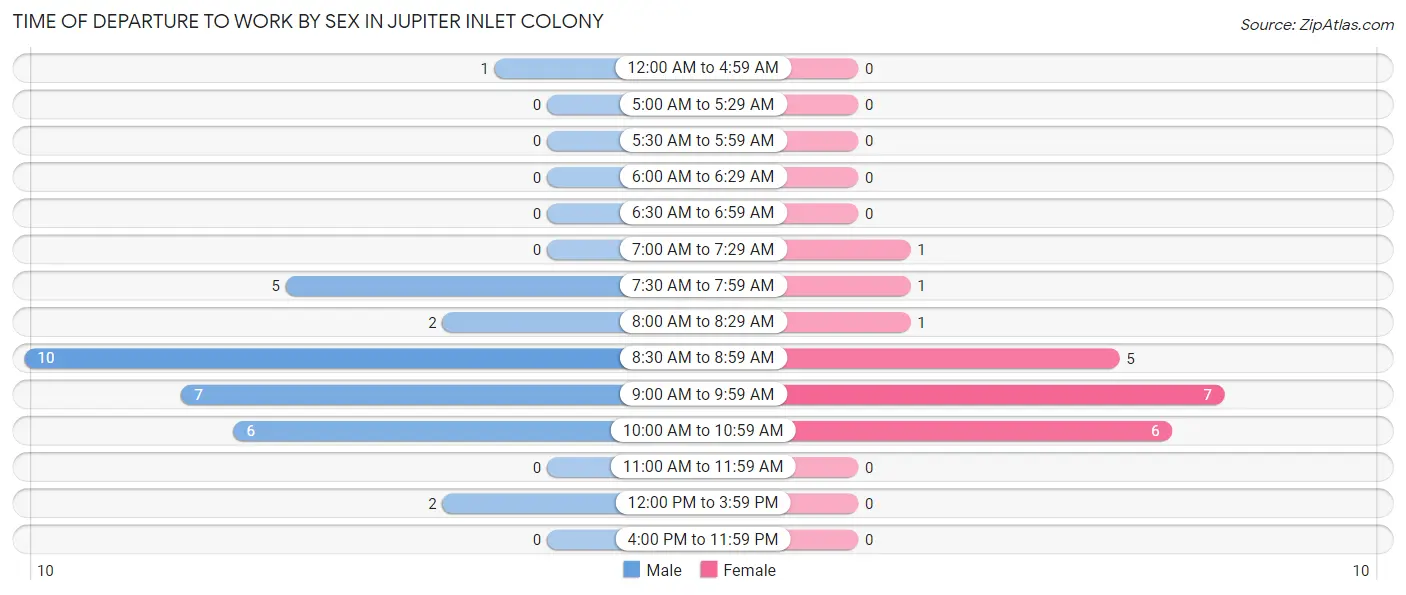
| Time of Departure | Male | Female |
| 12:00 AM to 4:59 AM | 1 (3.0%) | 0 (0.0%) |
| 5:00 AM to 5:29 AM | 0 (0.0%) | 0 (0.0%) |
| 5:30 AM to 5:59 AM | 0 (0.0%) | 0 (0.0%) |
| 6:00 AM to 6:29 AM | 0 (0.0%) | 0 (0.0%) |
| 6:30 AM to 6:59 AM | 0 (0.0%) | 0 (0.0%) |
| 7:00 AM to 7:29 AM | 0 (0.0%) | 1 (4.8%) |
| 7:30 AM to 7:59 AM | 5 (15.1%) | 1 (4.8%) |
| 8:00 AM to 8:29 AM | 2 (6.1%) | 1 (4.8%) |
| 8:30 AM to 8:59 AM | 10 (30.3%) | 5 (23.8%) |
| 9:00 AM to 9:59 AM | 7 (21.2%) | 7 (33.3%) |
| 10:00 AM to 10:59 AM | 6 (18.2%) | 6 (28.6%) |
| 11:00 AM to 11:59 AM | 0 (0.0%) | 0 (0.0%) |
| 12:00 PM to 3:59 PM | 2 (6.1%) | 0 (0.0%) |
| 4:00 PM to 11:59 PM | 0 (0.0%) | 0 (0.0%) |
| Total | 33 (100.0%) | 21 (100.0%) |
Housing Occupancy in Jupiter Inlet Colony
Occupancy by Ownership in Jupiter Inlet Colony
Of the total 192 dwellings in Jupiter Inlet Colony, owner-occupied units account for 181 (94.3%), while renter-occupied units make up 11 (5.7%).
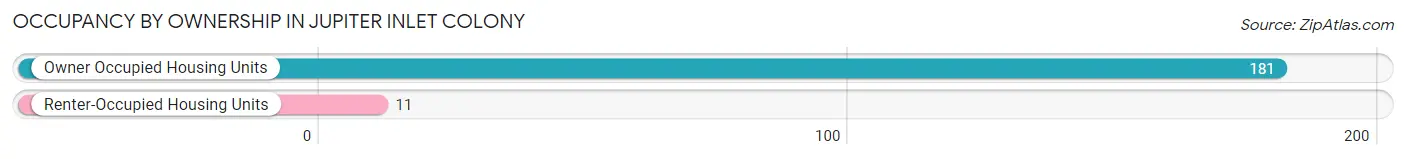
| Occupancy | # Housing Units | % Housing Units |
| Owner Occupied Housing Units | 181 | 94.3% |
| Renter-Occupied Housing Units | 11 | 5.7% |
| Total Occupied Housing Units | 192 | 100.0% |
Occupancy by Household Size in Jupiter Inlet Colony
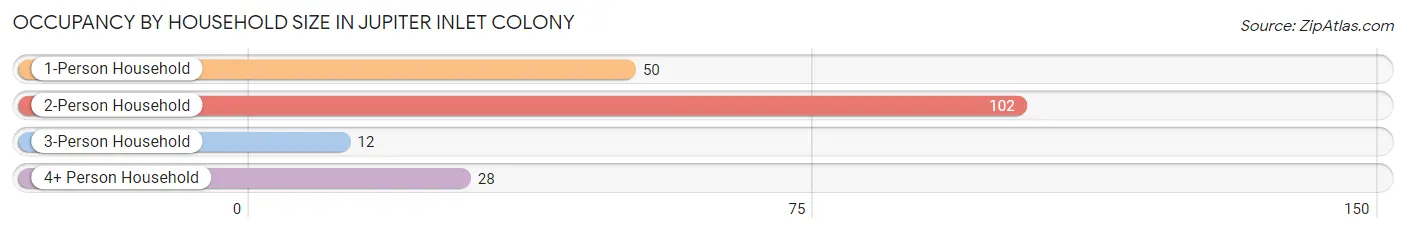
| Household Size | # Housing Units | % Housing Units |
| 1-Person Household | 50 | 26.0% |
| 2-Person Household | 102 | 53.1% |
| 3-Person Household | 12 | 6.2% |
| 4+ Person Household | 28 | 14.6% |
| Total Housing Units | 192 | 100.0% |
Occupancy by Ownership by Household Size in Jupiter Inlet Colony
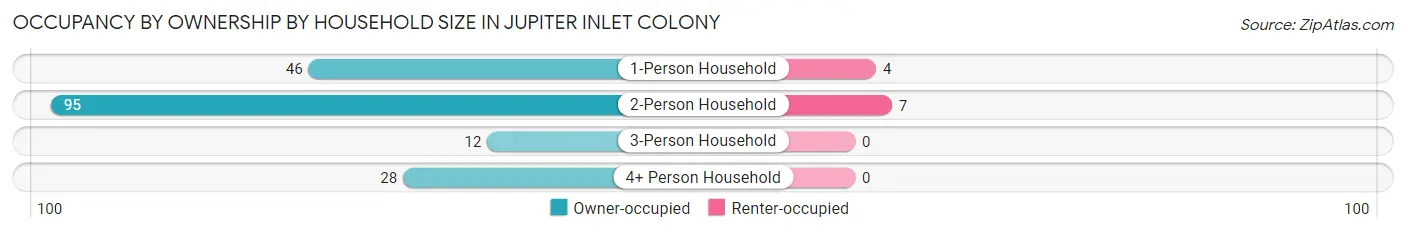
| Household Size | Owner-occupied | Renter-occupied |
| 1-Person Household | 46 (92.0%) | 4 (8.0%) |
| 2-Person Household | 95 (93.1%) | 7 (6.9%) |
| 3-Person Household | 12 (100.0%) | 0 (0.0%) |
| 4+ Person Household | 28 (100.0%) | 0 (0.0%) |
| Total Housing Units | 181 (94.3%) | 11 (5.7%) |
Occupancy by Educational Attainment in Jupiter Inlet Colony
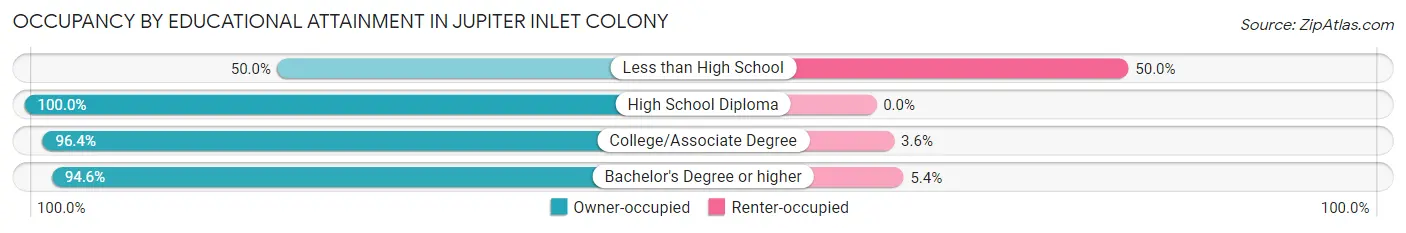
| Household Size | Owner-occupied | Renter-occupied |
| Less than High School | 2 (50.0%) | 2 (50.0%) |
| High School Diploma | 12 (100.0%) | 0 (0.0%) |
| College/Associate Degree | 27 (96.4%) | 1 (3.6%) |
| Bachelor's Degree or higher | 140 (94.6%) | 8 (5.4%) |
Occupancy by Age of Householder in Jupiter Inlet Colony
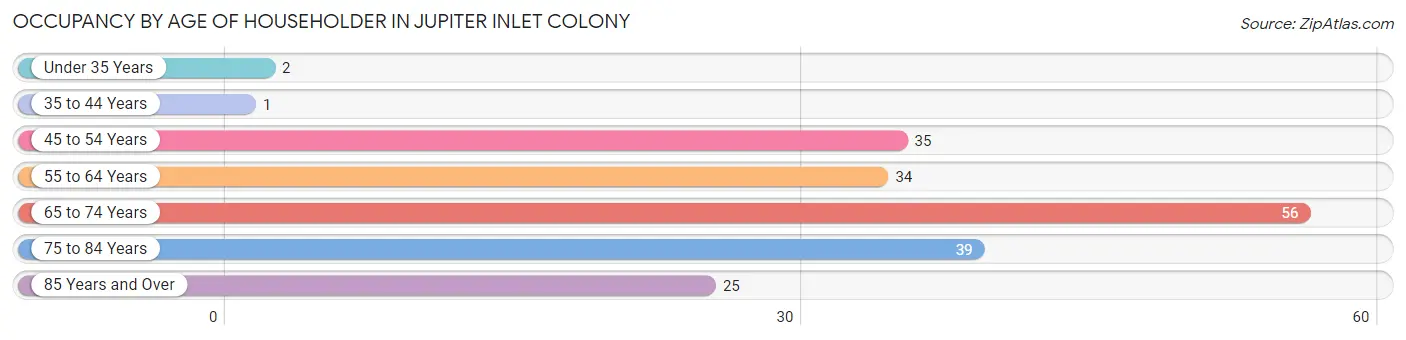
| Age Bracket | # Households | % Households |
| Under 35 Years | 2 | 1.0% |
| 35 to 44 Years | 1 | 0.5% |
| 45 to 54 Years | 35 | 18.2% |
| 55 to 64 Years | 34 | 17.7% |
| 65 to 74 Years | 56 | 29.2% |
| 75 to 84 Years | 39 | 20.3% |
| 85 Years and Over | 25 | 13.0% |
| Total | 192 | 100.0% |
Housing Finances in Jupiter Inlet Colony
Median Income by Occupancy in Jupiter Inlet Colony
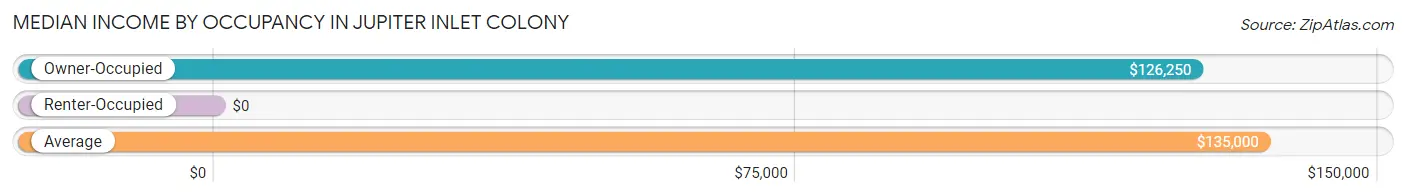
| Occupancy Type | # Households | Median Income |
| Owner-Occupied | 181 (94.3%) | $126,250 |
| Renter-Occupied | 11 (5.7%) | $0 |
| Average | 192 (100.0%) | $135,000 |
Occupancy by Householder Income Bracket in Jupiter Inlet Colony
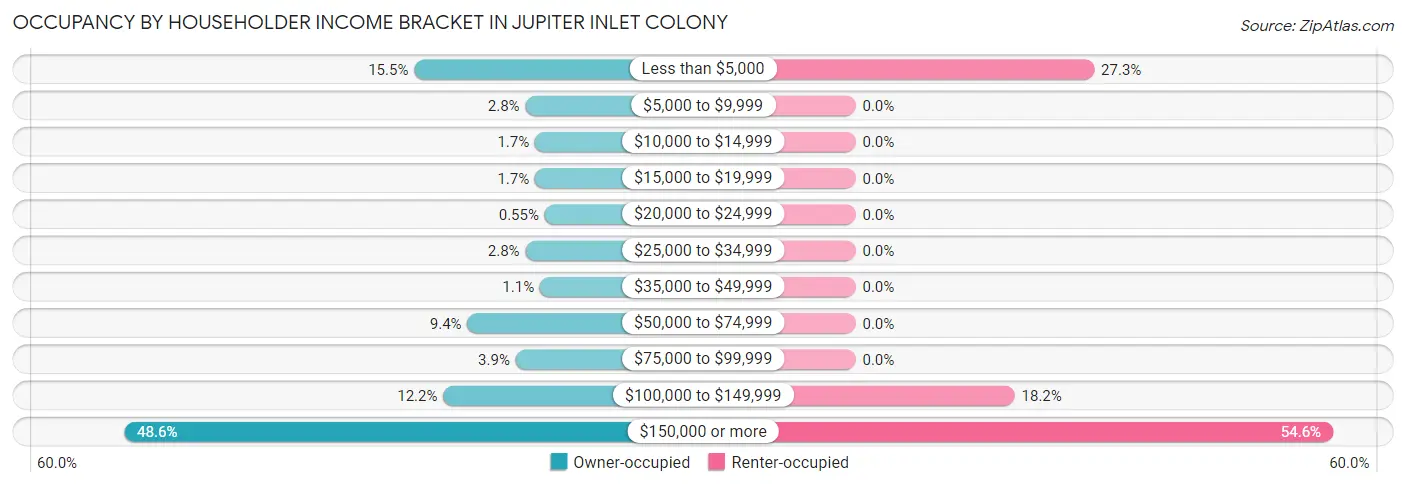
| Income Bracket | Owner-occupied | Renter-occupied |
| Less than $5,000 | 28 (15.5%) | 3 (27.3%) |
| $5,000 to $9,999 | 5 (2.8%) | 0 (0.0%) |
| $10,000 to $14,999 | 3 (1.7%) | 0 (0.0%) |
| $15,000 to $19,999 | 3 (1.7%) | 0 (0.0%) |
| $20,000 to $24,999 | 1 (0.5%) | 0 (0.0%) |
| $25,000 to $34,999 | 5 (2.8%) | 0 (0.0%) |
| $35,000 to $49,999 | 2 (1.1%) | 0 (0.0%) |
| $50,000 to $74,999 | 17 (9.4%) | 0 (0.0%) |
| $75,000 to $99,999 | 7 (3.9%) | 0 (0.0%) |
| $100,000 to $149,999 | 22 (12.1%) | 2 (18.2%) |
| $150,000 or more | 88 (48.6%) | 6 (54.5%) |
| Total | 181 (100.0%) | 11 (100.0%) |
Monthly Housing Cost Tiers in Jupiter Inlet Colony
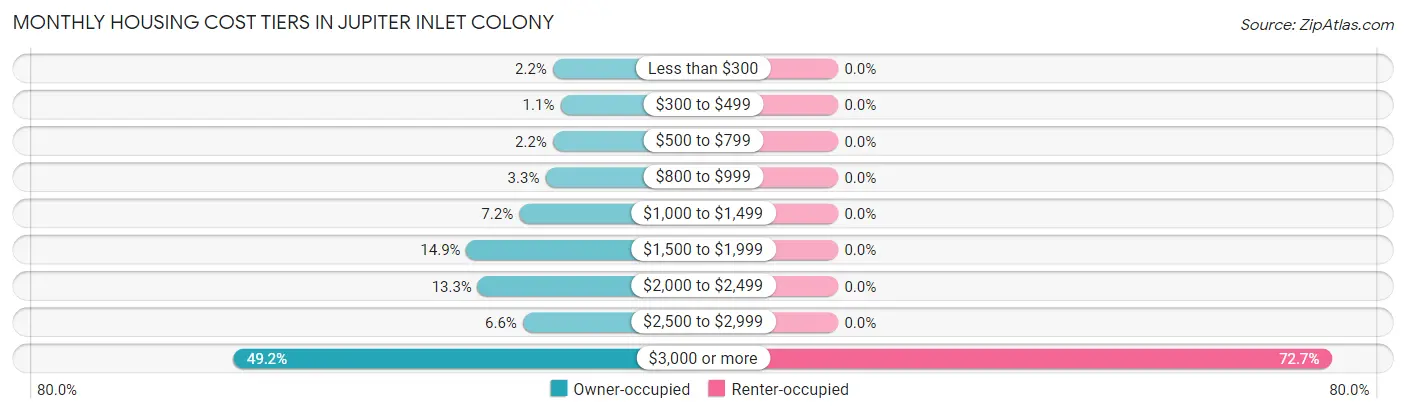
| Monthly Cost | Owner-occupied | Renter-occupied |
| Less than $300 | 4 (2.2%) | 0 (0.0%) |
| $300 to $499 | 2 (1.1%) | 0 (0.0%) |
| $500 to $799 | 4 (2.2%) | 0 (0.0%) |
| $800 to $999 | 6 (3.3%) | 0 (0.0%) |
| $1,000 to $1,499 | 13 (7.2%) | 0 (0.0%) |
| $1,500 to $1,999 | 27 (14.9%) | 0 (0.0%) |
| $2,000 to $2,499 | 24 (13.3%) | 0 (0.0%) |
| $2,500 to $2,999 | 12 (6.6%) | 0 (0.0%) |
| $3,000 or more | 89 (49.2%) | 8 (72.7%) |
| Total | 181 (100.0%) | 11 (100.0%) |
Physical Housing Characteristics in Jupiter Inlet Colony
Housing Structures in Jupiter Inlet Colony
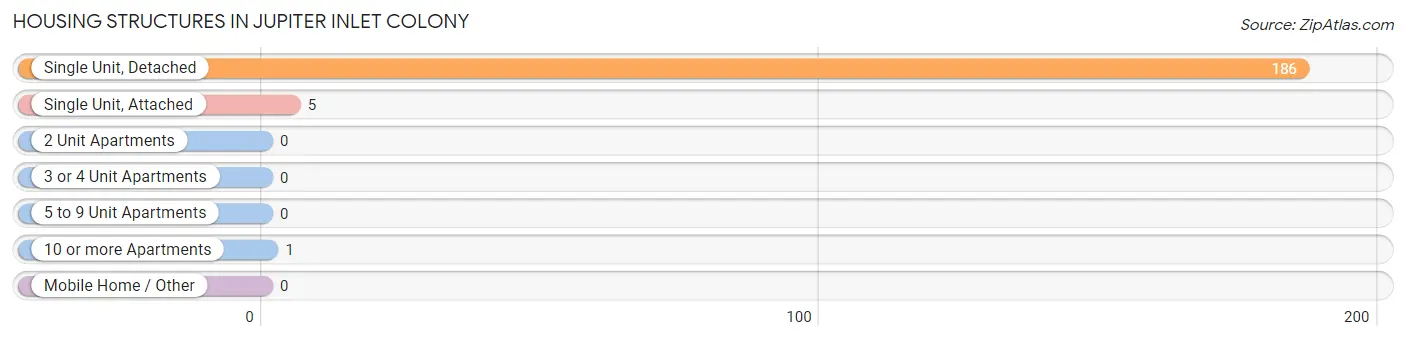
| Structure Type | # Housing Units | % Housing Units |
| Single Unit, Detached | 186 | 96.9% |
| Single Unit, Attached | 5 | 2.6% |
| 2 Unit Apartments | 0 | 0.0% |
| 3 or 4 Unit Apartments | 0 | 0.0% |
| 5 to 9 Unit Apartments | 0 | 0.0% |
| 10 or more Apartments | 1 | 0.5% |
| Mobile Home / Other | 0 | 0.0% |
| Total | 192 | 100.0% |
Housing Structures by Occupancy in Jupiter Inlet Colony
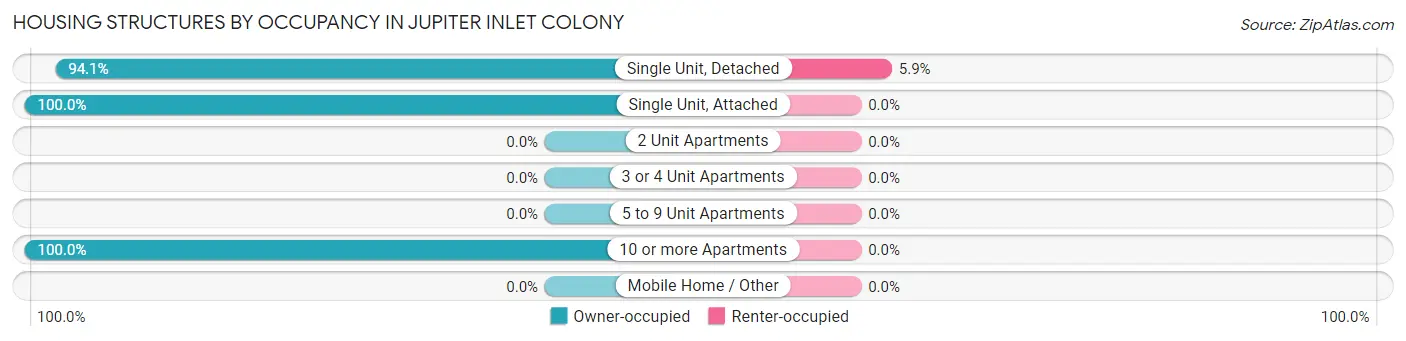
| Structure Type | Owner-occupied | Renter-occupied |
| Single Unit, Detached | 175 (94.1%) | 11 (5.9%) |
| Single Unit, Attached | 5 (100.0%) | 0 (0.0%) |
| 2 Unit Apartments | 0 (0.0%) | 0 (0.0%) |
| 3 or 4 Unit Apartments | 0 (0.0%) | 0 (0.0%) |
| 5 to 9 Unit Apartments | 0 (0.0%) | 0 (0.0%) |
| 10 or more Apartments | 1 (100.0%) | 0 (0.0%) |
| Mobile Home / Other | 0 (0.0%) | 0 (0.0%) |
| Total | 181 (94.3%) | 11 (5.7%) |
Housing Structures by Number of Rooms in Jupiter Inlet Colony
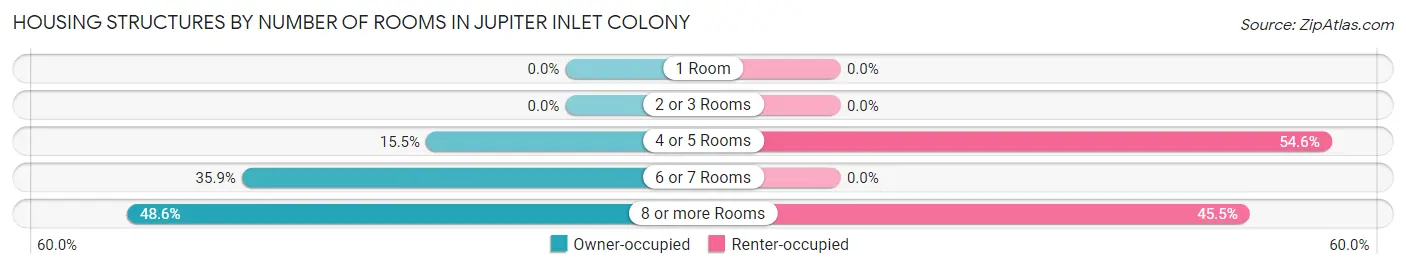
| Number of Rooms | Owner-occupied | Renter-occupied |
| 1 Room | 0 (0.0%) | 0 (0.0%) |
| 2 or 3 Rooms | 0 (0.0%) | 0 (0.0%) |
| 4 or 5 Rooms | 28 (15.5%) | 6 (54.5%) |
| 6 or 7 Rooms | 65 (35.9%) | 0 (0.0%) |
| 8 or more Rooms | 88 (48.6%) | 5 (45.5%) |
| Total | 181 (100.0%) | 11 (100.0%) |
Housing Structure by Heating Type in Jupiter Inlet Colony
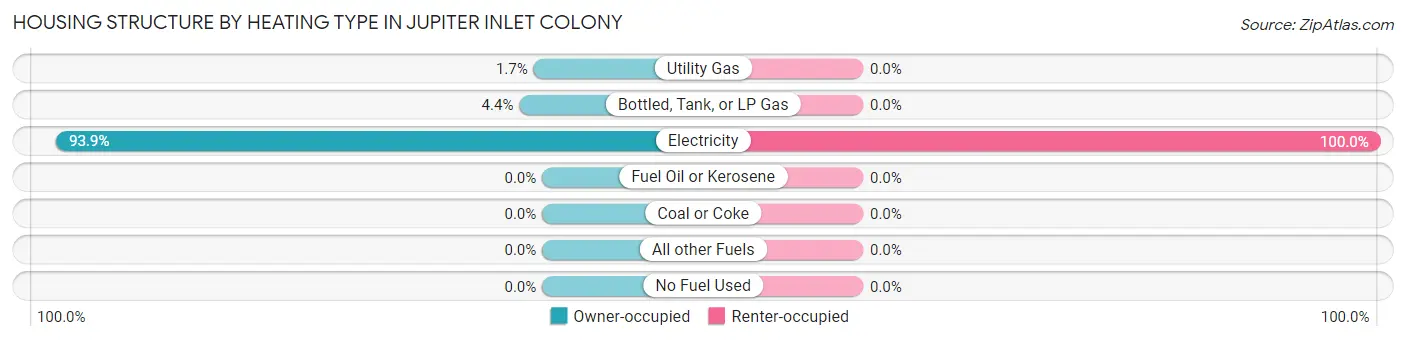
| Heating Type | Owner-occupied | Renter-occupied |
| Utility Gas | 3 (1.7%) | 0 (0.0%) |
| Bottled, Tank, or LP Gas | 8 (4.4%) | 0 (0.0%) |
| Electricity | 170 (93.9%) | 11 (100.0%) |
| Fuel Oil or Kerosene | 0 (0.0%) | 0 (0.0%) |
| Coal or Coke | 0 (0.0%) | 0 (0.0%) |
| All other Fuels | 0 (0.0%) | 0 (0.0%) |
| No Fuel Used | 0 (0.0%) | 0 (0.0%) |
| Total | 181 (100.0%) | 11 (100.0%) |
Household Vehicle Usage in Jupiter Inlet Colony
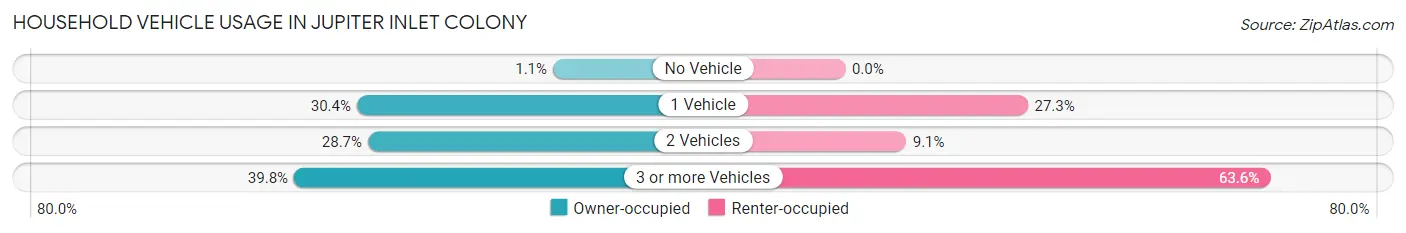
| Vehicles per Household | Owner-occupied | Renter-occupied |
| No Vehicle | 2 (1.1%) | 0 (0.0%) |
| 1 Vehicle | 55 (30.4%) | 3 (27.3%) |
| 2 Vehicles | 52 (28.7%) | 1 (9.1%) |
| 3 or more Vehicles | 72 (39.8%) | 7 (63.6%) |
| Total | 181 (100.0%) | 11 (100.0%) |
Real Estate & Mortgages in Jupiter Inlet Colony
Real Estate and Mortgage Overview in Jupiter Inlet Colony
| Characteristic | Without Mortgage | With Mortgage |
| Housing Units | 107 | 74 |
| Median Property Value | $2,000,001 | $2,000,001 |
| Median Household Income | $146,250 | $35 |
| Monthly Housing Costs | $1,501 | $67 |
| Real Estate Taxes | $10,001 | $2 |
Property Value by Mortgage Status in Jupiter Inlet Colony
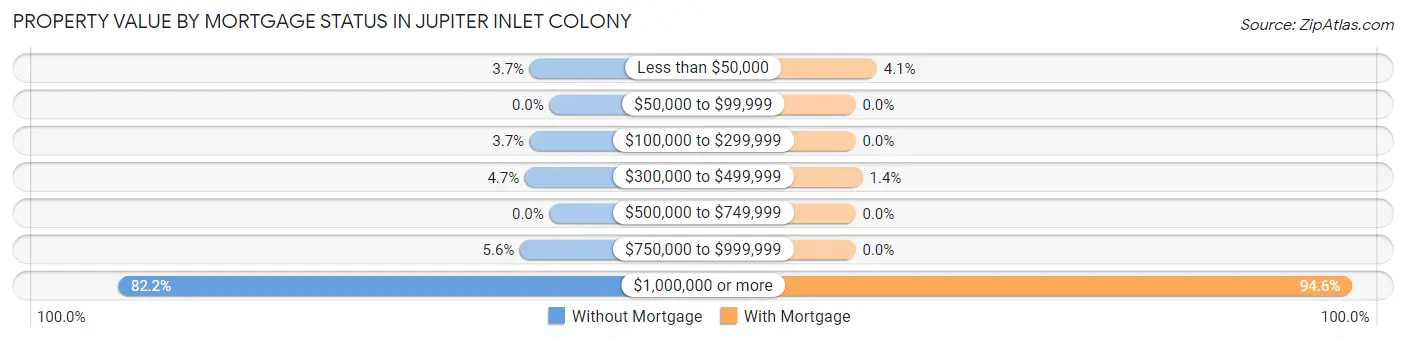
| Property Value | Without Mortgage | With Mortgage |
| Less than $50,000 | 4 (3.7%) | 3 (4.1%) |
| $50,000 to $99,999 | 0 (0.0%) | 0 (0.0%) |
| $100,000 to $299,999 | 4 (3.7%) | 0 (0.0%) |
| $300,000 to $499,999 | 5 (4.7%) | 1 (1.3%) |
| $500,000 to $749,999 | 0 (0.0%) | 0 (0.0%) |
| $750,000 to $999,999 | 6 (5.6%) | 0 (0.0%) |
| $1,000,000 or more | 88 (82.2%) | 70 (94.6%) |
| Total | 107 (100.0%) | 74 (100.0%) |
Household Income by Mortgage Status in Jupiter Inlet Colony
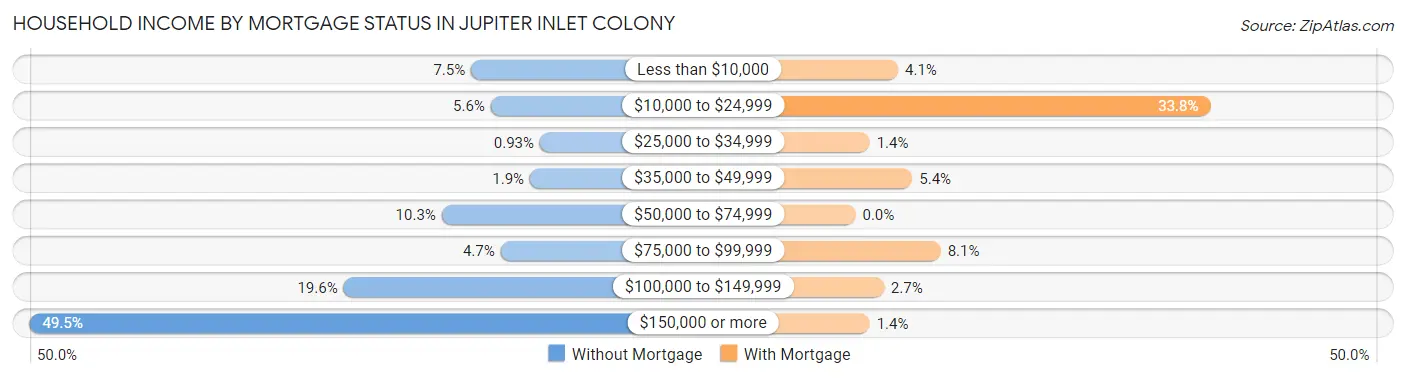
| Household Income | Without Mortgage | With Mortgage |
| Less than $10,000 | 8 (7.5%) | 3 (4.1%) |
| $10,000 to $24,999 | 6 (5.6%) | 25 (33.8%) |
| $25,000 to $34,999 | 1 (0.9%) | 1 (1.3%) |
| $35,000 to $49,999 | 2 (1.9%) | 4 (5.4%) |
| $50,000 to $74,999 | 11 (10.3%) | 0 (0.0%) |
| $75,000 to $99,999 | 5 (4.7%) | 6 (8.1%) |
| $100,000 to $149,999 | 21 (19.6%) | 2 (2.7%) |
| $150,000 or more | 53 (49.5%) | 1 (1.3%) |
| Total | 107 (100.0%) | 74 (100.0%) |
Property Value to Household Income Ratio in Jupiter Inlet Colony
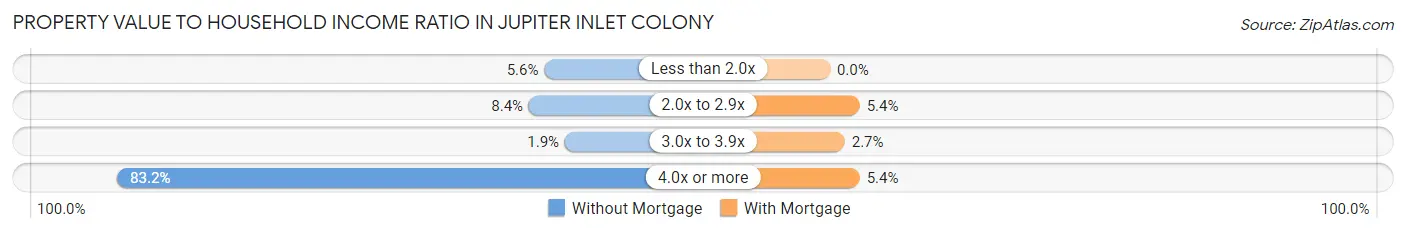
| Value-to-Income Ratio | Without Mortgage | With Mortgage |
| Less than 2.0x | 6 (5.6%) | 0 (0.0%) |
| 2.0x to 2.9x | 9 (8.4%) | 4 (5.4%) |
| 3.0x to 3.9x | 2 (1.9%) | 2 (2.7%) |
| 4.0x or more | 89 (83.2%) | 4 (5.4%) |
| Total | 107 (100.0%) | 74 (100.0%) |
Real Estate Taxes by Mortgage Status in Jupiter Inlet Colony
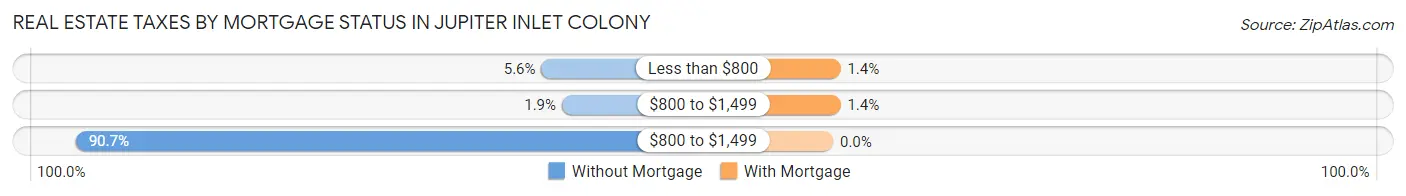
| Property Taxes | Without Mortgage | With Mortgage |
| Less than $800 | 6 (5.6%) | 1 (1.3%) |
| $800 to $1,499 | 2 (1.9%) | 1 (1.3%) |
| $800 to $1,499 | 97 (90.6%) | 0 (0.0%) |
| Total | 107 (100.0%) | 74 (100.0%) |
Health & Disability in Jupiter Inlet Colony
Health Insurance Coverage by Age in Jupiter Inlet Colony
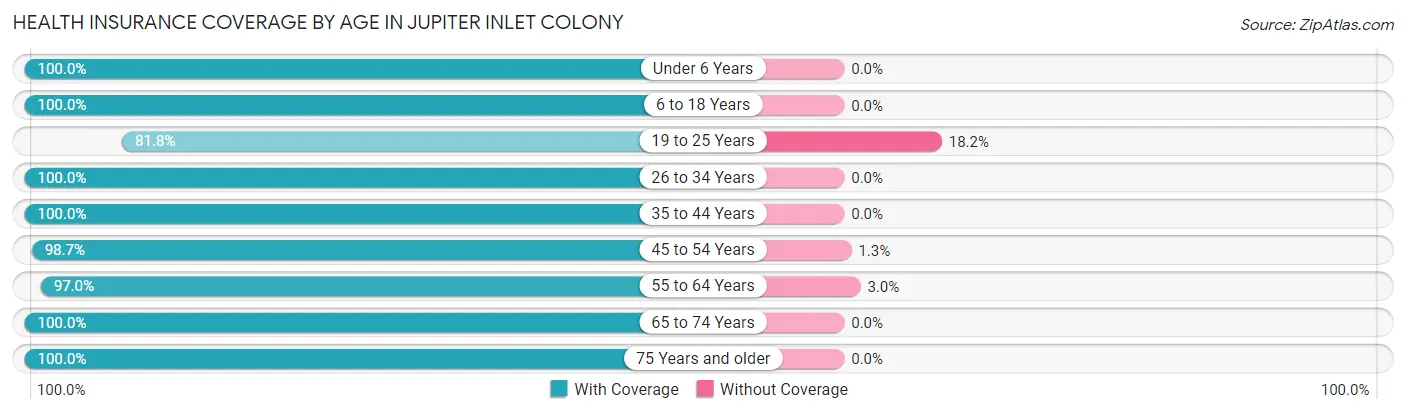
| Age Bracket | With Coverage | Without Coverage |
| Under 6 Years | 1 (100.0%) | 0 (0.0%) |
| 6 to 18 Years | 118 (100.0%) | 0 (0.0%) |
| 19 to 25 Years | 9 (81.8%) | 2 (18.2%) |
| 26 to 34 Years | 2 (100.0%) | 0 (0.0%) |
| 35 to 44 Years | 4 (100.0%) | 0 (0.0%) |
| 45 to 54 Years | 74 (98.7%) | 1 (1.3%) |
| 55 to 64 Years | 64 (97.0%) | 2 (3.0%) |
| 65 to 74 Years | 88 (100.0%) | 0 (0.0%) |
| 75 Years and older | 96 (100.0%) | 0 (0.0%) |
| Total | 456 (98.9%) | 5 (1.1%) |
Health Insurance Coverage by Citizenship Status in Jupiter Inlet Colony
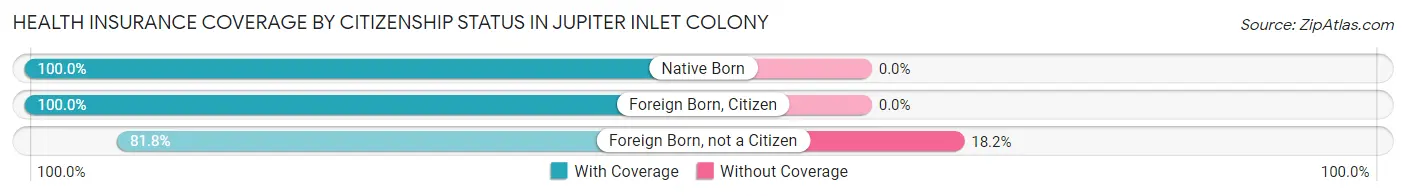
| Citizenship Status | With Coverage | Without Coverage |
| Native Born | 1 (100.0%) | 0 (0.0%) |
| Foreign Born, Citizen | 118 (100.0%) | 0 (0.0%) |
| Foreign Born, not a Citizen | 9 (81.8%) | 2 (18.2%) |
Health Insurance Coverage by Household Income in Jupiter Inlet Colony
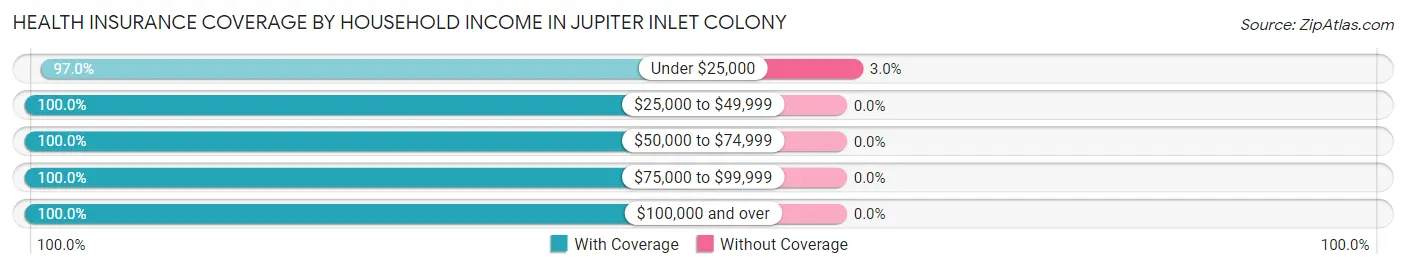
| Household Income | With Coverage | Without Coverage |
| Under $25,000 | 161 (97.0%) | 5 (3.0%) |
| $25,000 to $49,999 | 15 (100.0%) | 0 (0.0%) |
| $50,000 to $74,999 | 24 (100.0%) | 0 (0.0%) |
| $75,000 to $99,999 | 10 (100.0%) | 0 (0.0%) |
| $100,000 and over | 246 (100.0%) | 0 (0.0%) |
Public vs Private Health Insurance Coverage by Age in Jupiter Inlet Colony
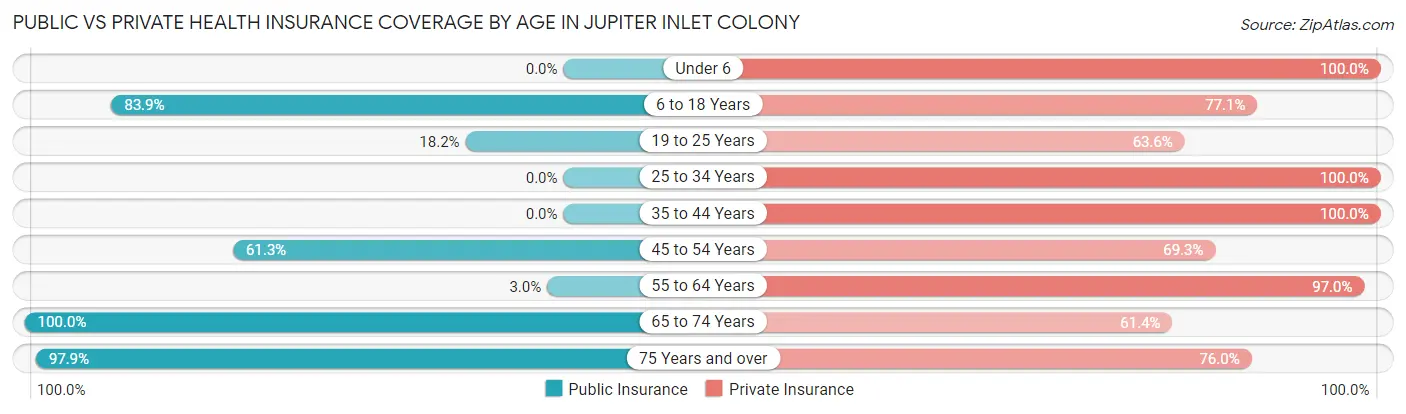
| Age Bracket | Public Insurance | Private Insurance |
| Under 6 | 0 (0.0%) | 1 (100.0%) |
| 6 to 18 Years | 99 (83.9%) | 91 (77.1%) |
| 19 to 25 Years | 2 (18.2%) | 7 (63.6%) |
| 25 to 34 Years | 0 (0.0%) | 2 (100.0%) |
| 35 to 44 Years | 0 (0.0%) | 4 (100.0%) |
| 45 to 54 Years | 46 (61.3%) | 52 (69.3%) |
| 55 to 64 Years | 2 (3.0%) | 64 (97.0%) |
| 65 to 74 Years | 88 (100.0%) | 54 (61.4%) |
| 75 Years and over | 94 (97.9%) | 73 (76.0%) |
| Total | 331 (71.8%) | 348 (75.5%) |
Disability Status by Sex by Age in Jupiter Inlet Colony
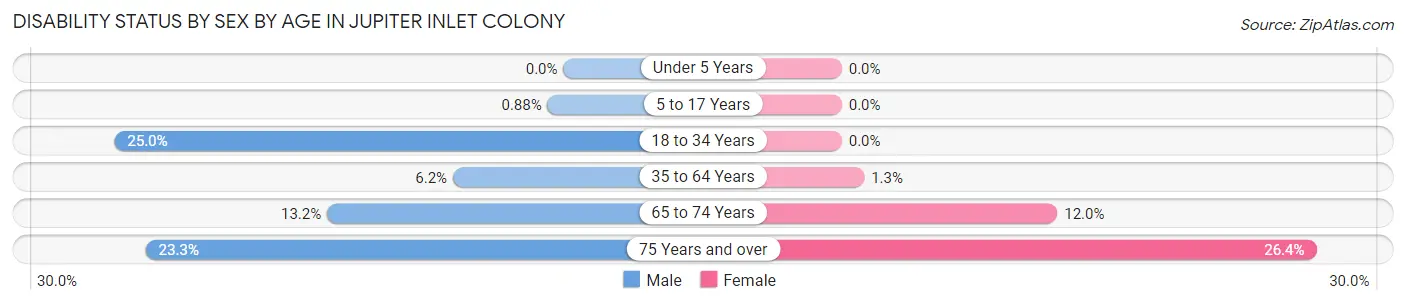
| Age Bracket | Male | Female |
| Under 5 Years | 0 (0.0%) | 0 (0.0%) |
| 5 to 17 Years | 1 (0.9%) | 0 (0.0%) |
| 18 to 34 Years | 2 (25.0%) | 0 (0.0%) |
| 35 to 64 Years | 4 (6.1%) | 1 (1.3%) |
| 65 to 74 Years | 5 (13.2%) | 6 (12.0%) |
| 75 Years and over | 10 (23.3%) | 14 (26.4%) |
Disability Class by Sex by Age in Jupiter Inlet Colony
Disability Class: Hearing Difficulty
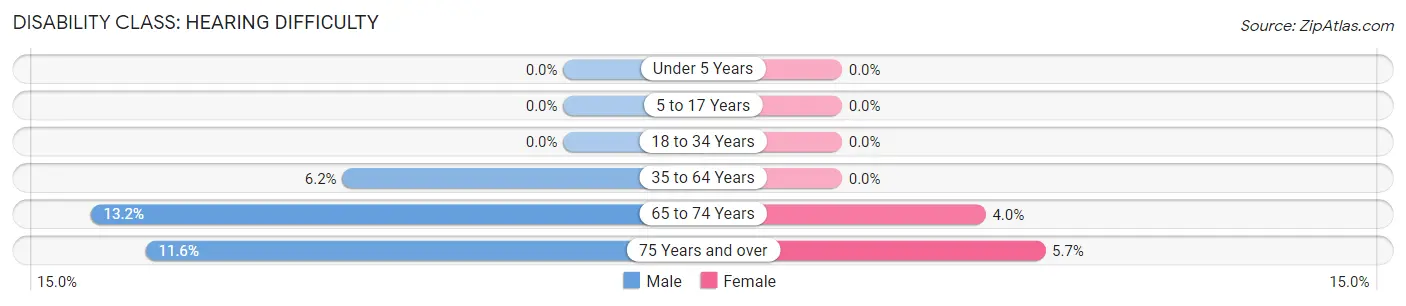
| Age Bracket | Male | Female |
| Under 5 Years | 0 (0.0%) | 0 (0.0%) |
| 5 to 17 Years | 0 (0.0%) | 0 (0.0%) |
| 18 to 34 Years | 0 (0.0%) | 0 (0.0%) |
| 35 to 64 Years | 4 (6.1%) | 0 (0.0%) |
| 65 to 74 Years | 5 (13.2%) | 2 (4.0%) |
| 75 Years and over | 5 (11.6%) | 3 (5.7%) |
Disability Class: Vision Difficulty
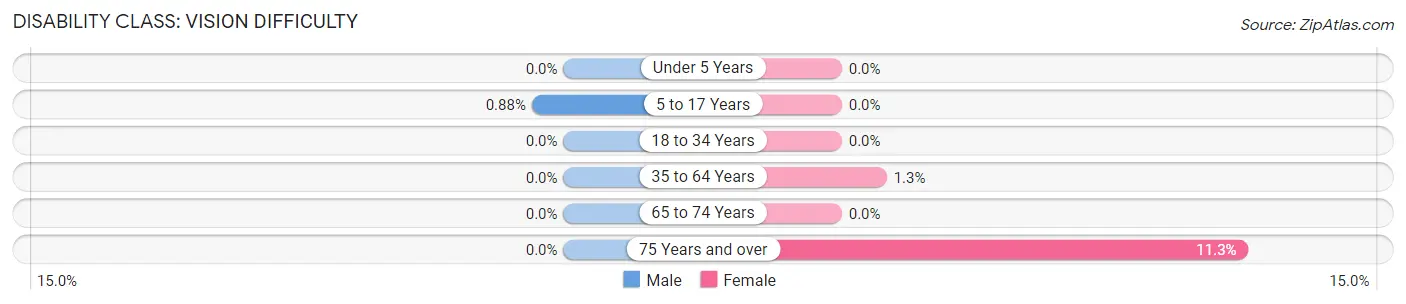
| Age Bracket | Male | Female |
| Under 5 Years | 0 (0.0%) | 0 (0.0%) |
| 5 to 17 Years | 1 (0.9%) | 0 (0.0%) |
| 18 to 34 Years | 0 (0.0%) | 0 (0.0%) |
| 35 to 64 Years | 0 (0.0%) | 1 (1.3%) |
| 65 to 74 Years | 0 (0.0%) | 0 (0.0%) |
| 75 Years and over | 0 (0.0%) | 6 (11.3%) |
Disability Class: Cognitive Difficulty

| Age Bracket | Male | Female |
| 5 to 17 Years | 0 (0.0%) | 0 (0.0%) |
| 18 to 34 Years | 2 (25.0%) | 0 (0.0%) |
| 35 to 64 Years | 0 (0.0%) | 0 (0.0%) |
| 65 to 74 Years | 0 (0.0%) | 0 (0.0%) |
| 75 Years and over | 0 (0.0%) | 5 (9.4%) |
Disability Class: Ambulatory Difficulty
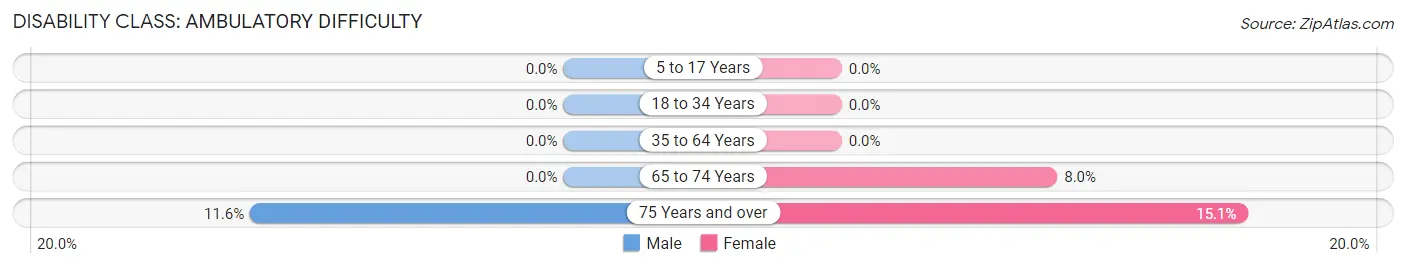
| Age Bracket | Male | Female |
| 5 to 17 Years | 0 (0.0%) | 0 (0.0%) |
| 18 to 34 Years | 0 (0.0%) | 0 (0.0%) |
| 35 to 64 Years | 0 (0.0%) | 0 (0.0%) |
| 65 to 74 Years | 0 (0.0%) | 4 (8.0%) |
| 75 Years and over | 5 (11.6%) | 8 (15.1%) |
Disability Class: Self-Care Difficulty
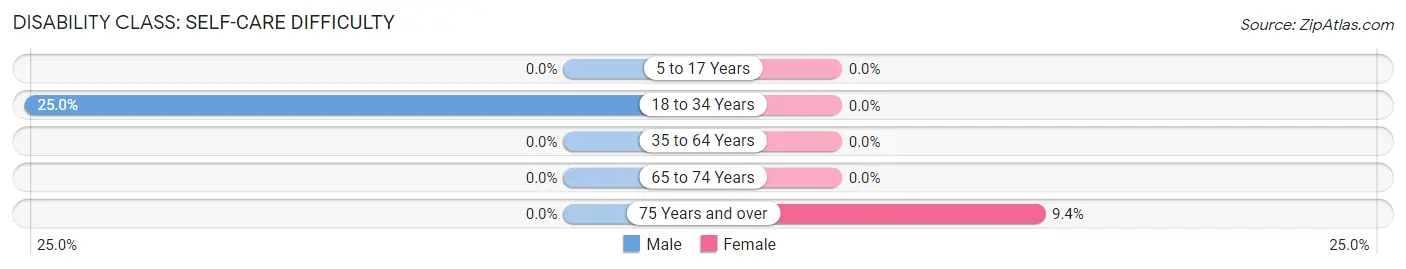
| Age Bracket | Male | Female |
| 5 to 17 Years | 0 (0.0%) | 0 (0.0%) |
| 18 to 34 Years | 2 (25.0%) | 0 (0.0%) |
| 35 to 64 Years | 0 (0.0%) | 0 (0.0%) |
| 65 to 74 Years | 0 (0.0%) | 0 (0.0%) |
| 75 Years and over | 0 (0.0%) | 5 (9.4%) |
Technology Access in Jupiter Inlet Colony
Computing Device Access in Jupiter Inlet Colony
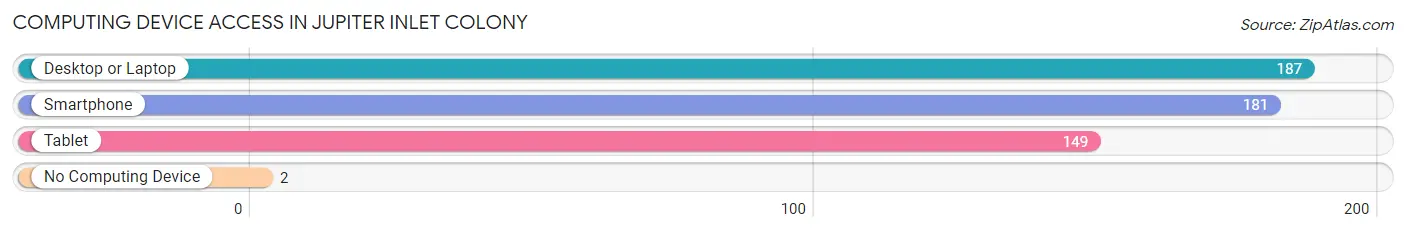
| Device Type | # Households | % Households |
| Desktop or Laptop | 187 | 97.4% |
| Smartphone | 181 | 94.3% |
| Tablet | 149 | 77.6% |
| No Computing Device | 2 | 1.0% |
| Total | 192 | 100.0% |
Internet Access in Jupiter Inlet Colony
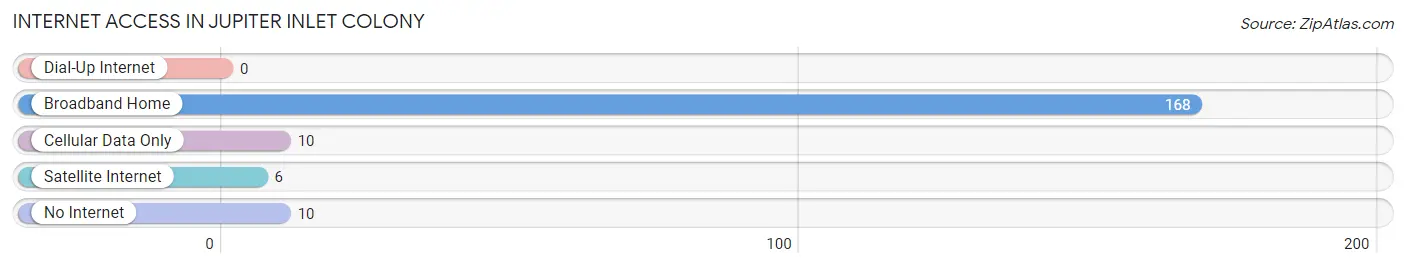
| Internet Type | # Households | % Households |
| Dial-Up Internet | 0 | 0.0% |
| Broadband Home | 168 | 87.5% |
| Cellular Data Only | 10 | 5.2% |
| Satellite Internet | 6 | 3.1% |
| No Internet | 10 | 5.2% |
| Total | 192 | 100.0% |
Jupiter Inlet Colony Summary
Jupiter Inlet Colony is a small town located in Palm Beach County, Florida. It is situated on the northern tip of Jupiter Island, which is a barrier island located between the Atlantic Ocean and the Intracoastal Waterway. The town is bordered by the town of Jupiter to the north and the city of Tequesta to the south. The town has a population of approximately 500 people and covers an area of 0.4 square miles.
History
Jupiter Inlet Colony was founded in 1953 by a group of investors led by John D. MacArthur. The town was originally intended to be a private residential community, and the investors purchased the land from the Jupiter Inlet Corporation. The town was incorporated in 1957 and was named after the nearby Jupiter Inlet.
Geography
Jupiter Inlet Colony is located in Palm Beach County, Florida. It is situated on the northern tip of Jupiter Island, which is a barrier island located between the Atlantic Ocean and the Intracoastal Waterway. The town is bordered by the town of Jupiter to the north and the city of Tequesta to the south. The town has a total area of 0.4 square miles, all of which is land.
Climate
Jupiter Inlet Colony has a humid subtropical climate, with hot, humid summers and mild, dry winters. The average temperature in the summer is around 85°F, and the average temperature in the winter is around 65°F. The town receives an average of 54 inches of rain per year.
Economy
Jupiter Inlet Colony has a small economy that is largely based on tourism. The town is home to several resorts and hotels, as well as a number of restaurants and shops. The town also has a marina, which provides access to the Intracoastal Waterway.
Demographics
As of the 2010 census, Jupiter Inlet Colony had a population of 500 people. The racial makeup of the town was 97.2% White, 0.8% African American, 0.2% Native American, 0.6% Asian, and 1.2% from other races. The median household income was $90,000, and the median family income was $100,000.
Conclusion
Jupiter Inlet Colony is a small town located in Palm Beach County, Florida. It is situated on the northern tip of Jupiter Island, which is a barrier island located between the Atlantic Ocean and the Intracoastal Waterway. The town was founded in 1953 and was incorporated in 1957. It has a population of approximately 500 people and covers an area of 0.4 square miles. The town has a small economy that is largely based on tourism, and the median household income is $90,000.
Common Questions
What is the Total Population of Jupiter Inlet Colony?
Total Population of Jupiter Inlet Colony is 461.
What is the Total Male Population of Jupiter Inlet Colony?
Total Male Population of Jupiter Inlet Colony is 268.
What is the Total Female Population of Jupiter Inlet Colony?
Total Female Population of Jupiter Inlet Colony is 193.
What is the Ratio of Males per 100 Females in Jupiter Inlet Colony?
There are 138.86 Males per 100 Females in Jupiter Inlet Colony.
What is the Ratio of Females per 100 Males in Jupiter Inlet Colony?
There are 72.01 Females per 100 Males in Jupiter Inlet Colony.
What is the Median Population Age in Jupiter Inlet Colony?
Median Population Age in Jupiter Inlet Colony is 57.8 Years.
What is the Average Family Size in Jupiter Inlet Colony
Average Family Size in Jupiter Inlet Colony is 3.0 People.
What is the Average Household Size in Jupiter Inlet Colony
Average Household Size in Jupiter Inlet Colony is 2.4 People.
What is Per Capita Income in Jupiter Inlet Colony?
Per Capita income in Jupiter Inlet Colony is $111,160.
What is the Median Family Income in Jupiter Inlet Colony?
Median Family Income in Jupiter Inlet Colony is $178,750.
What is the Median Household income in Jupiter Inlet Colony?
Median Household Income in Jupiter Inlet Colony is $135,000.
What is Inequality or Gini Index in Jupiter Inlet Colony?
Inequality or Gini Index in Jupiter Inlet Colony is 0.64.
How Large is the Labor Force in Jupiter Inlet Colony?
There are 138 People in the Labor Forcein in Jupiter Inlet Colony.
What is the Percentage of People in the Labor Force in Jupiter Inlet Colony?
36.6% of People are in the Labor Force in Jupiter Inlet Colony.
What is the Unemployment Rate in Jupiter Inlet Colony?
Unemployment Rate in Jupiter Inlet Colony is 2.9%.