Indian Harbour Beach, FL
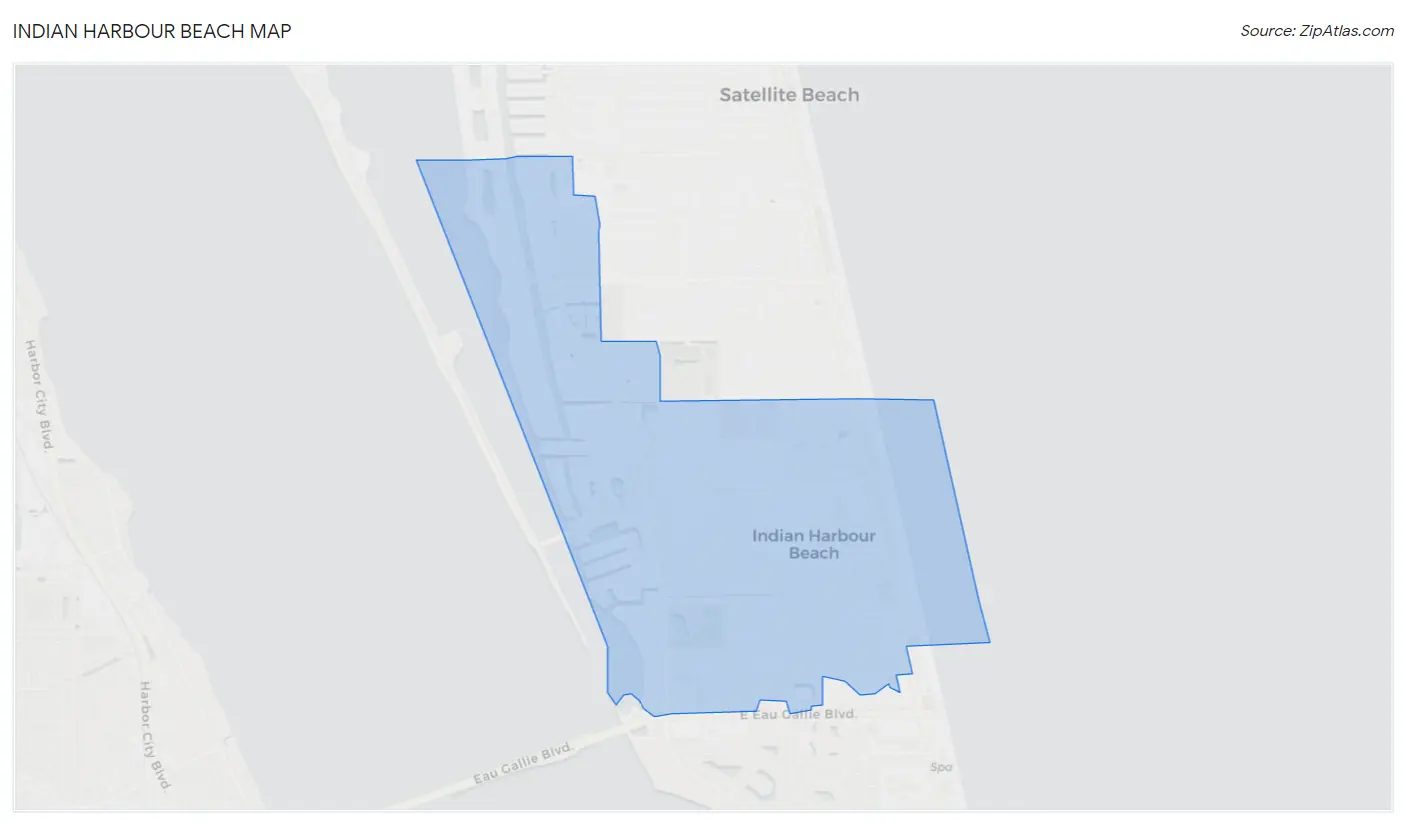
Indian Harbour Beach Map
Indian Harbour Beach Overview
8,944
TOTAL POPULATION
4,410
MALE POPULATION
4,534
FEMALE POPULATION
97.27
MALES / 100 FEMALES
102.81
FEMALES / 100 MALES
49.8
MEDIAN AGE
3.0
AVG FAMILY SIZE
2.3
AVG HOUSEHOLD SIZE
$56,461
PER CAPITA INCOME
$113,250
AVG FAMILY INCOME
$78,774
AVG HOUSEHOLD INCOME
26.7%
WAGE / INCOME GAP [ % ]
73.3¢/ $1
WAGE / INCOME GAP [ $ ]
$7,526
FAMILY INCOME DEFICIT
0.51
INEQUALITY / GINI INDEX
3,759
LABOR FORCE [ PEOPLE ]
51.1%
PERCENT IN LABOR FORCE
4.3%
UNEMPLOYMENT RATE
Indian Harbour Beach Area Codes
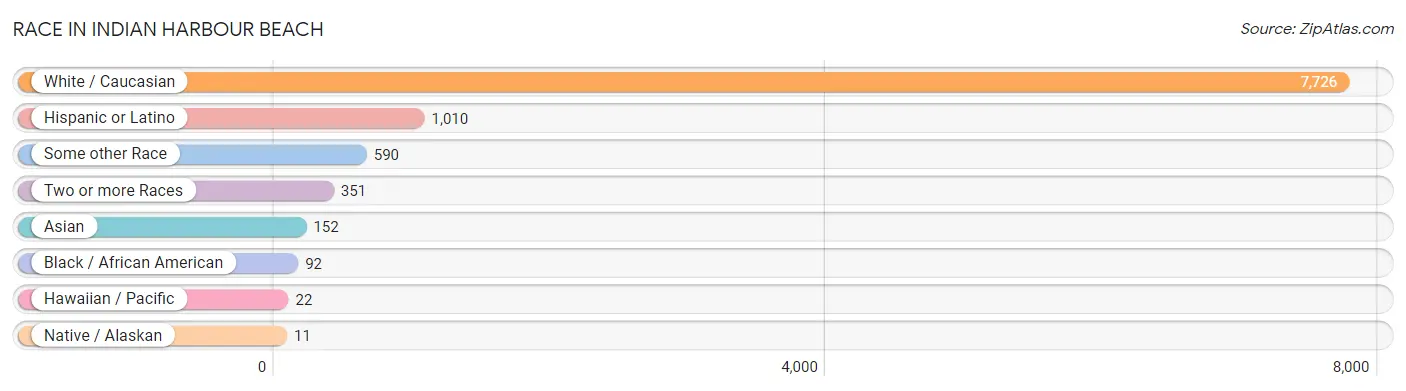
Race in Indian Harbour Beach
The most populous races in Indian Harbour Beach are White / Caucasian (7,726 | 86.4%), Hispanic or Latino (1,010 | 11.3%), and Some other Race (590 | 6.6%).
| Race | # Population | % Population |
| Asian | 152 | 1.7% |
| Black / African American | 92 | 1.0% |
| Hawaiian / Pacific | 22 | 0.3% |
| Hispanic or Latino | 1,010 | 11.3% |
| Native / Alaskan | 11 | 0.1% |
| White / Caucasian | 7,726 | 86.4% |
| Two or more Races | 351 | 3.9% |
| Some other Race | 590 | 6.6% |
| Total | 8,944 | 100.0% |
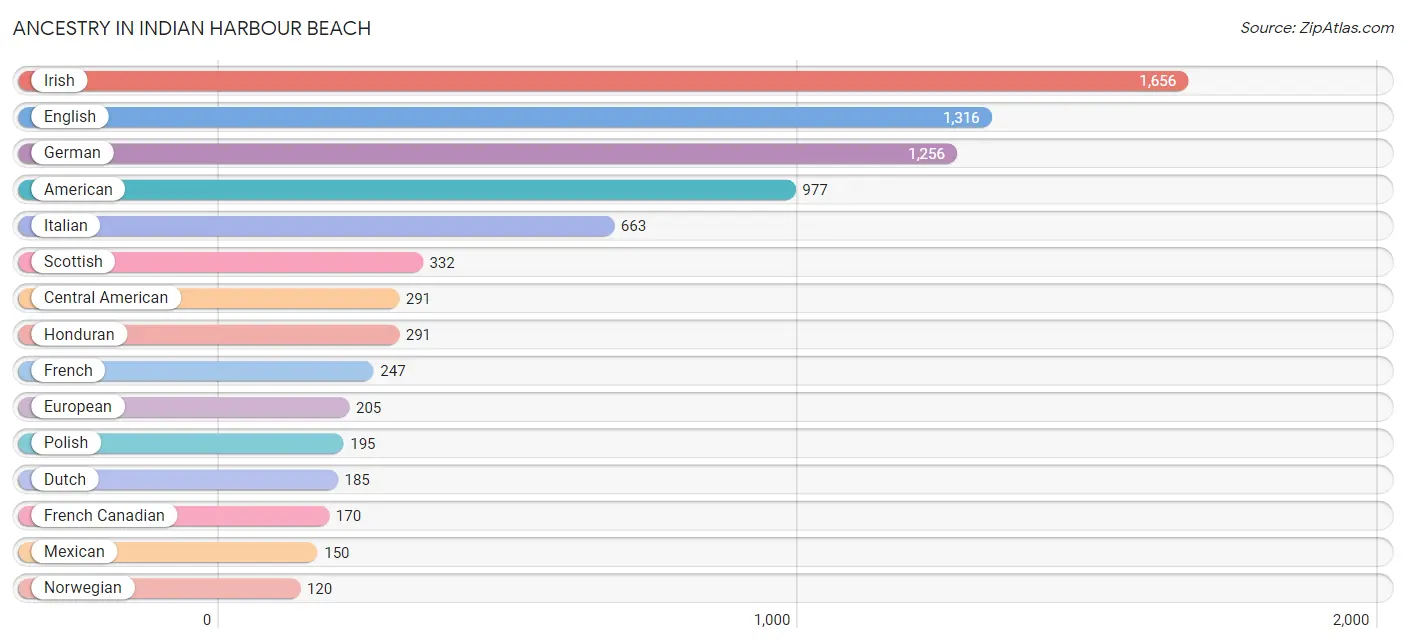
Ancestry in Indian Harbour Beach
The most populous ancestries reported in Indian Harbour Beach are Irish (1,656 | 18.5%), English (1,316 | 14.7%), German (1,256 | 14.0%), American (977 | 10.9%), and Italian (663 | 7.4%), together accounting for 65.6% of all Indian Harbour Beach residents.
| Ancestry | # Population | % Population |
| American | 977 | 10.9% |
| Arab | 60 | 0.7% |
| Bhutanese | 6 | 0.1% |
| British | 117 | 1.3% |
| Cajun | 27 | 0.3% |
| Canadian | 44 | 0.5% |
| Central American | 291 | 3.3% |
| Cherokee | 11 | 0.1% |
| Colombian | 11 | 0.1% |
| Cuban | 111 | 1.2% |
| Czech | 21 | 0.2% |
| Czechoslovakian | 37 | 0.4% |
| Danish | 21 | 0.2% |
| Dominican | 19 | 0.2% |
| Dutch | 185 | 2.1% |
| English | 1,316 | 14.7% |
| European | 205 | 2.3% |
| Finnish | 12 | 0.1% |
| French | 247 | 2.8% |
| French Canadian | 170 | 1.9% |
| German | 1,256 | 14.0% |
| Greek | 27 | 0.3% |
| Honduran | 291 | 3.3% |
| Hungarian | 116 | 1.3% |
| Indian (Asian) | 70 | 0.8% |
| Irish | 1,656 | 18.5% |
| Italian | 663 | 7.4% |
| Korean | 13 | 0.2% |
| Lebanese | 32 | 0.4% |
| Lithuanian | 28 | 0.3% |
| Mexican | 150 | 1.7% |
| Native Hawaiian | 22 | 0.3% |
| Northern European | 7 | 0.1% |
| Norwegian | 120 | 1.3% |
| Pakistani | 39 | 0.4% |
| Peruvian | 20 | 0.2% |
| Polish | 195 | 2.2% |
| Puerto Rican | 108 | 1.2% |
| Romanian | 10 | 0.1% |
| Russian | 83 | 0.9% |
| Scandinavian | 43 | 0.5% |
| Scotch-Irish | 80 | 0.9% |
| Scottish | 332 | 3.7% |
| South American | 31 | 0.4% |
| Spaniard | 94 | 1.1% |
| Sri Lankan | 64 | 0.7% |
| Swedish | 65 | 0.7% |
| Swiss | 70 | 0.8% |
| Syrian | 28 | 0.3% |
| Thai | 113 | 1.3% |
| Ukrainian | 23 | 0.3% |
| Welsh | 104 | 1.2% | View All 52 Rows |
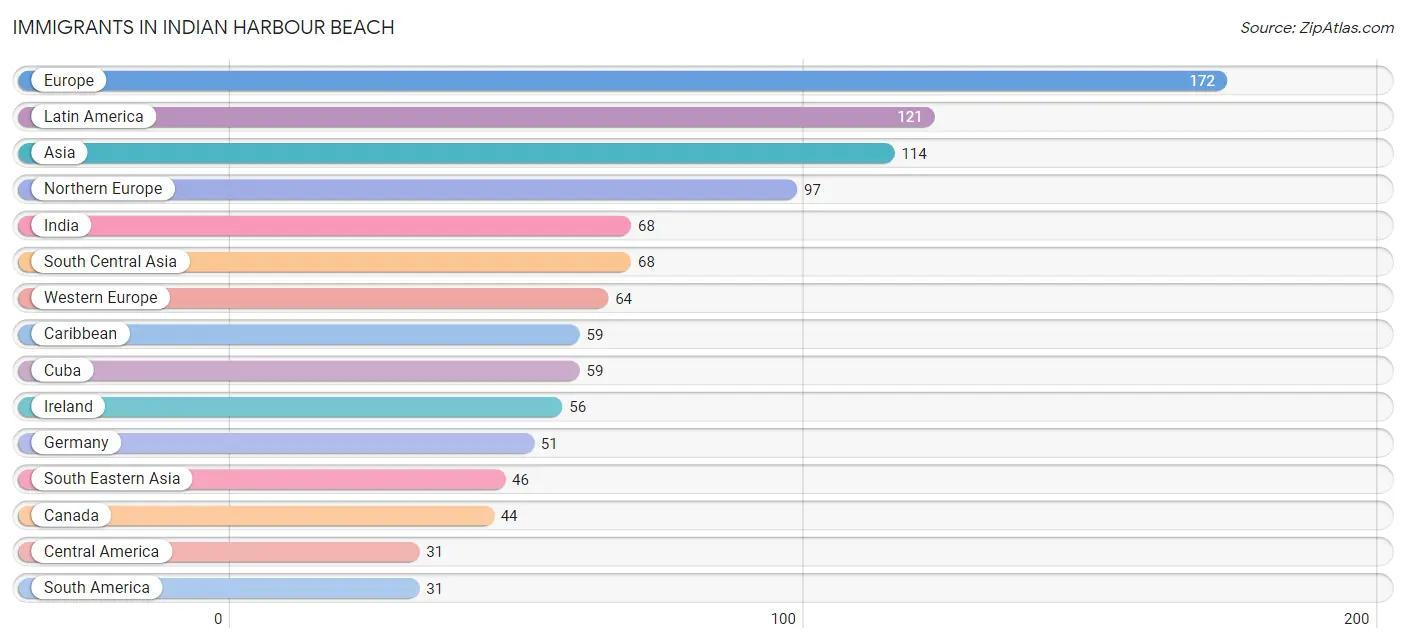
Immigrants in Indian Harbour Beach
The most numerous immigrant groups reported in Indian Harbour Beach came from Europe (172 | 1.9%), Latin America (121 | 1.3%), Asia (114 | 1.3%), Northern Europe (97 | 1.1%), and India (68 | 0.8%), together accounting for 6.4% of all Indian Harbour Beach residents.
| Immigration Origin | # Population | % Population |
| Africa | 21 | 0.2% |
| Asia | 114 | 1.3% |
| Canada | 44 | 0.5% |
| Caribbean | 59 | 0.7% |
| Central America | 31 | 0.4% |
| Colombia | 11 | 0.1% |
| Cuba | 59 | 0.7% |
| Eastern Europe | 11 | 0.1% |
| England | 21 | 0.2% |
| Europe | 172 | 1.9% |
| Germany | 51 | 0.6% |
| India | 68 | 0.8% |
| Ireland | 56 | 0.6% |
| Latin America | 121 | 1.3% |
| Mexico | 13 | 0.2% |
| Netherlands | 13 | 0.2% |
| Northern Europe | 97 | 1.1% |
| Panama | 18 | 0.2% |
| Peru | 20 | 0.2% |
| Philippines | 13 | 0.2% |
| Russia | 11 | 0.1% |
| Senegal | 21 | 0.2% |
| South America | 31 | 0.4% |
| South Central Asia | 68 | 0.8% |
| South Eastern Asia | 46 | 0.5% |
| Thailand | 17 | 0.2% |
| Vietnam | 16 | 0.2% |
| Western Africa | 21 | 0.2% |
| Western Europe | 64 | 0.7% | View All 29 Rows |
Sex and Age in Indian Harbour Beach
Sex and Age in Indian Harbour Beach
The most populous age groups in Indian Harbour Beach are 70 to 74 Years (474 | 10.7%) for men and 65 to 69 Years (563 | 12.4%) for women.
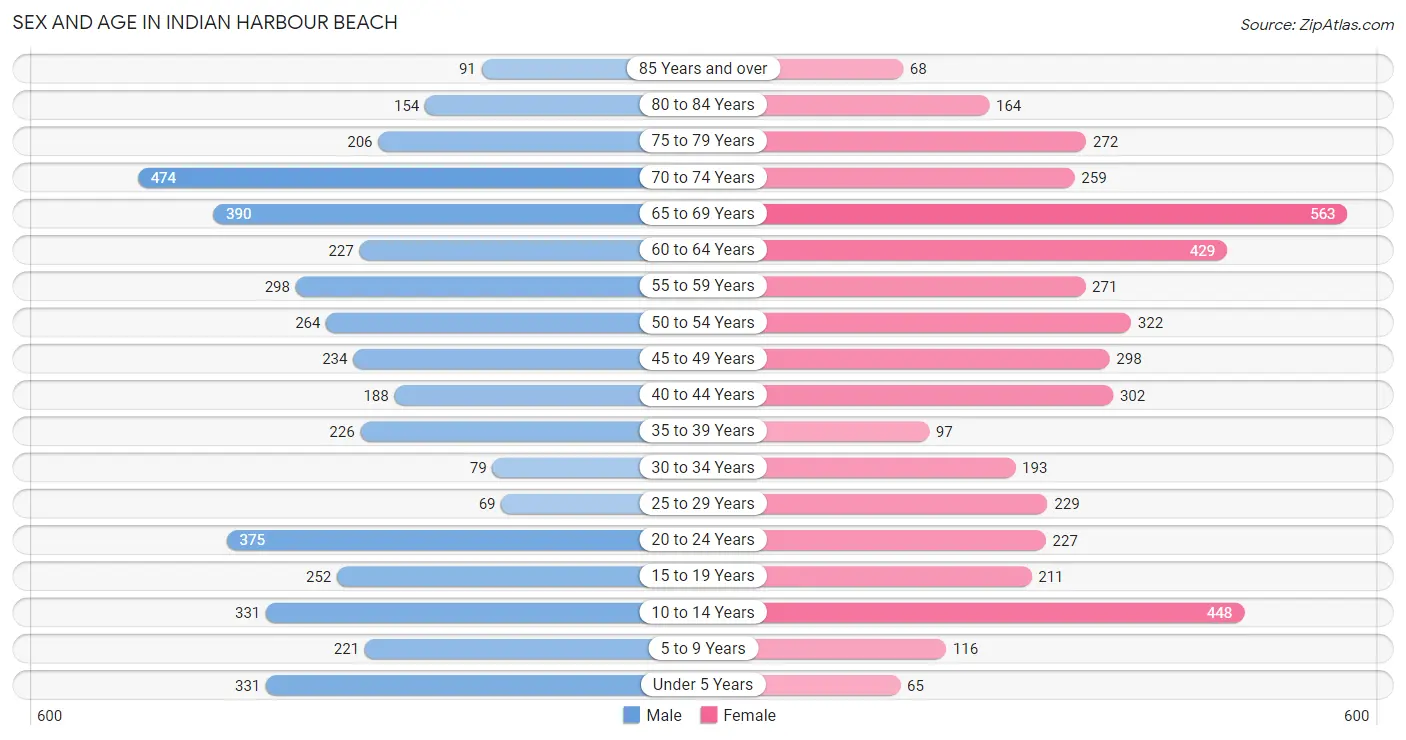
| Age Bracket | Male | Female |
| Under 5 Years | 331 (7.5%) | 65 (1.4%) |
| 5 to 9 Years | 221 (5.0%) | 116 (2.6%) |
| 10 to 14 Years | 331 (7.5%) | 448 (9.9%) |
| 15 to 19 Years | 252 (5.7%) | 211 (4.6%) |
| 20 to 24 Years | 375 (8.5%) | 227 (5.0%) |
| 25 to 29 Years | 69 (1.6%) | 229 (5.1%) |
| 30 to 34 Years | 79 (1.8%) | 193 (4.3%) |
| 35 to 39 Years | 226 (5.1%) | 97 (2.1%) |
| 40 to 44 Years | 188 (4.3%) | 302 (6.7%) |
| 45 to 49 Years | 234 (5.3%) | 298 (6.6%) |
| 50 to 54 Years | 264 (6.0%) | 322 (7.1%) |
| 55 to 59 Years | 298 (6.8%) | 271 (6.0%) |
| 60 to 64 Years | 227 (5.1%) | 429 (9.5%) |
| 65 to 69 Years | 390 (8.8%) | 563 (12.4%) |
| 70 to 74 Years | 474 (10.7%) | 259 (5.7%) |
| 75 to 79 Years | 206 (4.7%) | 272 (6.0%) |
| 80 to 84 Years | 154 (3.5%) | 164 (3.6%) |
| 85 Years and over | 91 (2.1%) | 68 (1.5%) |
| Total | 4,410 (100.0%) | 4,534 (100.0%) |
Families and Households in Indian Harbour Beach
Median Family Size in Indian Harbour Beach
The median family size in Indian Harbour Beach is 2.99 persons per family, with single female/mother families (285 | 12.0%) accounting for the largest median family size of 3.18 persons per family. On the other hand, single male/father families (69 | 2.9%) represent the smallest median family size with 2.75 persons per family.
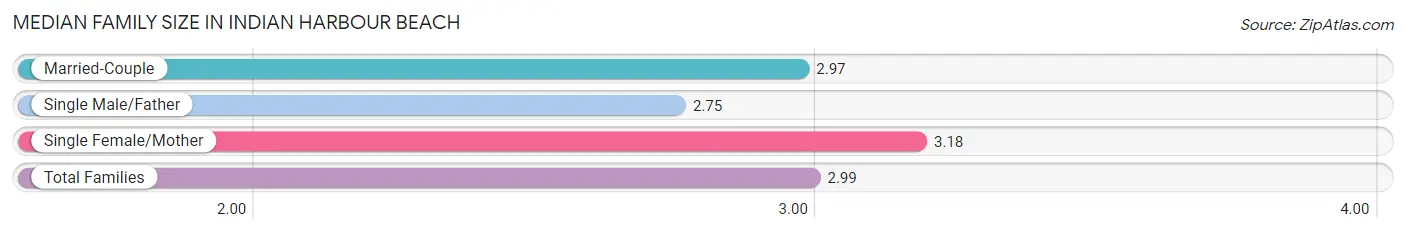
| Family Type | # Families | Family Size |
| Married-Couple | 2,024 (85.1%) | 2.97 |
| Single Male/Father | 69 (2.9%) | 2.75 |
| Single Female/Mother | 285 (12.0%) | 3.18 |
| Total Families | 2,378 (100.0%) | 2.99 |
Median Household Size in Indian Harbour Beach
The median household size in Indian Harbour Beach is 2.34 persons per household, with single female/mother households (285 | 7.5%) accounting for the largest median household size of 3.32 persons per household. non-family households (1,425 | 37.5%) represent the smallest median household size with 1.18 persons per household.
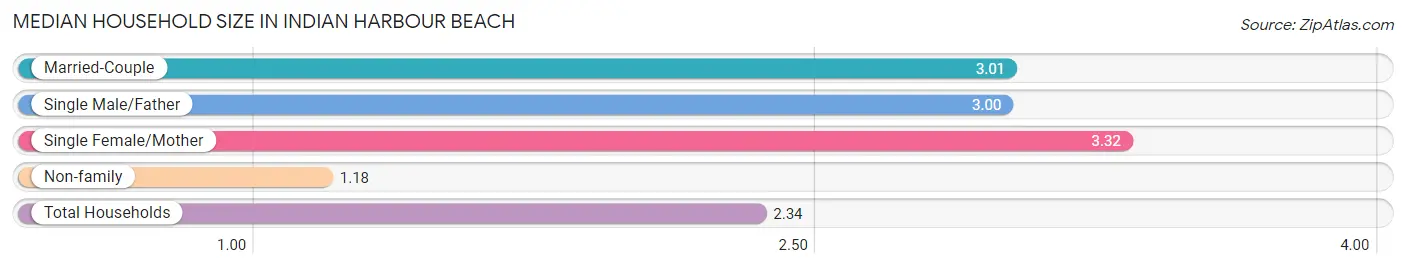
| Household Type | # Households | Household Size |
| Married-Couple | 2,024 (53.2%) | 3.01 |
| Single Male/Father | 69 (1.8%) | 3.00 |
| Single Female/Mother | 285 (7.5%) | 3.32 |
| Non-family | 1,425 (37.5%) | 1.18 |
| Total Households | 3,803 (100.0%) | 2.34 |
Household Size by Marriage Status in Indian Harbour Beach
Out of a total of 3,803 households in Indian Harbour Beach, 2,378 (62.5%) are family households, while 1,425 (37.5%) are nonfamily households. The most numerous type of family households are 2-person households, comprising 1,307, and the most common type of nonfamily households are 1-person households, comprising 1,247.
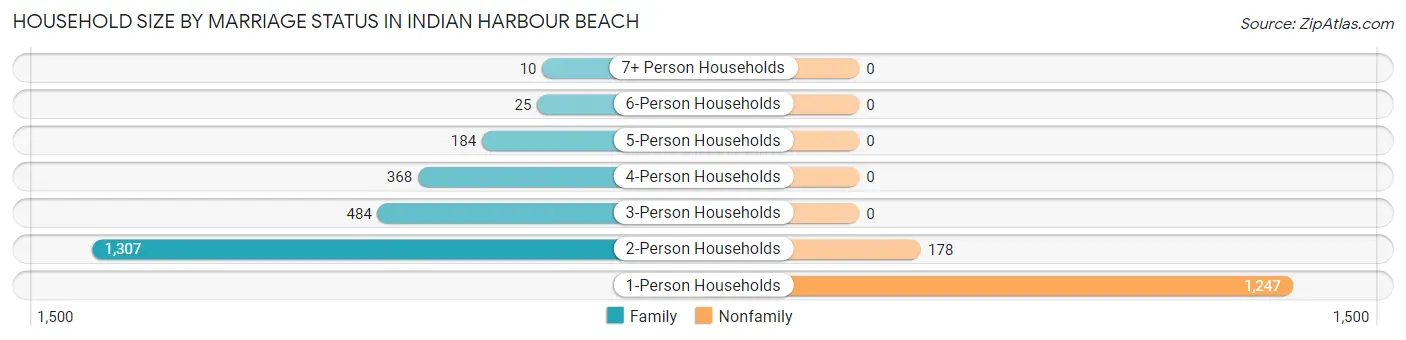
| Household Size | Family Households | Nonfamily Households |
| 1-Person Households | - | 1,247 (32.8%) |
| 2-Person Households | 1,307 (34.4%) | 178 (4.7%) |
| 3-Person Households | 484 (12.7%) | 0 (0.0%) |
| 4-Person Households | 368 (9.7%) | 0 (0.0%) |
| 5-Person Households | 184 (4.8%) | 0 (0.0%) |
| 6-Person Households | 25 (0.7%) | 0 (0.0%) |
| 7+ Person Households | 10 (0.3%) | 0 (0.0%) |
| Total | 2,378 (62.5%) | 1,425 (37.5%) |
Female Fertility in Indian Harbour Beach
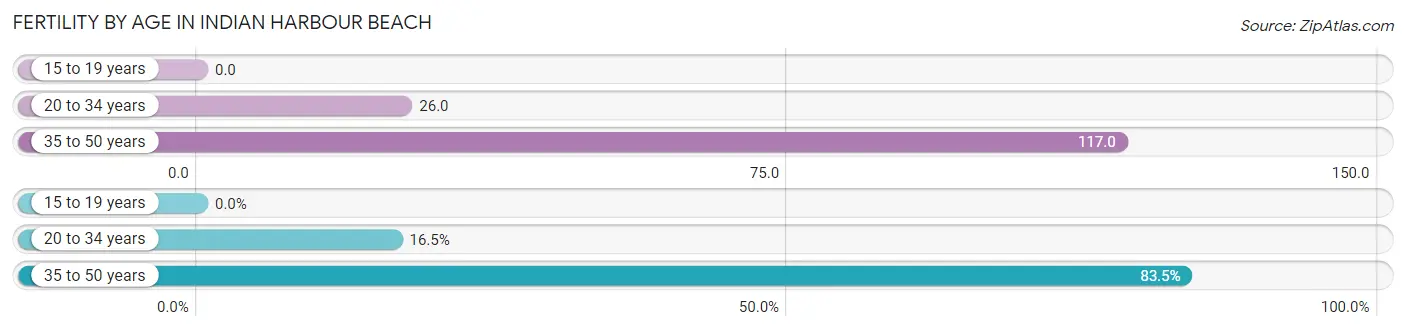
Fertility by Age in Indian Harbour Beach
Average fertility rate in Indian Harbour Beach is 65.0 births per 1,000 women. Women in the age bracket of 35 to 50 years have the highest fertility rate with 117.0 births per 1,000 women. Women in the age bracket of 35 to 50 years acount for 83.5% of all women with births.
| Age Bracket | Women with Births | Births / 1,000 Women |
| 15 to 19 years | 0 (0.0%) | 0.0 |
| 20 to 34 years | 17 (16.5%) | 26.0 |
| 35 to 50 years | 86 (83.5%) | 117.0 |
| Total | 103 (100.0%) | 65.0 |
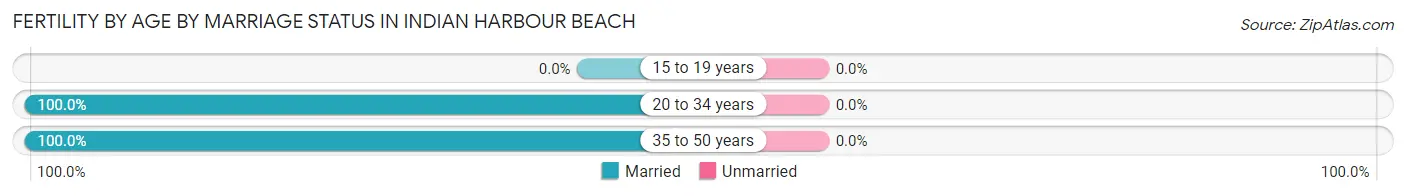
Fertility by Age by Marriage Status in Indian Harbour Beach
| Age Bracket | Married | Unmarried |
| 15 to 19 years | 0 (0.0%) | 0 (0.0%) |
| 20 to 34 years | 17 (100.0%) | 0 (0.0%) |
| 35 to 50 years | 86 (100.0%) | 0 (0.0%) |
| Total | 103 (100.0%) | 0 (0.0%) |
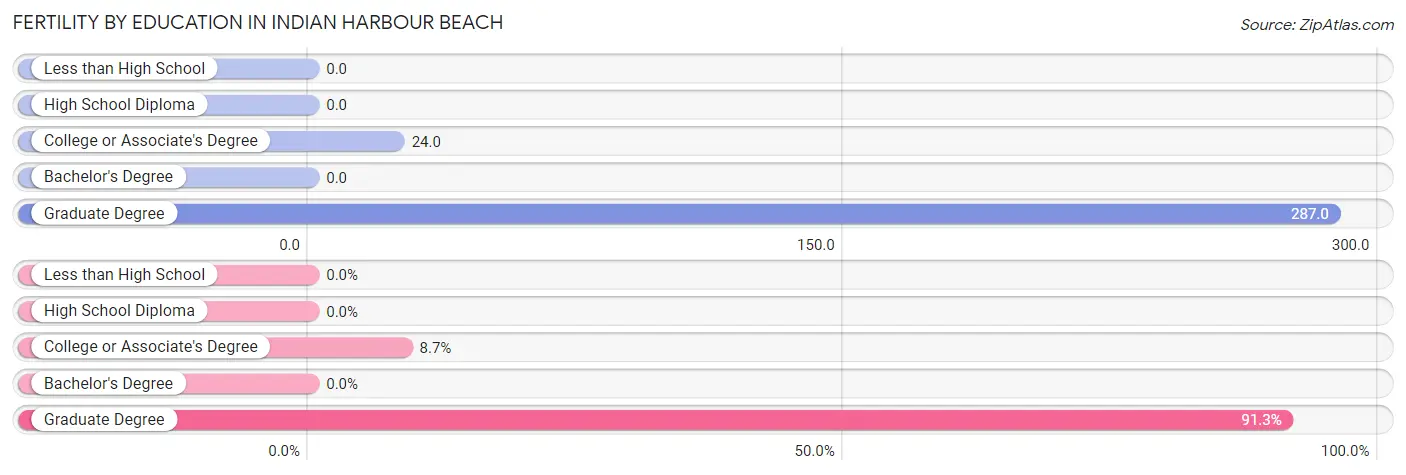
Fertility by Education in Indian Harbour Beach
| Educational Attainment | Women with Births | Births / 1,000 Women |
| Less than High School | 0 (0.0%) | 0.0 |
| High School Diploma | 0 (0.0%) | 0.0 |
| College or Associate's Degree | 9 (8.7%) | 24.0 |
| Bachelor's Degree | 0 (0.0%) | 0.0 |
| Graduate Degree | 94 (91.3%) | 287.0 |
| Total | 103 (100.0%) | 65.0 |
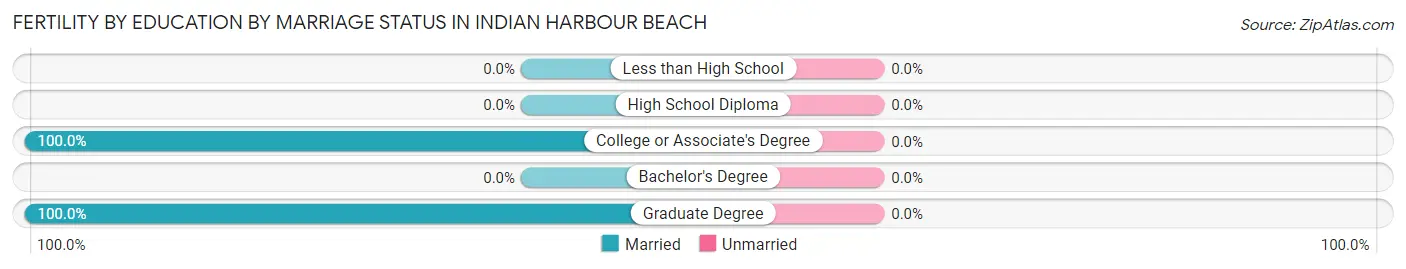
Fertility by Education by Marriage Status in Indian Harbour Beach
| Educational Attainment | Married | Unmarried |
| Less than High School | 0 (0.0%) | 0 (0.0%) |
| High School Diploma | 0 (0.0%) | 0 (0.0%) |
| College or Associate's Degree | 9 (100.0%) | 0 (0.0%) |
| Bachelor's Degree | 0 (0.0%) | 0 (0.0%) |
| Graduate Degree | 94 (100.0%) | 0 (0.0%) |
| Total | 103 (100.0%) | 0 (0.0%) |
Income in Indian Harbour Beach
Income Overview in Indian Harbour Beach
Per Capita Income in Indian Harbour Beach is $56,461, while median incomes of families and households are $113,250 and $78,774 respectively.
| Characteristic | Number | Measure |
| Per Capita Income | 8,944 | $56,461 |
| Median Family Income | 2,378 | $113,250 |
| Mean Family Income | 2,378 | $154,922 |
| Median Household Income | 3,803 | $78,774 |
| Mean Household Income | 3,803 | $128,607 |
| Income Deficit | 2,378 | $7,526 |
| Wage / Income Gap (%) | 8,944 | 26.74% |
| Wage / Income Gap ($) | 8,944 | 73.26¢ per $1 |
| Gini / Inequality Index | 8,944 | 0.51 |
Earnings by Sex in Indian Harbour Beach
Average Earnings in Indian Harbour Beach are $52,742, $59,782 for men and $43,795 for women, a difference of 26.7%.
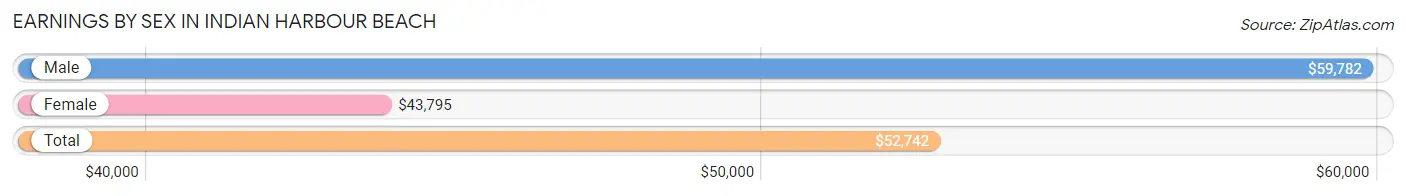
| Sex | Number | Average Earnings |
| Male | 1,945 (50.2%) | $59,782 |
| Female | 1,929 (49.8%) | $43,795 |
| Total | 3,874 (100.0%) | $52,742 |
Earnings by Sex by Income Bracket in Indian Harbour Beach
The most common earnings brackets in Indian Harbour Beach are $100,000+ for men (676 | 34.8%) and $100,000+ for women (328 | 17.0%).
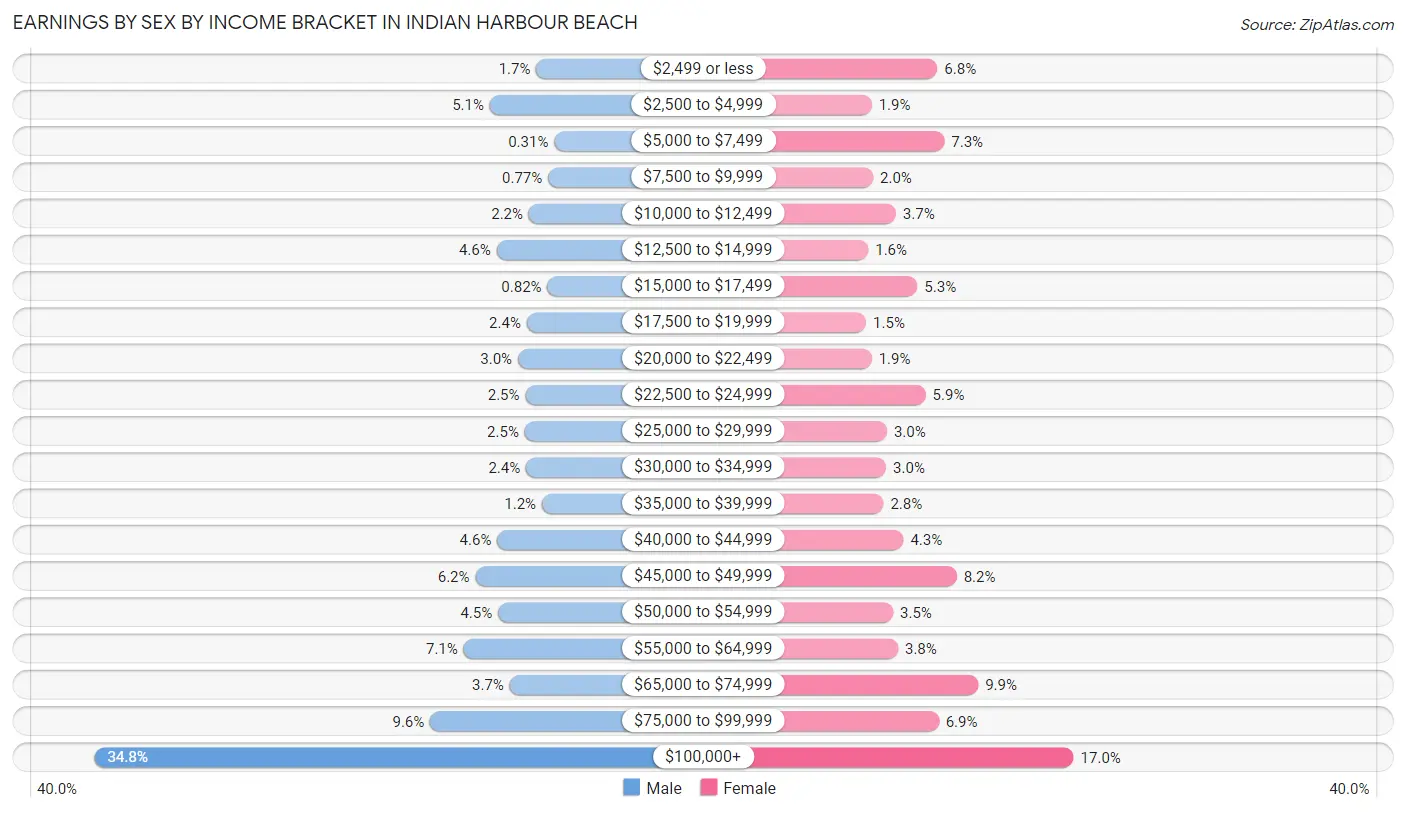
| Income | Male | Female |
| $2,499 or less | 32 (1.7%) | 131 (6.8%) |
| $2,500 to $4,999 | 100 (5.1%) | 36 (1.9%) |
| $5,000 to $7,499 | 6 (0.3%) | 141 (7.3%) |
| $7,500 to $9,999 | 15 (0.8%) | 38 (2.0%) |
| $10,000 to $12,499 | 43 (2.2%) | 71 (3.7%) |
| $12,500 to $14,999 | 90 (4.6%) | 31 (1.6%) |
| $15,000 to $17,499 | 16 (0.8%) | 102 (5.3%) |
| $17,500 to $19,999 | 46 (2.4%) | 28 (1.5%) |
| $20,000 to $22,499 | 59 (3.0%) | 36 (1.9%) |
| $22,500 to $24,999 | 48 (2.5%) | 114 (5.9%) |
| $25,000 to $29,999 | 49 (2.5%) | 58 (3.0%) |
| $30,000 to $34,999 | 47 (2.4%) | 57 (2.9%) |
| $35,000 to $39,999 | 24 (1.2%) | 53 (2.8%) |
| $40,000 to $44,999 | 89 (4.6%) | 82 (4.3%) |
| $45,000 to $49,999 | 121 (6.2%) | 159 (8.2%) |
| $50,000 to $54,999 | 88 (4.5%) | 67 (3.5%) |
| $55,000 to $64,999 | 138 (7.1%) | 74 (3.8%) |
| $65,000 to $74,999 | 71 (3.6%) | 190 (9.9%) |
| $75,000 to $99,999 | 187 (9.6%) | 133 (6.9%) |
| $100,000+ | 676 (34.8%) | 328 (17.0%) |
| Total | 1,945 (100.0%) | 1,929 (100.0%) |
Earnings by Sex by Educational Attainment in Indian Harbour Beach
Average earnings in Indian Harbour Beach are $89,199 for men and $47,012 for women, a difference of 47.3%. Men with an educational attainment of graduate degree enjoy the highest average annual earnings of $165,000, while those with high school diploma education earn the least with $47,356. Women with an educational attainment of graduate degree earn the most with the average annual earnings of $97,222, while those with high school diploma education have the smallest earnings of $17,311.
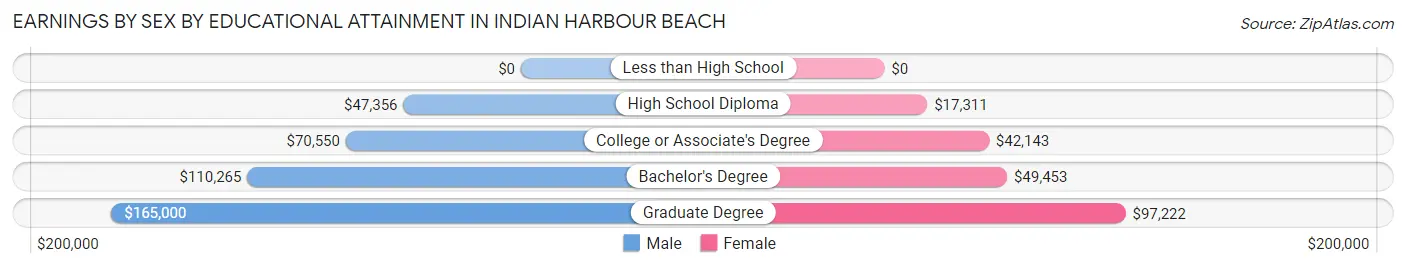
| Educational Attainment | Male Income | Female Income |
| Less than High School | - | - |
| High School Diploma | $47,356 | $17,311 |
| College or Associate's Degree | $70,550 | $42,143 |
| Bachelor's Degree | $110,265 | $49,453 |
| Graduate Degree | $165,000 | $97,222 |
| Total | $89,199 | $47,012 |
Family Income in Indian Harbour Beach
Family Income Brackets in Indian Harbour Beach
According to the Indian Harbour Beach family income data, there are 471 families falling into the $200,000+ income range, which is the most common income bracket and makes up 19.8% of all families. Conversely, the less than $10,000 income bracket is the least frequent group with only 29 families (1.2%) belonging to this category.
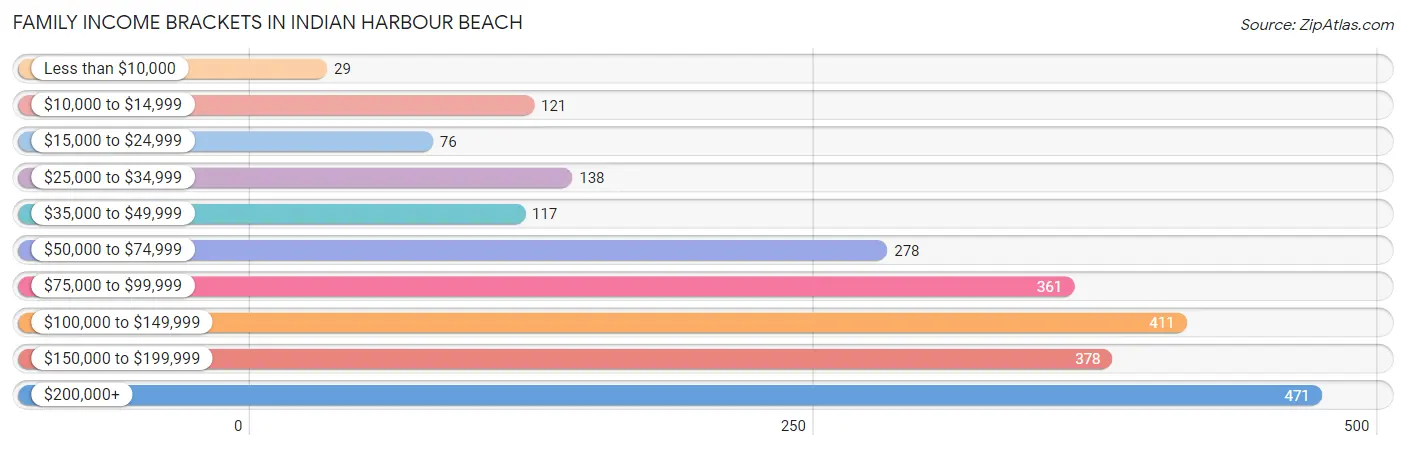
| Income Bracket | # Families | % Families |
| Less than $10,000 | 29 | 1.2% |
| $10,000 to $14,999 | 121 | 5.1% |
| $15,000 to $24,999 | 76 | 3.2% |
| $25,000 to $34,999 | 138 | 5.8% |
| $35,000 to $49,999 | 117 | 4.9% |
| $50,000 to $74,999 | 278 | 11.7% |
| $75,000 to $99,999 | 361 | 15.2% |
| $100,000 to $149,999 | 411 | 17.3% |
| $150,000 to $199,999 | 378 | 15.9% |
| $200,000+ | 471 | 19.8% |
Family Income by Famaliy Size in Indian Harbour Beach
5-person families (141 | 5.9%) account for the highest median family income in Indian Harbour Beach with $250,001 per family, while 5-person families (141 | 5.9%) have the highest median income of $50,000 per family member.
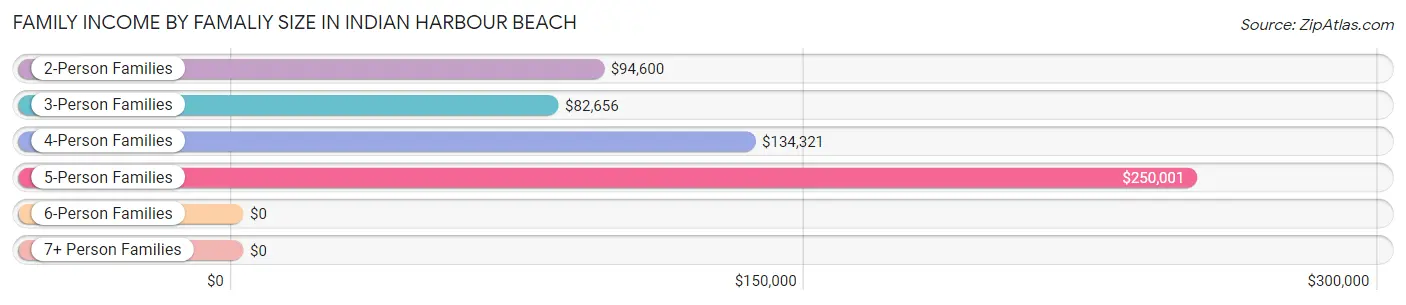
| Income Bracket | # Families | Median Income |
| 2-Person Families | 1,338 (56.3%) | $94,600 |
| 3-Person Families | 471 (19.8%) | $82,656 |
| 4-Person Families | 393 (16.5%) | $134,321 |
| 5-Person Families | 141 (5.9%) | $250,001 |
| 6-Person Families | 25 (1.1%) | $0 |
| 7+ Person Families | 10 (0.4%) | $0 |
| Total | 2,378 (100.0%) | $113,250 |
Family Income by Number of Earners in Indian Harbour Beach
The median family income in Indian Harbour Beach is $113,250, with families comprising 2 earners (745) having the highest median family income of $142,604, while families with no earners (659) have the lowest median family income of $83,475, accounting for 31.3% and 27.7% of families, respectively.
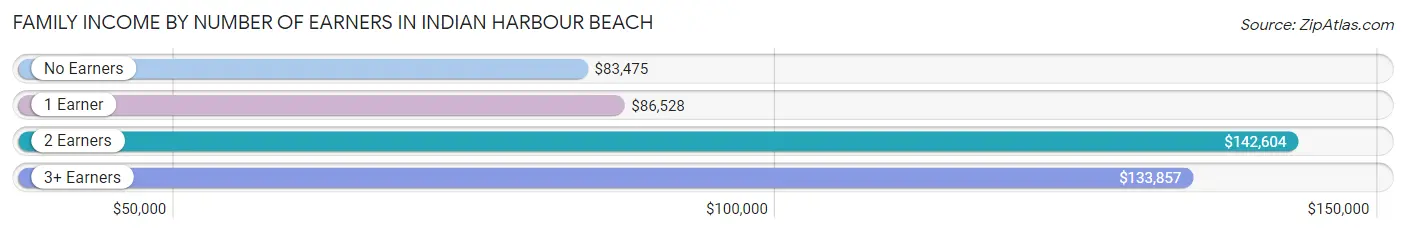
| Number of Earners | # Families | Median Income |
| No Earners | 659 (27.7%) | $83,475 |
| 1 Earner | 868 (36.5%) | $86,528 |
| 2 Earners | 745 (31.3%) | $142,604 |
| 3+ Earners | 106 (4.5%) | $133,857 |
| Total | 2,378 (100.0%) | $113,250 |
Household Income in Indian Harbour Beach
Household Income Brackets in Indian Harbour Beach
With 692 households falling in the category, the $50,000 to $74,999 income range is the most frequent in Indian Harbour Beach, accounting for 18.2% of all households. In contrast, only 87 households (2.3%) fall into the less than $10,000 income bracket, making it the least populous group.
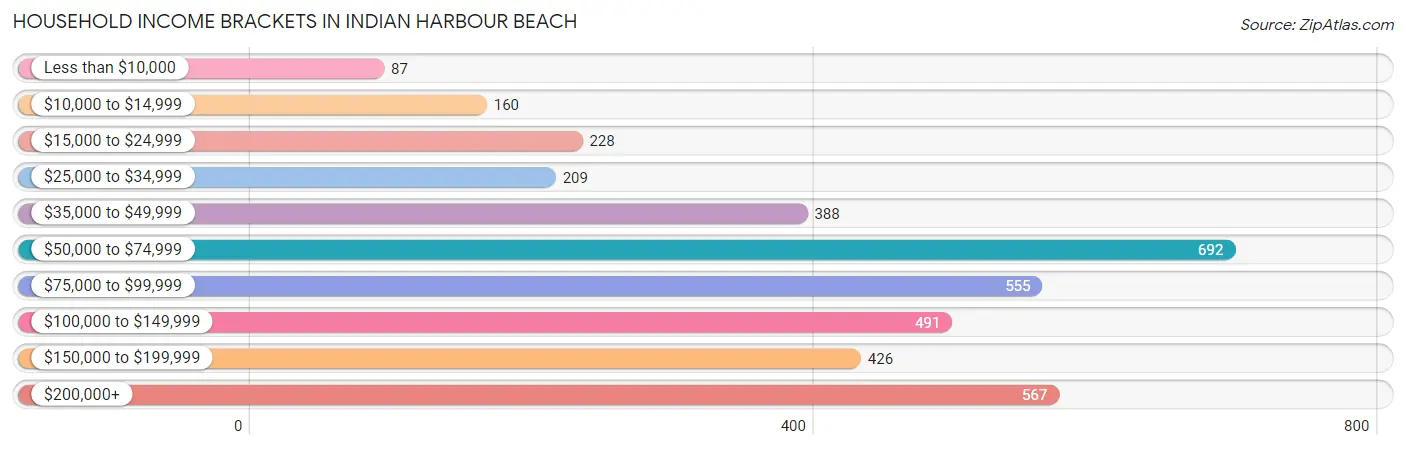
| Income Bracket | # Households | % Households |
| Less than $10,000 | 87 | 2.3% |
| $10,000 to $14,999 | 160 | 4.2% |
| $15,000 to $24,999 | 228 | 6.0% |
| $25,000 to $34,999 | 209 | 5.5% |
| $35,000 to $49,999 | 388 | 10.2% |
| $50,000 to $74,999 | 692 | 18.2% |
| $75,000 to $99,999 | 555 | 14.6% |
| $100,000 to $149,999 | 491 | 12.9% |
| $150,000 to $199,999 | 426 | 11.2% |
| $200,000+ | 567 | 14.9% |
Household Income by Householder Age in Indian Harbour Beach
The median household income in Indian Harbour Beach is $78,774, with the highest median household income of $122,188 found in the 45 to 64 years age bracket for the primary householder. A total of 1,167 households (30.7%) fall into this category. Meanwhile, the 15 to 24 years age bracket for the primary householder has the lowest median household income of $59,936, with 106 households (2.8%) in this group.
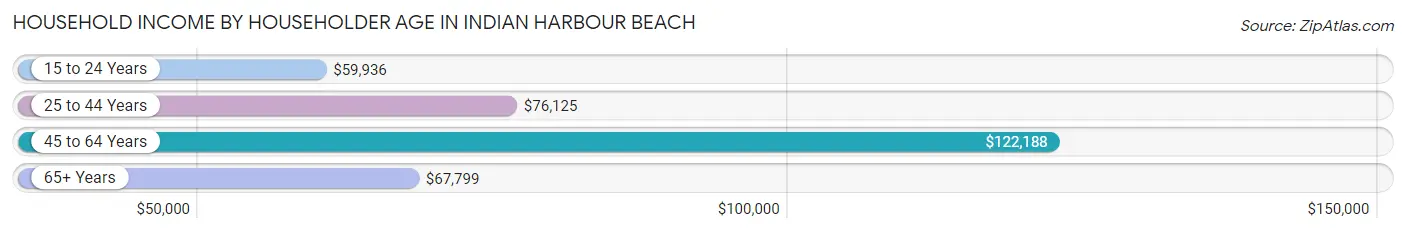
| Income Bracket | # Households | Median Income |
| 15 to 24 Years | 106 (2.8%) | $59,936 |
| 25 to 44 Years | 799 (21.0%) | $76,125 |
| 45 to 64 Years | 1,167 (30.7%) | $122,188 |
| 65+ Years | 1,731 (45.5%) | $67,799 |
| Total | 3,803 (100.0%) | $78,774 |
Poverty in Indian Harbour Beach
Income Below Poverty by Sex and Age in Indian Harbour Beach
With 14.8% poverty level for males and 15.3% for females among the residents of Indian Harbour Beach, under 5 year old males and 16 and 17 year old females are the most vulnerable to poverty, with 204 males (61.6%) and 92 females (92.0%) in their respective age groups living below the poverty level.
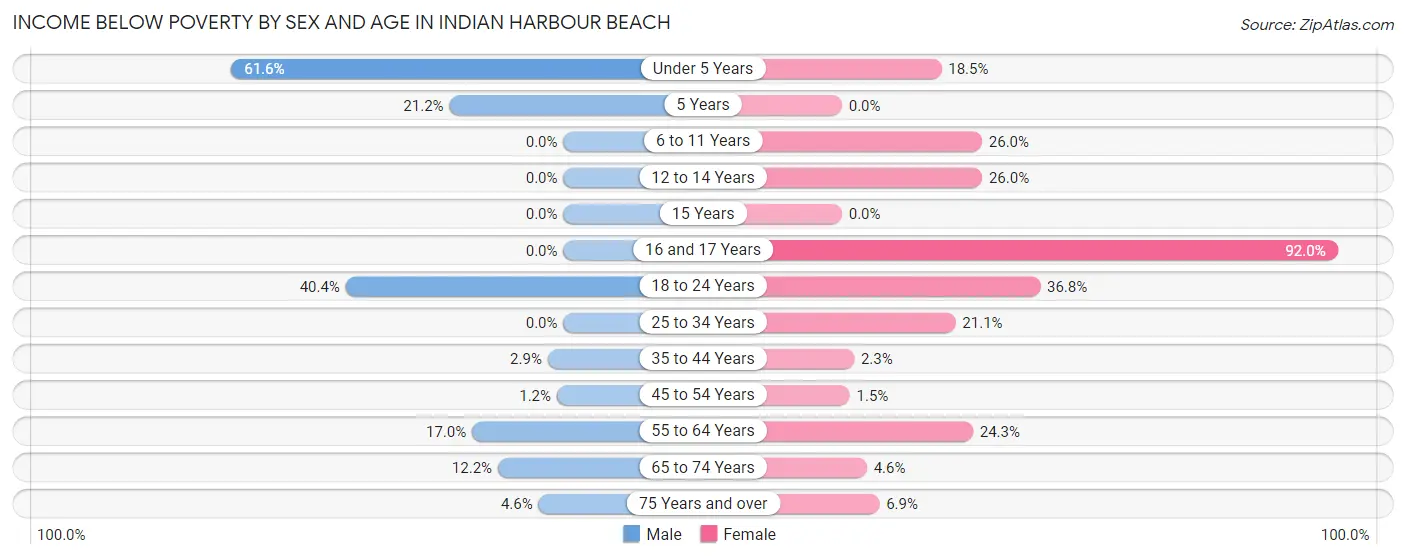
| Age Bracket | Male | Female |
| Under 5 Years | 204 (61.6%) | 12 (18.5%) |
| 5 Years | 11 (21.1%) | 0 (0.0%) |
| 6 to 11 Years | 0 (0.0%) | 91 (26.0%) |
| 12 to 14 Years | 0 (0.0%) | 51 (26.0%) |
| 15 Years | 0 (0.0%) | 0 (0.0%) |
| 16 and 17 Years | 0 (0.0%) | 92 (92.0%) |
| 18 to 24 Years | 204 (40.4%) | 99 (36.8%) |
| 25 to 34 Years | 0 (0.0%) | 89 (21.1%) |
| 35 to 44 Years | 12 (2.9%) | 9 (2.3%) |
| 45 to 54 Years | 6 (1.2%) | 9 (1.5%) |
| 55 to 64 Years | 89 (17.0%) | 167 (24.3%) |
| 65 to 74 Years | 105 (12.1%) | 38 (4.6%) |
| 75 Years and over | 20 (4.6%) | 35 (6.9%) |
| Total | 651 (14.8%) | 692 (15.3%) |
Income Above Poverty by Sex and Age in Indian Harbour Beach
According to the poverty statistics in Indian Harbour Beach, males aged 6 to 11 years and females aged 5 years are the age groups that are most secure financially, with 100.0% of males and 100.0% of females in these age groups living above the poverty line.
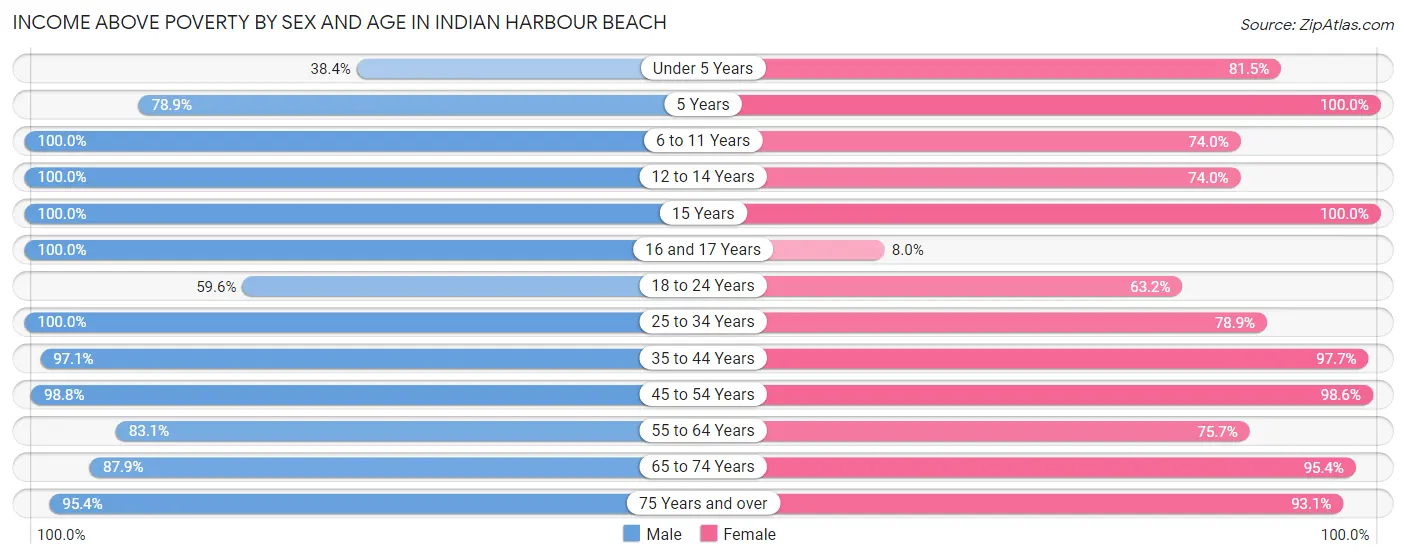
| Age Bracket | Male | Female |
| Under 5 Years | 127 (38.4%) | 53 (81.5%) |
| 5 Years | 41 (78.8%) | 18 (100.0%) |
| 6 to 11 Years | 238 (100.0%) | 259 (74.0%) |
| 12 to 14 Years | 262 (100.0%) | 145 (74.0%) |
| 15 Years | 7 (100.0%) | 69 (100.0%) |
| 16 and 17 Years | 115 (100.0%) | 8 (8.0%) |
| 18 to 24 Years | 301 (59.6%) | 170 (63.2%) |
| 25 to 34 Years | 148 (100.0%) | 333 (78.9%) |
| 35 to 44 Years | 402 (97.1%) | 390 (97.7%) |
| 45 to 54 Years | 492 (98.8%) | 611 (98.6%) |
| 55 to 64 Years | 436 (83.1%) | 520 (75.7%) |
| 65 to 74 Years | 759 (87.8%) | 784 (95.4%) |
| 75 Years and over | 415 (95.4%) | 469 (93.1%) |
| Total | 3,743 (85.2%) | 3,829 (84.7%) |
Income Below Poverty Among Married-Couple Families in Indian Harbour Beach
The poverty statistics for married-couple families in Indian Harbour Beach show that 9.2% or 187 of the total 2,024 families live below the poverty line. Families with 1 or 2 children have the highest poverty rate of 24.0%, comprising of 128 families. On the other hand, families with 3 or 4 children have the lowest poverty rate of 0.0%, which includes 0 families.
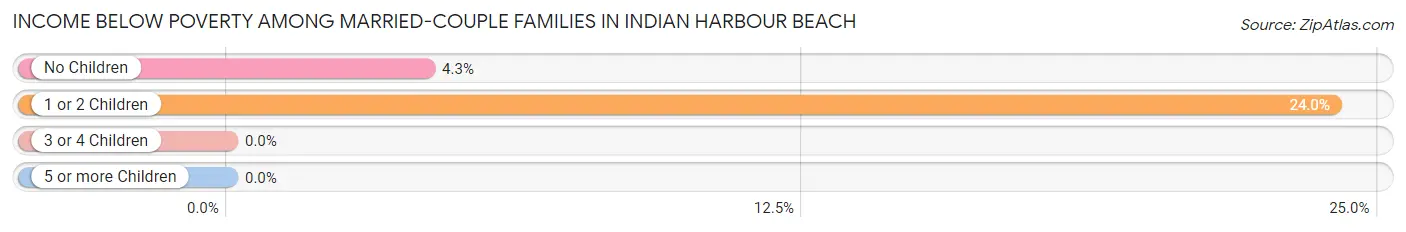
| Children | Above Poverty | Below Poverty |
| No Children | 1,315 (95.7%) | 59 (4.3%) |
| 1 or 2 Children | 405 (76.0%) | 128 (24.0%) |
| 3 or 4 Children | 117 (100.0%) | 0 (0.0%) |
| 5 or more Children | 0 (0.0%) | 0 (0.0%) |
| Total | 1,837 (90.8%) | 187 (9.2%) |
Income Below Poverty Among Single-Parent Households in Indian Harbour Beach
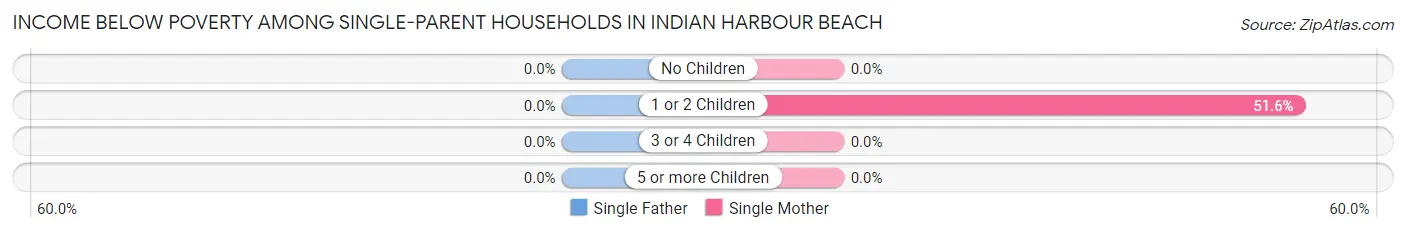
| Children | Single Father | Single Mother |
| No Children | 0 (0.0%) | 0 (0.0%) |
| 1 or 2 Children | 0 (0.0%) | 113 (51.6%) |
| 3 or 4 Children | 0 (0.0%) | 0 (0.0%) |
| 5 or more Children | 0 (0.0%) | 0 (0.0%) |
| Total | 0 (0.0%) | 113 (39.7%) |
Income Below Poverty Among Married-Couple vs Single-Parent Households in Indian Harbour Beach
The poverty data for Indian Harbour Beach shows that 187 of the married-couple family households (9.2%) and 113 of the single-parent households (31.9%) are living below the poverty level. Within the married-couple family households, those with 1 or 2 children have the highest poverty rate, with 128 households (24.0%) falling below the poverty line. Among the single-parent households, those with 1 or 2 children have the highest poverty rate, with 113 household (48.1%) living below poverty.
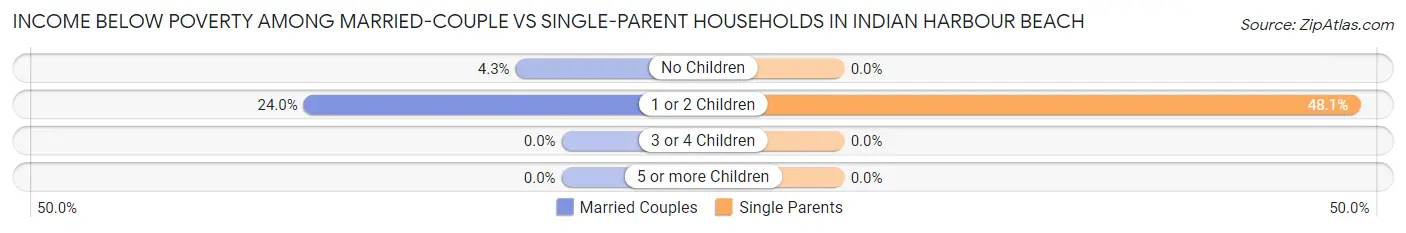
| Children | Married-Couple Families | Single-Parent Households |
| No Children | 59 (4.3%) | 0 (0.0%) |
| 1 or 2 Children | 128 (24.0%) | 113 (48.1%) |
| 3 or 4 Children | 0 (0.0%) | 0 (0.0%) |
| 5 or more Children | 0 (0.0%) | 0 (0.0%) |
| Total | 187 (9.2%) | 113 (31.9%) |
Employment Characteristics in Indian Harbour Beach
Employment by Class of Employer in Indian Harbour Beach
Among the 3,510 employed individuals in Indian Harbour Beach, private company employees (2,227 | 63.4%), self-employed (incorporated) (390 | 11.1%), and self-employed (not incorporated) (306 | 8.7%) make up the most common classes of employment.
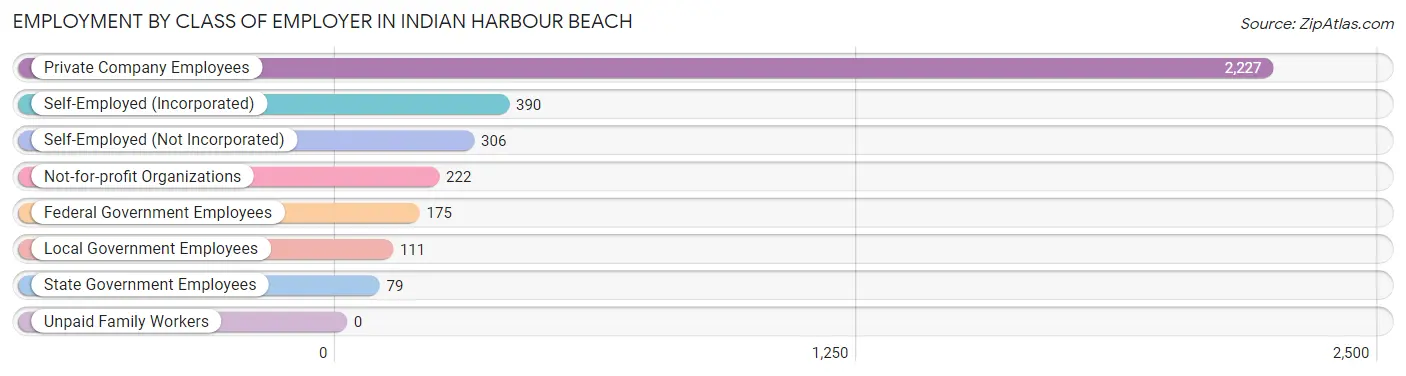
| Employer Class | # Employees | % Employees |
| Private Company Employees | 2,227 | 63.4% |
| Self-Employed (Incorporated) | 390 | 11.1% |
| Self-Employed (Not Incorporated) | 306 | 8.7% |
| Not-for-profit Organizations | 222 | 6.3% |
| Local Government Employees | 111 | 3.2% |
| State Government Employees | 79 | 2.2% |
| Federal Government Employees | 175 | 5.0% |
| Unpaid Family Workers | 0 | 0.0% |
| Total | 3,510 | 100.0% |
Employment Status by Age in Indian Harbour Beach
According to the labor force statistics for Indian Harbour Beach, out of the total population over 16 years of age (7,356), 51.1% or 3,759 individuals are in the labor force, with 4.3% or 162 of them unemployed. The age group with the highest labor force participation rate is 25 to 29 years, with 100.0% or 298 individuals in the labor force. Within the labor force, the 20 to 24 years age range has the highest percentage of unemployed individuals, with 14.7% or 65 of them being unemployed.
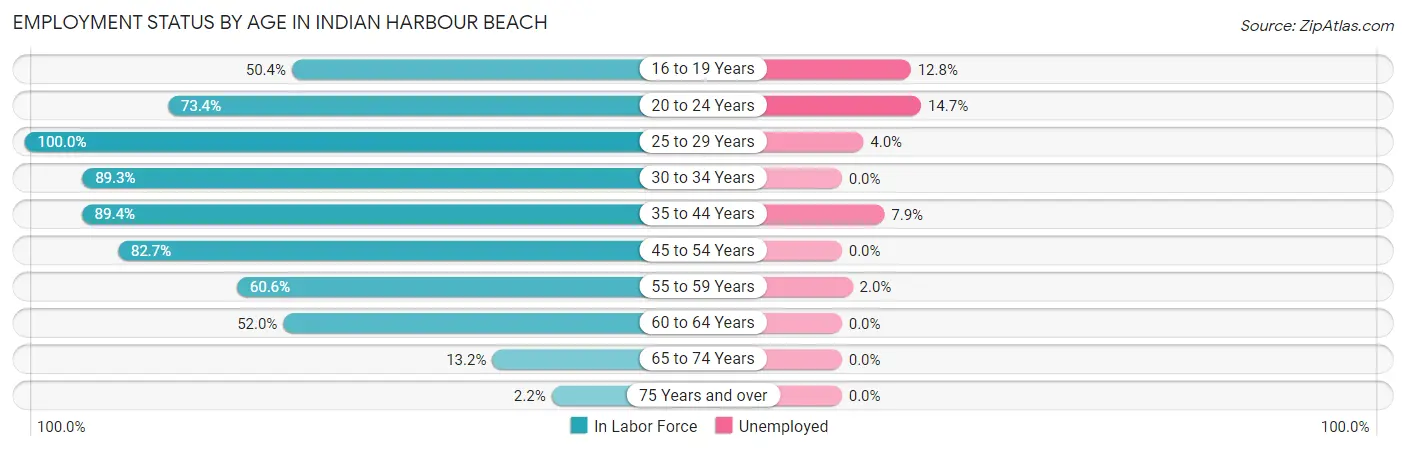
| Age Bracket | In Labor Force | Unemployed |
| 16 to 19 Years | 195 (50.4%) | 25 (12.8%) |
| 20 to 24 Years | 442 (73.4%) | 65 (14.7%) |
| 25 to 29 Years | 298 (100.0%) | 12 (4.0%) |
| 30 to 34 Years | 243 (89.3%) | 0 (0.0%) |
| 35 to 44 Years | 727 (89.4%) | 57 (7.9%) |
| 45 to 54 Years | 925 (82.7%) | 0 (0.0%) |
| 55 to 59 Years | 345 (60.6%) | 7 (2.0%) |
| 60 to 64 Years | 341 (52.0%) | 0 (0.0%) |
| 65 to 74 Years | 223 (13.2%) | 0 (0.0%) |
| 75 Years and over | 21 (2.2%) | 0 (0.0%) |
| Total | 3,759 (51.1%) | 162 (4.3%) |
Employment Status by Educational Attainment in Indian Harbour Beach
According to labor force statistics for Indian Harbour Beach, 77.3% of individuals (2,880) out of the total population between 25 and 64 years of age (3,726) are in the labor force, with 2.6% or 75 of them being unemployed. The group with the highest labor force participation rate are those with the educational attainment of bachelor's degree or higher, with 82.5% or 1,620 individuals in the labor force. Within the labor force, individuals with bachelor's degree or higher education have the highest percentage of unemployment, with 4.6% or 75 of them being unemployed.
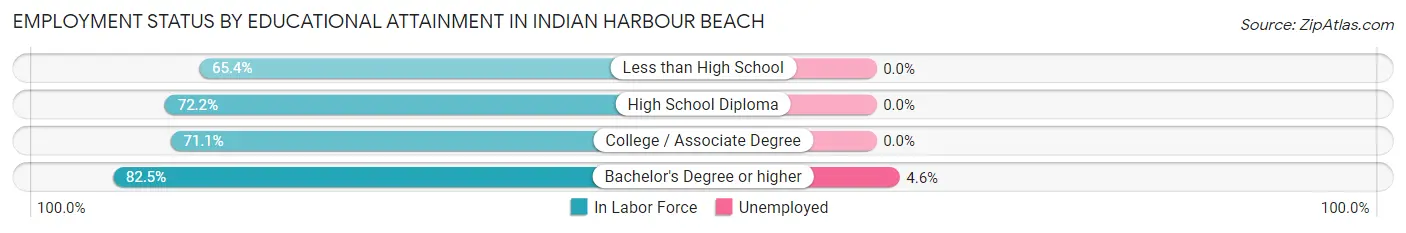
| Educational Attainment | In Labor Force | Unemployed |
| Less than High School | 17 (65.4%) | 0 (0.0%) |
| High School Diploma | 449 (72.2%) | 0 (0.0%) |
| College / Associate Degree | 792 (71.1%) | 0 (0.0%) |
| Bachelor's Degree or higher | 1,620 (82.5%) | 90 (4.6%) |
| Total | 2,880 (77.3%) | 97 (2.6%) |
Employment Occupations by Sex in Indian Harbour Beach
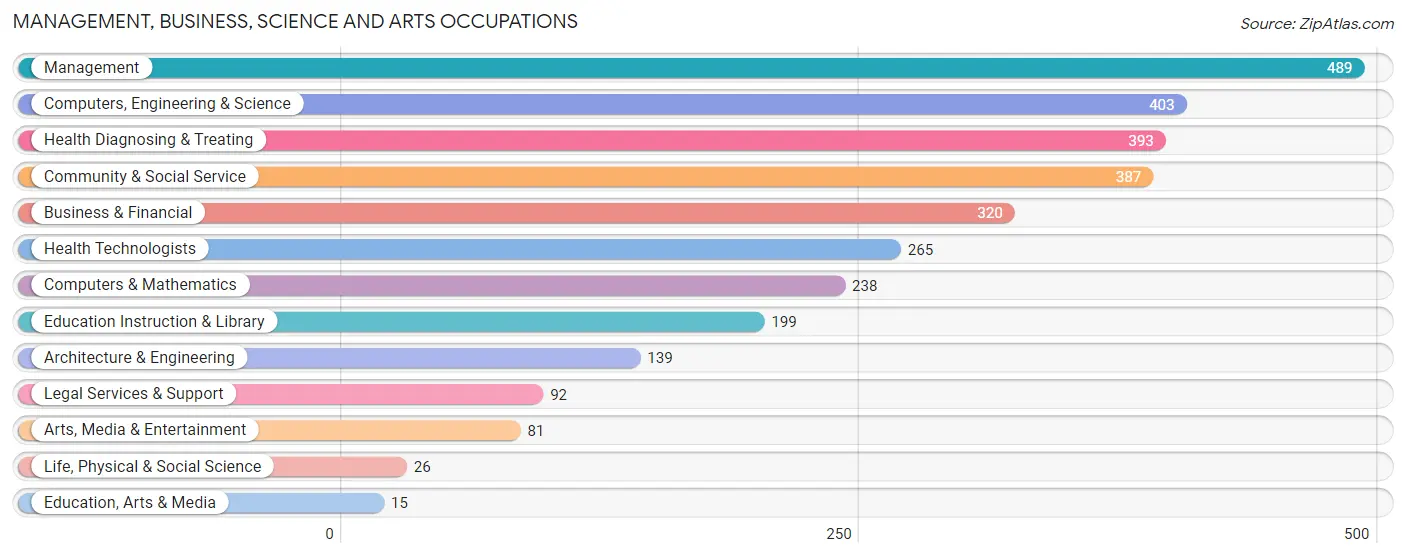
Management, Business, Science and Arts Occupations
The most common Management, Business, Science and Arts occupations in Indian Harbour Beach are Management (489 | 13.8%), Computers, Engineering & Science (403 | 11.4%), Health Diagnosing & Treating (393 | 11.1%), Community & Social Service (387 | 10.9%), and Business & Financial (320 | 9.0%).
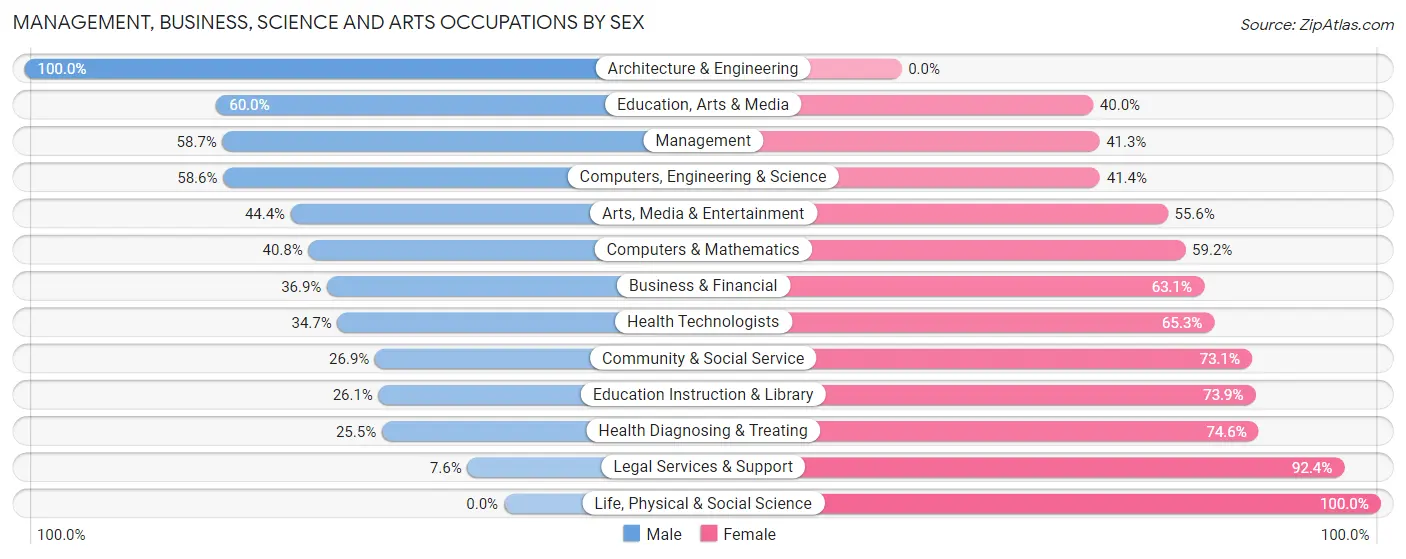
Management, Business, Science and Arts Occupations by Sex
Within the Management, Business, Science and Arts occupations in Indian Harbour Beach, the most male-oriented occupations are Architecture & Engineering (100.0%), Education, Arts & Media (60.0%), and Management (58.7%), while the most female-oriented occupations are Life, Physical & Social Science (100.0%), Legal Services & Support (92.4%), and Health Diagnosing & Treating (74.6%).
| Occupation | Male | Female |
| Management | 287 (58.7%) | 202 (41.3%) |
| Business & Financial | 118 (36.9%) | 202 (63.1%) |
| Computers, Engineering & Science | 236 (58.6%) | 167 (41.4%) |
| Computers & Mathematics | 97 (40.8%) | 141 (59.2%) |
| Architecture & Engineering | 139 (100.0%) | 0 (0.0%) |
| Life, Physical & Social Science | 0 (0.0%) | 26 (100.0%) |
| Community & Social Service | 104 (26.9%) | 283 (73.1%) |
| Education, Arts & Media | 9 (60.0%) | 6 (40.0%) |
| Legal Services & Support | 7 (7.6%) | 85 (92.4%) |
| Education Instruction & Library | 52 (26.1%) | 147 (73.9%) |
| Arts, Media & Entertainment | 36 (44.4%) | 45 (55.6%) |
| Health Diagnosing & Treating | 100 (25.5%) | 293 (74.6%) |
| Health Technologists | 92 (34.7%) | 173 (65.3%) |
| Total (Category) | 845 (42.4%) | 1,147 (57.6%) |
| Total (Overall) | 1,822 (51.4%) | 1,722 (48.6%) |
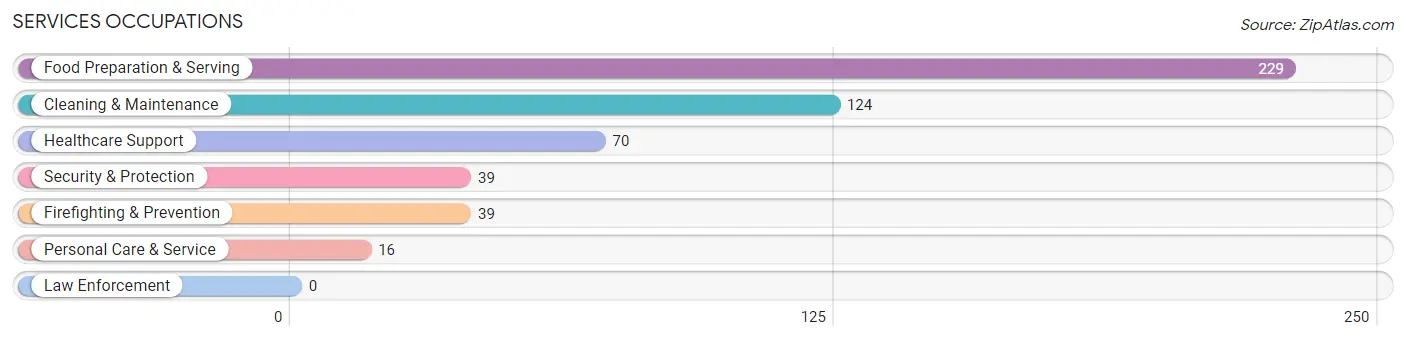
Services Occupations
The most common Services occupations in Indian Harbour Beach are Food Preparation & Serving (229 | 6.5%), Cleaning & Maintenance (124 | 3.5%), Healthcare Support (70 | 2.0%), Security & Protection (39 | 1.1%), and Firefighting & Prevention (39 | 1.1%).
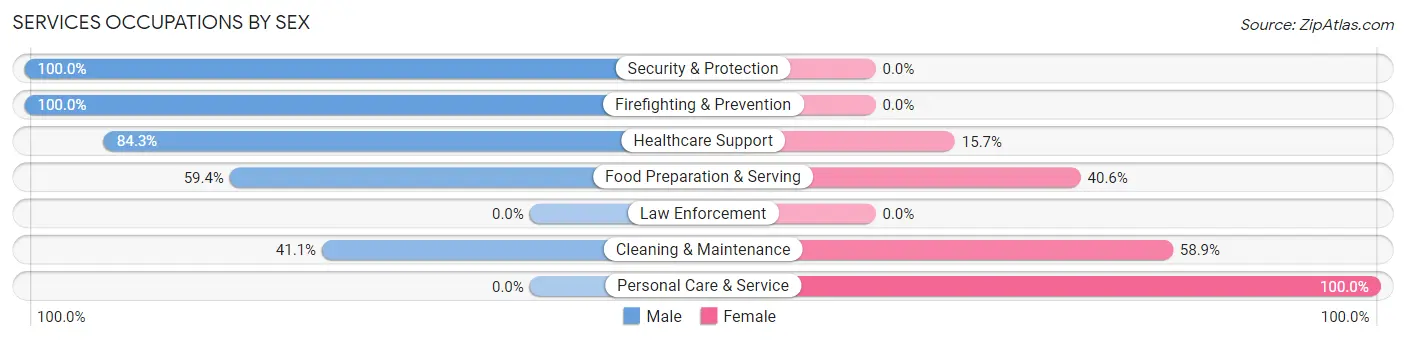
Services Occupations by Sex
Within the Services occupations in Indian Harbour Beach, the most male-oriented occupations are Security & Protection (100.0%), Firefighting & Prevention (100.0%), and Healthcare Support (84.3%), while the most female-oriented occupations are Personal Care & Service (100.0%), Cleaning & Maintenance (58.9%), and Food Preparation & Serving (40.6%).
| Occupation | Male | Female |
| Healthcare Support | 59 (84.3%) | 11 (15.7%) |
| Security & Protection | 39 (100.0%) | 0 (0.0%) |
| Firefighting & Prevention | 39 (100.0%) | 0 (0.0%) |
| Law Enforcement | 0 (0.0%) | 0 (0.0%) |
| Food Preparation & Serving | 136 (59.4%) | 93 (40.6%) |
| Cleaning & Maintenance | 51 (41.1%) | 73 (58.9%) |
| Personal Care & Service | 0 (0.0%) | 16 (100.0%) |
| Total (Category) | 285 (59.6%) | 193 (40.4%) |
| Total (Overall) | 1,822 (51.4%) | 1,722 (48.6%) |
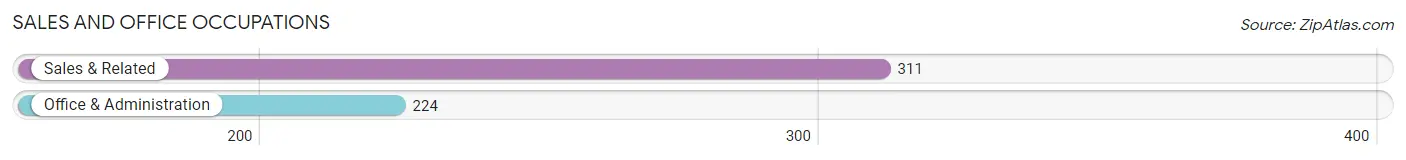
Sales and Office Occupations
The most common Sales and Office occupations in Indian Harbour Beach are Sales & Related (311 | 8.8%), and Office & Administration (224 | 6.3%).
Sales and Office Occupations by Sex
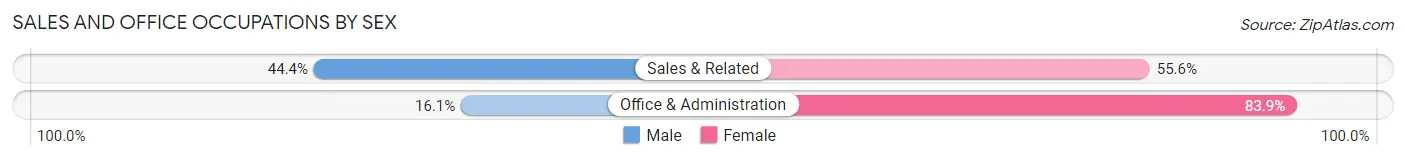
| Occupation | Male | Female |
| Sales & Related | 138 (44.4%) | 173 (55.6%) |
| Office & Administration | 36 (16.1%) | 188 (83.9%) |
| Total (Category) | 174 (32.5%) | 361 (67.5%) |
| Total (Overall) | 1,822 (51.4%) | 1,722 (48.6%) |
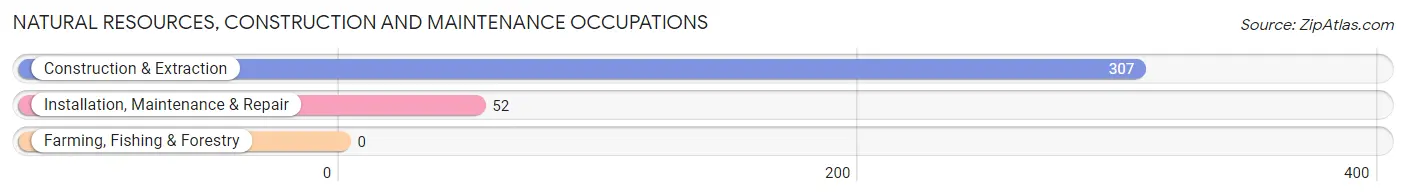
Natural Resources, Construction and Maintenance Occupations
The most common Natural Resources, Construction and Maintenance occupations in Indian Harbour Beach are Construction & Extraction (307 | 8.7%), and Installation, Maintenance & Repair (52 | 1.5%).
Natural Resources, Construction and Maintenance Occupations by Sex
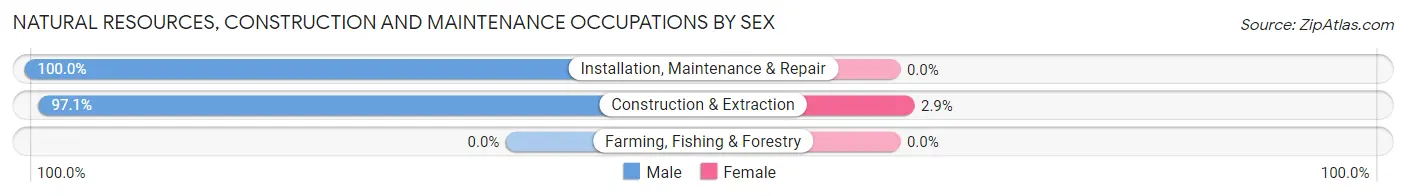
| Occupation | Male | Female |
| Farming, Fishing & Forestry | 0 (0.0%) | 0 (0.0%) |
| Construction & Extraction | 298 (97.1%) | 9 (2.9%) |
| Installation, Maintenance & Repair | 52 (100.0%) | 0 (0.0%) |
| Total (Category) | 350 (97.5%) | 9 (2.5%) |
| Total (Overall) | 1,822 (51.4%) | 1,722 (48.6%) |
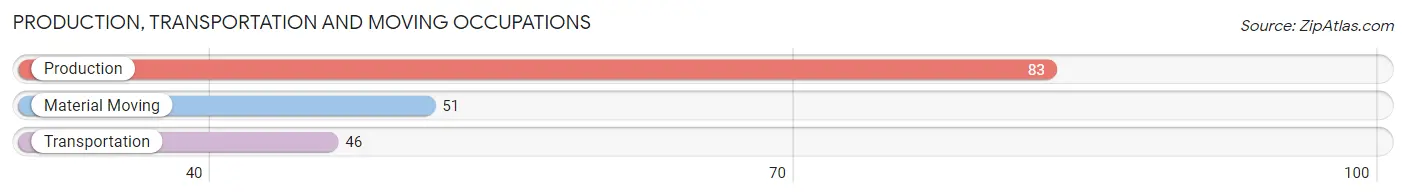
Production, Transportation and Moving Occupations
The most common Production, Transportation and Moving occupations in Indian Harbour Beach are Production (83 | 2.3%), Material Moving (51 | 1.4%), and Transportation (46 | 1.3%).
Production, Transportation and Moving Occupations by Sex
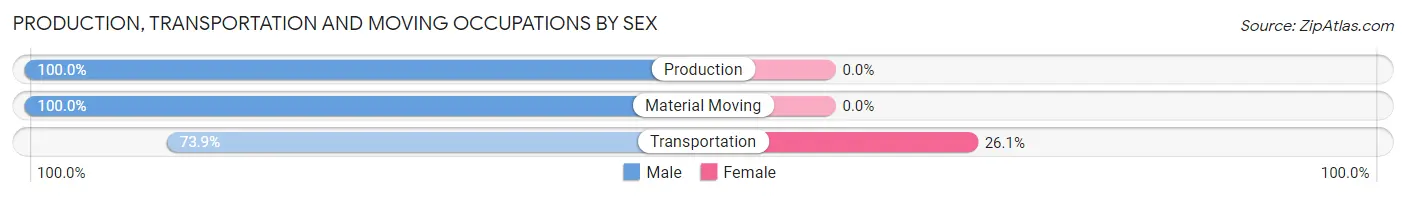
| Occupation | Male | Female |
| Production | 83 (100.0%) | 0 (0.0%) |
| Transportation | 34 (73.9%) | 12 (26.1%) |
| Material Moving | 51 (100.0%) | 0 (0.0%) |
| Total (Category) | 168 (93.3%) | 12 (6.7%) |
| Total (Overall) | 1,822 (51.4%) | 1,722 (48.6%) |
Employment Industries by Sex in Indian Harbour Beach
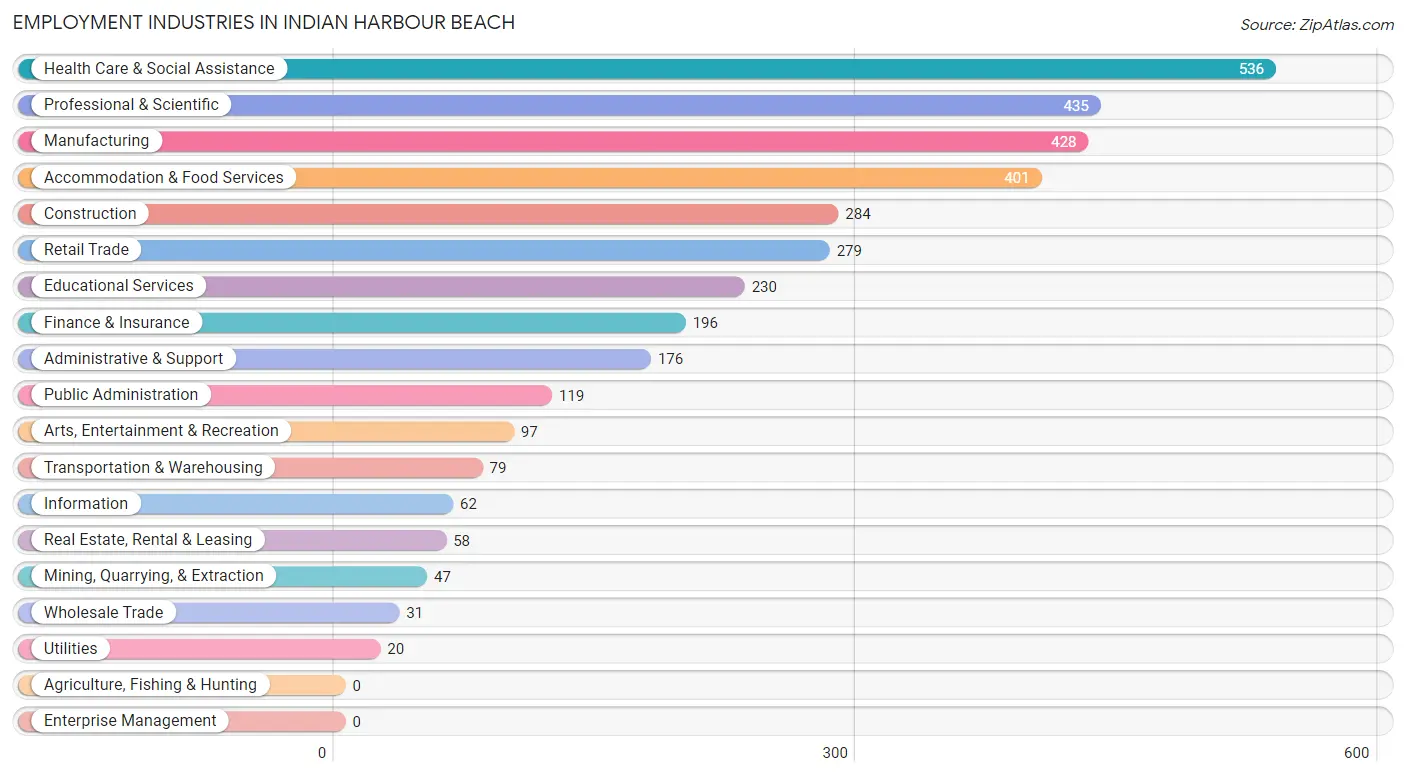
Employment Industries in Indian Harbour Beach
The major employment industries in Indian Harbour Beach include Health Care & Social Assistance (536 | 15.1%), Professional & Scientific (435 | 12.3%), Manufacturing (428 | 12.1%), Accommodation & Food Services (401 | 11.3%), and Construction (284 | 8.0%).
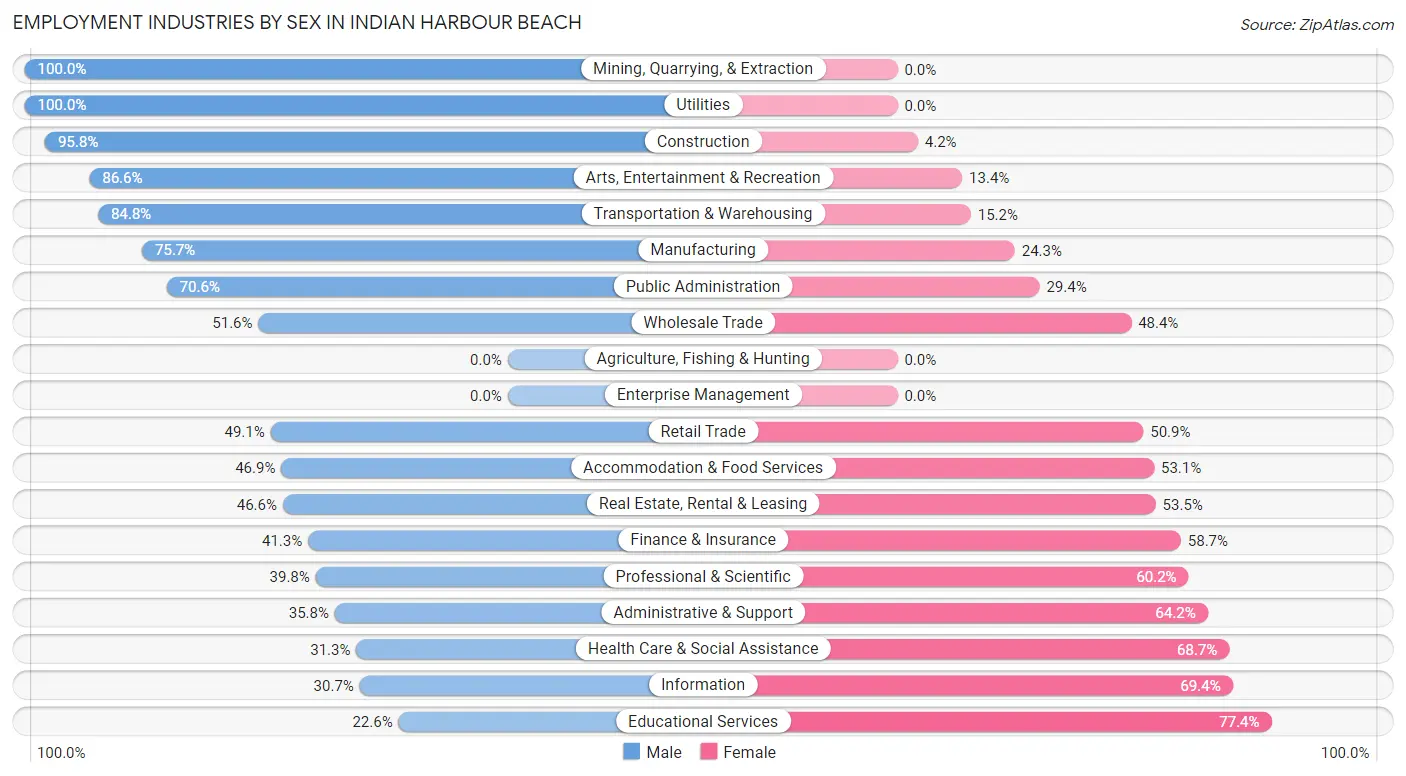
Employment Industries by Sex in Indian Harbour Beach
The Indian Harbour Beach industries that see more men than women are Mining, Quarrying, & Extraction (100.0%), Utilities (100.0%), and Construction (95.8%), whereas the industries that tend to have a higher number of women are Educational Services (77.4%), Information (69.4%), and Health Care & Social Assistance (68.7%).
| Industry | Male | Female |
| Agriculture, Fishing & Hunting | 0 (0.0%) | 0 (0.0%) |
| Mining, Quarrying, & Extraction | 47 (100.0%) | 0 (0.0%) |
| Construction | 272 (95.8%) | 12 (4.2%) |
| Manufacturing | 324 (75.7%) | 104 (24.3%) |
| Wholesale Trade | 16 (51.6%) | 15 (48.4%) |
| Retail Trade | 137 (49.1%) | 142 (50.9%) |
| Transportation & Warehousing | 67 (84.8%) | 12 (15.2%) |
| Utilities | 20 (100.0%) | 0 (0.0%) |
| Information | 19 (30.6%) | 43 (69.4%) |
| Finance & Insurance | 81 (41.3%) | 115 (58.7%) |
| Real Estate, Rental & Leasing | 27 (46.6%) | 31 (53.4%) |
| Professional & Scientific | 173 (39.8%) | 262 (60.2%) |
| Enterprise Management | 0 (0.0%) | 0 (0.0%) |
| Administrative & Support | 63 (35.8%) | 113 (64.2%) |
| Educational Services | 52 (22.6%) | 178 (77.4%) |
| Health Care & Social Assistance | 168 (31.3%) | 368 (68.7%) |
| Arts, Entertainment & Recreation | 84 (86.6%) | 13 (13.4%) |
| Accommodation & Food Services | 188 (46.9%) | 213 (53.1%) |
| Public Administration | 84 (70.6%) | 35 (29.4%) |
| Total | 1,822 (51.4%) | 1,722 (48.6%) |
Education in Indian Harbour Beach
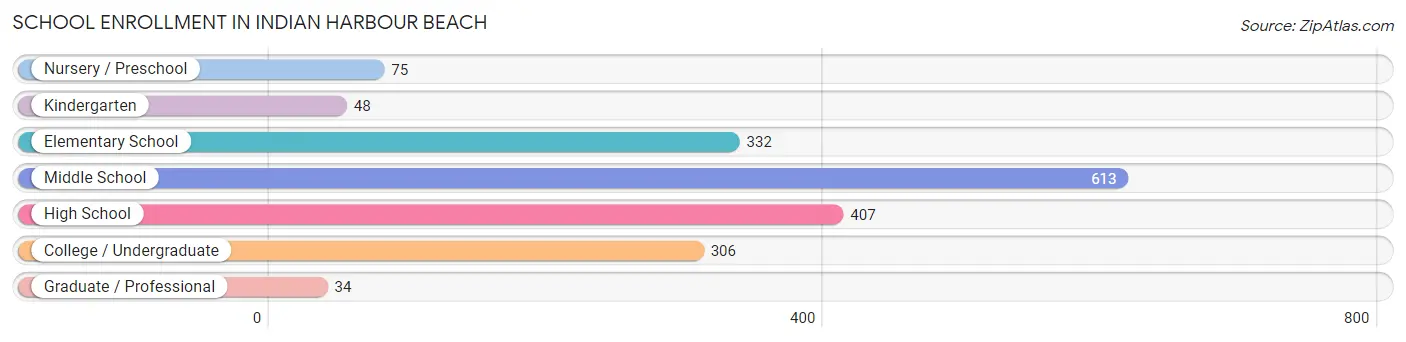
School Enrollment in Indian Harbour Beach
The most common levels of schooling among the 1,815 students in Indian Harbour Beach are middle school (613 | 33.8%), high school (407 | 22.4%), and elementary school (332 | 18.3%).
| School Level | # Students | % Students |
| Nursery / Preschool | 75 | 4.1% |
| Kindergarten | 48 | 2.6% |
| Elementary School | 332 | 18.3% |
| Middle School | 613 | 33.8% |
| High School | 407 | 22.4% |
| College / Undergraduate | 306 | 16.9% |
| Graduate / Professional | 34 | 1.9% |
| Total | 1,815 | 100.0% |
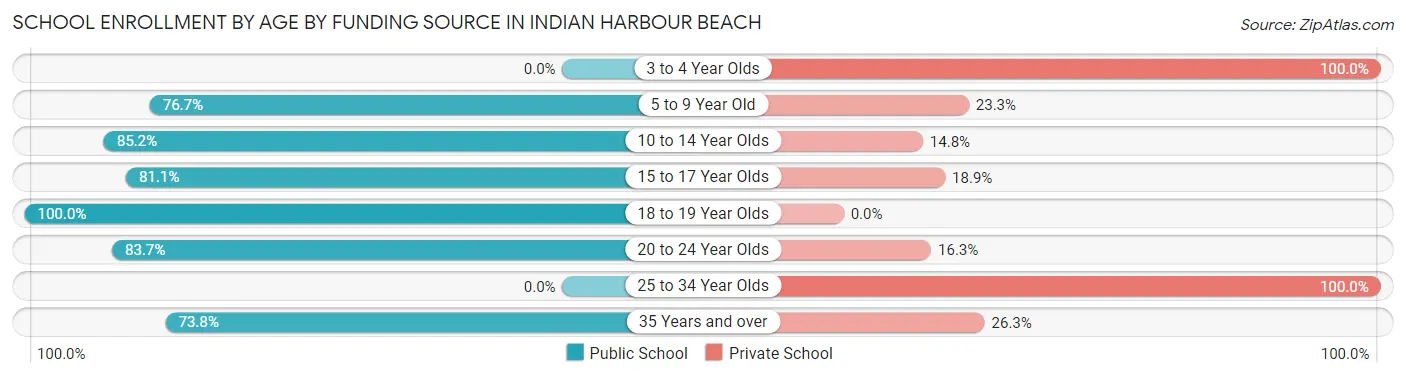
School Enrollment by Age by Funding Source in Indian Harbour Beach
Out of a total of 1,815 students who are enrolled in schools in Indian Harbour Beach, 327 (18.0%) attend a private institution, while the remaining 1,488 (82.0%) are enrolled in public schools. The age group of 3 to 4 year olds has the highest likelihood of being enrolled in private schools, with 23 (100.0% in the age bracket) enrolled. Conversely, the age group of 18 to 19 year olds has the lowest likelihood of being enrolled in a private school, with 140 (100.0% in the age bracket) attending a public institution.
| Age Bracket | Public School | Private School |
| 3 to 4 Year Olds | 0 (0.0%) | 23 (100.0%) |
| 5 to 9 Year Old | 240 (76.7%) | 73 (23.3%) |
| 10 to 14 Year Olds | 664 (85.2%) | 115 (14.8%) |
| 15 to 17 Year Olds | 236 (81.1%) | 55 (18.9%) |
| 18 to 19 Year Olds | 140 (100.0%) | 0 (0.0%) |
| 20 to 24 Year Olds | 149 (83.7%) | 29 (16.3%) |
| 25 to 34 Year Olds | 0 (0.0%) | 11 (100.0%) |
| 35 Years and over | 59 (73.8%) | 21 (26.3%) |
| Total | 1,488 (82.0%) | 327 (18.0%) |
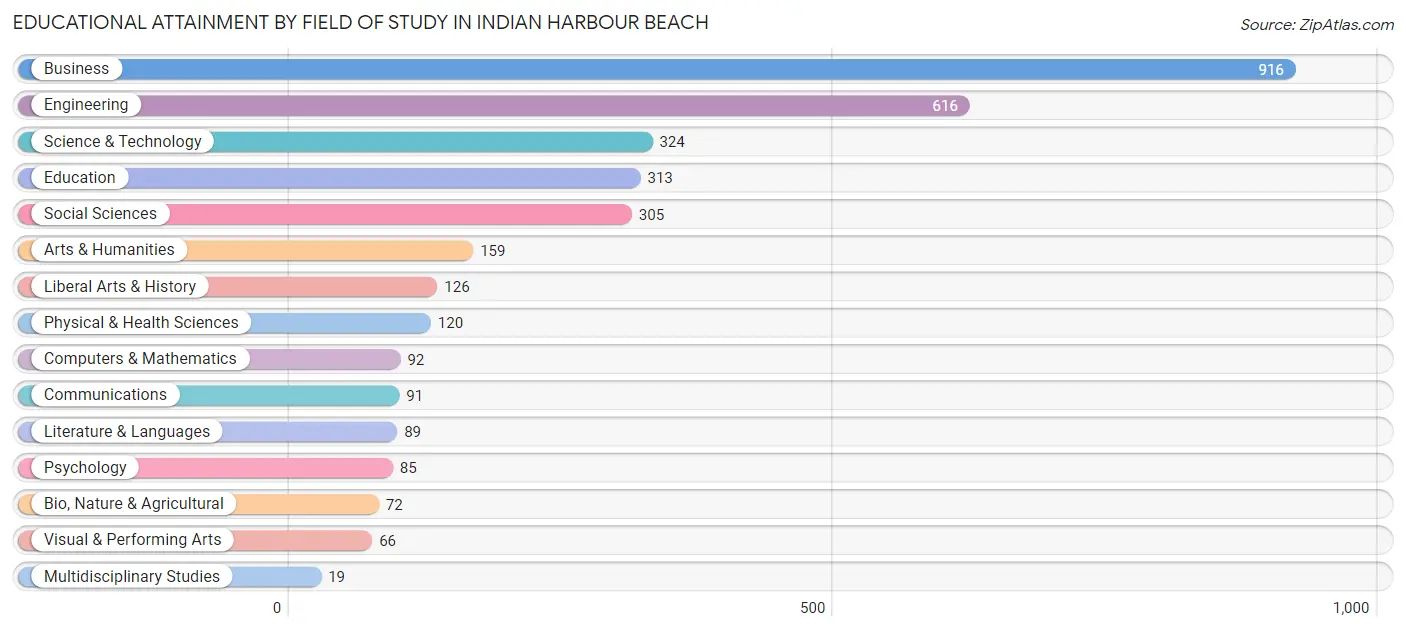
Educational Attainment by Field of Study in Indian Harbour Beach
Business (916 | 27.0%), engineering (616 | 18.2%), science & technology (324 | 9.6%), education (313 | 9.2%), and social sciences (305 | 9.0%) are the most common fields of study among 3,393 individuals in Indian Harbour Beach who have obtained a bachelor's degree or higher.
| Field of Study | # Graduates | % Graduates |
| Computers & Mathematics | 92 | 2.7% |
| Bio, Nature & Agricultural | 72 | 2.1% |
| Physical & Health Sciences | 120 | 3.5% |
| Psychology | 85 | 2.5% |
| Social Sciences | 305 | 9.0% |
| Engineering | 616 | 18.2% |
| Multidisciplinary Studies | 19 | 0.6% |
| Science & Technology | 324 | 9.6% |
| Business | 916 | 27.0% |
| Education | 313 | 9.2% |
| Literature & Languages | 89 | 2.6% |
| Liberal Arts & History | 126 | 3.7% |
| Visual & Performing Arts | 66 | 1.9% |
| Communications | 91 | 2.7% |
| Arts & Humanities | 159 | 4.7% |
| Total | 3,393 | 100.0% |
Transportation & Commute in Indian Harbour Beach
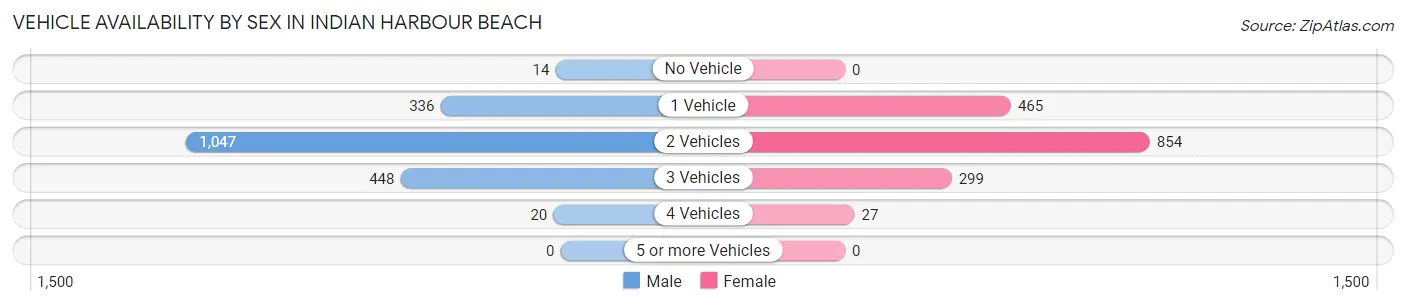
Vehicle Availability by Sex in Indian Harbour Beach
The most prevalent vehicle ownership categories in Indian Harbour Beach are males with 2 vehicles (1,047, accounting for 56.1%) and females with 2 vehicles (854, making up 63.6%).
| Vehicles Available | Male | Female |
| No Vehicle | 14 (0.7%) | 0 (0.0%) |
| 1 Vehicle | 336 (18.0%) | 465 (28.3%) |
| 2 Vehicles | 1,047 (56.1%) | 854 (51.9%) |
| 3 Vehicles | 448 (24.0%) | 299 (18.2%) |
| 4 Vehicles | 20 (1.1%) | 27 (1.6%) |
| 5 or more Vehicles | 0 (0.0%) | 0 (0.0%) |
| Total | 1,865 (100.0%) | 1,645 (100.0%) |
Commute Time in Indian Harbour Beach
The most frequently occuring commute durations in Indian Harbour Beach are 20 to 24 minutes (815 commuters, 26.0%), 15 to 19 minutes (547 commuters, 17.4%), and 10 to 14 minutes (343 commuters, 10.9%).
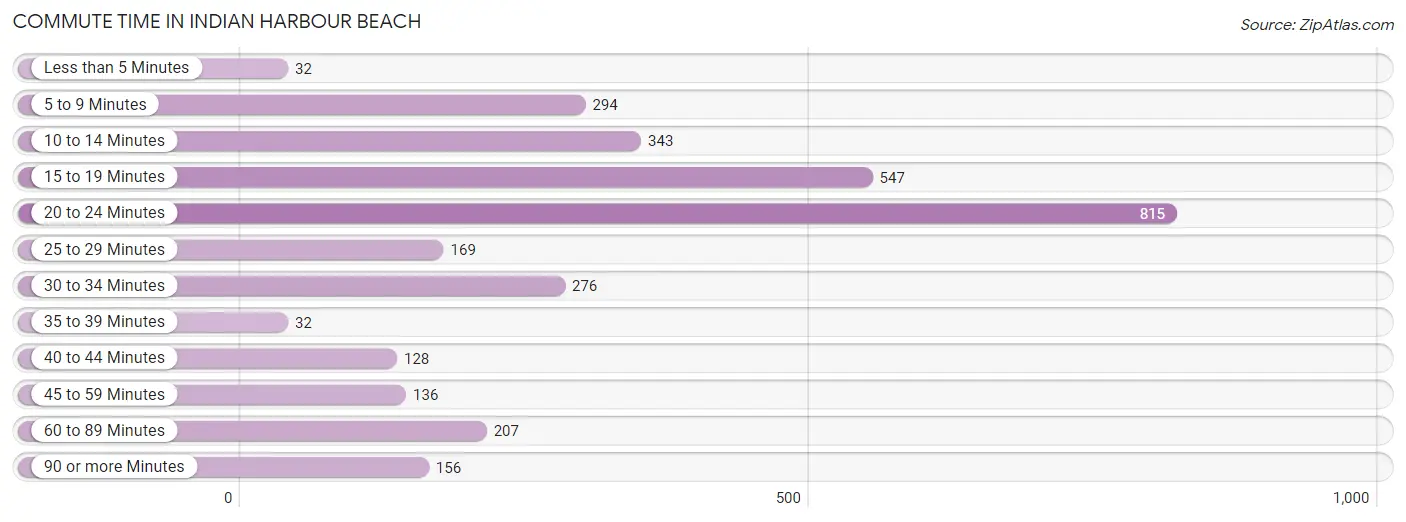
| Commute Time | # Commuters | % Commuters |
| Less than 5 Minutes | 32 | 1.0% |
| 5 to 9 Minutes | 294 | 9.4% |
| 10 to 14 Minutes | 343 | 10.9% |
| 15 to 19 Minutes | 547 | 17.4% |
| 20 to 24 Minutes | 815 | 26.0% |
| 25 to 29 Minutes | 169 | 5.4% |
| 30 to 34 Minutes | 276 | 8.8% |
| 35 to 39 Minutes | 32 | 1.0% |
| 40 to 44 Minutes | 128 | 4.1% |
| 45 to 59 Minutes | 136 | 4.3% |
| 60 to 89 Minutes | 207 | 6.6% |
| 90 or more Minutes | 156 | 5.0% |
Commute Time by Sex in Indian Harbour Beach
The most common commute times in Indian Harbour Beach are 20 to 24 minutes (364 commuters, 22.0%) for males and 20 to 24 minutes (451 commuters, 30.5%) for females.
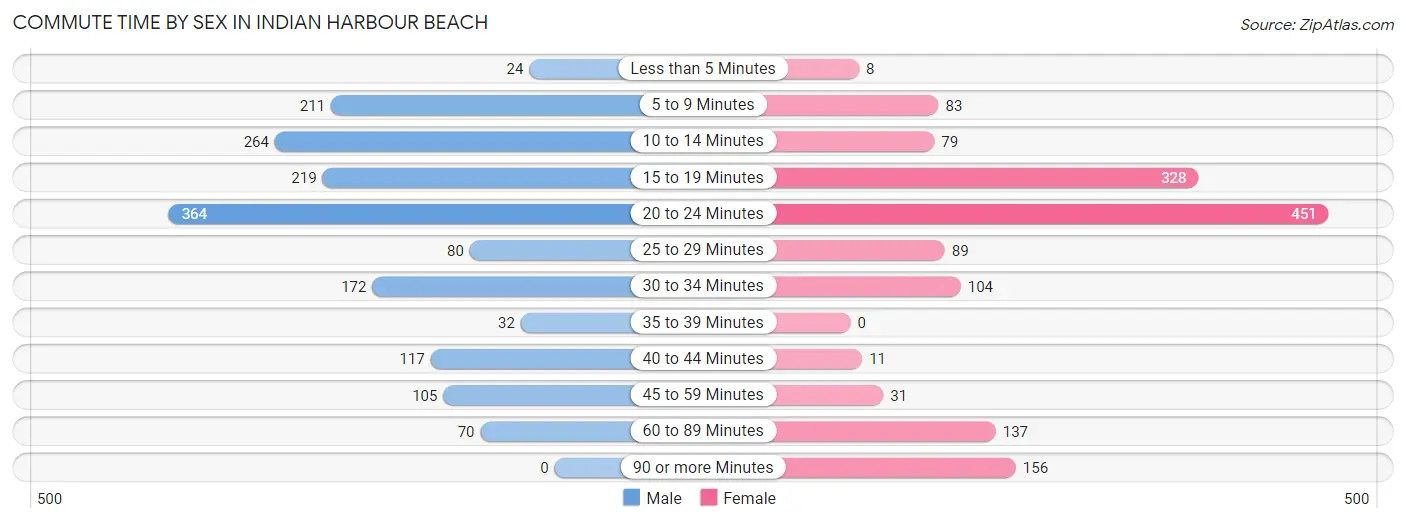
| Commute Time | Male | Female |
| Less than 5 Minutes | 24 (1.5%) | 8 (0.5%) |
| 5 to 9 Minutes | 211 (12.7%) | 83 (5.6%) |
| 10 to 14 Minutes | 264 (15.9%) | 79 (5.3%) |
| 15 to 19 Minutes | 219 (13.2%) | 328 (22.2%) |
| 20 to 24 Minutes | 364 (22.0%) | 451 (30.5%) |
| 25 to 29 Minutes | 80 (4.8%) | 89 (6.0%) |
| 30 to 34 Minutes | 172 (10.4%) | 104 (7.0%) |
| 35 to 39 Minutes | 32 (1.9%) | 0 (0.0%) |
| 40 to 44 Minutes | 117 (7.1%) | 11 (0.7%) |
| 45 to 59 Minutes | 105 (6.3%) | 31 (2.1%) |
| 60 to 89 Minutes | 70 (4.2%) | 137 (9.3%) |
| 90 or more Minutes | 0 (0.0%) | 156 (10.6%) |
Time of Departure to Work by Sex in Indian Harbour Beach
The most frequent times of departure to work in Indian Harbour Beach are 7:00 AM to 7:29 AM (333, 20.1%) for males and 8:00 AM to 8:29 AM (313, 21.2%) for females.
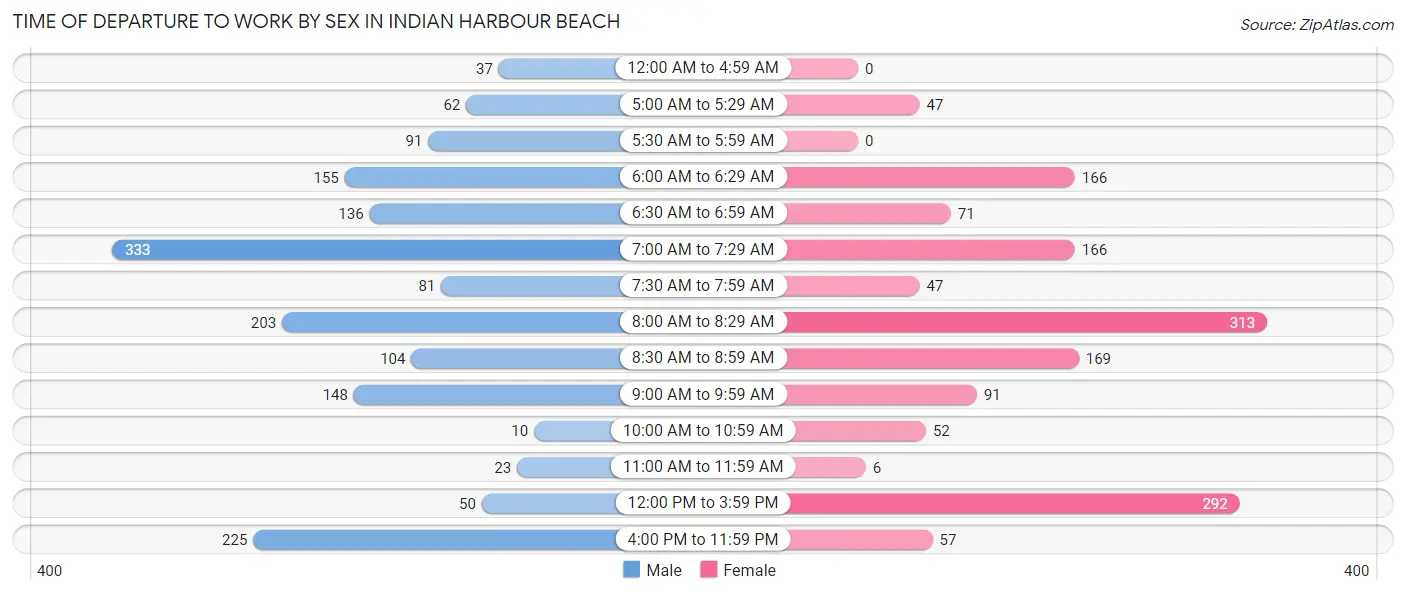
| Time of Departure | Male | Female |
| 12:00 AM to 4:59 AM | 37 (2.2%) | 0 (0.0%) |
| 5:00 AM to 5:29 AM | 62 (3.7%) | 47 (3.2%) |
| 5:30 AM to 5:59 AM | 91 (5.5%) | 0 (0.0%) |
| 6:00 AM to 6:29 AM | 155 (9.3%) | 166 (11.2%) |
| 6:30 AM to 6:59 AM | 136 (8.2%) | 71 (4.8%) |
| 7:00 AM to 7:29 AM | 333 (20.1%) | 166 (11.2%) |
| 7:30 AM to 7:59 AM | 81 (4.9%) | 47 (3.2%) |
| 8:00 AM to 8:29 AM | 203 (12.2%) | 313 (21.2%) |
| 8:30 AM to 8:59 AM | 104 (6.3%) | 169 (11.4%) |
| 9:00 AM to 9:59 AM | 148 (8.9%) | 91 (6.2%) |
| 10:00 AM to 10:59 AM | 10 (0.6%) | 52 (3.5%) |
| 11:00 AM to 11:59 AM | 23 (1.4%) | 6 (0.4%) |
| 12:00 PM to 3:59 PM | 50 (3.0%) | 292 (19.8%) |
| 4:00 PM to 11:59 PM | 225 (13.6%) | 57 (3.9%) |
| Total | 1,658 (100.0%) | 1,477 (100.0%) |
Housing Occupancy in Indian Harbour Beach
Occupancy by Ownership in Indian Harbour Beach
Of the total 3,803 dwellings in Indian Harbour Beach, owner-occupied units account for 2,867 (75.4%), while renter-occupied units make up 936 (24.6%).
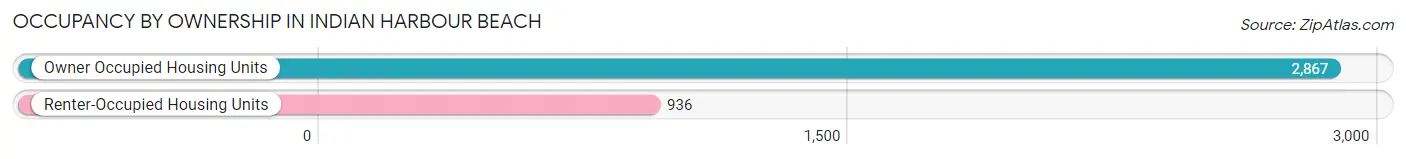
| Occupancy | # Housing Units | % Housing Units |
| Owner Occupied Housing Units | 2,867 | 75.4% |
| Renter-Occupied Housing Units | 936 | 24.6% |
| Total Occupied Housing Units | 3,803 | 100.0% |
Occupancy by Household Size in Indian Harbour Beach
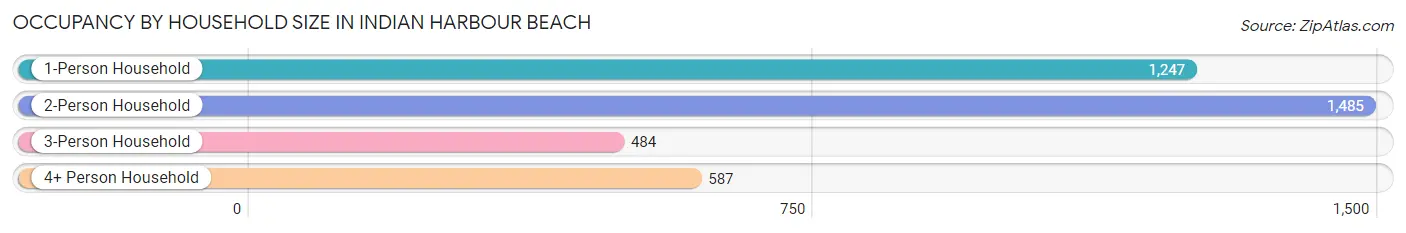
| Household Size | # Housing Units | % Housing Units |
| 1-Person Household | 1,247 | 32.8% |
| 2-Person Household | 1,485 | 39.1% |
| 3-Person Household | 484 | 12.7% |
| 4+ Person Household | 587 | 15.4% |
| Total Housing Units | 3,803 | 100.0% |
Occupancy by Ownership by Household Size in Indian Harbour Beach
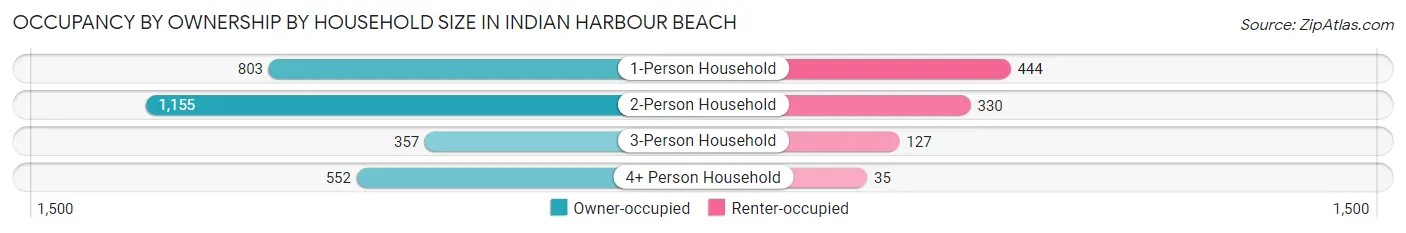
| Household Size | Owner-occupied | Renter-occupied |
| 1-Person Household | 803 (64.4%) | 444 (35.6%) |
| 2-Person Household | 1,155 (77.8%) | 330 (22.2%) |
| 3-Person Household | 357 (73.8%) | 127 (26.2%) |
| 4+ Person Household | 552 (94.0%) | 35 (6.0%) |
| Total Housing Units | 2,867 (75.4%) | 936 (24.6%) |
Occupancy by Educational Attainment in Indian Harbour Beach
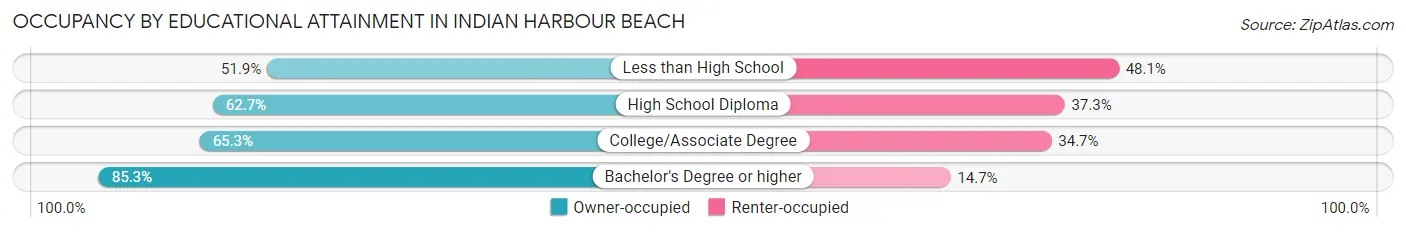
| Household Size | Owner-occupied | Renter-occupied |
| Less than High School | 27 (51.9%) | 25 (48.1%) |
| High School Diploma | 240 (62.7%) | 143 (37.3%) |
| College/Associate Degree | 887 (65.3%) | 472 (34.7%) |
| Bachelor's Degree or higher | 1,713 (85.3%) | 296 (14.7%) |
Occupancy by Age of Householder in Indian Harbour Beach
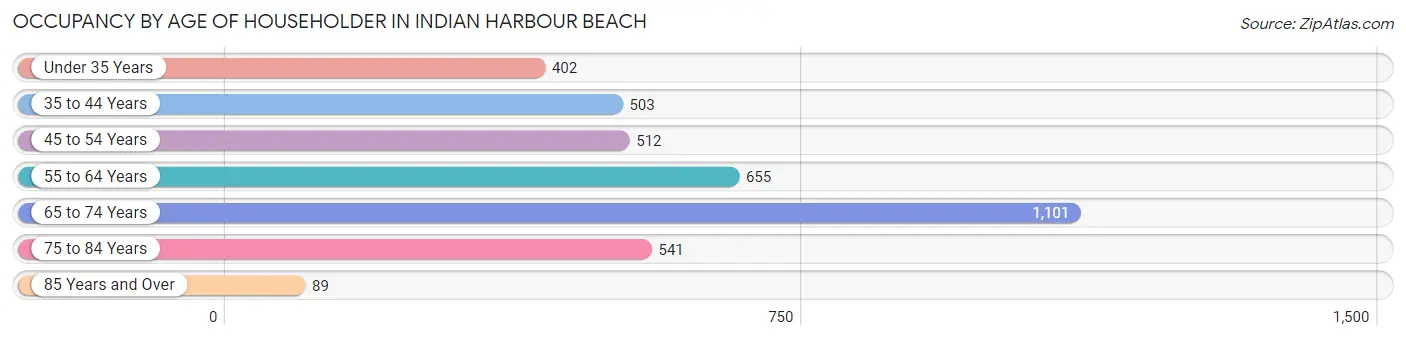
| Age Bracket | # Households | % Households |
| Under 35 Years | 402 | 10.6% |
| 35 to 44 Years | 503 | 13.2% |
| 45 to 54 Years | 512 | 13.5% |
| 55 to 64 Years | 655 | 17.2% |
| 65 to 74 Years | 1,101 | 28.9% |
| 75 to 84 Years | 541 | 14.2% |
| 85 Years and Over | 89 | 2.3% |
| Total | 3,803 | 100.0% |
Housing Finances in Indian Harbour Beach
Median Income by Occupancy in Indian Harbour Beach
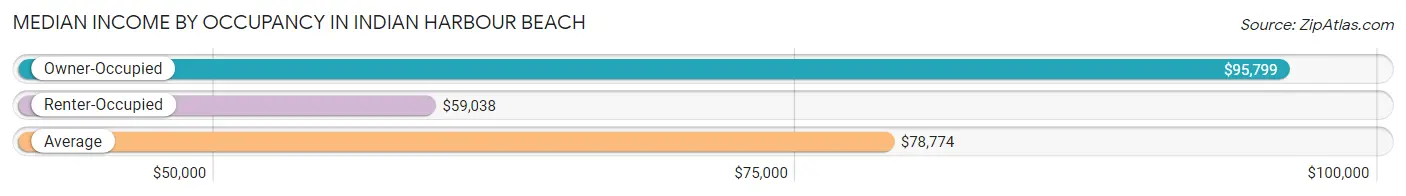
| Occupancy Type | # Households | Median Income |
| Owner-Occupied | 2,867 (75.4%) | $95,799 |
| Renter-Occupied | 936 (24.6%) | $59,038 |
| Average | 3,803 (100.0%) | $78,774 |
Occupancy by Householder Income Bracket in Indian Harbour Beach
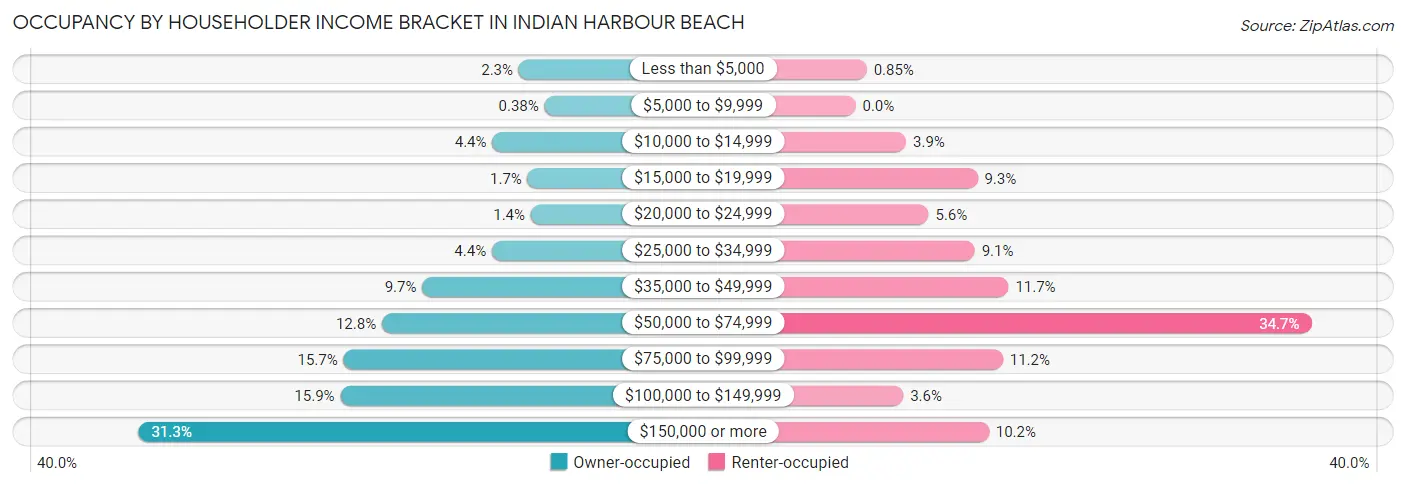
| Income Bracket | Owner-occupied | Renter-occupied |
| Less than $5,000 | 67 (2.3%) | 8 (0.9%) |
| $5,000 to $9,999 | 11 (0.4%) | 0 (0.0%) |
| $10,000 to $14,999 | 125 (4.4%) | 36 (3.8%) |
| $15,000 to $19,999 | 48 (1.7%) | 87 (9.3%) |
| $20,000 to $24,999 | 41 (1.4%) | 52 (5.6%) |
| $25,000 to $34,999 | 126 (4.4%) | 85 (9.1%) |
| $35,000 to $49,999 | 278 (9.7%) | 109 (11.7%) |
| $50,000 to $74,999 | 366 (12.8%) | 325 (34.7%) |
| $75,000 to $99,999 | 450 (15.7%) | 105 (11.2%) |
| $100,000 to $149,999 | 457 (15.9%) | 34 (3.6%) |
| $150,000 or more | 898 (31.3%) | 95 (10.2%) |
| Total | 2,867 (100.0%) | 936 (100.0%) |
Monthly Housing Cost Tiers in Indian Harbour Beach
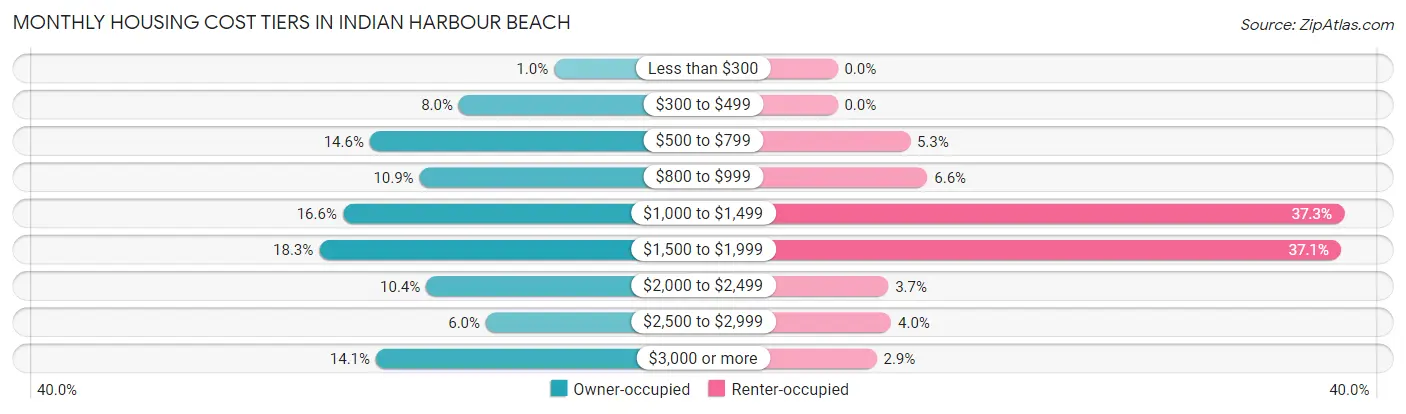
| Monthly Cost | Owner-occupied | Renter-occupied |
| Less than $300 | 29 (1.0%) | 0 (0.0%) |
| $300 to $499 | 230 (8.0%) | 0 (0.0%) |
| $500 to $799 | 418 (14.6%) | 50 (5.3%) |
| $800 to $999 | 313 (10.9%) | 62 (6.6%) |
| $1,000 to $1,499 | 475 (16.6%) | 349 (37.3%) |
| $1,500 to $1,999 | 525 (18.3%) | 347 (37.1%) |
| $2,000 to $2,499 | 299 (10.4%) | 35 (3.7%) |
| $2,500 to $2,999 | 173 (6.0%) | 37 (4.0%) |
| $3,000 or more | 405 (14.1%) | 27 (2.9%) |
| Total | 2,867 (100.0%) | 936 (100.0%) |
Physical Housing Characteristics in Indian Harbour Beach
Housing Structures in Indian Harbour Beach
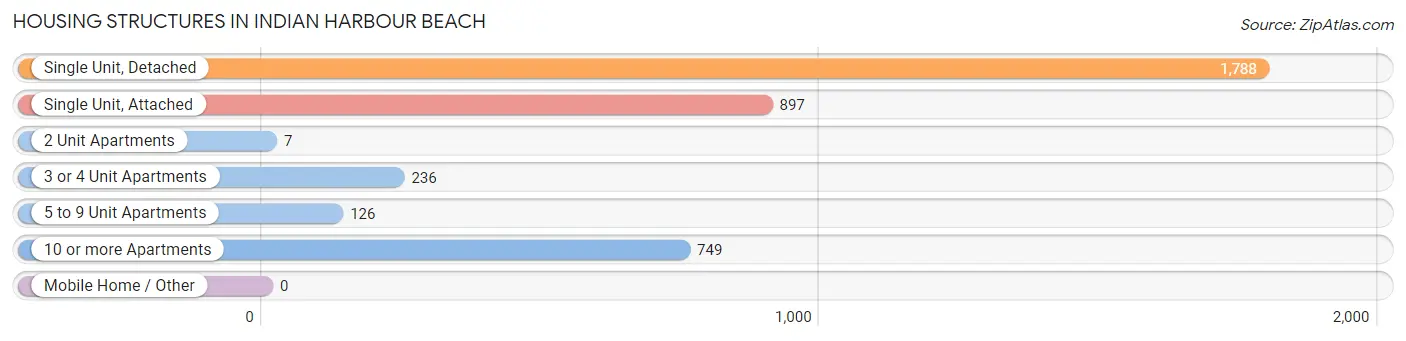
| Structure Type | # Housing Units | % Housing Units |
| Single Unit, Detached | 1,788 | 47.0% |
| Single Unit, Attached | 897 | 23.6% |
| 2 Unit Apartments | 7 | 0.2% |
| 3 or 4 Unit Apartments | 236 | 6.2% |
| 5 to 9 Unit Apartments | 126 | 3.3% |
| 10 or more Apartments | 749 | 19.7% |
| Mobile Home / Other | 0 | 0.0% |
| Total | 3,803 | 100.0% |
Housing Structures by Occupancy in Indian Harbour Beach
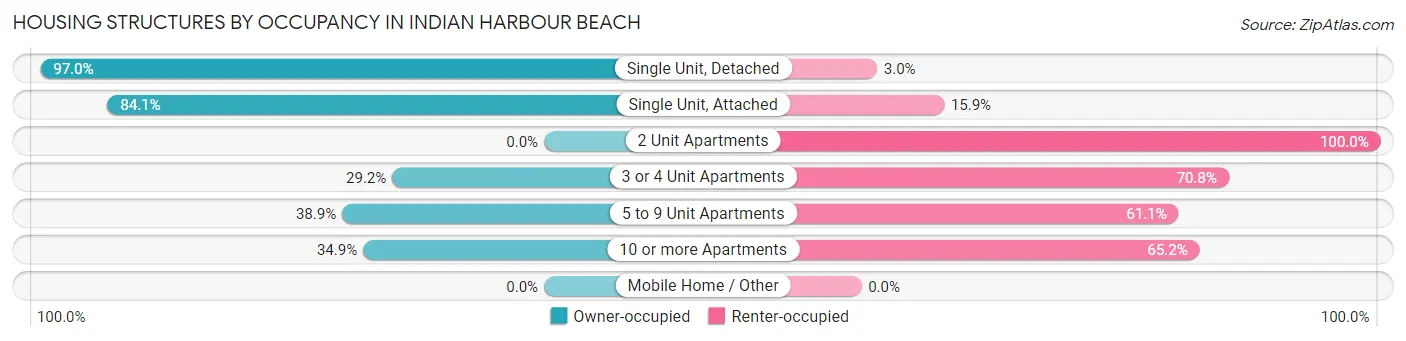
| Structure Type | Owner-occupied | Renter-occupied |
| Single Unit, Detached | 1,734 (97.0%) | 54 (3.0%) |
| Single Unit, Attached | 754 (84.1%) | 143 (15.9%) |
| 2 Unit Apartments | 0 (0.0%) | 7 (100.0%) |
| 3 or 4 Unit Apartments | 69 (29.2%) | 167 (70.8%) |
| 5 to 9 Unit Apartments | 49 (38.9%) | 77 (61.1%) |
| 10 or more Apartments | 261 (34.8%) | 488 (65.1%) |
| Mobile Home / Other | 0 (0.0%) | 0 (0.0%) |
| Total | 2,867 (75.4%) | 936 (24.6%) |
Housing Structures by Number of Rooms in Indian Harbour Beach
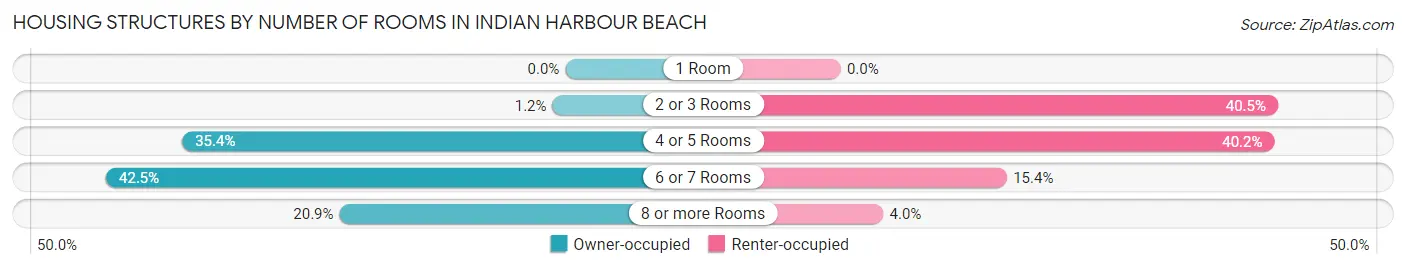
| Number of Rooms | Owner-occupied | Renter-occupied |
| 1 Room | 0 (0.0%) | 0 (0.0%) |
| 2 or 3 Rooms | 34 (1.2%) | 379 (40.5%) |
| 4 or 5 Rooms | 1,016 (35.4%) | 376 (40.2%) |
| 6 or 7 Rooms | 1,218 (42.5%) | 144 (15.4%) |
| 8 or more Rooms | 599 (20.9%) | 37 (4.0%) |
| Total | 2,867 (100.0%) | 936 (100.0%) |
Housing Structure by Heating Type in Indian Harbour Beach
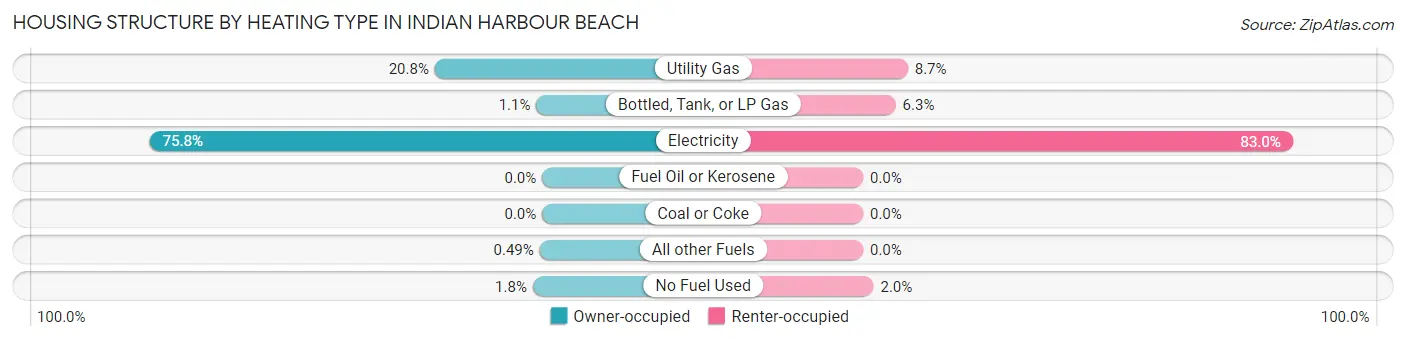
| Heating Type | Owner-occupied | Renter-occupied |
| Utility Gas | 595 (20.7%) | 81 (8.6%) |
| Bottled, Tank, or LP Gas | 32 (1.1%) | 59 (6.3%) |
| Electricity | 2,174 (75.8%) | 777 (83.0%) |
| Fuel Oil or Kerosene | 0 (0.0%) | 0 (0.0%) |
| Coal or Coke | 0 (0.0%) | 0 (0.0%) |
| All other Fuels | 14 (0.5%) | 0 (0.0%) |
| No Fuel Used | 52 (1.8%) | 19 (2.0%) |
| Total | 2,867 (100.0%) | 936 (100.0%) |
Household Vehicle Usage in Indian Harbour Beach
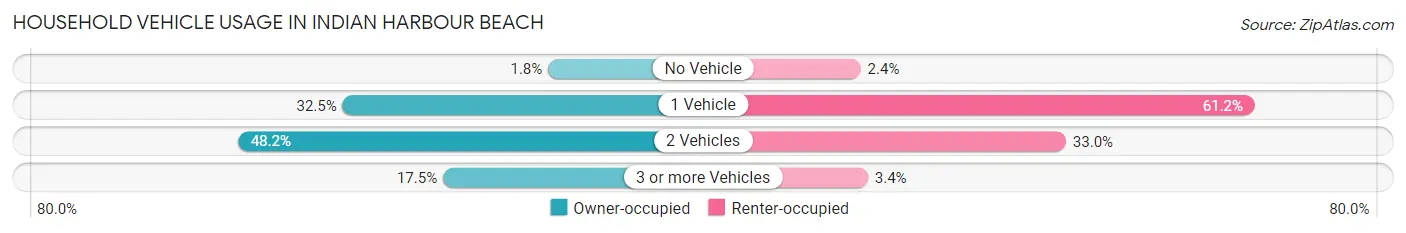
| Vehicles per Household | Owner-occupied | Renter-occupied |
| No Vehicle | 52 (1.8%) | 22 (2.4%) |
| 1 Vehicle | 932 (32.5%) | 573 (61.2%) |
| 2 Vehicles | 1,381 (48.2%) | 309 (33.0%) |
| 3 or more Vehicles | 502 (17.5%) | 32 (3.4%) |
| Total | 2,867 (100.0%) | 936 (100.0%) |
Real Estate & Mortgages in Indian Harbour Beach
Real Estate and Mortgage Overview in Indian Harbour Beach
| Characteristic | Without Mortgage | With Mortgage |
| Housing Units | 1,225 | 1,642 |
| Median Property Value | $330,200 | $367,700 |
| Median Household Income | $77,868 | $656 |
| Monthly Housing Costs | $791 | $372 |
| Real Estate Taxes | $2,968 | $46 |
Property Value by Mortgage Status in Indian Harbour Beach
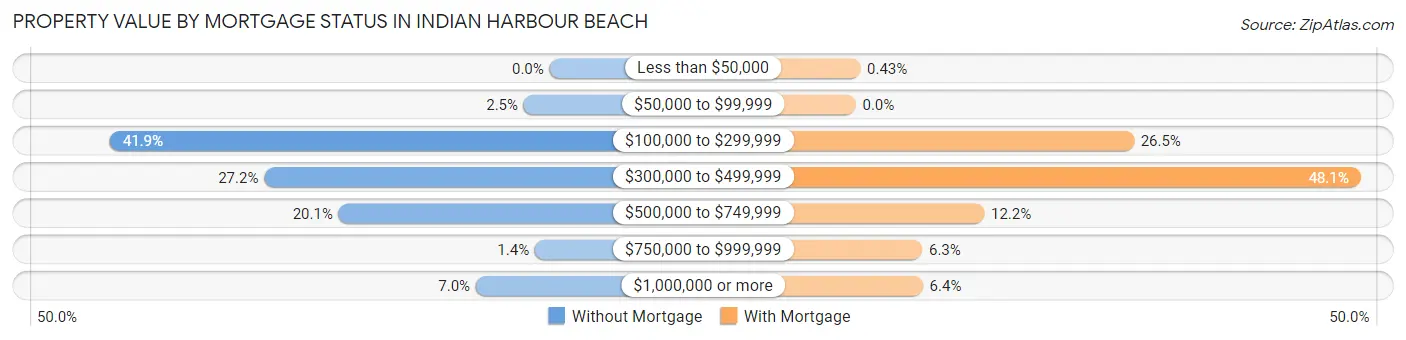
| Property Value | Without Mortgage | With Mortgage |
| Less than $50,000 | 0 (0.0%) | 7 (0.4%) |
| $50,000 to $99,999 | 30 (2.5%) | 0 (0.0%) |
| $100,000 to $299,999 | 513 (41.9%) | 435 (26.5%) |
| $300,000 to $499,999 | 333 (27.2%) | 790 (48.1%) |
| $500,000 to $749,999 | 246 (20.1%) | 201 (12.2%) |
| $750,000 to $999,999 | 17 (1.4%) | 104 (6.3%) |
| $1,000,000 or more | 86 (7.0%) | 105 (6.4%) |
| Total | 1,225 (100.0%) | 1,642 (100.0%) |
Household Income by Mortgage Status in Indian Harbour Beach
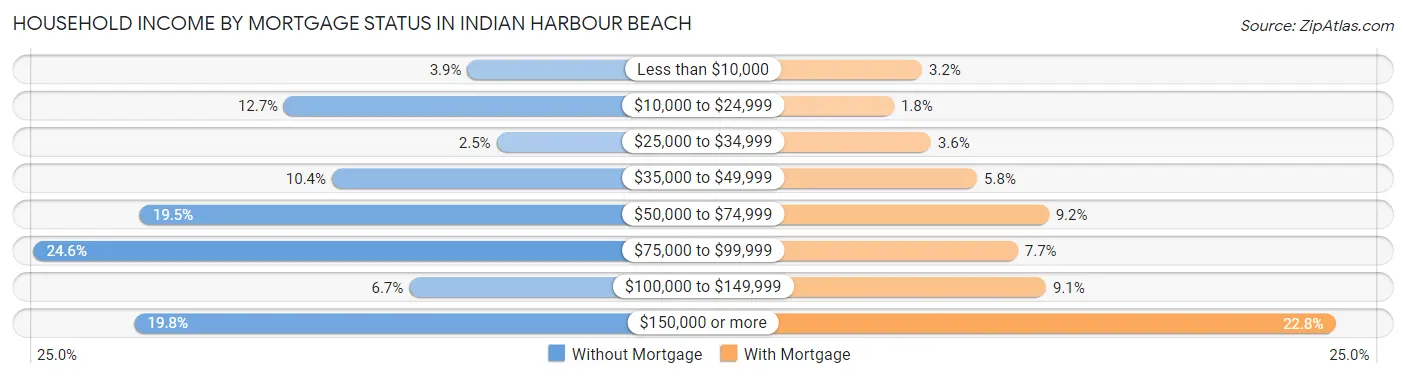
| Household Income | Without Mortgage | With Mortgage |
| Less than $10,000 | 48 (3.9%) | 52 (3.2%) |
| $10,000 to $24,999 | 155 (12.7%) | 30 (1.8%) |
| $25,000 to $34,999 | 31 (2.5%) | 59 (3.6%) |
| $35,000 to $49,999 | 127 (10.4%) | 95 (5.8%) |
| $50,000 to $74,999 | 239 (19.5%) | 151 (9.2%) |
| $75,000 to $99,999 | 301 (24.6%) | 127 (7.7%) |
| $100,000 to $149,999 | 82 (6.7%) | 149 (9.1%) |
| $150,000 or more | 242 (19.8%) | 375 (22.8%) |
| Total | 1,225 (100.0%) | 1,642 (100.0%) |
Property Value to Household Income Ratio in Indian Harbour Beach
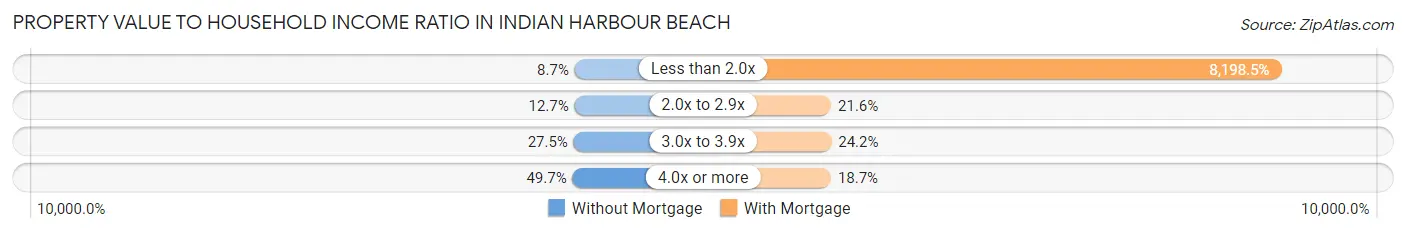
| Value-to-Income Ratio | Without Mortgage | With Mortgage |
| Less than 2.0x | 106 (8.6%) | 134,620 (8,198.5%) |
| 2.0x to 2.9x | 155 (12.7%) | 354 (21.6%) |
| 3.0x to 3.9x | 337 (27.5%) | 397 (24.2%) |
| 4.0x or more | 609 (49.7%) | 307 (18.7%) |
| Total | 1,225 (100.0%) | 1,642 (100.0%) |
Real Estate Taxes by Mortgage Status in Indian Harbour Beach
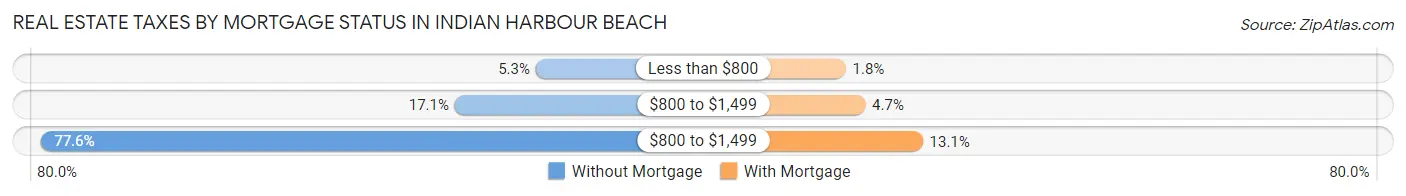
| Property Taxes | Without Mortgage | With Mortgage |
| Less than $800 | 65 (5.3%) | 30 (1.8%) |
| $800 to $1,499 | 210 (17.1%) | 77 (4.7%) |
| $800 to $1,499 | 950 (77.5%) | 215 (13.1%) |
| Total | 1,225 (100.0%) | 1,642 (100.0%) |
Health & Disability in Indian Harbour Beach
Health Insurance Coverage by Age in Indian Harbour Beach
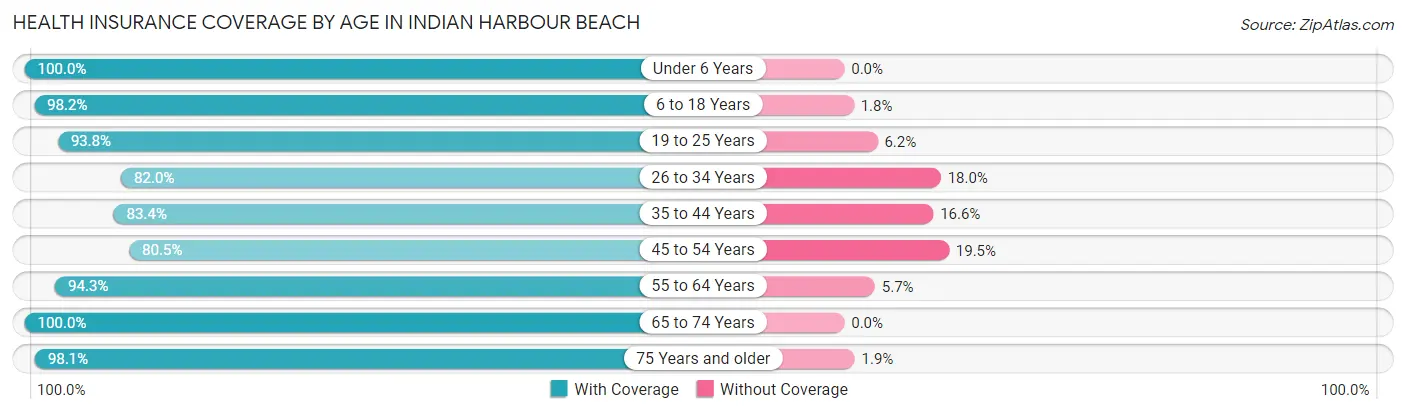
| Age Bracket | With Coverage | Without Coverage |
| Under 6 Years | 466 (100.0%) | 0 (0.0%) |
| 6 to 18 Years | 1,336 (98.2%) | 24 (1.8%) |
| 19 to 25 Years | 714 (93.8%) | 47 (6.2%) |
| 26 to 34 Years | 438 (82.0%) | 96 (18.0%) |
| 35 to 44 Years | 654 (83.4%) | 130 (16.6%) |
| 45 to 54 Years | 900 (80.5%) | 218 (19.5%) |
| 55 to 64 Years | 1,143 (94.3%) | 69 (5.7%) |
| 65 to 74 Years | 1,686 (100.0%) | 0 (0.0%) |
| 75 Years and older | 921 (98.1%) | 18 (1.9%) |
| Total | 8,258 (93.2%) | 602 (6.8%) |
Health Insurance Coverage by Citizenship Status in Indian Harbour Beach
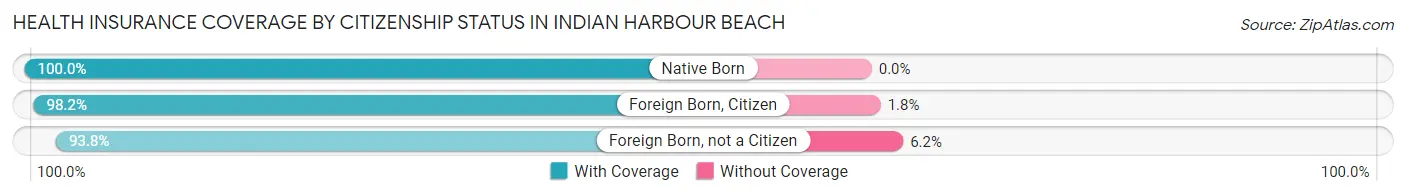
| Citizenship Status | With Coverage | Without Coverage |
| Native Born | 466 (100.0%) | 0 (0.0%) |
| Foreign Born, Citizen | 1,336 (98.2%) | 24 (1.8%) |
| Foreign Born, not a Citizen | 714 (93.8%) | 47 (6.2%) |
Health Insurance Coverage by Household Income in Indian Harbour Beach
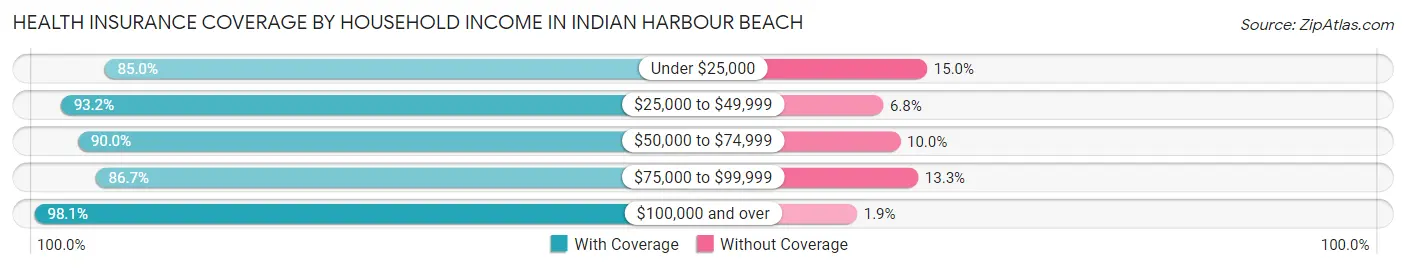
| Household Income | With Coverage | Without Coverage |
| Under $25,000 | 935 (85.0%) | 165 (15.0%) |
| $25,000 to $49,999 | 1,045 (93.2%) | 76 (6.8%) |
| $50,000 to $74,999 | 1,100 (90.0%) | 122 (10.0%) |
| $75,000 to $99,999 | 1,041 (86.7%) | 160 (13.3%) |
| $100,000 and over | 4,137 (98.1%) | 79 (1.9%) |
Public vs Private Health Insurance Coverage by Age in Indian Harbour Beach
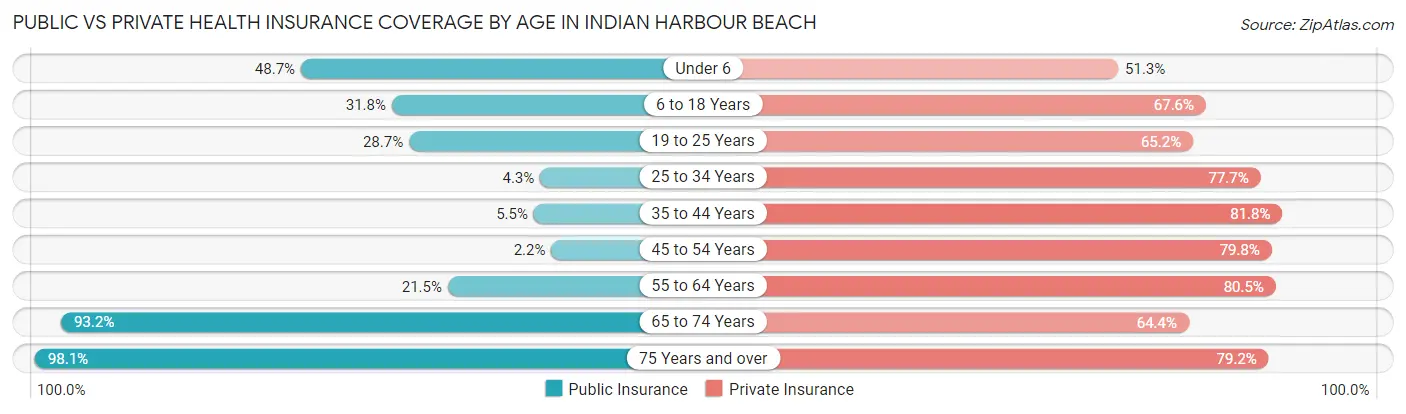
| Age Bracket | Public Insurance | Private Insurance |
| Under 6 | 227 (48.7%) | 239 (51.3%) |
| 6 to 18 Years | 433 (31.8%) | 919 (67.6%) |
| 19 to 25 Years | 218 (28.6%) | 496 (65.2%) |
| 25 to 34 Years | 23 (4.3%) | 415 (77.7%) |
| 35 to 44 Years | 43 (5.5%) | 641 (81.8%) |
| 45 to 54 Years | 25 (2.2%) | 892 (79.8%) |
| 55 to 64 Years | 260 (21.4%) | 976 (80.5%) |
| 65 to 74 Years | 1,572 (93.2%) | 1,086 (64.4%) |
| 75 Years and over | 921 (98.1%) | 744 (79.2%) |
| Total | 3,722 (42.0%) | 6,408 (72.3%) |
Disability Status by Sex by Age in Indian Harbour Beach
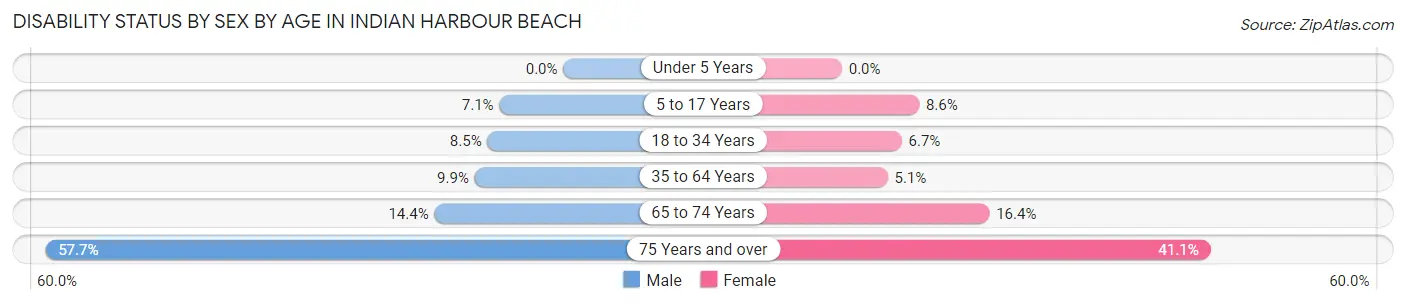
| Age Bracket | Male | Female |
| Under 5 Years | 0 (0.0%) | 0 (0.0%) |
| 5 to 17 Years | 48 (7.1%) | 63 (8.6%) |
| 18 to 34 Years | 53 (8.5%) | 46 (6.7%) |
| 35 to 64 Years | 139 (9.9%) | 87 (5.1%) |
| 65 to 74 Years | 124 (14.3%) | 135 (16.4%) |
| 75 Years and over | 251 (57.7%) | 207 (41.1%) |
Disability Class by Sex by Age in Indian Harbour Beach
Disability Class: Hearing Difficulty
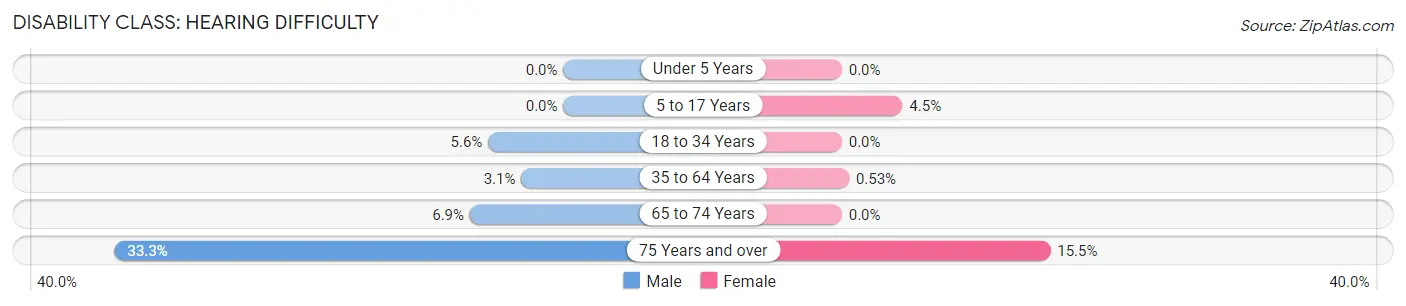
| Age Bracket | Male | Female |
| Under 5 Years | 0 (0.0%) | 0 (0.0%) |
| 5 to 17 Years | 0 (0.0%) | 33 (4.5%) |
| 18 to 34 Years | 35 (5.6%) | 0 (0.0%) |
| 35 to 64 Years | 44 (3.1%) | 9 (0.5%) |
| 65 to 74 Years | 60 (6.9%) | 0 (0.0%) |
| 75 Years and over | 145 (33.3%) | 78 (15.5%) |
Disability Class: Vision Difficulty
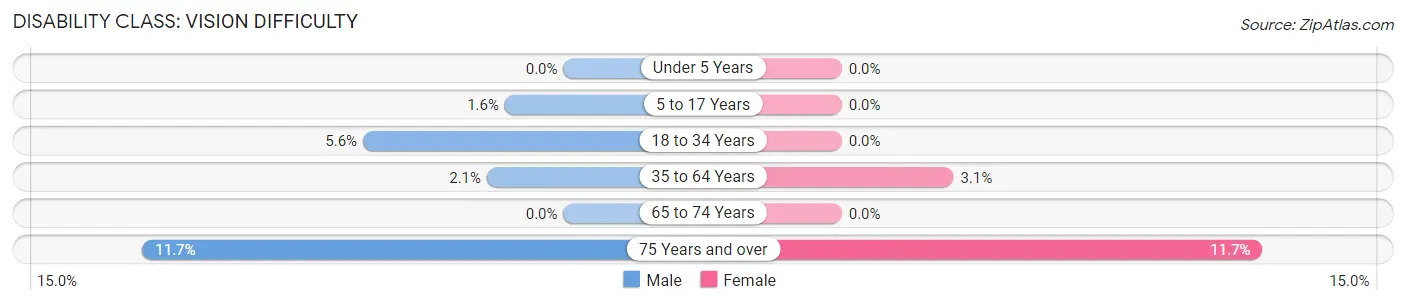
| Age Bracket | Male | Female |
| Under 5 Years | 0 (0.0%) | 0 (0.0%) |
| 5 to 17 Years | 11 (1.6%) | 0 (0.0%) |
| 18 to 34 Years | 35 (5.6%) | 0 (0.0%) |
| 35 to 64 Years | 30 (2.1%) | 53 (3.1%) |
| 65 to 74 Years | 0 (0.0%) | 0 (0.0%) |
| 75 Years and over | 51 (11.7%) | 59 (11.7%) |
Disability Class: Cognitive Difficulty
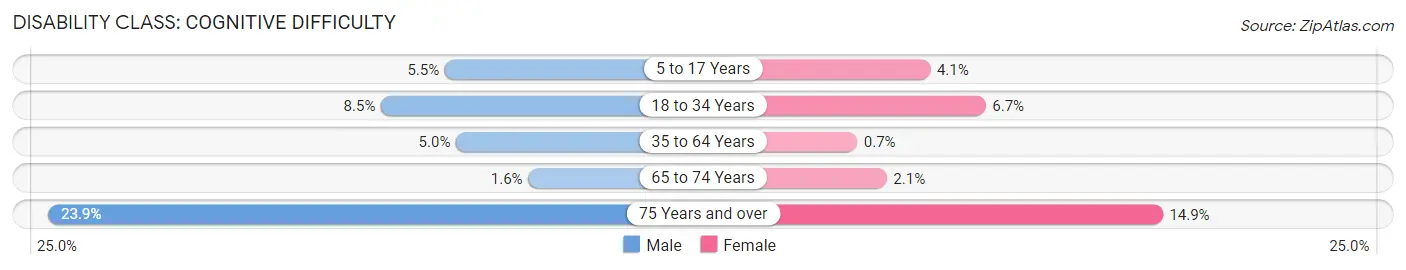
| Age Bracket | Male | Female |
| 5 to 17 Years | 37 (5.5%) | 30 (4.1%) |
| 18 to 34 Years | 53 (8.5%) | 46 (6.7%) |
| 35 to 64 Years | 70 (5.0%) | 12 (0.7%) |
| 65 to 74 Years | 14 (1.6%) | 17 (2.1%) |
| 75 Years and over | 104 (23.9%) | 75 (14.9%) |
Disability Class: Ambulatory Difficulty
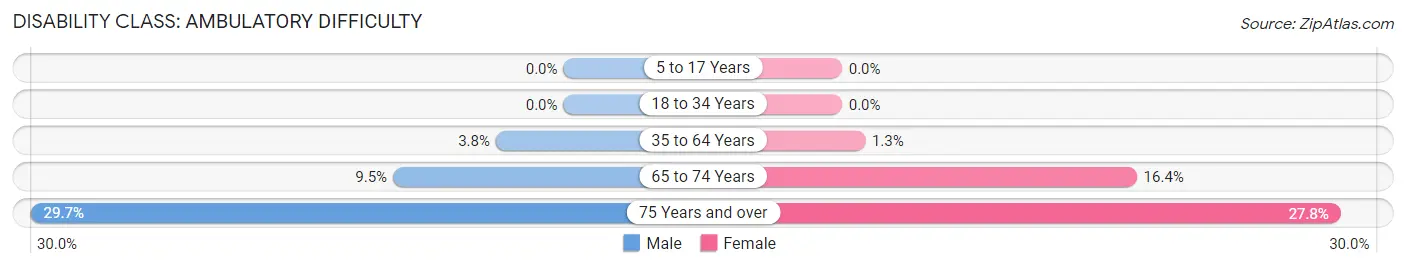
| Age Bracket | Male | Female |
| 5 to 17 Years | 0 (0.0%) | 0 (0.0%) |
| 18 to 34 Years | 0 (0.0%) | 0 (0.0%) |
| 35 to 64 Years | 53 (3.8%) | 22 (1.3%) |
| 65 to 74 Years | 82 (9.5%) | 135 (16.4%) |
| 75 Years and over | 129 (29.7%) | 140 (27.8%) |
Disability Class: Self-Care Difficulty
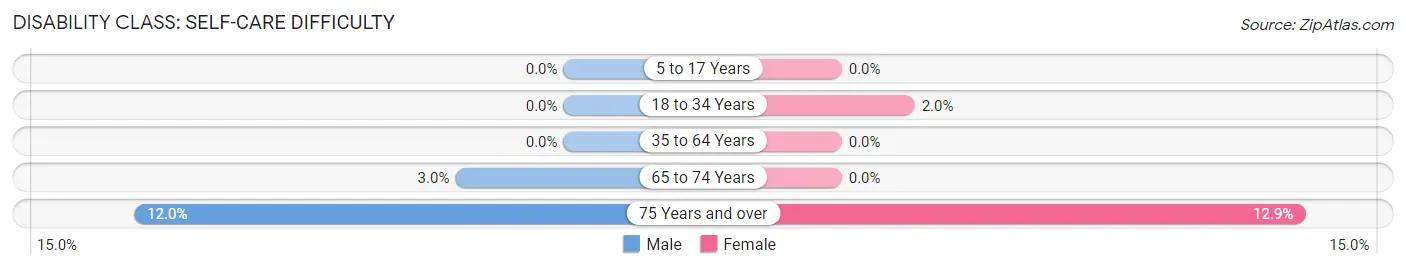
| Age Bracket | Male | Female |
| 5 to 17 Years | 0 (0.0%) | 0 (0.0%) |
| 18 to 34 Years | 0 (0.0%) | 14 (2.0%) |
| 35 to 64 Years | 0 (0.0%) | 0 (0.0%) |
| 65 to 74 Years | 26 (3.0%) | 0 (0.0%) |
| 75 Years and over | 52 (11.9%) | 65 (12.9%) |
Technology Access in Indian Harbour Beach
Computing Device Access in Indian Harbour Beach
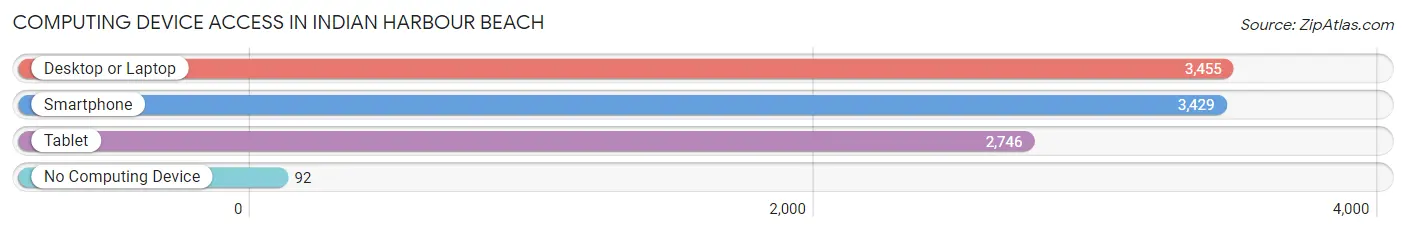
| Device Type | # Households | % Households |
| Desktop or Laptop | 3,455 | 90.8% |
| Smartphone | 3,429 | 90.2% |
| Tablet | 2,746 | 72.2% |
| No Computing Device | 92 | 2.4% |
| Total | 3,803 | 100.0% |
Internet Access in Indian Harbour Beach
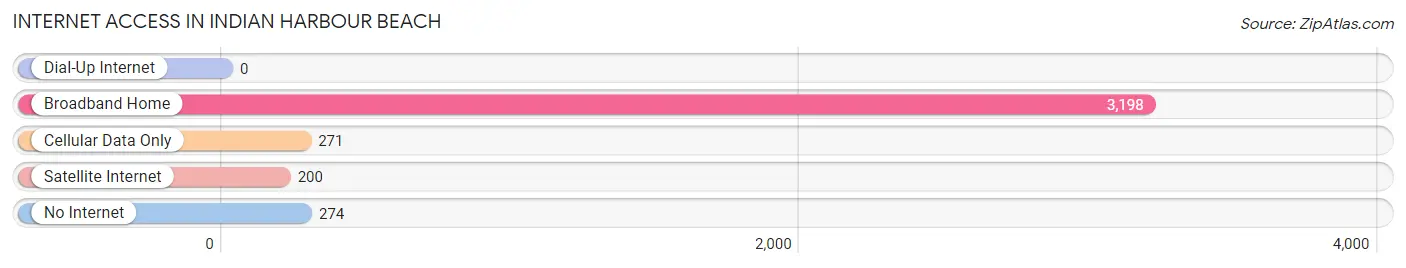
| Internet Type | # Households | % Households |
| Dial-Up Internet | 0 | 0.0% |
| Broadband Home | 3,198 | 84.1% |
| Cellular Data Only | 271 | 7.1% |
| Satellite Internet | 200 | 5.3% |
| No Internet | 274 | 7.2% |
| Total | 3,803 | 100.0% |
Indian Harbour Beach Summary
History
Indian Harbour Beach is a city located in Brevard County, Florida. It is situated on a barrier island along the Atlantic Ocean, just south of the city of Melbourne. The city was incorporated in 1953 and has a population of 8,225 as of the 2010 census.
The area that is now Indian Harbour Beach was originally inhabited by the Ais Indians, a tribe of the Seminole Nation. The Ais Indians lived in the area for centuries before the arrival of European settlers in the late 1700s. The first European settlers were mostly fishermen and farmers who established small settlements along the Indian River Lagoon.
In the early 1900s, the area began to develop as a resort destination. The first hotel was built in 1912 and the area soon became a popular spot for vacationers. The city was officially incorporated in 1953 and the population began to grow rapidly.
Geography
Indian Harbour Beach is located in Brevard County, Florida. It is situated on a barrier island along the Atlantic Ocean, just south of the city of Melbourne. The city is bordered by the Indian River Lagoon to the west and the Atlantic Ocean to the east. The city covers an area of 4.2 square miles and has a population of 8,225 as of the 2010 census.
The city has a humid subtropical climate, with hot, humid summers and mild winters. The average temperature in the summer is around 85°F and the average temperature in the winter is around 65°F. The city receives an average of 54 inches of rain per year.
Economy
The economy of Indian Harbour Beach is largely based on tourism and services. The city is home to several resorts and hotels, as well as a variety of restaurants and shops. The city also has a thriving fishing industry, with several commercial fishing boats operating out of the city’s marinas.
The city is also home to several technology companies, including Harris Corporation, Northrop Grumman, and Rockwell Collins. The city is also home to several aerospace companies, including Embraer and Lockheed Martin.
Demographics
As of the 2010 census, the population of Indian Harbour Beach was 8,225. The racial makeup of the city was 92.3% White, 3.2% African American, 0.4% Native American, 1.2% Asian, 0.1% Pacific Islander, 1.2% from other races, and 1.7% from two or more races. Hispanic or Latino of any race were 4.2% of the population.
The median income for a household in the city was $50,945, and the median income for a family was $60,945. The per capita income for the city was $27,945. About 5.2% of families and 7.2% of the population were below the poverty line, including 8.2% of those under age 18 and 5.2% of those age 65 or over.
Common Questions
What is the Total Population of Indian Harbour Beach?
Total Population of Indian Harbour Beach is 8,944.
What is the Total Male Population of Indian Harbour Beach?
Total Male Population of Indian Harbour Beach is 4,410.
What is the Total Female Population of Indian Harbour Beach?
Total Female Population of Indian Harbour Beach is 4,534.
What is the Ratio of Males per 100 Females in Indian Harbour Beach?
There are 97.27 Males per 100 Females in Indian Harbour Beach.
What is the Ratio of Females per 100 Males in Indian Harbour Beach?
There are 102.81 Females per 100 Males in Indian Harbour Beach.
What is the Median Population Age in Indian Harbour Beach?
Median Population Age in Indian Harbour Beach is 49.8 Years.
What is the Average Family Size in Indian Harbour Beach
Average Family Size in Indian Harbour Beach is 3.0 People.
What is the Average Household Size in Indian Harbour Beach
Average Household Size in Indian Harbour Beach is 2.3 People.
What is Per Capita Income in Indian Harbour Beach?
Per Capita income in Indian Harbour Beach is $56,461.
What is the Median Family Income in Indian Harbour Beach?
Median Family Income in Indian Harbour Beach is $113,250.
What is the Median Household income in Indian Harbour Beach?
Median Household Income in Indian Harbour Beach is $78,774.
What is Income or Wage Gap in Indian Harbour Beach?
Income or Wage Gap in Indian Harbour Beach is 26.7%.
Women in Indian Harbour Beach earn 73.3 cents for every dollar earned by a man.
What is Family Income Deficit in Indian Harbour Beach?
Family Income Deficit in Indian Harbour Beach is $7,526.
Families that are below poverty line in Indian Harbour Beach earn $7,526 less on average than the poverty threshold level.
What is Inequality or Gini Index in Indian Harbour Beach?
Inequality or Gini Index in Indian Harbour Beach is 0.51.
How Large is the Labor Force in Indian Harbour Beach?
There are 3,759 People in the Labor Forcein in Indian Harbour Beach.
What is the Percentage of People in the Labor Force in Indian Harbour Beach?
51.1% of People are in the Labor Force in Indian Harbour Beach.
What is the Unemployment Rate in Indian Harbour Beach?
Unemployment Rate in Indian Harbour Beach is 4.3%.