Hutchinson Island South, FL
Hutchinson Island South Map
Hutchinson Island South Overview
4,203
TOTAL POPULATION
2,065
MALE POPULATION
2,138
FEMALE POPULATION
96.59
MALES / 100 FEMALES
103.54
FEMALES / 100 MALES
72.1
MEDIAN AGE
2.1
AVG FAMILY SIZE
1.7
AVG HOUSEHOLD SIZE
$54,489
PER CAPITA INCOME
$92,955
AVG FAMILY INCOME
$63,300
AVG HOUSEHOLD INCOME
20.6%
WAGE / INCOME GAP [ % ]
79.4¢/ $1
WAGE / INCOME GAP [ $ ]
$7,575
FAMILY INCOME DEFICIT
0.45
INEQUALITY / GINI INDEX
1,029
LABOR FORCE [ PEOPLE ]
24.9%
PERCENT IN LABOR FORCE
5.4%
UNEMPLOYMENT RATE
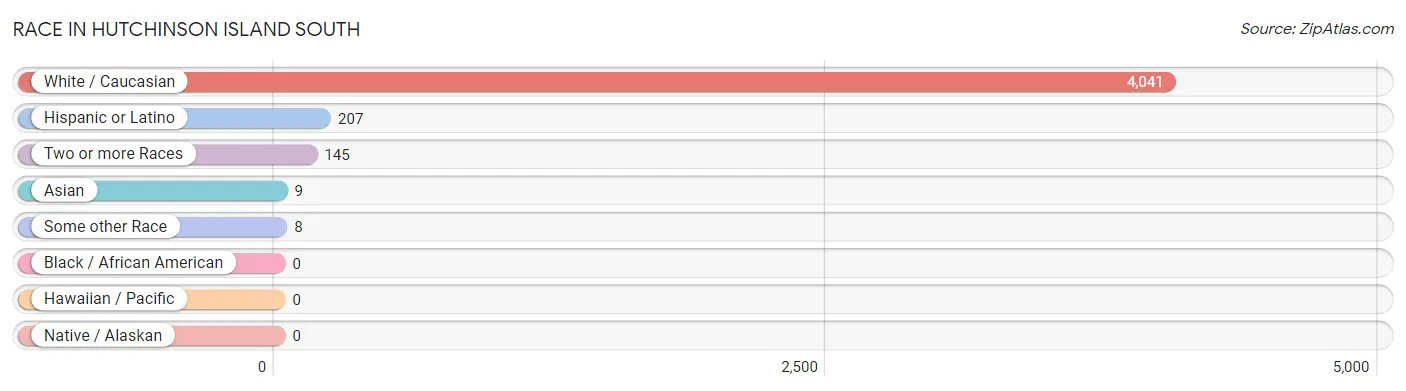
Race in Hutchinson Island South
The most populous races in Hutchinson Island South are White / Caucasian (4,041 | 96.2%), Hispanic or Latino (207 | 4.9%), and Two or more Races (145 | 3.5%).
| Race | # Population | % Population |
| Asian | 9 | 0.2% |
| Black / African American | 0 | 0.0% |
| Hawaiian / Pacific | 0 | 0.0% |
| Hispanic or Latino | 207 | 4.9% |
| Native / Alaskan | 0 | 0.0% |
| White / Caucasian | 4,041 | 96.2% |
| Two or more Races | 145 | 3.5% |
| Some other Race | 8 | 0.2% |
| Total | 4,203 | 100.0% |
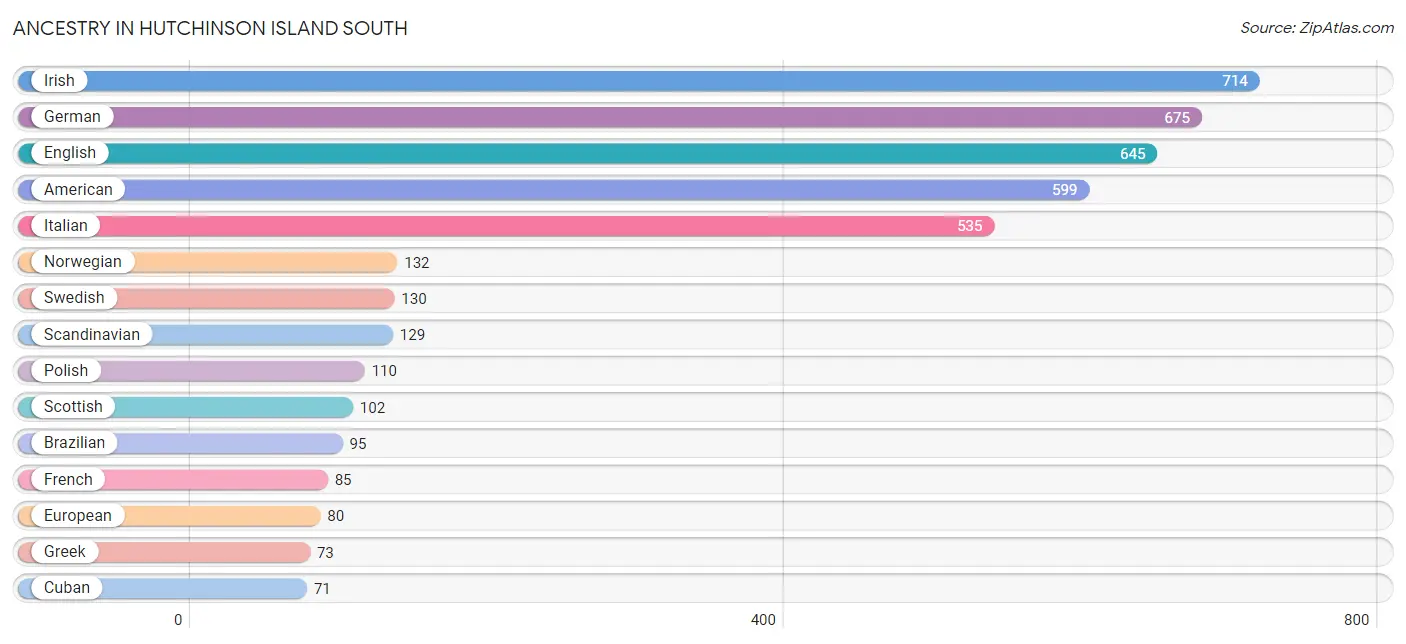
Ancestry in Hutchinson Island South
The most populous ancestries reported in Hutchinson Island South are Irish (714 | 17.0%), German (675 | 16.1%), English (645 | 15.3%), American (599 | 14.2%), and Italian (535 | 12.7%), together accounting for 75.4% of all Hutchinson Island South residents.
| Ancestry | # Population | % Population |
| American | 599 | 14.2% |
| Arab | 27 | 0.6% |
| Austrian | 31 | 0.7% |
| Belgian | 8 | 0.2% |
| Brazilian | 95 | 2.3% |
| British | 9 | 0.2% |
| Central American | 32 | 0.8% |
| Cherokee | 7 | 0.2% |
| Colombian | 8 | 0.2% |
| Costa Rican | 5 | 0.1% |
| Cuban | 71 | 1.7% |
| Czech | 9 | 0.2% |
| Czechoslovakian | 15 | 0.4% |
| Danish | 58 | 1.4% |
| Dutch | 59 | 1.4% |
| Eastern European | 13 | 0.3% |
| English | 645 | 15.3% |
| European | 80 | 1.9% |
| Finnish | 29 | 0.7% |
| French | 85 | 2.0% |
| French Canadian | 63 | 1.5% |
| German | 675 | 16.1% |
| Greek | 73 | 1.7% |
| Hungarian | 40 | 0.9% |
| Irish | 714 | 17.0% |
| Italian | 535 | 12.7% |
| Lebanese | 10 | 0.2% |
| Lithuanian | 17 | 0.4% |
| Maltese | 18 | 0.4% |
| Moroccan | 10 | 0.2% |
| Norwegian | 132 | 3.1% |
| Panamanian | 18 | 0.4% |
| Polish | 110 | 2.6% |
| Portuguese | 59 | 1.4% |
| Puerto Rican | 64 | 1.5% |
| Russian | 33 | 0.8% |
| Salvadoran | 9 | 0.2% |
| Scandinavian | 129 | 3.1% |
| Scotch-Irish | 61 | 1.5% |
| Scottish | 102 | 2.4% |
| Seminole | 6 | 0.1% |
| Slovak | 19 | 0.4% |
| South American | 20 | 0.5% |
| Spaniard | 20 | 0.5% |
| Swedish | 130 | 3.1% |
| Swiss | 6 | 0.1% |
| Syrian | 7 | 0.2% |
| Thai | 9 | 0.2% |
| Ukrainian | 31 | 0.7% |
| Venezuelan | 12 | 0.3% |
| Welsh | 29 | 0.7% |
| Yugoslavian | 8 | 0.2% | View All 52 Rows |
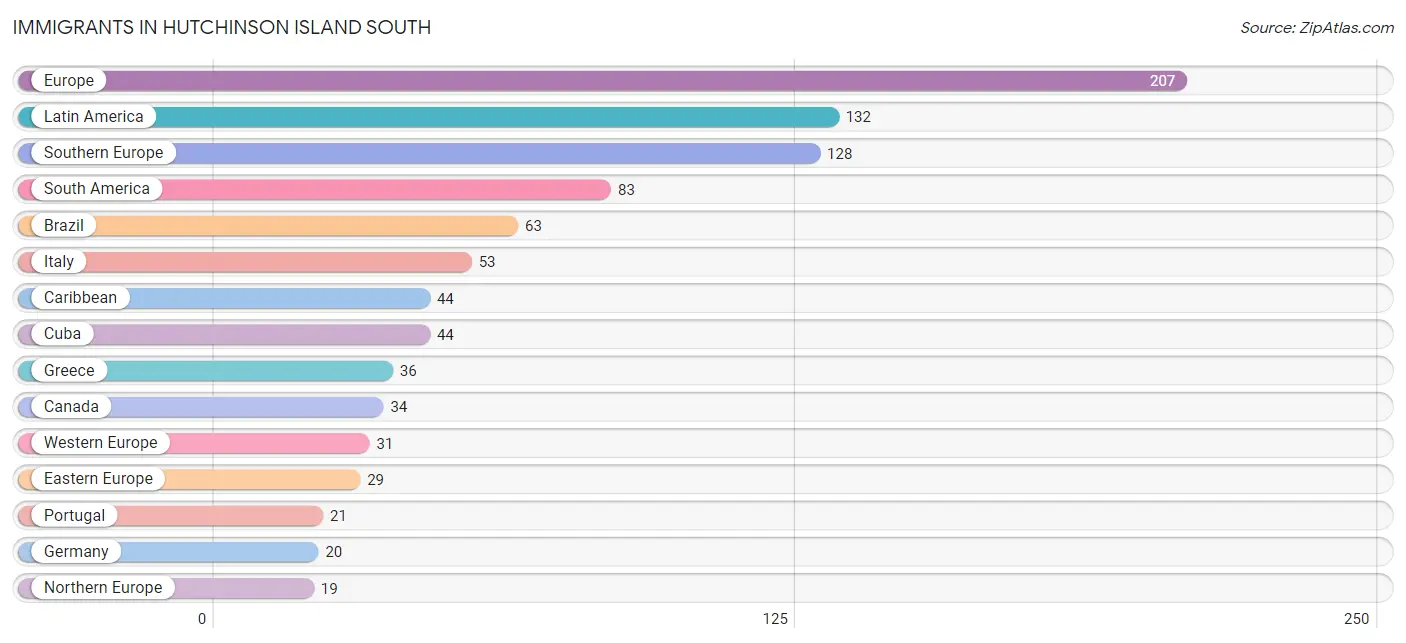
Immigrants in Hutchinson Island South
The most numerous immigrant groups reported in Hutchinson Island South came from Europe (207 | 4.9%), Latin America (132 | 3.1%), Southern Europe (128 | 3.0%), South America (83 | 2.0%), and Brazil (63 | 1.5%), together accounting for 14.6% of all Hutchinson Island South residents.
| Immigration Origin | # Population | % Population |
| Asia | 18 | 0.4% |
| Brazil | 63 | 1.5% |
| Canada | 34 | 0.8% |
| Caribbean | 44 | 1.1% |
| Central America | 5 | 0.1% |
| Colombia | 8 | 0.2% |
| Costa Rica | 5 | 0.1% |
| Cuba | 44 | 1.1% |
| Czechoslovakia | 13 | 0.3% |
| Eastern Europe | 29 | 0.7% |
| Europe | 207 | 4.9% |
| Germany | 20 | 0.5% |
| Greece | 36 | 0.9% |
| India | 9 | 0.2% |
| Israel | 9 | 0.2% |
| Italy | 53 | 1.3% |
| Latin America | 132 | 3.1% |
| Lithuania | 8 | 0.2% |
| Netherlands | 11 | 0.3% |
| North Macedonia | 8 | 0.2% |
| Northern Europe | 19 | 0.4% |
| Portugal | 21 | 0.5% |
| South America | 83 | 2.0% |
| South Central Asia | 9 | 0.2% |
| Southern Europe | 128 | 3.0% |
| Venezuela | 12 | 0.3% |
| Western Asia | 9 | 0.2% |
| Western Europe | 31 | 0.7% | View All 28 Rows |
Sex and Age in Hutchinson Island South
Sex and Age in Hutchinson Island South
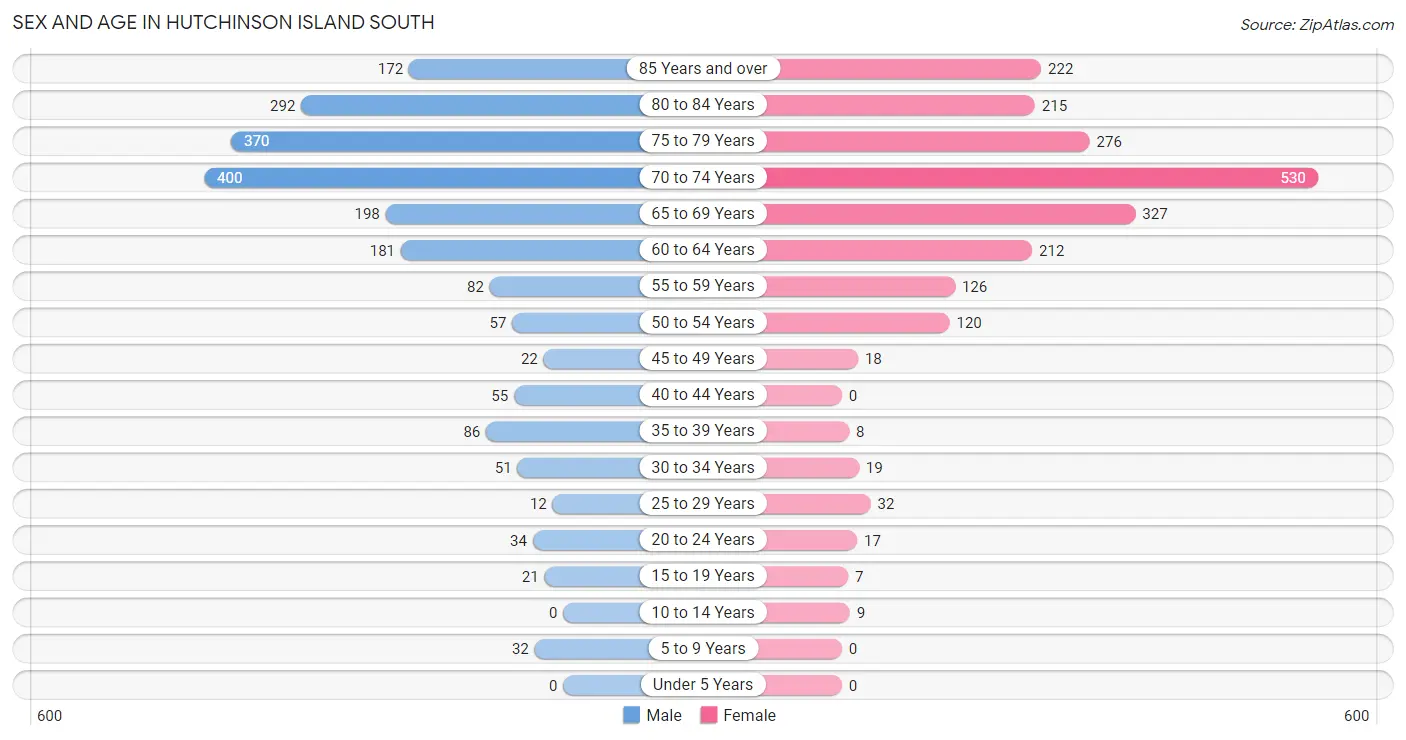
The most populous age groups in Hutchinson Island South are 70 to 74 Years (400 | 19.4%) for men and 70 to 74 Years (530 | 24.8%) for women.
| Age Bracket | Male | Female |
| Under 5 Years | 0 (0.0%) | 0 (0.0%) |
| 5 to 9 Years | 32 (1.5%) | 0 (0.0%) |
| 10 to 14 Years | 0 (0.0%) | 9 (0.4%) |
| 15 to 19 Years | 21 (1.0%) | 7 (0.3%) |
| 20 to 24 Years | 34 (1.7%) | 17 (0.8%) |
| 25 to 29 Years | 12 (0.6%) | 32 (1.5%) |
| 30 to 34 Years | 51 (2.5%) | 19 (0.9%) |
| 35 to 39 Years | 86 (4.2%) | 8 (0.4%) |
| 40 to 44 Years | 55 (2.7%) | 0 (0.0%) |
| 45 to 49 Years | 22 (1.1%) | 18 (0.8%) |
| 50 to 54 Years | 57 (2.8%) | 120 (5.6%) |
| 55 to 59 Years | 82 (4.0%) | 126 (5.9%) |
| 60 to 64 Years | 181 (8.8%) | 212 (9.9%) |
| 65 to 69 Years | 198 (9.6%) | 327 (15.3%) |
| 70 to 74 Years | 400 (19.4%) | 530 (24.8%) |
| 75 to 79 Years | 370 (17.9%) | 276 (12.9%) |
| 80 to 84 Years | 292 (14.1%) | 215 (10.1%) |
| 85 Years and over | 172 (8.3%) | 222 (10.4%) |
| Total | 2,065 (100.0%) | 2,138 (100.0%) |
Families and Households in Hutchinson Island South
Median Family Size in Hutchinson Island South
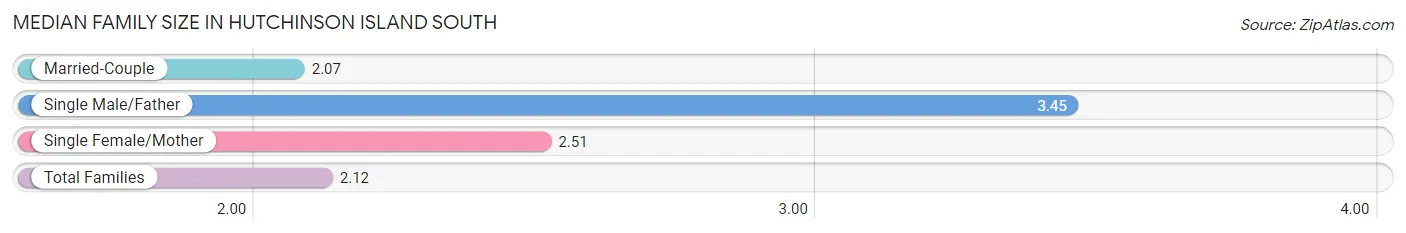
The median family size in Hutchinson Island South is 2.12 persons per family, with single male/father families (20 | 1.5%) accounting for the largest median family size of 3.45 persons per family. On the other hand, married-couple families (1,268 | 93.0%) represent the smallest median family size with 2.07 persons per family.
| Family Type | # Families | Family Size |
| Married-Couple | 1,268 (93.0%) | 2.07 |
| Single Male/Father | 20 (1.5%) | 3.45 |
| Single Female/Mother | 76 (5.6%) | 2.51 |
| Total Families | 1,364 (100.0%) | 2.12 |
Median Household Size in Hutchinson Island South
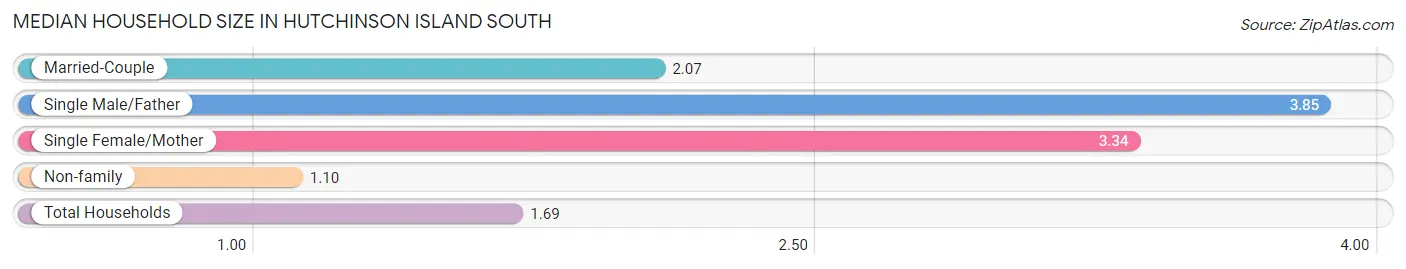
The median household size in Hutchinson Island South is 1.69 persons per household, with single male/father households (20 | 0.8%) accounting for the largest median household size of 3.85 persons per household. non-family households (1,130 | 45.3%) represent the smallest median household size with 1.10 persons per household.
| Household Type | # Households | Household Size |
| Married-Couple | 1,268 (50.8%) | 2.07 |
| Single Male/Father | 20 (0.8%) | 3.85 |
| Single Female/Mother | 76 (3.0%) | 3.34 |
| Non-family | 1,130 (45.3%) | 1.10 |
| Total Households | 2,494 (100.0%) | 1.69 |
Household Size by Marriage Status in Hutchinson Island South
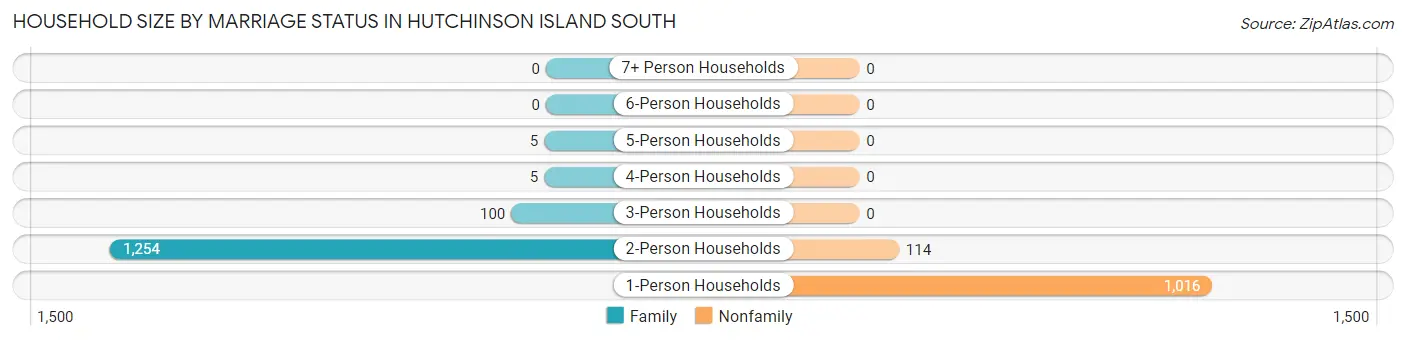
Out of a total of 2,494 households in Hutchinson Island South, 1,364 (54.7%) are family households, while 1,130 (45.3%) are nonfamily households. The most numerous type of family households are 2-person households, comprising 1,254, and the most common type of nonfamily households are 1-person households, comprising 1,016.
| Household Size | Family Households | Nonfamily Households |
| 1-Person Households | - | 1,016 (40.7%) |
| 2-Person Households | 1,254 (50.3%) | 114 (4.6%) |
| 3-Person Households | 100 (4.0%) | 0 (0.0%) |
| 4-Person Households | 5 (0.2%) | 0 (0.0%) |
| 5-Person Households | 5 (0.2%) | 0 (0.0%) |
| 6-Person Households | 0 (0.0%) | 0 (0.0%) |
| 7+ Person Households | 0 (0.0%) | 0 (0.0%) |
| Total | 1,364 (54.7%) | 1,130 (45.3%) |
Female Fertility in Hutchinson Island South
Fertility by Age in Hutchinson Island South
| Age Bracket | Women with Births | Births / 1,000 Women |
| 15 to 19 years | 0 (0.0%) | 0.0 |
| 20 to 34 years | 0 (0.0%) | 0.0 |
| 35 to 50 years | 0 (0.0%) | 0.0 |
| Total | 0 (0.0%) | 0.0 |
Fertility by Age by Marriage Status in Hutchinson Island South
| Age Bracket | Married | Unmarried |
| 15 to 19 years | 0 (0.0%) | 0 (0.0%) |
| 20 to 34 years | 0 (0.0%) | 0 (0.0%) |
| 35 to 50 years | 0 (0.0%) | 0 (0.0%) |
| Total | 0 (0.0%) | 0 (0.0%) |
Fertility by Education in Hutchinson Island South
| Educational Attainment | Women with Births | Births / 1,000 Women |
| Less than High School | 0 (0.0%) | 0.0 |
| High School Diploma | 0 (0.0%) | 0.0 |
| College or Associate's Degree | 0 (0.0%) | 0.0 |
| Bachelor's Degree | 0 (0.0%) | 0.0 |
| Graduate Degree | 0 (0.0%) | 0.0 |
| Total | 0 (0.0%) | 0.0 |
Fertility by Education by Marriage Status in Hutchinson Island South
| Educational Attainment | Married | Unmarried |
| Less than High School | 0 (0.0%) | 0 (0.0%) |
| High School Diploma | 0 (0.0%) | 0 (0.0%) |
| College or Associate's Degree | 0 (0.0%) | 0 (0.0%) |
| Bachelor's Degree | 0 (0.0%) | 0 (0.0%) |
| Graduate Degree | 0 (0.0%) | 0 (0.0%) |
| Total | 0 (0.0%) | 0 (0.0%) |
Income in Hutchinson Island South
Income Overview in Hutchinson Island South
Per Capita Income in Hutchinson Island South is $54,489, while median incomes of families and households are $92,955 and $63,300 respectively.
| Characteristic | Number | Measure |
| Per Capita Income | 4,203 | $54,489 |
| Median Family Income | 1,364 | $92,955 |
| Mean Family Income | 1,364 | $110,865 |
| Median Household Income | 2,494 | $63,300 |
| Mean Household Income | 2,494 | $90,547 |
| Income Deficit | 1,364 | $7,575 |
| Wage / Income Gap (%) | 4,203 | 20.65% |
| Wage / Income Gap ($) | 4,203 | 79.35¢ per $1 |
| Gini / Inequality Index | 4,203 | 0.45 |
Earnings by Sex in Hutchinson Island South
Average Earnings in Hutchinson Island South are $45,821, $52,083 for men and $41,328 for women, a difference of 20.6%.
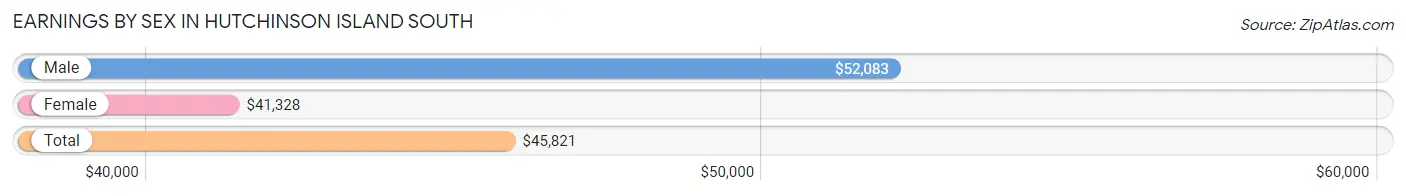
| Sex | Number | Average Earnings |
| Male | 560 (48.0%) | $52,083 |
| Female | 607 (52.0%) | $41,328 |
| Total | 1,167 (100.0%) | $45,821 |
Earnings by Sex by Income Bracket in Hutchinson Island South
The most common earnings brackets in Hutchinson Island South are $100,000+ for men (138 | 24.6%) and $100,000+ for women (94 | 15.5%).
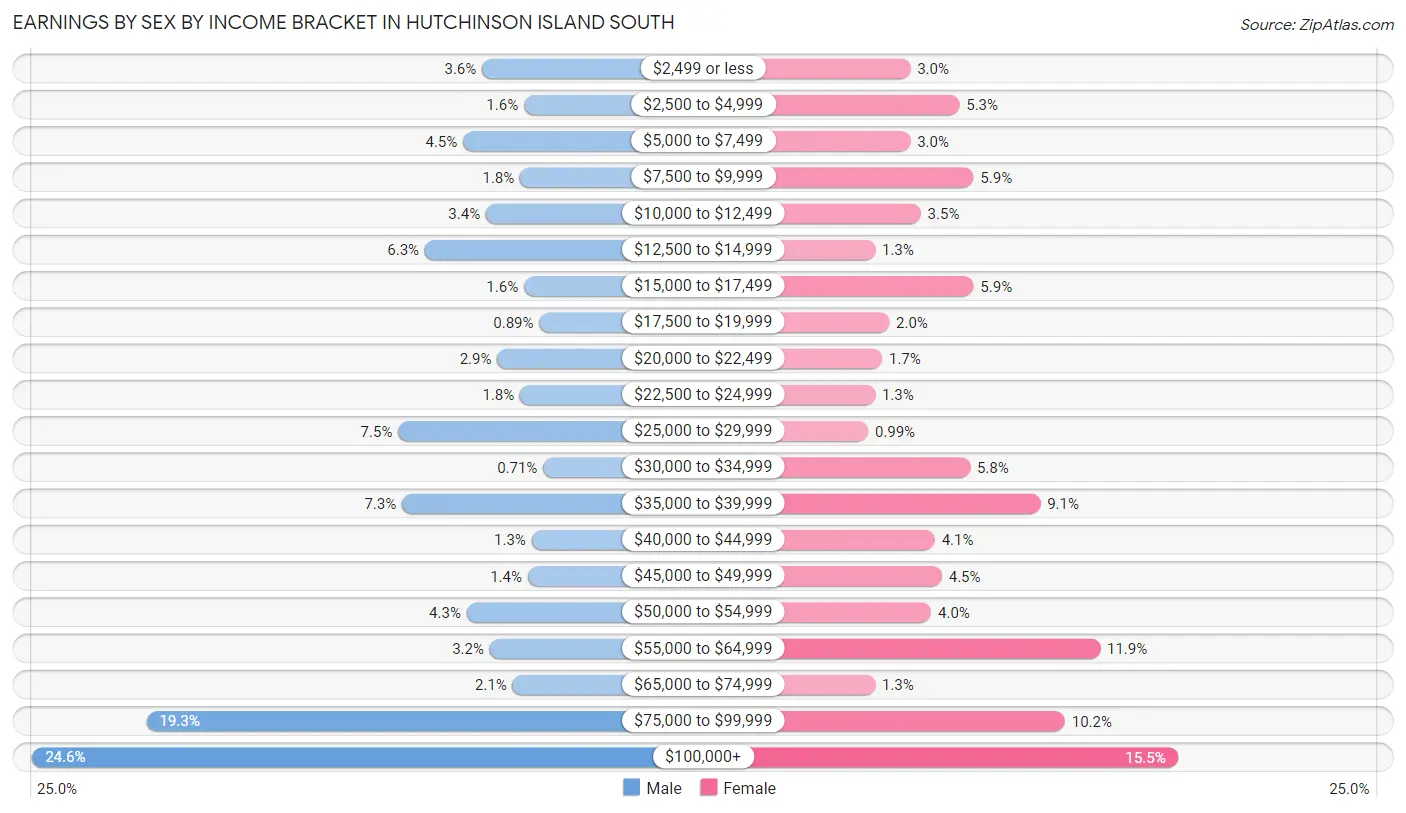
| Income | Male | Female |
| $2,499 or less | 20 (3.6%) | 18 (3.0%) |
| $2,500 to $4,999 | 9 (1.6%) | 32 (5.3%) |
| $5,000 to $7,499 | 25 (4.5%) | 18 (3.0%) |
| $7,500 to $9,999 | 10 (1.8%) | 36 (5.9%) |
| $10,000 to $12,499 | 19 (3.4%) | 21 (3.5%) |
| $12,500 to $14,999 | 35 (6.2%) | 8 (1.3%) |
| $15,000 to $17,499 | 9 (1.6%) | 36 (5.9%) |
| $17,500 to $19,999 | 5 (0.9%) | 12 (2.0%) |
| $20,000 to $22,499 | 16 (2.9%) | 10 (1.7%) |
| $22,500 to $24,999 | 10 (1.8%) | 8 (1.3%) |
| $25,000 to $29,999 | 42 (7.5%) | 6 (1.0%) |
| $30,000 to $34,999 | 4 (0.7%) | 35 (5.8%) |
| $35,000 to $39,999 | 41 (7.3%) | 55 (9.1%) |
| $40,000 to $44,999 | 7 (1.3%) | 25 (4.1%) |
| $45,000 to $49,999 | 8 (1.4%) | 27 (4.4%) |
| $50,000 to $54,999 | 24 (4.3%) | 24 (4.0%) |
| $55,000 to $64,999 | 18 (3.2%) | 72 (11.9%) |
| $65,000 to $74,999 | 12 (2.1%) | 8 (1.3%) |
| $75,000 to $99,999 | 108 (19.3%) | 62 (10.2%) |
| $100,000+ | 138 (24.6%) | 94 (15.5%) |
| Total | 560 (100.0%) | 607 (100.0%) |
Earnings by Sex by Educational Attainment in Hutchinson Island South
Average earnings in Hutchinson Island South are $58,819 for men and $42,778 for women, a difference of 27.3%. Men with an educational attainment of bachelor's degree enjoy the highest average annual earnings of $92,969, while those with college or associate's degree education earn the least with $72,500. Women with an educational attainment of graduate degree earn the most with the average annual earnings of $61,250, while those with college or associate's degree education have the smallest earnings of $34,091.
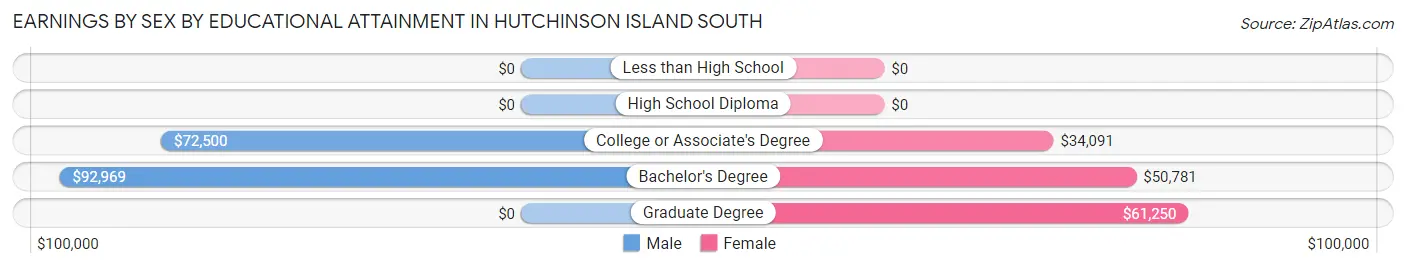
| Educational Attainment | Male Income | Female Income |
| Less than High School | - | - |
| High School Diploma | - | - |
| College or Associate's Degree | $72,500 | $34,091 |
| Bachelor's Degree | $92,969 | $50,781 |
| Graduate Degree | - | - |
| Total | $58,819 | $42,778 |
Family Income in Hutchinson Island South
Family Income Brackets in Hutchinson Island South
According to the Hutchinson Island South family income data, there are 304 families falling into the $100,000 to $149,999 income range, which is the most common income bracket and makes up 22.3% of all families. Conversely, the less than $10,000 income bracket is the least frequent group with only 25 families (1.8%) belonging to this category.
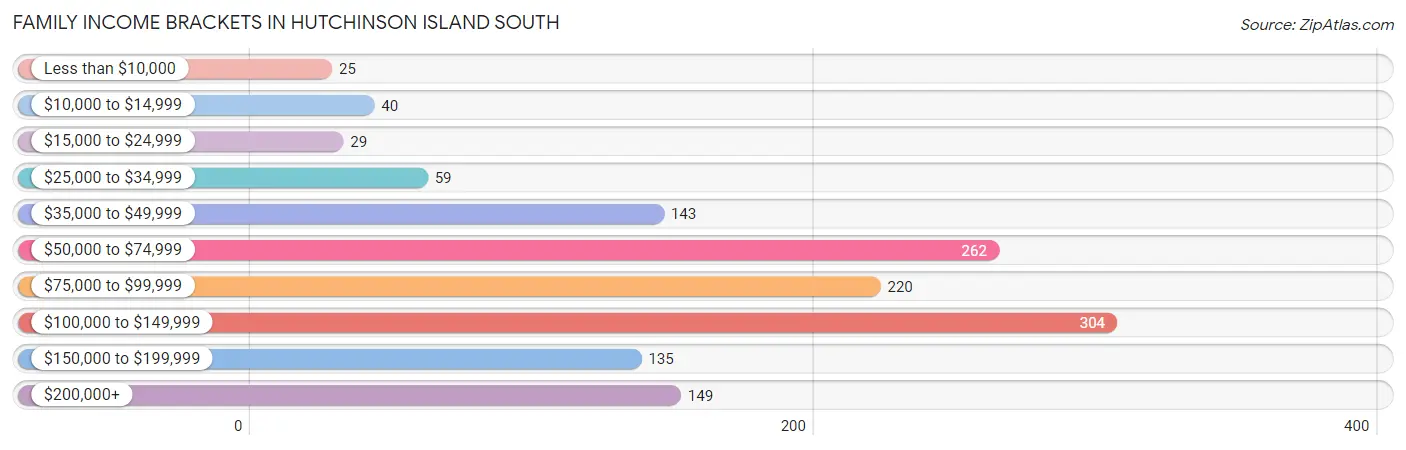
| Income Bracket | # Families | % Families |
| Less than $10,000 | 25 | 1.8% |
| $10,000 to $14,999 | 40 | 2.9% |
| $15,000 to $24,999 | 29 | 2.1% |
| $25,000 to $34,999 | 59 | 4.3% |
| $35,000 to $49,999 | 143 | 10.5% |
| $50,000 to $74,999 | 262 | 19.2% |
| $75,000 to $99,999 | 220 | 16.1% |
| $100,000 to $149,999 | 304 | 22.3% |
| $150,000 to $199,999 | 135 | 9.9% |
| $200,000+ | 149 | 10.9% |
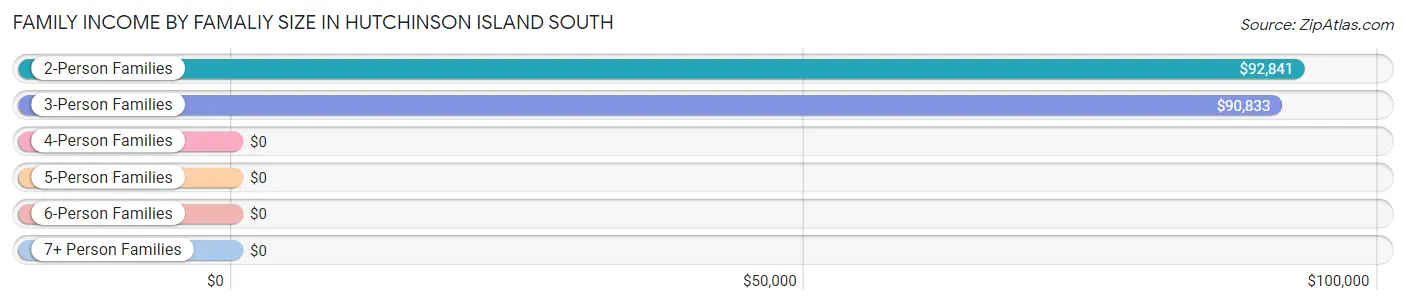
Family Income by Famaliy Size in Hutchinson Island South
2-person families (1,280 | 93.8%) account for the highest median family income in Hutchinson Island South with $92,841 per family, while 2-person families (1,280 | 93.8%) have the highest median income of $46,420 per family member.
| Income Bracket | # Families | Median Income |
| 2-Person Families | 1,280 (93.8%) | $92,841 |
| 3-Person Families | 74 (5.4%) | $90,833 |
| 4-Person Families | 5 (0.4%) | $0 |
| 5-Person Families | 5 (0.4%) | $0 |
| 6-Person Families | 0 (0.0%) | $0 |
| 7+ Person Families | 0 (0.0%) | $0 |
| Total | 1,364 (100.0%) | $92,955 |
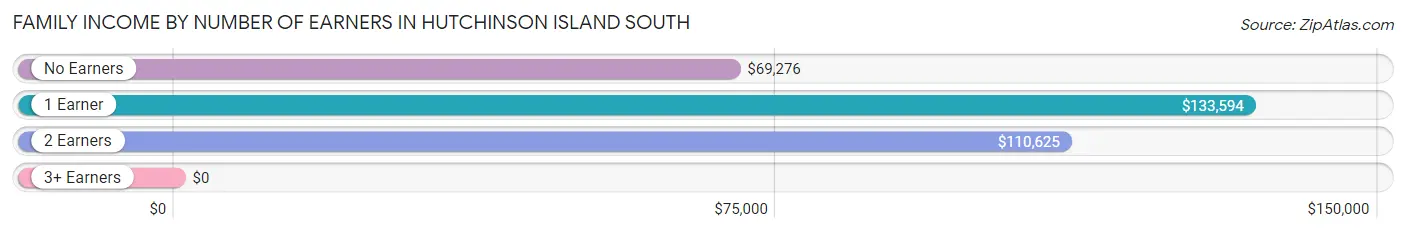
Family Income by Number of Earners in Hutchinson Island South
| Number of Earners | # Families | Median Income |
| No Earners | 855 (62.7%) | $69,276 |
| 1 Earner | 301 (22.1%) | $133,594 |
| 2 Earners | 190 (13.9%) | $110,625 |
| 3+ Earners | 18 (1.3%) | $0 |
| Total | 1,364 (100.0%) | $92,955 |
Household Income in Hutchinson Island South
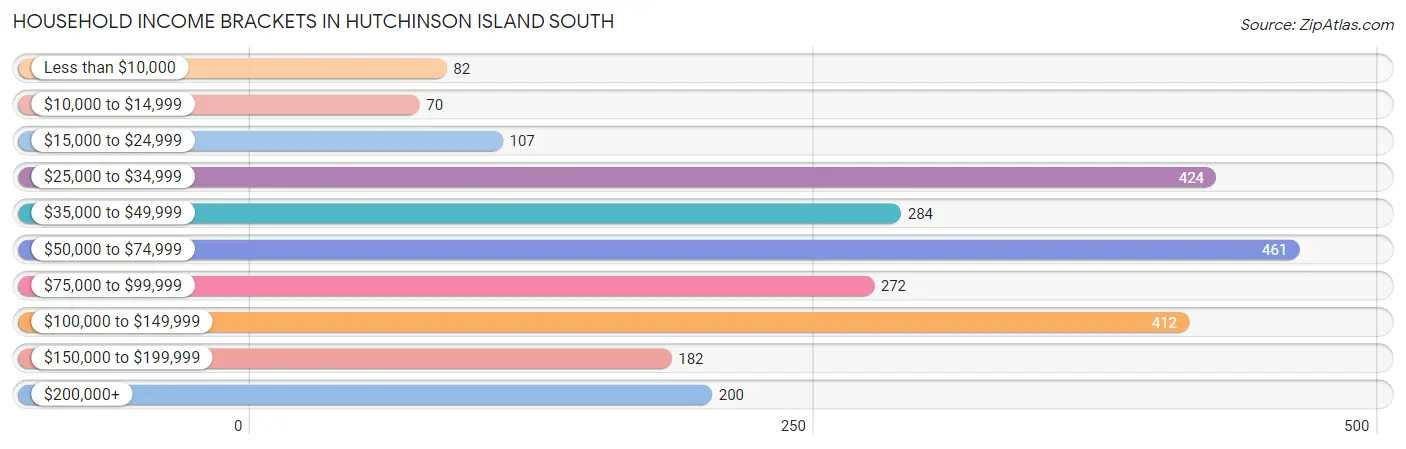
Household Income Brackets in Hutchinson Island South
With 461 households falling in the category, the $50,000 to $74,999 income range is the most frequent in Hutchinson Island South, accounting for 18.5% of all households. In contrast, only 70 households (2.8%) fall into the $10,000 to $14,999 income bracket, making it the least populous group.
| Income Bracket | # Households | % Households |
| Less than $10,000 | 82 | 3.3% |
| $10,000 to $14,999 | 70 | 2.8% |
| $15,000 to $24,999 | 107 | 4.3% |
| $25,000 to $34,999 | 424 | 17.0% |
| $35,000 to $49,999 | 284 | 11.4% |
| $50,000 to $74,999 | 461 | 18.5% |
| $75,000 to $99,999 | 272 | 10.9% |
| $100,000 to $149,999 | 412 | 16.5% |
| $150,000 to $199,999 | 182 | 7.3% |
| $200,000+ | 200 | 8.0% |
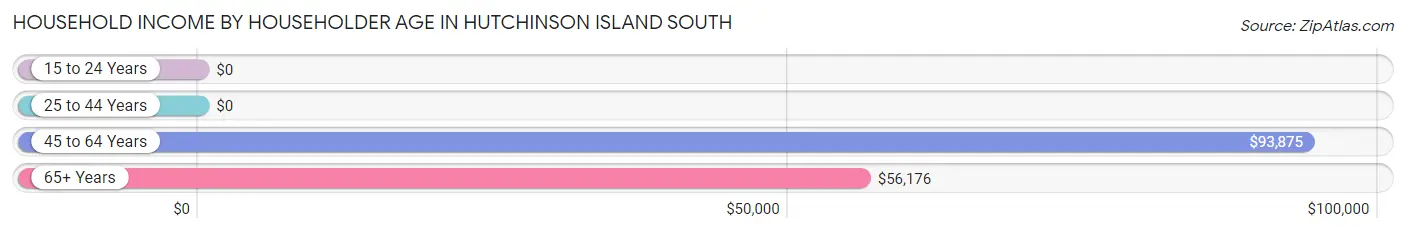
Household Income by Householder Age in Hutchinson Island South
The median household income in Hutchinson Island South is $63,300, with the highest median household income of $93,875 found in the 45 to 64 years age bracket for the primary householder. A total of 453 households (18.2%) fall into this category. Meanwhile, the 15 to 24 years age bracket for the primary householder has the lowest median household income of $0, with 8 households (0.3%) in this group.
| Income Bracket | # Households | Median Income |
| 15 to 24 Years | 8 (0.3%) | $0 |
| 25 to 44 Years | 53 (2.1%) | $0 |
| 45 to 64 Years | 453 (18.2%) | $93,875 |
| 65+ Years | 1,980 (79.4%) | $56,176 |
| Total | 2,494 (100.0%) | $63,300 |
Poverty in Hutchinson Island South
Income Below Poverty by Sex and Age in Hutchinson Island South
With 4.4% poverty level for males and 6.2% for females among the residents of Hutchinson Island South, 45 to 54 year old males and 45 to 54 year old females are the most vulnerable to poverty, with 15 males (19.0%) and 19 females (13.8%) in their respective age groups living below the poverty level.
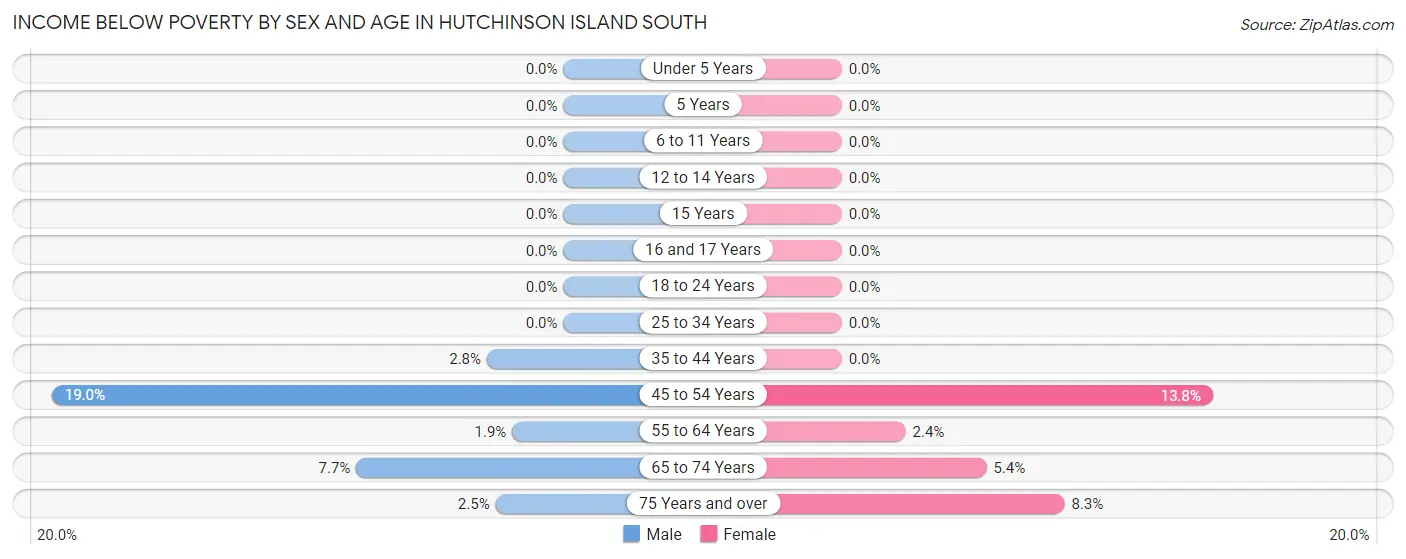
| Age Bracket | Male | Female |
| Under 5 Years | 0 (0.0%) | 0 (0.0%) |
| 5 Years | 0 (0.0%) | 0 (0.0%) |
| 6 to 11 Years | 0 (0.0%) | 0 (0.0%) |
| 12 to 14 Years | 0 (0.0%) | 0 (0.0%) |
| 15 Years | 0 (0.0%) | 0 (0.0%) |
| 16 and 17 Years | 0 (0.0%) | 0 (0.0%) |
| 18 to 24 Years | 0 (0.0%) | 0 (0.0%) |
| 25 to 34 Years | 0 (0.0%) | 0 (0.0%) |
| 35 to 44 Years | 4 (2.8%) | 0 (0.0%) |
| 45 to 54 Years | 15 (19.0%) | 19 (13.8%) |
| 55 to 64 Years | 5 (1.9%) | 8 (2.4%) |
| 65 to 74 Years | 46 (7.7%) | 46 (5.4%) |
| 75 Years and over | 21 (2.5%) | 59 (8.3%) |
| Total | 91 (4.4%) | 132 (6.2%) |
Income Above Poverty by Sex and Age in Hutchinson Island South
According to the poverty statistics in Hutchinson Island South, males aged 6 to 11 years and females aged 6 to 11 years are the age groups that are most secure financially, with 100.0% of males and 100.0% of females in these age groups living above the poverty line.
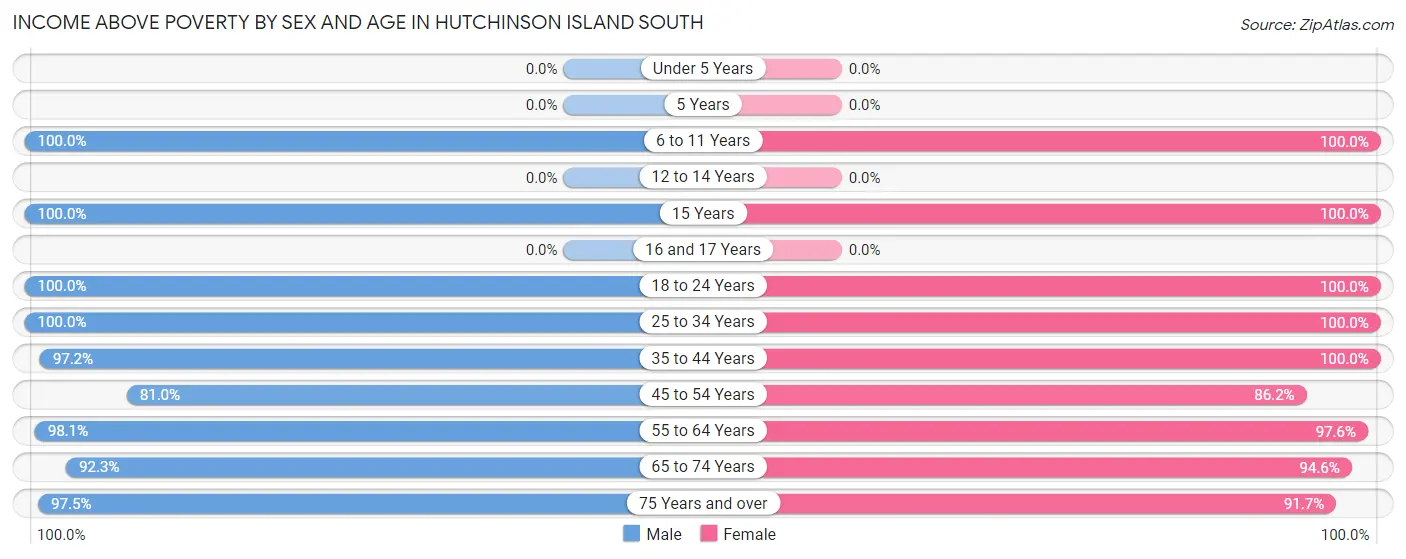
| Age Bracket | Male | Female |
| Under 5 Years | 0 (0.0%) | 0 (0.0%) |
| 5 Years | 0 (0.0%) | 0 (0.0%) |
| 6 to 11 Years | 32 (100.0%) | 9 (100.0%) |
| 12 to 14 Years | 0 (0.0%) | 0 (0.0%) |
| 15 Years | 21 (100.0%) | 7 (100.0%) |
| 16 and 17 Years | 0 (0.0%) | 0 (0.0%) |
| 18 to 24 Years | 34 (100.0%) | 17 (100.0%) |
| 25 to 34 Years | 63 (100.0%) | 51 (100.0%) |
| 35 to 44 Years | 137 (97.2%) | 8 (100.0%) |
| 45 to 54 Years | 64 (81.0%) | 119 (86.2%) |
| 55 to 64 Years | 258 (98.1%) | 330 (97.6%) |
| 65 to 74 Years | 552 (92.3%) | 811 (94.6%) |
| 75 Years and over | 813 (97.5%) | 654 (91.7%) |
| Total | 1,974 (95.6%) | 2,006 (93.8%) |
Income Below Poverty Among Married-Couple Families in Hutchinson Island South
The poverty statistics for married-couple families in Hutchinson Island South show that 5.1% or 64 of the total 1,268 families live below the poverty line. Families with no children have the highest poverty rate of 5.1%, comprising of 64 families. On the other hand, families with 1 or 2 children have the lowest poverty rate of 0.0%, which includes 0 families.
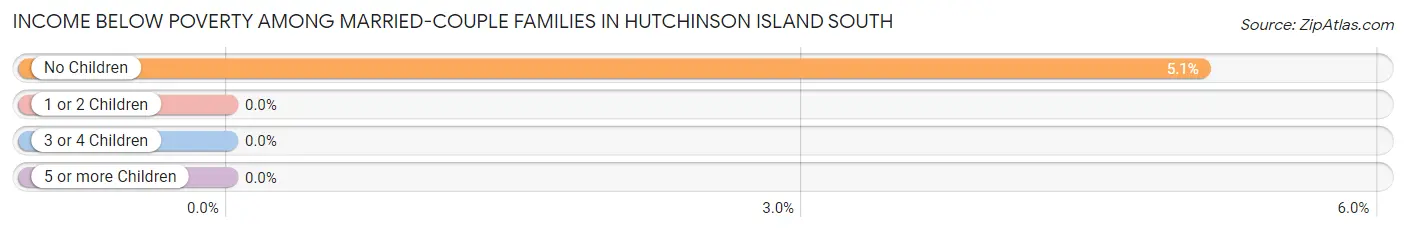
| Children | Above Poverty | Below Poverty |
| No Children | 1,195 (94.9%) | 64 (5.1%) |
| 1 or 2 Children | 9 (100.0%) | 0 (0.0%) |
| 3 or 4 Children | 0 (0.0%) | 0 (0.0%) |
| 5 or more Children | 0 (0.0%) | 0 (0.0%) |
| Total | 1,204 (95.0%) | 64 (5.1%) |
Income Below Poverty Among Single-Parent Households in Hutchinson Island South
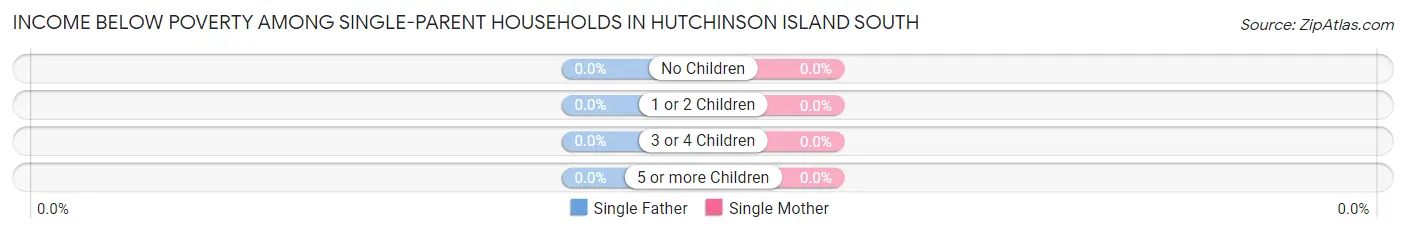
| Children | Single Father | Single Mother |
| No Children | 0 (0.0%) | 0 (0.0%) |
| 1 or 2 Children | 0 (0.0%) | 0 (0.0%) |
| 3 or 4 Children | 0 (0.0%) | 0 (0.0%) |
| 5 or more Children | 0 (0.0%) | 0 (0.0%) |
| Total | 0 (0.0%) | 0 (0.0%) |
Income Below Poverty Among Married-Couple vs Single-Parent Households in Hutchinson Island South
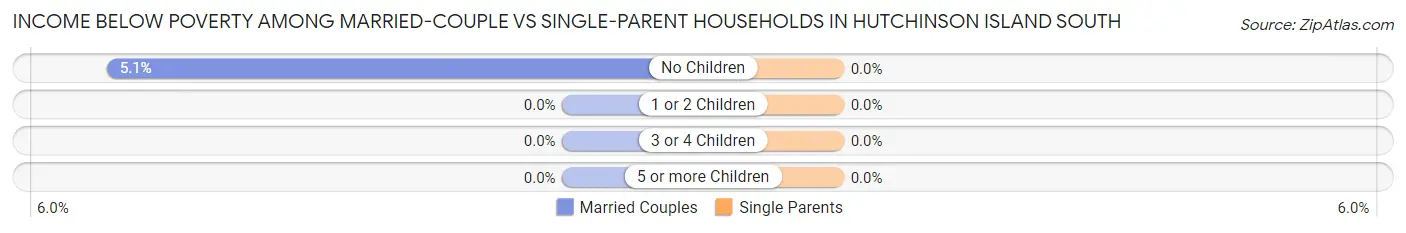
| Children | Married-Couple Families | Single-Parent Households |
| No Children | 64 (5.1%) | 0 (0.0%) |
| 1 or 2 Children | 0 (0.0%) | 0 (0.0%) |
| 3 or 4 Children | 0 (0.0%) | 0 (0.0%) |
| 5 or more Children | 0 (0.0%) | 0 (0.0%) |
| Total | 64 (5.1%) | 0 (0.0%) |
Employment Characteristics in Hutchinson Island South
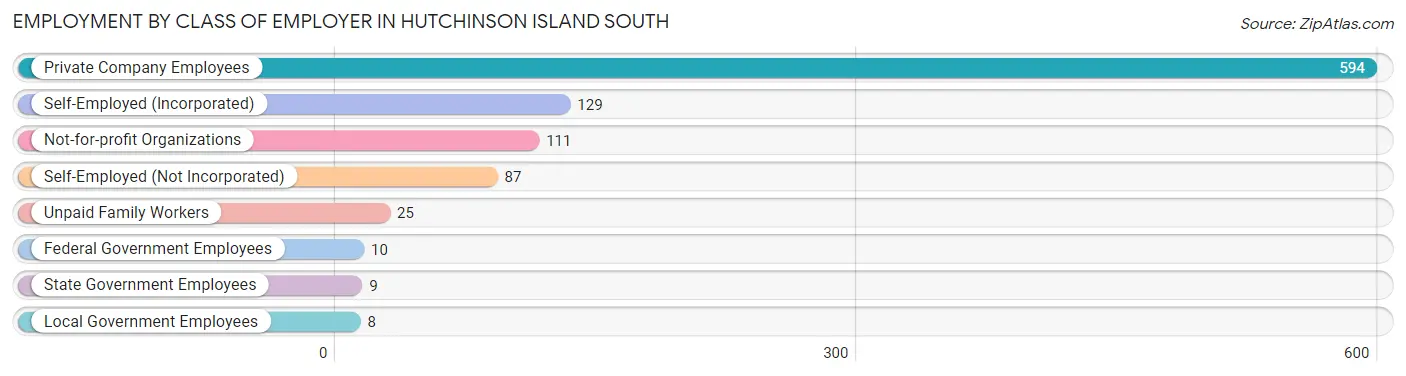
Employment by Class of Employer in Hutchinson Island South
Among the 973 employed individuals in Hutchinson Island South, private company employees (594 | 61.1%), self-employed (incorporated) (129 | 13.3%), and not-for-profit organizations (111 | 11.4%) make up the most common classes of employment.
| Employer Class | # Employees | % Employees |
| Private Company Employees | 594 | 61.1% |
| Self-Employed (Incorporated) | 129 | 13.3% |
| Self-Employed (Not Incorporated) | 87 | 8.9% |
| Not-for-profit Organizations | 111 | 11.4% |
| Local Government Employees | 8 | 0.8% |
| State Government Employees | 9 | 0.9% |
| Federal Government Employees | 10 | 1.0% |
| Unpaid Family Workers | 25 | 2.6% |
| Total | 973 | 100.0% |
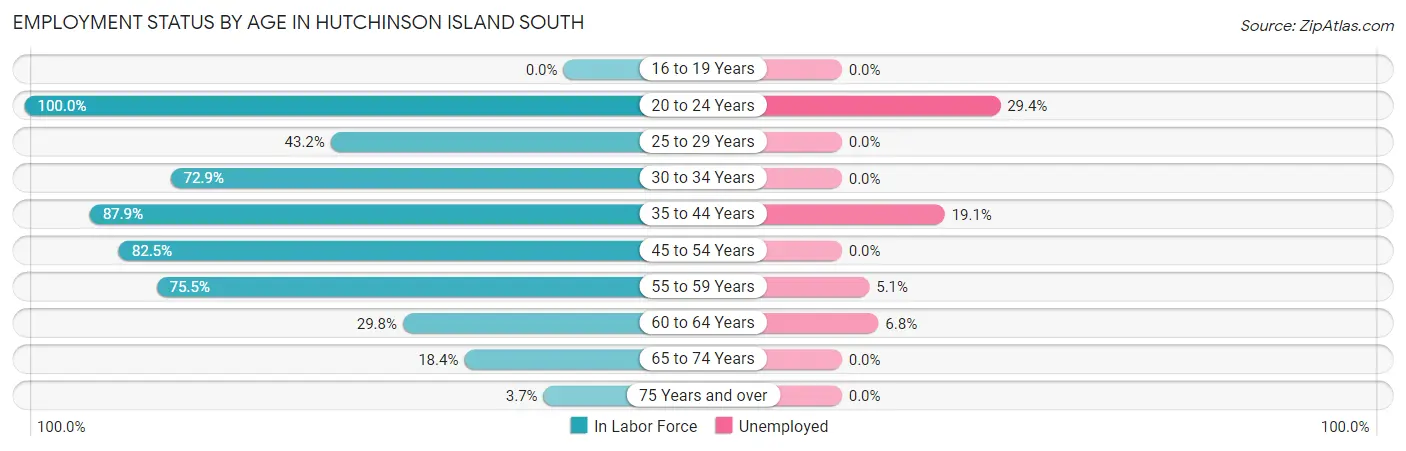
Employment Status by Age in Hutchinson Island South
According to the labor force statistics for Hutchinson Island South, out of the total population over 16 years of age (4,134), 24.9% or 1,029 individuals are in the labor force, with 5.4% or 56 of them unemployed. The age group with the highest labor force participation rate is 20 to 24 years, with 100.0% or 51 individuals in the labor force. Within the labor force, the 20 to 24 years age range has the highest percentage of unemployed individuals, with 29.4% or 15 of them being unemployed.
| Age Bracket | In Labor Force | Unemployed |
| 16 to 19 Years | 0 (0.0%) | 0 (0.0%) |
| 20 to 24 Years | 51 (100.0%) | 15 (29.4%) |
| 25 to 29 Years | 19 (43.2%) | 0 (0.0%) |
| 30 to 34 Years | 51 (72.9%) | 0 (0.0%) |
| 35 to 44 Years | 131 (87.9%) | 25 (19.1%) |
| 45 to 54 Years | 179 (82.5%) | 0 (0.0%) |
| 55 to 59 Years | 157 (75.5%) | 8 (5.1%) |
| 60 to 64 Years | 117 (29.8%) | 8 (6.8%) |
| 65 to 74 Years | 268 (18.4%) | 0 (0.0%) |
| 75 Years and over | 57 (3.7%) | 0 (0.0%) |
| Total | 1,029 (24.9%) | 56 (5.4%) |
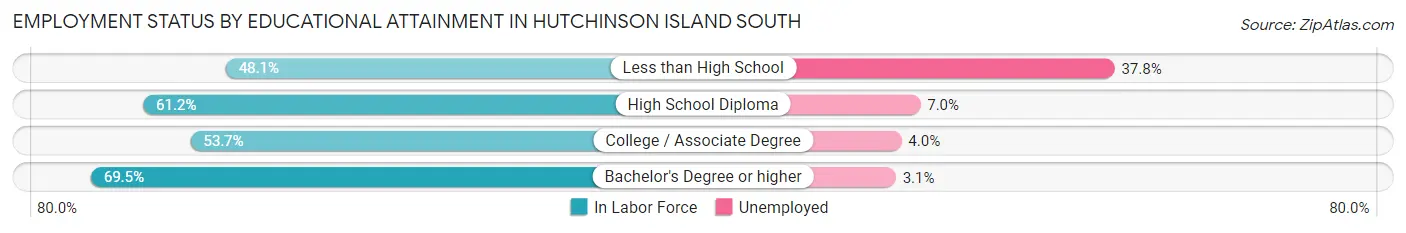
Employment Status by Educational Attainment in Hutchinson Island South
According to labor force statistics for Hutchinson Island South, 60.5% of individuals (654) out of the total population between 25 and 64 years of age (1,081) are in the labor force, with 6.3% or 41 of them being unemployed. The group with the highest labor force participation rate are those with the educational attainment of bachelor's degree or higher, with 69.5% or 257 individuals in the labor force. Within the labor force, individuals with less than high school education have the highest percentage of unemployment, with 37.8% or 14 of them being unemployed.
| Educational Attainment | In Labor Force | Unemployed |
| Less than High School | 37 (48.1%) | 29 (37.8%) |
| High School Diploma | 158 (61.2%) | 18 (7.0%) |
| College / Associate Degree | 202 (53.7%) | 15 (4.0%) |
| Bachelor's Degree or higher | 257 (69.5%) | 11 (3.1%) |
| Total | 654 (60.5%) | 68 (6.3%) |
Employment Occupations by Sex in Hutchinson Island South
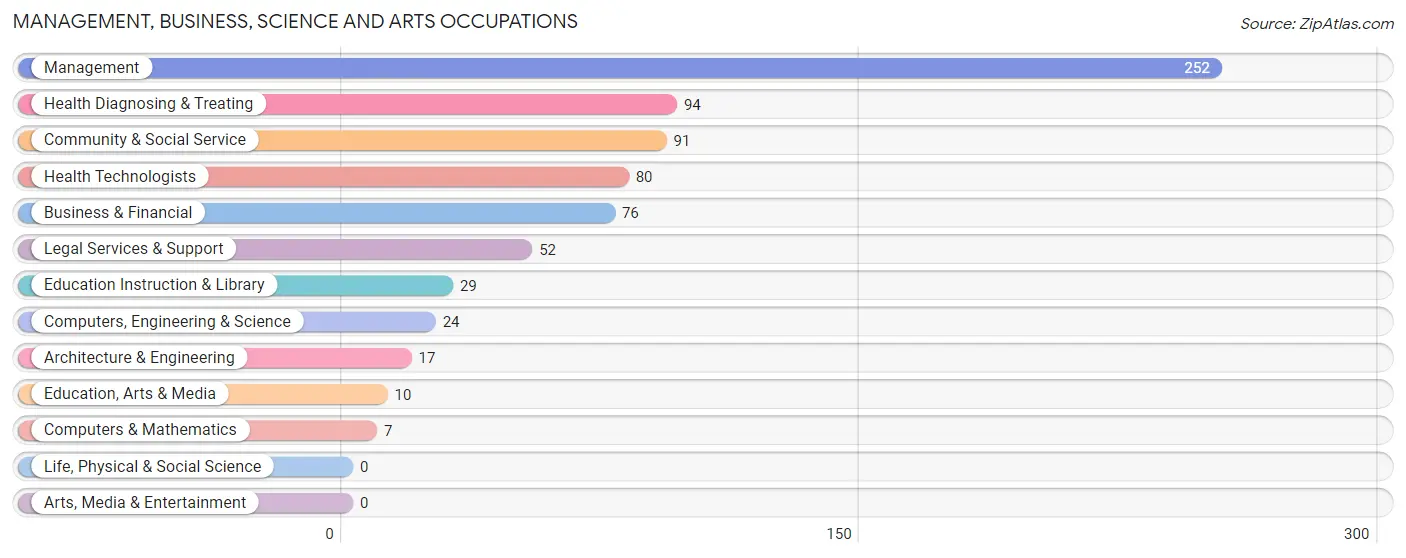
Management, Business, Science and Arts Occupations
The most common Management, Business, Science and Arts occupations in Hutchinson Island South are Management (252 | 25.9%), Health Diagnosing & Treating (94 | 9.7%), Community & Social Service (91 | 9.3%), Health Technologists (80 | 8.2%), and Business & Financial (76 | 7.8%).
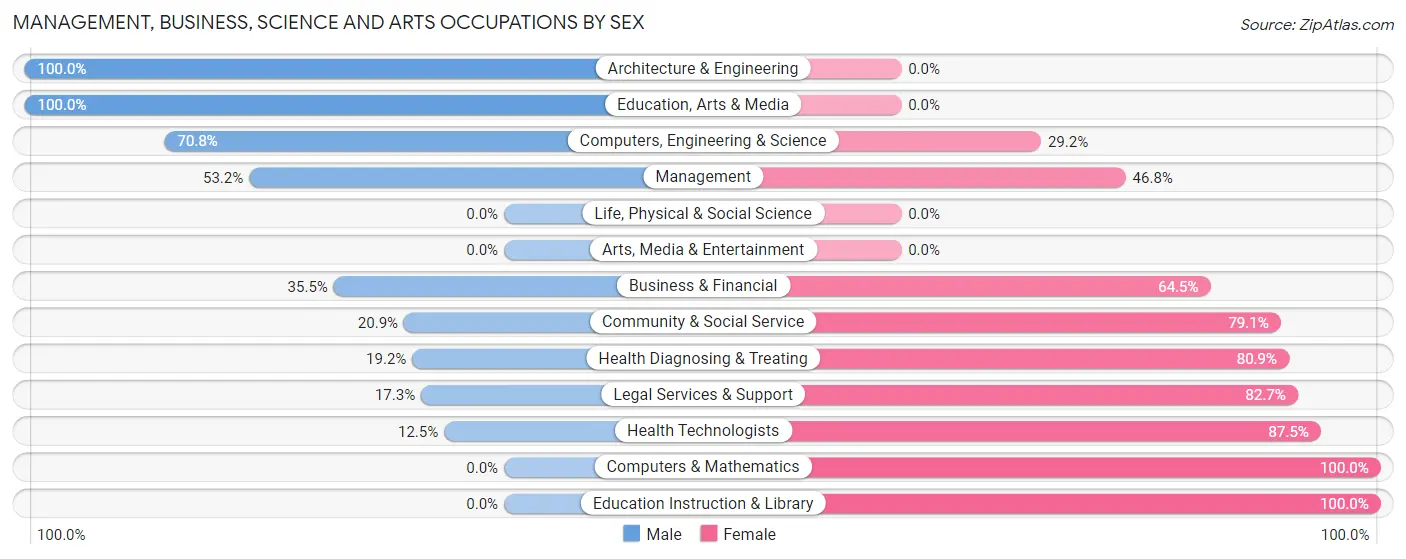
Management, Business, Science and Arts Occupations by Sex
Within the Management, Business, Science and Arts occupations in Hutchinson Island South, the most male-oriented occupations are Architecture & Engineering (100.0%), Education, Arts & Media (100.0%), and Computers, Engineering & Science (70.8%), while the most female-oriented occupations are Computers & Mathematics (100.0%), Education Instruction & Library (100.0%), and Health Technologists (87.5%).
| Occupation | Male | Female |
| Management | 134 (53.2%) | 118 (46.8%) |
| Business & Financial | 27 (35.5%) | 49 (64.5%) |
| Computers, Engineering & Science | 17 (70.8%) | 7 (29.2%) |
| Computers & Mathematics | 0 (0.0%) | 7 (100.0%) |
| Architecture & Engineering | 17 (100.0%) | 0 (0.0%) |
| Life, Physical & Social Science | 0 (0.0%) | 0 (0.0%) |
| Community & Social Service | 19 (20.9%) | 72 (79.1%) |
| Education, Arts & Media | 10 (100.0%) | 0 (0.0%) |
| Legal Services & Support | 9 (17.3%) | 43 (82.7%) |
| Education Instruction & Library | 0 (0.0%) | 29 (100.0%) |
| Arts, Media & Entertainment | 0 (0.0%) | 0 (0.0%) |
| Health Diagnosing & Treating | 18 (19.2%) | 76 (80.8%) |
| Health Technologists | 10 (12.5%) | 70 (87.5%) |
| Total (Category) | 215 (40.0%) | 322 (60.0%) |
| Total (Overall) | 427 (43.9%) | 546 (56.1%) |
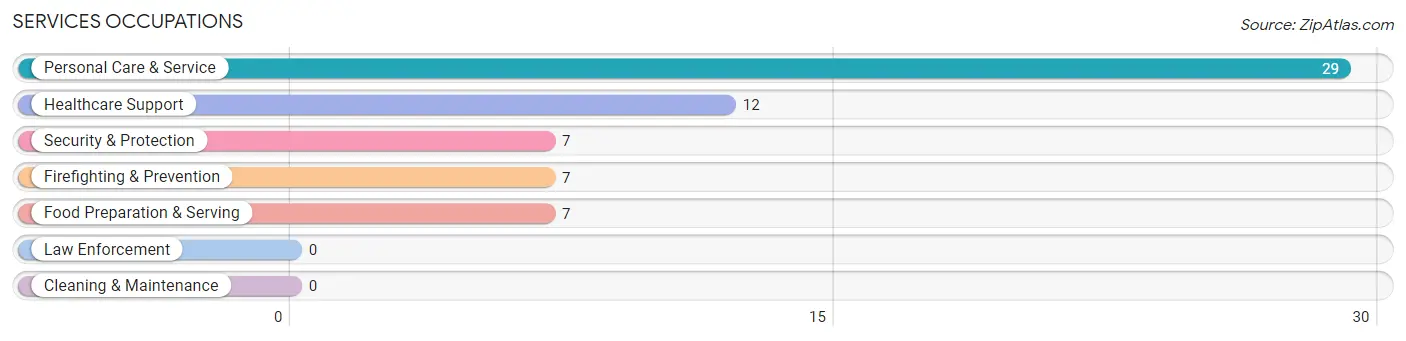
Services Occupations
The most common Services occupations in Hutchinson Island South are Personal Care & Service (29 | 3.0%), Healthcare Support (12 | 1.2%), Security & Protection (7 | 0.7%), Firefighting & Prevention (7 | 0.7%), and Food Preparation & Serving (7 | 0.7%).
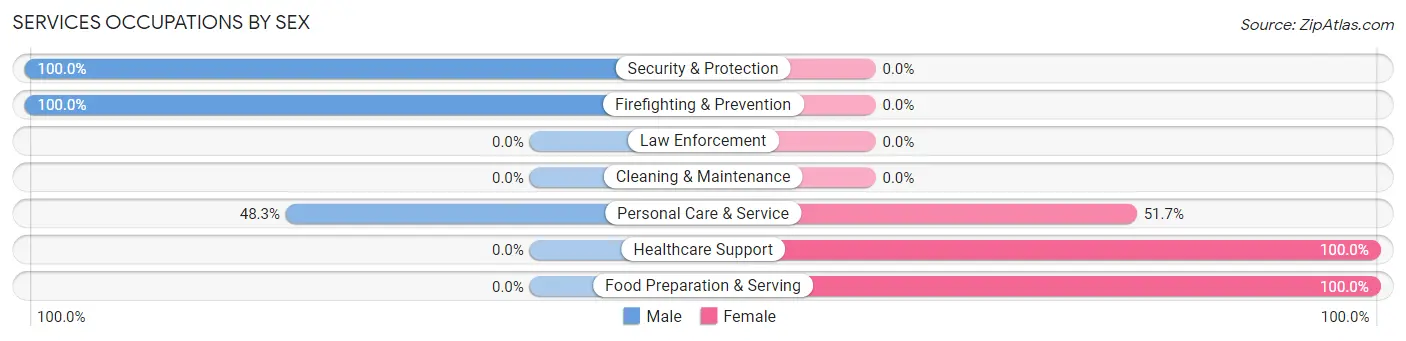
Services Occupations by Sex
Within the Services occupations in Hutchinson Island South, the most male-oriented occupations are Security & Protection (100.0%), Firefighting & Prevention (100.0%), and Personal Care & Service (48.3%), while the most female-oriented occupations are Healthcare Support (100.0%), Food Preparation & Serving (100.0%), and Personal Care & Service (51.7%).
| Occupation | Male | Female |
| Healthcare Support | 0 (0.0%) | 12 (100.0%) |
| Security & Protection | 7 (100.0%) | 0 (0.0%) |
| Firefighting & Prevention | 7 (100.0%) | 0 (0.0%) |
| Law Enforcement | 0 (0.0%) | 0 (0.0%) |
| Food Preparation & Serving | 0 (0.0%) | 7 (100.0%) |
| Cleaning & Maintenance | 0 (0.0%) | 0 (0.0%) |
| Personal Care & Service | 14 (48.3%) | 15 (51.7%) |
| Total (Category) | 21 (38.2%) | 34 (61.8%) |
| Total (Overall) | 427 (43.9%) | 546 (56.1%) |
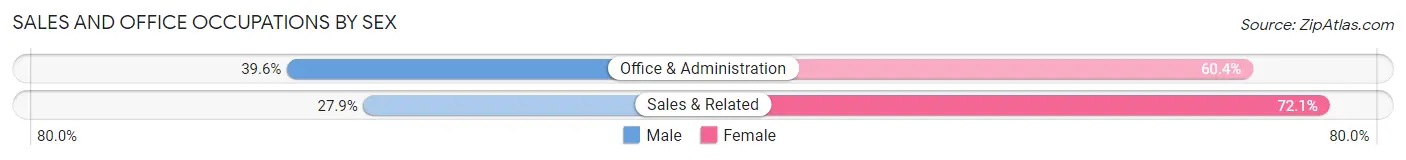
Sales and Office Occupations
The most common Sales and Office occupations in Hutchinson Island South are Sales & Related (140 | 14.4%), and Office & Administration (101 | 10.4%).
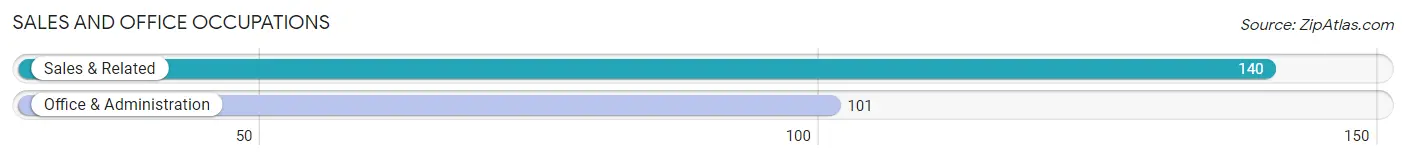
Sales and Office Occupations by Sex
| Occupation | Male | Female |
| Sales & Related | 39 (27.9%) | 101 (72.1%) |
| Office & Administration | 40 (39.6%) | 61 (60.4%) |
| Total (Category) | 79 (32.8%) | 162 (67.2%) |
| Total (Overall) | 427 (43.9%) | 546 (56.1%) |
Natural Resources, Construction and Maintenance Occupations
The most common Natural Resources, Construction and Maintenance occupations in Hutchinson Island South are , and Installation, Maintenance & Repair (31 | 3.2%).
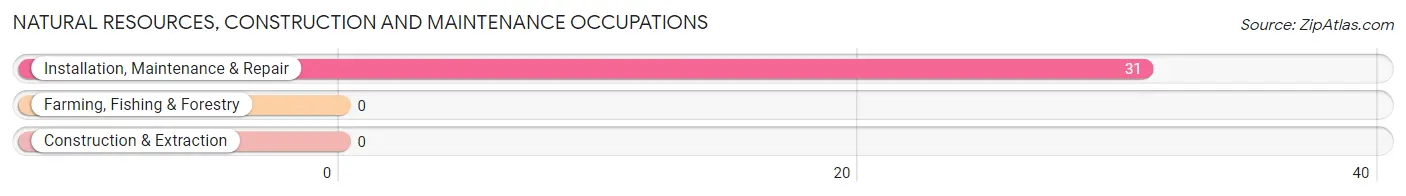
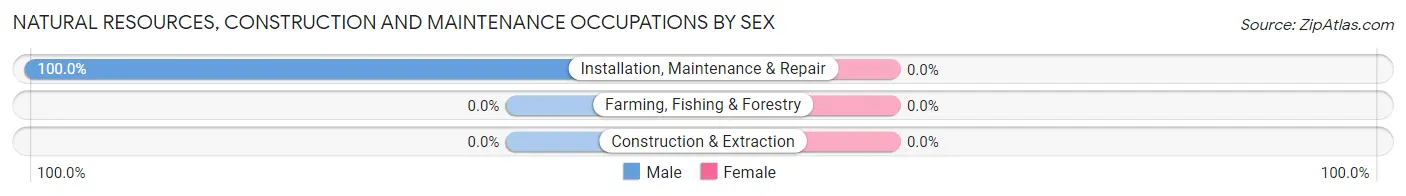
Natural Resources, Construction and Maintenance Occupations by Sex
| Occupation | Male | Female |
| Farming, Fishing & Forestry | 0 (0.0%) | 0 (0.0%) |
| Construction & Extraction | 0 (0.0%) | 0 (0.0%) |
| Installation, Maintenance & Repair | 31 (100.0%) | 0 (0.0%) |
| Total (Category) | 31 (100.0%) | 0 (0.0%) |
| Total (Overall) | 427 (43.9%) | 546 (56.1%) |
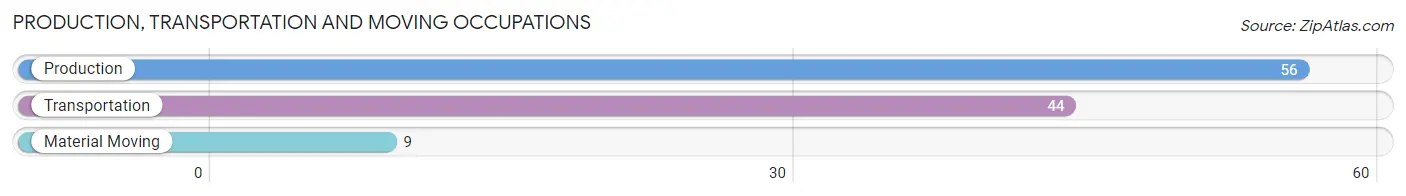
Production, Transportation and Moving Occupations
The most common Production, Transportation and Moving occupations in Hutchinson Island South are Production (56 | 5.8%), Transportation (44 | 4.5%), and Material Moving (9 | 0.9%).
Production, Transportation and Moving Occupations by Sex
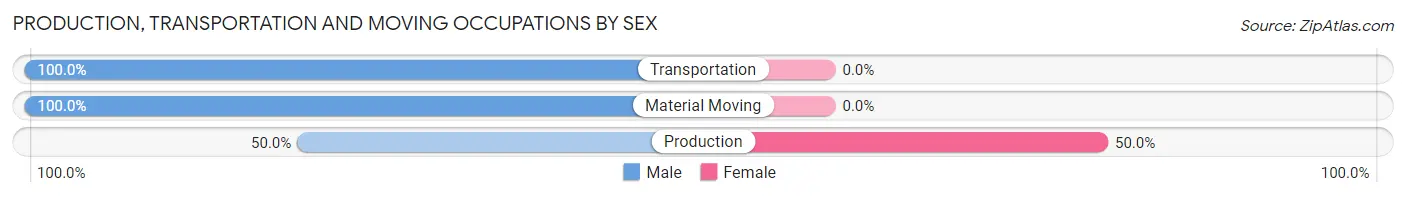
| Occupation | Male | Female |
| Production | 28 (50.0%) | 28 (50.0%) |
| Transportation | 44 (100.0%) | 0 (0.0%) |
| Material Moving | 9 (100.0%) | 0 (0.0%) |
| Total (Category) | 81 (74.3%) | 28 (25.7%) |
| Total (Overall) | 427 (43.9%) | 546 (56.1%) |
Employment Industries by Sex in Hutchinson Island South
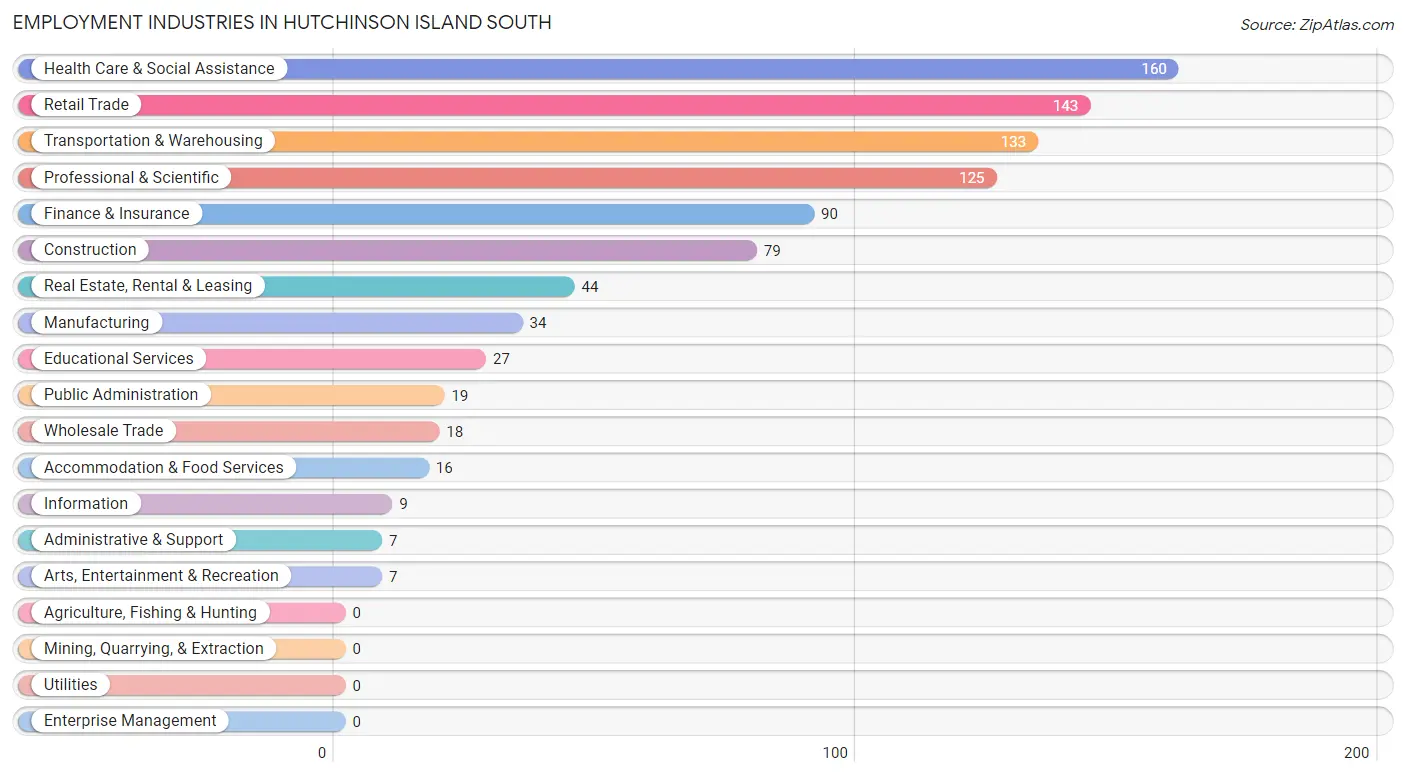
Employment Industries in Hutchinson Island South
The major employment industries in Hutchinson Island South include Health Care & Social Assistance (160 | 16.4%), Retail Trade (143 | 14.7%), Transportation & Warehousing (133 | 13.7%), Professional & Scientific (125 | 12.9%), and Finance & Insurance (90 | 9.2%).
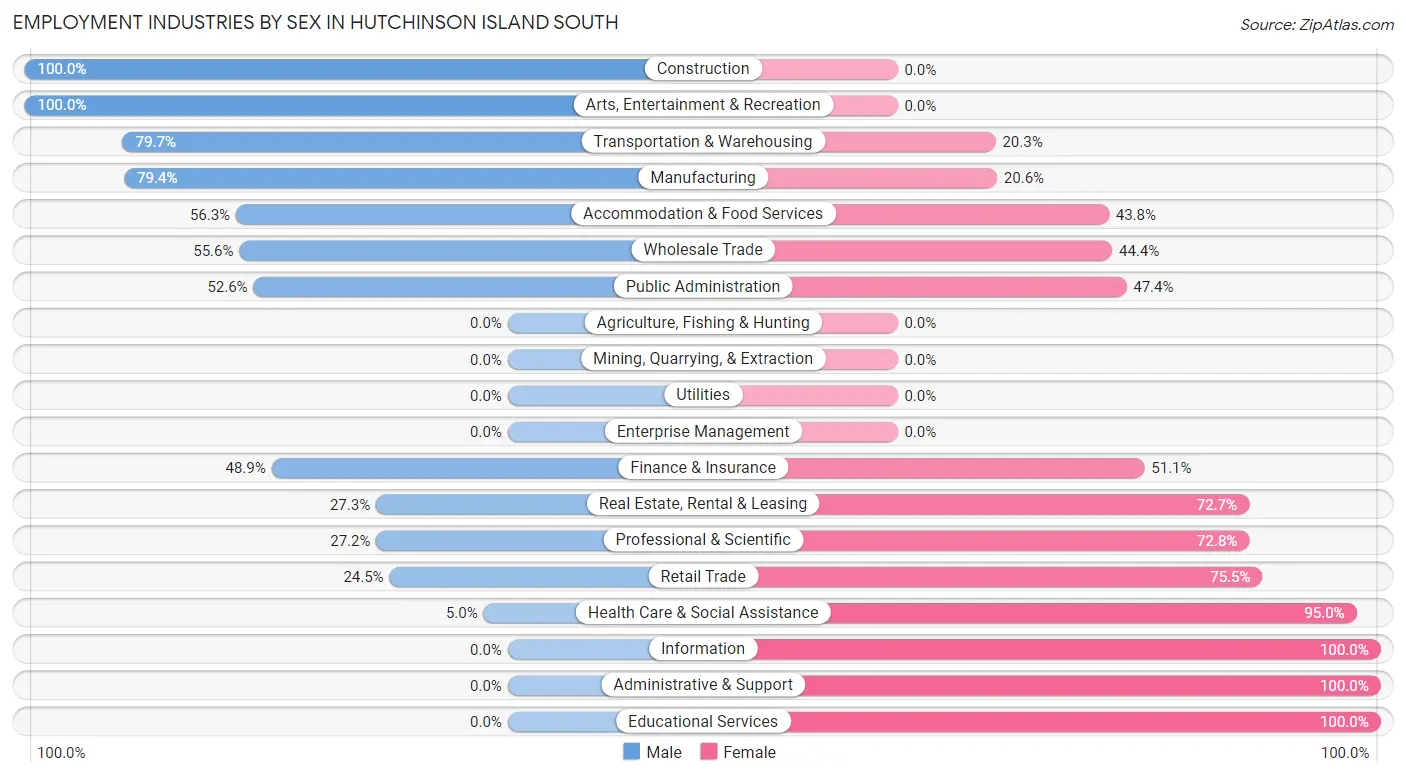
Employment Industries by Sex in Hutchinson Island South
The Hutchinson Island South industries that see more men than women are Construction (100.0%), Arts, Entertainment & Recreation (100.0%), and Transportation & Warehousing (79.7%), whereas the industries that tend to have a higher number of women are Information (100.0%), Administrative & Support (100.0%), and Educational Services (100.0%).
| Industry | Male | Female |
| Agriculture, Fishing & Hunting | 0 (0.0%) | 0 (0.0%) |
| Mining, Quarrying, & Extraction | 0 (0.0%) | 0 (0.0%) |
| Construction | 79 (100.0%) | 0 (0.0%) |
| Manufacturing | 27 (79.4%) | 7 (20.6%) |
| Wholesale Trade | 10 (55.6%) | 8 (44.4%) |
| Retail Trade | 35 (24.5%) | 108 (75.5%) |
| Transportation & Warehousing | 106 (79.7%) | 27 (20.3%) |
| Utilities | 0 (0.0%) | 0 (0.0%) |
| Information | 0 (0.0%) | 9 (100.0%) |
| Finance & Insurance | 44 (48.9%) | 46 (51.1%) |
| Real Estate, Rental & Leasing | 12 (27.3%) | 32 (72.7%) |
| Professional & Scientific | 34 (27.2%) | 91 (72.8%) |
| Enterprise Management | 0 (0.0%) | 0 (0.0%) |
| Administrative & Support | 0 (0.0%) | 7 (100.0%) |
| Educational Services | 0 (0.0%) | 27 (100.0%) |
| Health Care & Social Assistance | 8 (5.0%) | 152 (95.0%) |
| Arts, Entertainment & Recreation | 7 (100.0%) | 0 (0.0%) |
| Accommodation & Food Services | 9 (56.2%) | 7 (43.8%) |
| Public Administration | 10 (52.6%) | 9 (47.4%) |
| Total | 427 (43.9%) | 546 (56.1%) |
Education in Hutchinson Island South
School Enrollment in Hutchinson Island South
The most common levels of schooling among the 114 students in Hutchinson Island South are college / undergraduate (45 | 39.5%), elementary school (32 | 28.1%), and high school (28 | 24.6%).
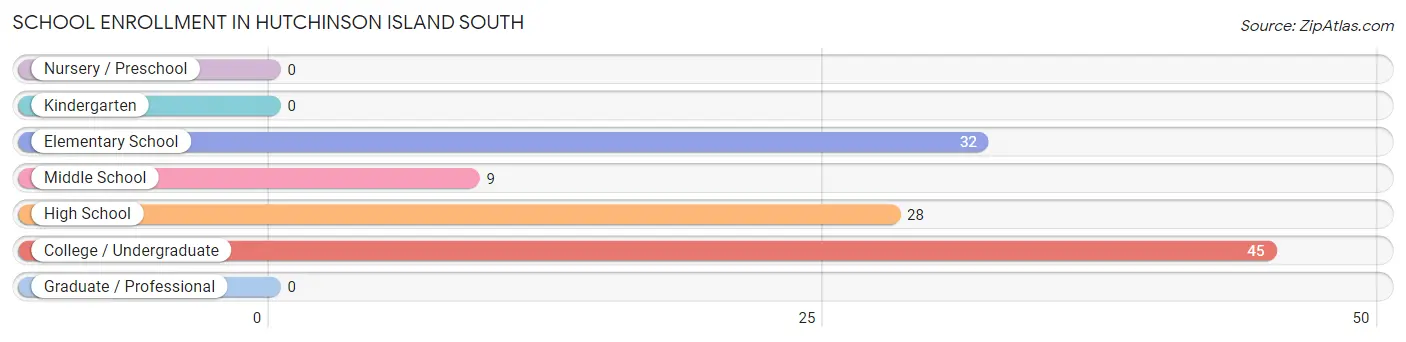
| School Level | # Students | % Students |
| Nursery / Preschool | 0 | 0.0% |
| Kindergarten | 0 | 0.0% |
| Elementary School | 32 | 28.1% |
| Middle School | 9 | 7.9% |
| High School | 28 | 24.6% |
| College / Undergraduate | 45 | 39.5% |
| Graduate / Professional | 0 | 0.0% |
| Total | 114 | 100.0% |
School Enrollment by Age by Funding Source in Hutchinson Island South
Out of a total of 114 students who are enrolled in schools in Hutchinson Island South, 49 (43.0%) attend a private institution, while the remaining 65 (57.0%) are enrolled in public schools. The age group of 10 to 14 year olds has the highest likelihood of being enrolled in private schools, with 9 (100.0% in the age bracket) enrolled. Conversely, the age group of 5 to 9 year old has the lowest likelihood of being enrolled in a private school, with 32 (100.0% in the age bracket) attending a public institution.
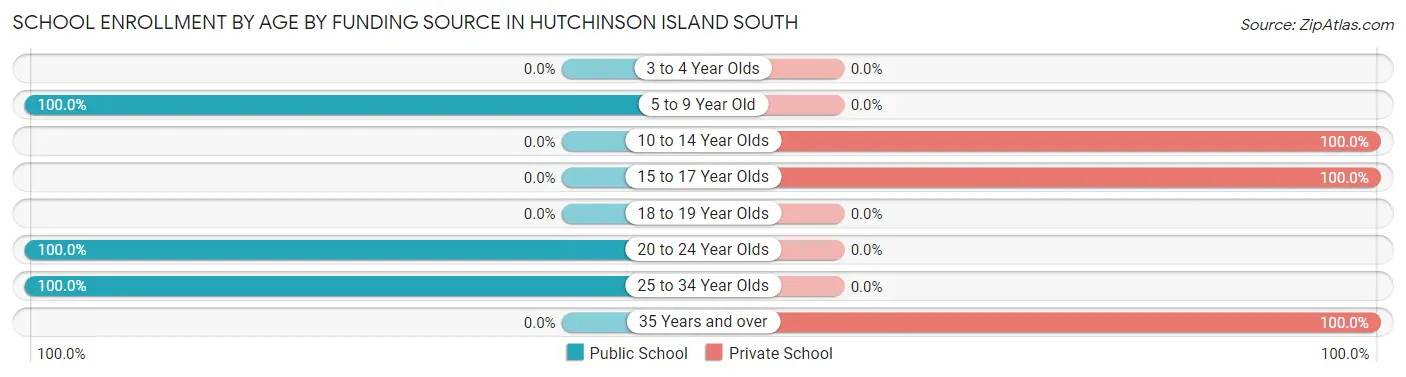
| Age Bracket | Public School | Private School |
| 3 to 4 Year Olds | 0 (0.0%) | 0 (0.0%) |
| 5 to 9 Year Old | 32 (100.0%) | 0 (0.0%) |
| 10 to 14 Year Olds | 0 (0.0%) | 9 (100.0%) |
| 15 to 17 Year Olds | 0 (0.0%) | 28 (100.0%) |
| 18 to 19 Year Olds | 0 (0.0%) | 0 (0.0%) |
| 20 to 24 Year Olds | 9 (100.0%) | 0 (0.0%) |
| 25 to 34 Year Olds | 24 (100.0%) | 0 (0.0%) |
| 35 Years and over | 0 (0.0%) | 12 (100.0%) |
| Total | 65 (57.0%) | 49 (43.0%) |
Educational Attainment by Field of Study in Hutchinson Island South
Education (409 | 23.9%), business (305 | 17.8%), science & technology (211 | 12.3%), social sciences (195 | 11.4%), and engineering (107 | 6.2%) are the most common fields of study among 1,713 individuals in Hutchinson Island South who have obtained a bachelor's degree or higher.
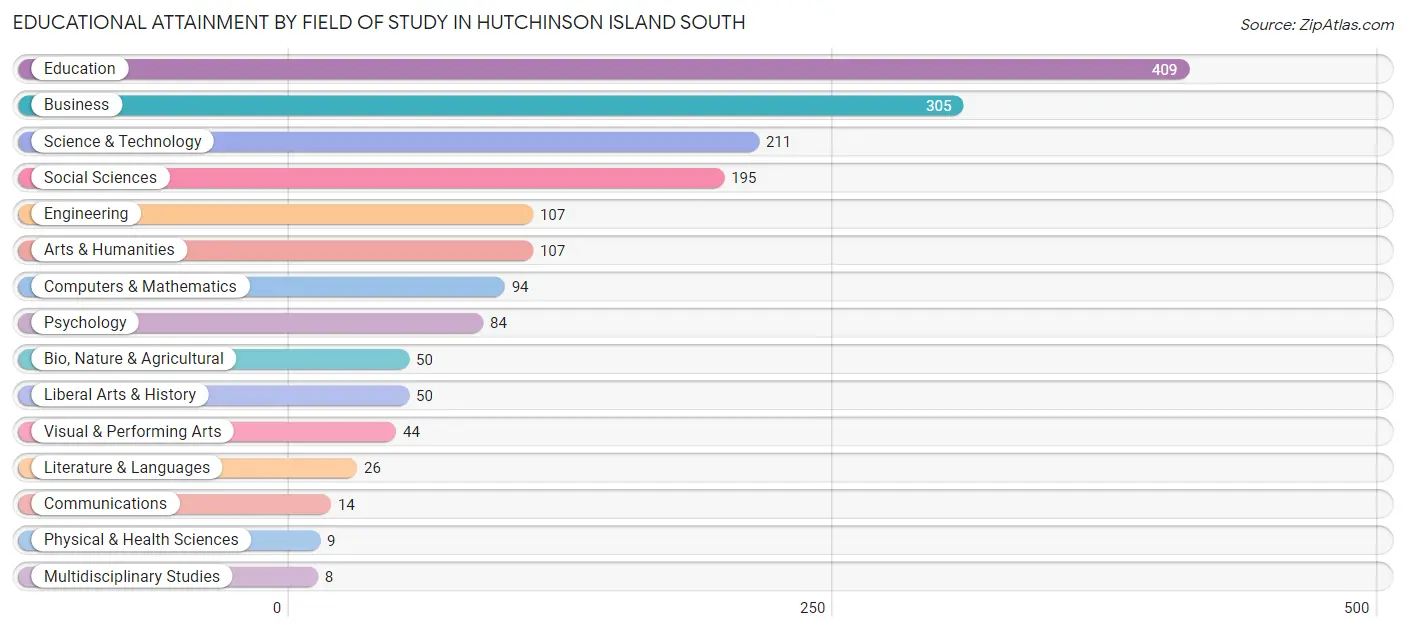
| Field of Study | # Graduates | % Graduates |
| Computers & Mathematics | 94 | 5.5% |
| Bio, Nature & Agricultural | 50 | 2.9% |
| Physical & Health Sciences | 9 | 0.5% |
| Psychology | 84 | 4.9% |
| Social Sciences | 195 | 11.4% |
| Engineering | 107 | 6.2% |
| Multidisciplinary Studies | 8 | 0.5% |
| Science & Technology | 211 | 12.3% |
| Business | 305 | 17.8% |
| Education | 409 | 23.9% |
| Literature & Languages | 26 | 1.5% |
| Liberal Arts & History | 50 | 2.9% |
| Visual & Performing Arts | 44 | 2.6% |
| Communications | 14 | 0.8% |
| Arts & Humanities | 107 | 6.2% |
| Total | 1,713 | 100.0% |
Transportation & Commute in Hutchinson Island South
Vehicle Availability by Sex in Hutchinson Island South
The most prevalent vehicle ownership categories in Hutchinson Island South are males with 2 vehicles (272, accounting for 63.7%) and females with 2 vehicles (268, making up 49.8%).
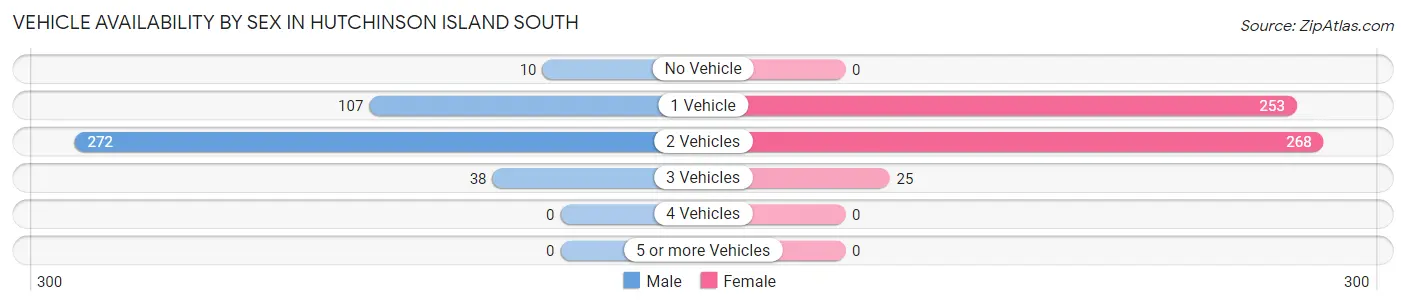
| Vehicles Available | Male | Female |
| No Vehicle | 10 (2.3%) | 0 (0.0%) |
| 1 Vehicle | 107 (25.1%) | 253 (46.3%) |
| 2 Vehicles | 272 (63.7%) | 268 (49.1%) |
| 3 Vehicles | 38 (8.9%) | 25 (4.6%) |
| 4 Vehicles | 0 (0.0%) | 0 (0.0%) |
| 5 or more Vehicles | 0 (0.0%) | 0 (0.0%) |
| Total | 427 (100.0%) | 546 (100.0%) |
Commute Time in Hutchinson Island South
The most frequently occuring commute durations in Hutchinson Island South are 20 to 24 minutes (230 commuters, 29.3%), 30 to 34 minutes (118 commuters, 15.0%), and 15 to 19 minutes (110 commuters, 14.0%).
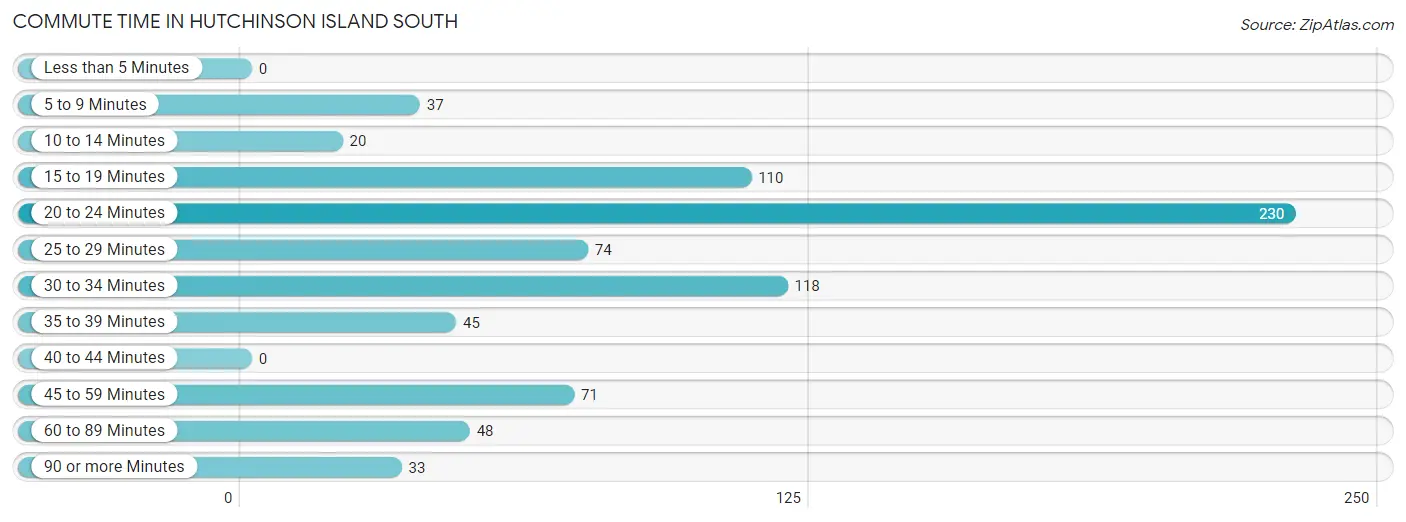
| Commute Time | # Commuters | % Commuters |
| Less than 5 Minutes | 0 | 0.0% |
| 5 to 9 Minutes | 37 | 4.7% |
| 10 to 14 Minutes | 20 | 2.5% |
| 15 to 19 Minutes | 110 | 14.0% |
| 20 to 24 Minutes | 230 | 29.3% |
| 25 to 29 Minutes | 74 | 9.4% |
| 30 to 34 Minutes | 118 | 15.0% |
| 35 to 39 Minutes | 45 | 5.7% |
| 40 to 44 Minutes | 0 | 0.0% |
| 45 to 59 Minutes | 71 | 9.0% |
| 60 to 89 Minutes | 48 | 6.1% |
| 90 or more Minutes | 33 | 4.2% |
Commute Time by Sex in Hutchinson Island South
The most common commute times in Hutchinson Island South are 20 to 24 minutes (98 commuters, 31.2%) for males and 20 to 24 minutes (132 commuters, 28.0%) for females.
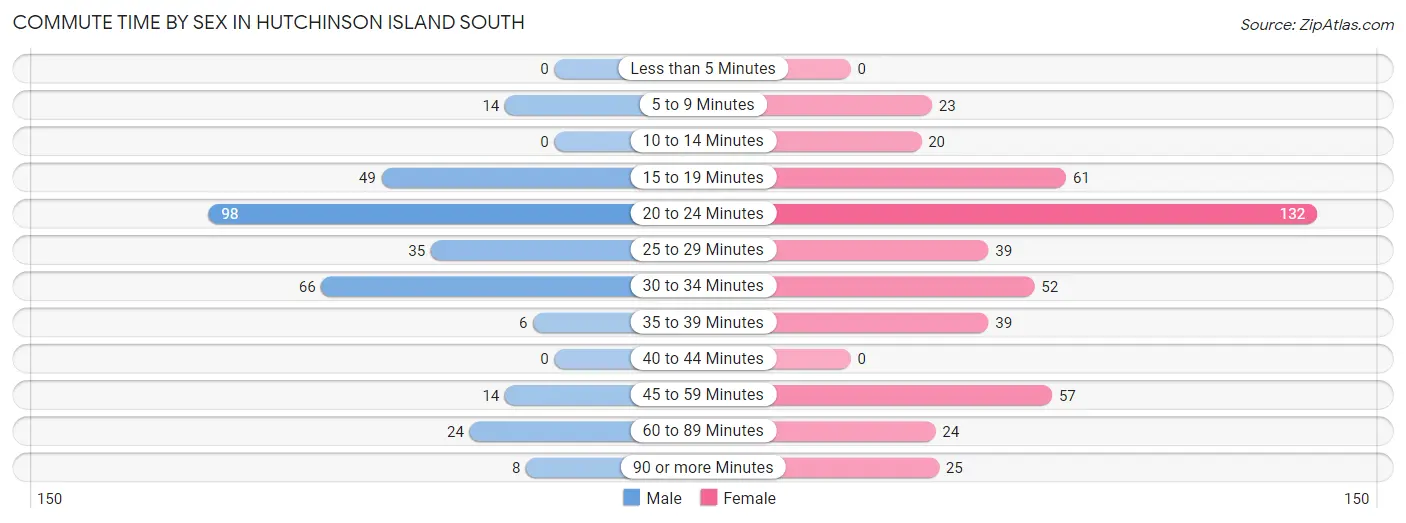
| Commute Time | Male | Female |
| Less than 5 Minutes | 0 (0.0%) | 0 (0.0%) |
| 5 to 9 Minutes | 14 (4.5%) | 23 (4.9%) |
| 10 to 14 Minutes | 0 (0.0%) | 20 (4.2%) |
| 15 to 19 Minutes | 49 (15.6%) | 61 (12.9%) |
| 20 to 24 Minutes | 98 (31.2%) | 132 (28.0%) |
| 25 to 29 Minutes | 35 (11.2%) | 39 (8.3%) |
| 30 to 34 Minutes | 66 (21.0%) | 52 (11.0%) |
| 35 to 39 Minutes | 6 (1.9%) | 39 (8.3%) |
| 40 to 44 Minutes | 0 (0.0%) | 0 (0.0%) |
| 45 to 59 Minutes | 14 (4.5%) | 57 (12.1%) |
| 60 to 89 Minutes | 24 (7.6%) | 24 (5.1%) |
| 90 or more Minutes | 8 (2.5%) | 25 (5.3%) |
Time of Departure to Work by Sex in Hutchinson Island South
The most frequent times of departure to work in Hutchinson Island South are 8:00 AM to 8:29 AM (122, 38.9%) for males and 8:00 AM to 8:29 AM (62, 13.1%) for females.
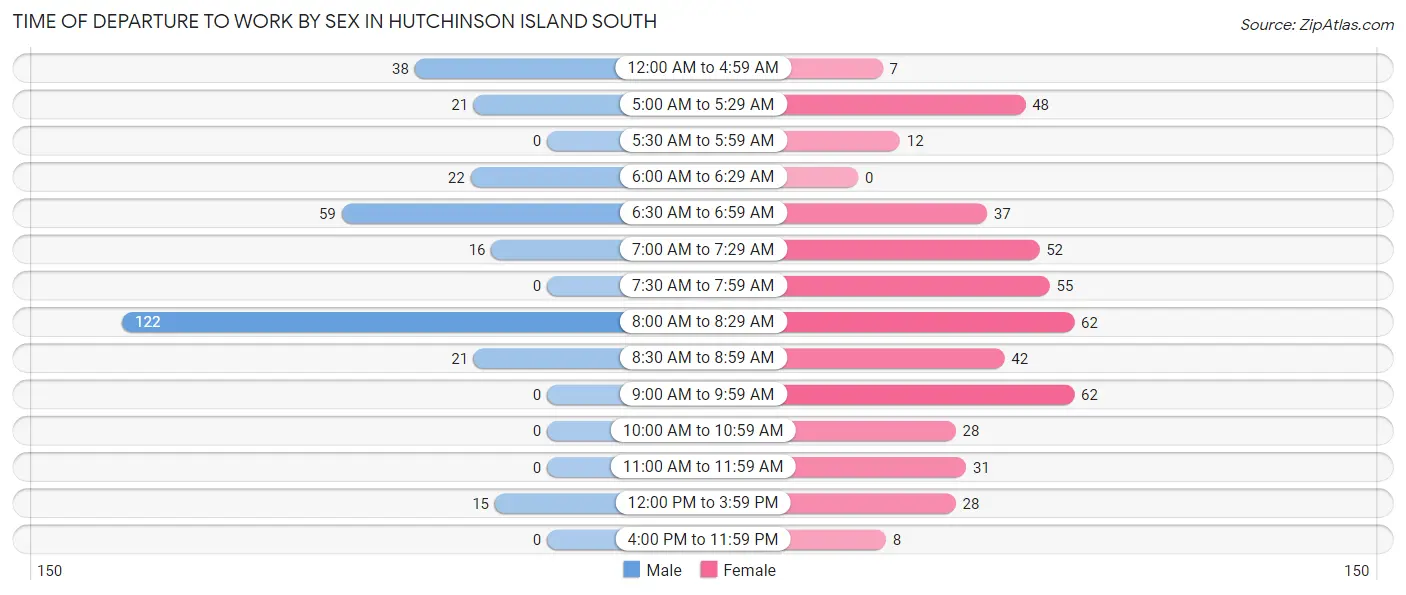
| Time of Departure | Male | Female |
| 12:00 AM to 4:59 AM | 38 (12.1%) | 7 (1.5%) |
| 5:00 AM to 5:29 AM | 21 (6.7%) | 48 (10.2%) |
| 5:30 AM to 5:59 AM | 0 (0.0%) | 12 (2.5%) |
| 6:00 AM to 6:29 AM | 22 (7.0%) | 0 (0.0%) |
| 6:30 AM to 6:59 AM | 59 (18.8%) | 37 (7.8%) |
| 7:00 AM to 7:29 AM | 16 (5.1%) | 52 (11.0%) |
| 7:30 AM to 7:59 AM | 0 (0.0%) | 55 (11.7%) |
| 8:00 AM to 8:29 AM | 122 (38.9%) | 62 (13.1%) |
| 8:30 AM to 8:59 AM | 21 (6.7%) | 42 (8.9%) |
| 9:00 AM to 9:59 AM | 0 (0.0%) | 62 (13.1%) |
| 10:00 AM to 10:59 AM | 0 (0.0%) | 28 (5.9%) |
| 11:00 AM to 11:59 AM | 0 (0.0%) | 31 (6.6%) |
| 12:00 PM to 3:59 PM | 15 (4.8%) | 28 (5.9%) |
| 4:00 PM to 11:59 PM | 0 (0.0%) | 8 (1.7%) |
| Total | 314 (100.0%) | 472 (100.0%) |
Housing Occupancy in Hutchinson Island South
Occupancy by Ownership in Hutchinson Island South
Of the total 2,494 dwellings in Hutchinson Island South, owner-occupied units account for 2,243 (89.9%), while renter-occupied units make up 251 (10.1%).
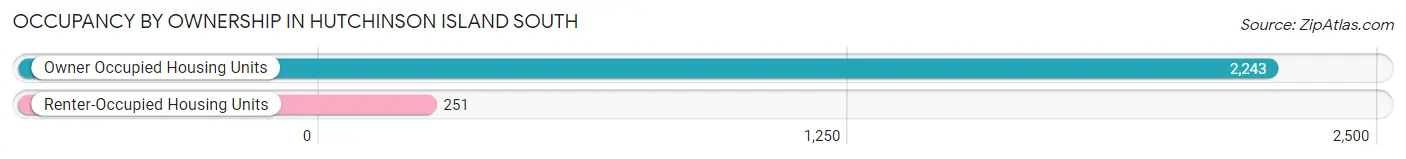
| Occupancy | # Housing Units | % Housing Units |
| Owner Occupied Housing Units | 2,243 | 89.9% |
| Renter-Occupied Housing Units | 251 | 10.1% |
| Total Occupied Housing Units | 2,494 | 100.0% |
Occupancy by Household Size in Hutchinson Island South
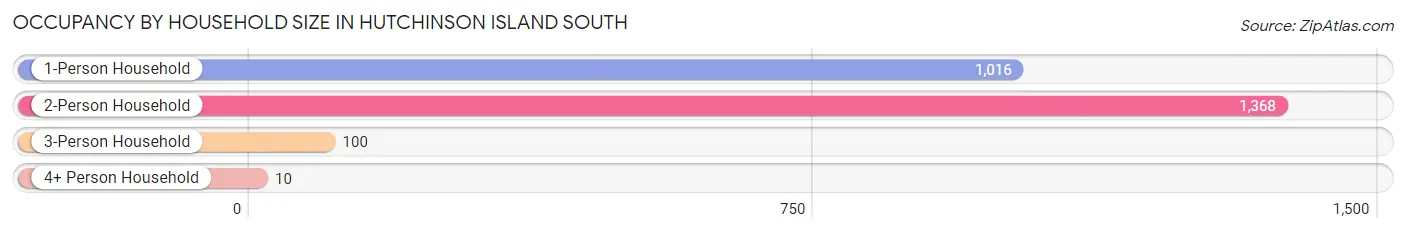
| Household Size | # Housing Units | % Housing Units |
| 1-Person Household | 1,016 | 40.7% |
| 2-Person Household | 1,368 | 54.8% |
| 3-Person Household | 100 | 4.0% |
| 4+ Person Household | 10 | 0.4% |
| Total Housing Units | 2,494 | 100.0% |
Occupancy by Ownership by Household Size in Hutchinson Island South
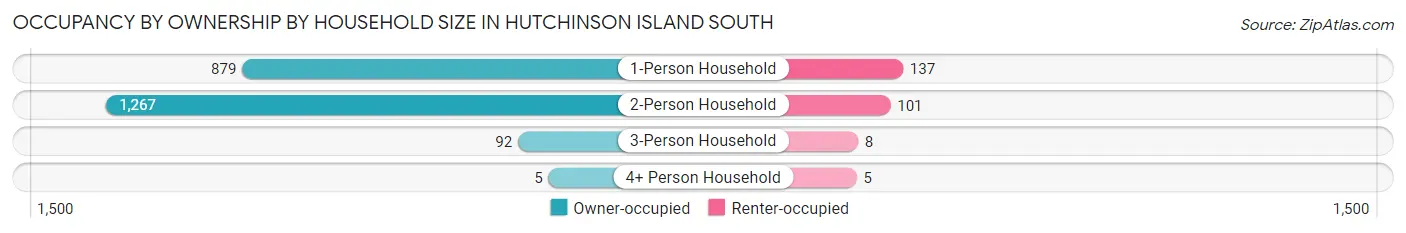
| Household Size | Owner-occupied | Renter-occupied |
| 1-Person Household | 879 (86.5%) | 137 (13.5%) |
| 2-Person Household | 1,267 (92.6%) | 101 (7.4%) |
| 3-Person Household | 92 (92.0%) | 8 (8.0%) |
| 4+ Person Household | 5 (50.0%) | 5 (50.0%) |
| Total Housing Units | 2,243 (89.9%) | 251 (10.1%) |
Occupancy by Educational Attainment in Hutchinson Island South
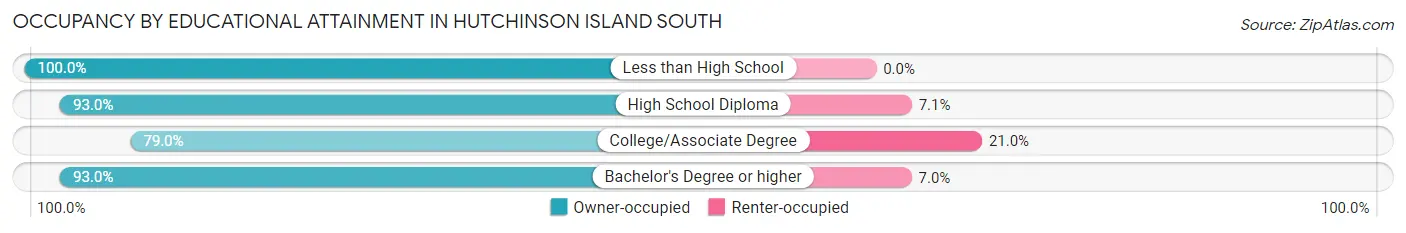
| Household Size | Owner-occupied | Renter-occupied |
| Less than High School | 116 (100.0%) | 0 (0.0%) |
| High School Diploma | 633 (92.9%) | 48 (7.0%) |
| College/Associate Degree | 475 (79.0%) | 126 (21.0%) |
| Bachelor's Degree or higher | 1,019 (93.0%) | 77 (7.0%) |
Occupancy by Age of Householder in Hutchinson Island South
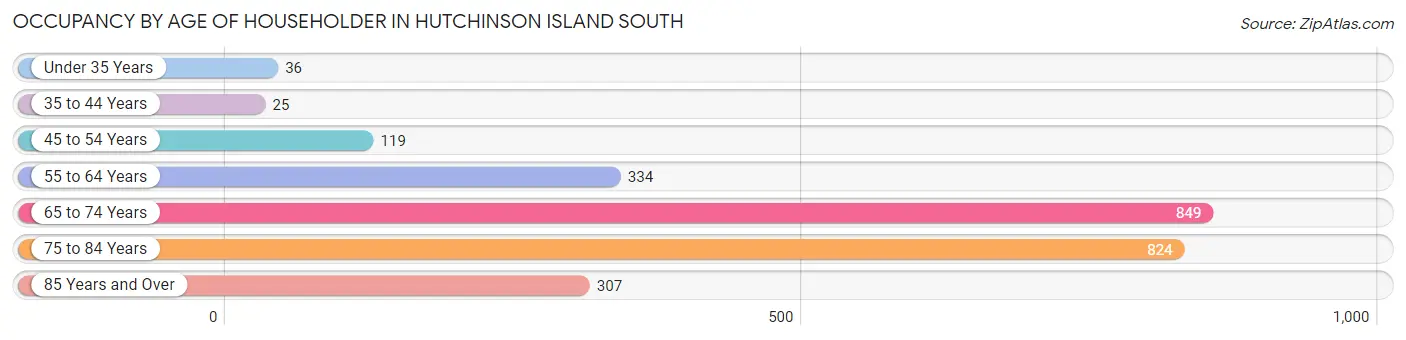
| Age Bracket | # Households | % Households |
| Under 35 Years | 36 | 1.4% |
| 35 to 44 Years | 25 | 1.0% |
| 45 to 54 Years | 119 | 4.8% |
| 55 to 64 Years | 334 | 13.4% |
| 65 to 74 Years | 849 | 34.0% |
| 75 to 84 Years | 824 | 33.0% |
| 85 Years and Over | 307 | 12.3% |
| Total | 2,494 | 100.0% |
Housing Finances in Hutchinson Island South
Median Income by Occupancy in Hutchinson Island South
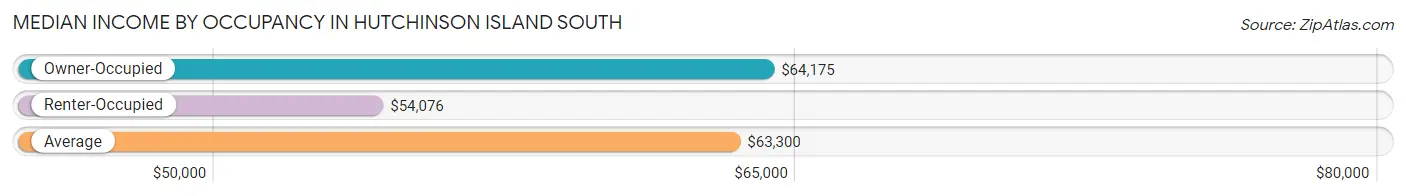
| Occupancy Type | # Households | Median Income |
| Owner-Occupied | 2,243 (89.9%) | $64,175 |
| Renter-Occupied | 251 (10.1%) | $54,076 |
| Average | 2,494 (100.0%) | $63,300 |
Occupancy by Householder Income Bracket in Hutchinson Island South
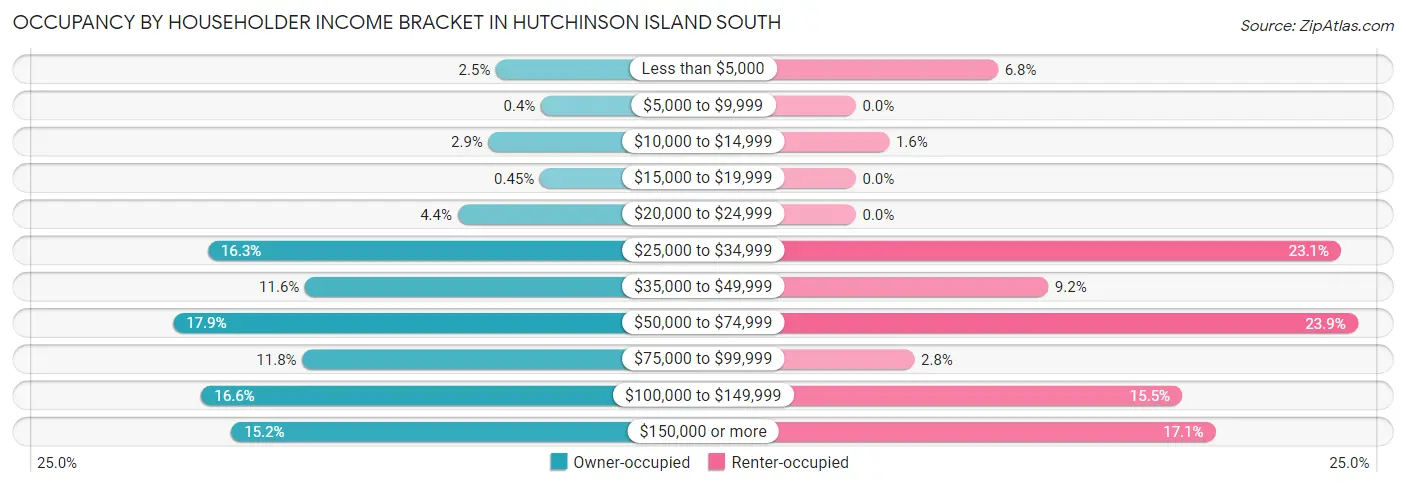
| Income Bracket | Owner-occupied | Renter-occupied |
| Less than $5,000 | 57 (2.5%) | 17 (6.8%) |
| $5,000 to $9,999 | 9 (0.4%) | 0 (0.0%) |
| $10,000 to $14,999 | 65 (2.9%) | 4 (1.6%) |
| $15,000 to $19,999 | 10 (0.4%) | 0 (0.0%) |
| $20,000 to $24,999 | 98 (4.4%) | 0 (0.0%) |
| $25,000 to $34,999 | 365 (16.3%) | 58 (23.1%) |
| $35,000 to $49,999 | 261 (11.6%) | 23 (9.2%) |
| $50,000 to $74,999 | 402 (17.9%) | 60 (23.9%) |
| $75,000 to $99,999 | 264 (11.8%) | 7 (2.8%) |
| $100,000 to $149,999 | 372 (16.6%) | 39 (15.5%) |
| $150,000 or more | 340 (15.2%) | 43 (17.1%) |
| Total | 2,243 (100.0%) | 251 (100.0%) |
Monthly Housing Cost Tiers in Hutchinson Island South
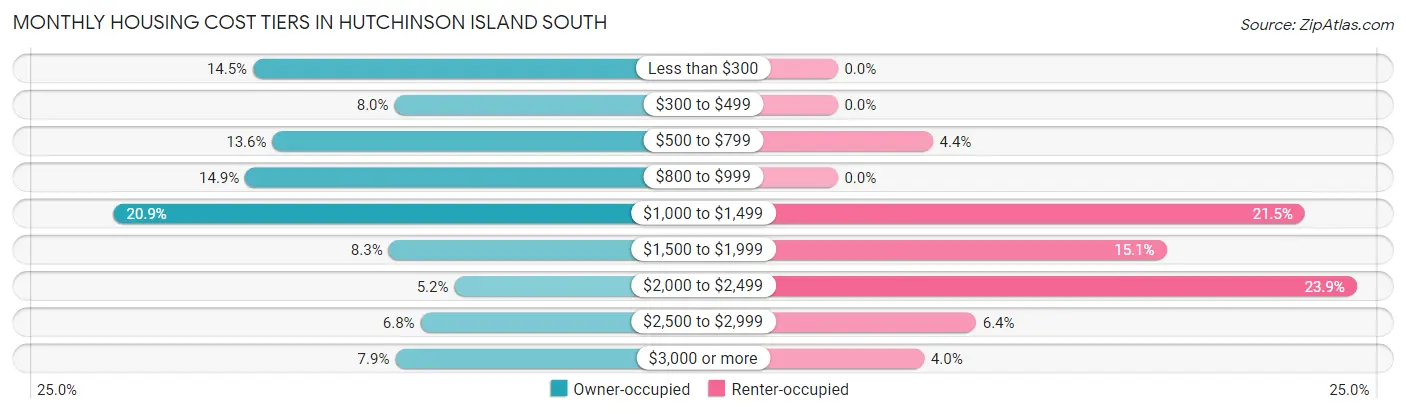
| Monthly Cost | Owner-occupied | Renter-occupied |
| Less than $300 | 325 (14.5%) | 0 (0.0%) |
| $300 to $499 | 179 (8.0%) | 0 (0.0%) |
| $500 to $799 | 305 (13.6%) | 11 (4.4%) |
| $800 to $999 | 333 (14.8%) | 0 (0.0%) |
| $1,000 to $1,499 | 469 (20.9%) | 54 (21.5%) |
| $1,500 to $1,999 | 185 (8.3%) | 38 (15.1%) |
| $2,000 to $2,499 | 117 (5.2%) | 60 (23.9%) |
| $2,500 to $2,999 | 152 (6.8%) | 16 (6.4%) |
| $3,000 or more | 178 (7.9%) | 10 (4.0%) |
| Total | 2,243 (100.0%) | 251 (100.0%) |
Physical Housing Characteristics in Hutchinson Island South
Housing Structures in Hutchinson Island South
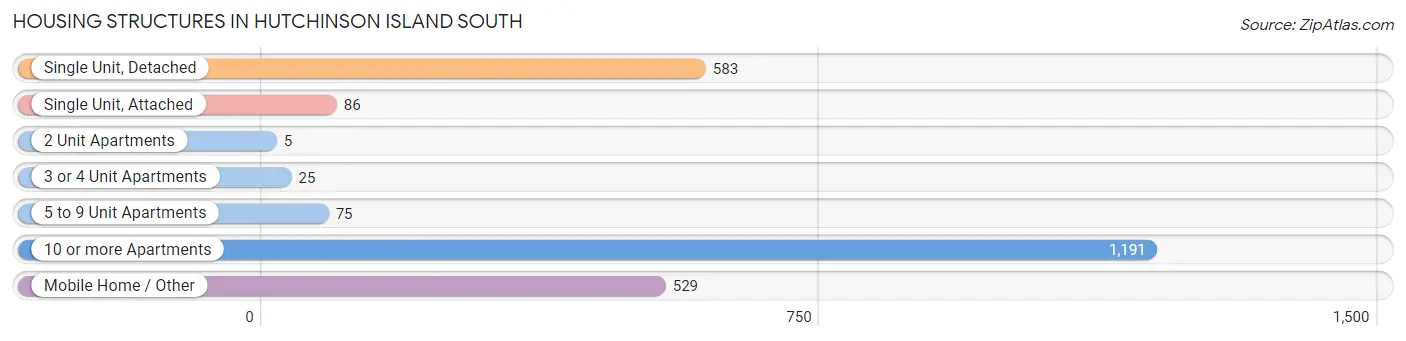
| Structure Type | # Housing Units | % Housing Units |
| Single Unit, Detached | 583 | 23.4% |
| Single Unit, Attached | 86 | 3.5% |
| 2 Unit Apartments | 5 | 0.2% |
| 3 or 4 Unit Apartments | 25 | 1.0% |
| 5 to 9 Unit Apartments | 75 | 3.0% |
| 10 or more Apartments | 1,191 | 47.7% |
| Mobile Home / Other | 529 | 21.2% |
| Total | 2,494 | 100.0% |
Housing Structures by Occupancy in Hutchinson Island South
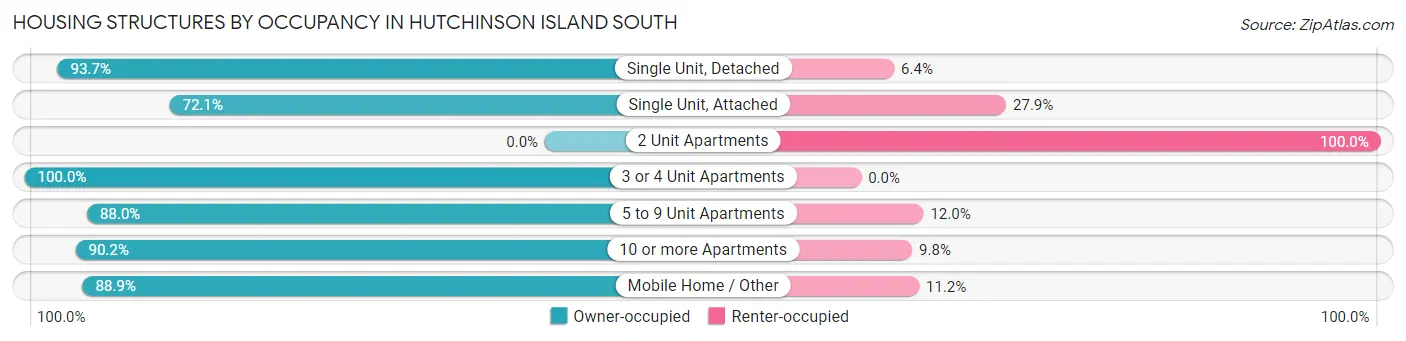
| Structure Type | Owner-occupied | Renter-occupied |
| Single Unit, Detached | 546 (93.6%) | 37 (6.4%) |
| Single Unit, Attached | 62 (72.1%) | 24 (27.9%) |
| 2 Unit Apartments | 0 (0.0%) | 5 (100.0%) |
| 3 or 4 Unit Apartments | 25 (100.0%) | 0 (0.0%) |
| 5 to 9 Unit Apartments | 66 (88.0%) | 9 (12.0%) |
| 10 or more Apartments | 1,074 (90.2%) | 117 (9.8%) |
| Mobile Home / Other | 470 (88.8%) | 59 (11.2%) |
| Total | 2,243 (89.9%) | 251 (10.1%) |
Housing Structures by Number of Rooms in Hutchinson Island South
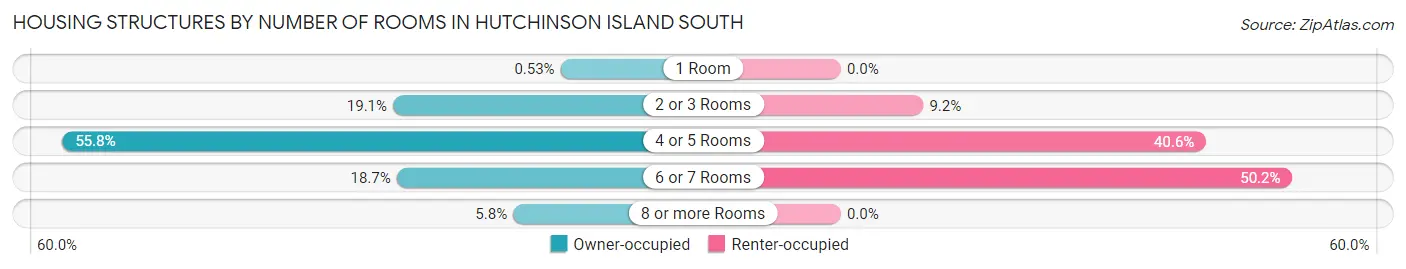
| Number of Rooms | Owner-occupied | Renter-occupied |
| 1 Room | 12 (0.5%) | 0 (0.0%) |
| 2 or 3 Rooms | 429 (19.1%) | 23 (9.2%) |
| 4 or 5 Rooms | 1,252 (55.8%) | 102 (40.6%) |
| 6 or 7 Rooms | 420 (18.7%) | 126 (50.2%) |
| 8 or more Rooms | 130 (5.8%) | 0 (0.0%) |
| Total | 2,243 (100.0%) | 251 (100.0%) |
Housing Structure by Heating Type in Hutchinson Island South
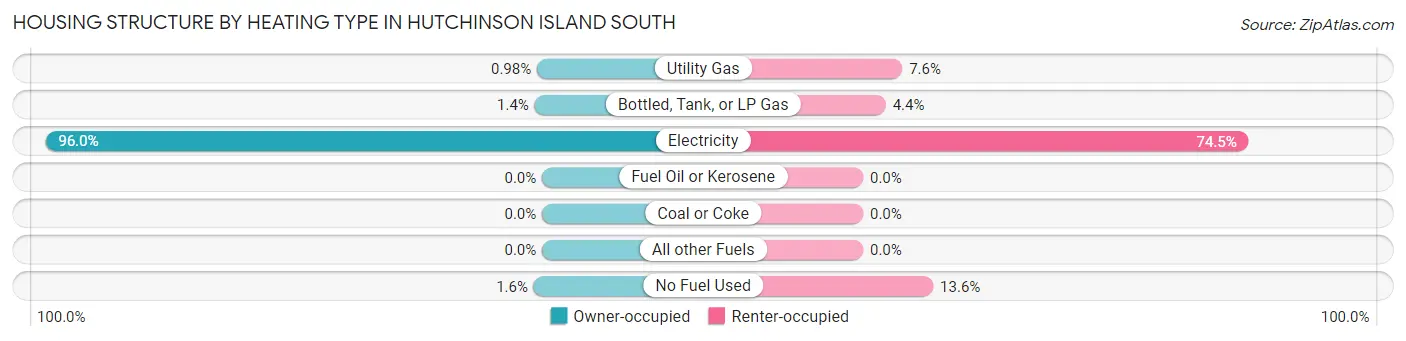
| Heating Type | Owner-occupied | Renter-occupied |
| Utility Gas | 22 (1.0%) | 19 (7.6%) |
| Bottled, Tank, or LP Gas | 32 (1.4%) | 11 (4.4%) |
| Electricity | 2,153 (96.0%) | 187 (74.5%) |
| Fuel Oil or Kerosene | 0 (0.0%) | 0 (0.0%) |
| Coal or Coke | 0 (0.0%) | 0 (0.0%) |
| All other Fuels | 0 (0.0%) | 0 (0.0%) |
| No Fuel Used | 36 (1.6%) | 34 (13.6%) |
| Total | 2,243 (100.0%) | 251 (100.0%) |
Household Vehicle Usage in Hutchinson Island South
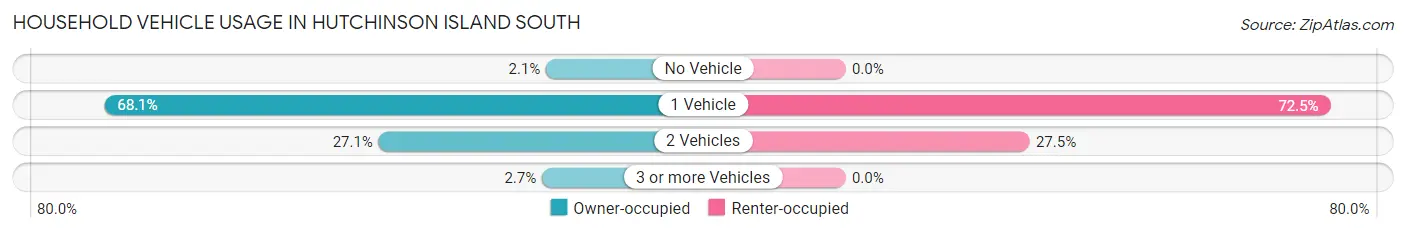
| Vehicles per Household | Owner-occupied | Renter-occupied |
| No Vehicle | 47 (2.1%) | 0 (0.0%) |
| 1 Vehicle | 1,527 (68.1%) | 182 (72.5%) |
| 2 Vehicles | 608 (27.1%) | 69 (27.5%) |
| 3 or more Vehicles | 61 (2.7%) | 0 (0.0%) |
| Total | 2,243 (100.0%) | 251 (100.0%) |
Real Estate & Mortgages in Hutchinson Island South
Real Estate and Mortgage Overview in Hutchinson Island South
| Characteristic | Without Mortgage | With Mortgage |
| Housing Units | 1,583 | 660 |
| Median Property Value | $332,300 | $397,100 |
| Median Household Income | $55,956 | $187 |
| Monthly Housing Costs | $784 | $178 |
| Real Estate Taxes | $3,584 | $7 |
Property Value by Mortgage Status in Hutchinson Island South
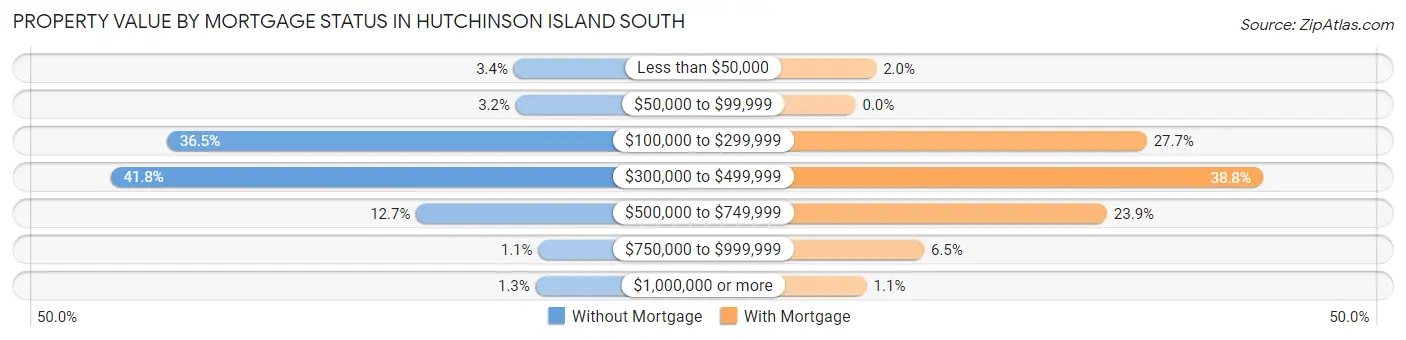
| Property Value | Without Mortgage | With Mortgage |
| Less than $50,000 | 54 (3.4%) | 13 (2.0%) |
| $50,000 to $99,999 | 51 (3.2%) | 0 (0.0%) |
| $100,000 to $299,999 | 577 (36.4%) | 183 (27.7%) |
| $300,000 to $499,999 | 662 (41.8%) | 256 (38.8%) |
| $500,000 to $749,999 | 201 (12.7%) | 158 (23.9%) |
| $750,000 to $999,999 | 17 (1.1%) | 43 (6.5%) |
| $1,000,000 or more | 21 (1.3%) | 7 (1.1%) |
| Total | 1,583 (100.0%) | 660 (100.0%) |
Household Income by Mortgage Status in Hutchinson Island South
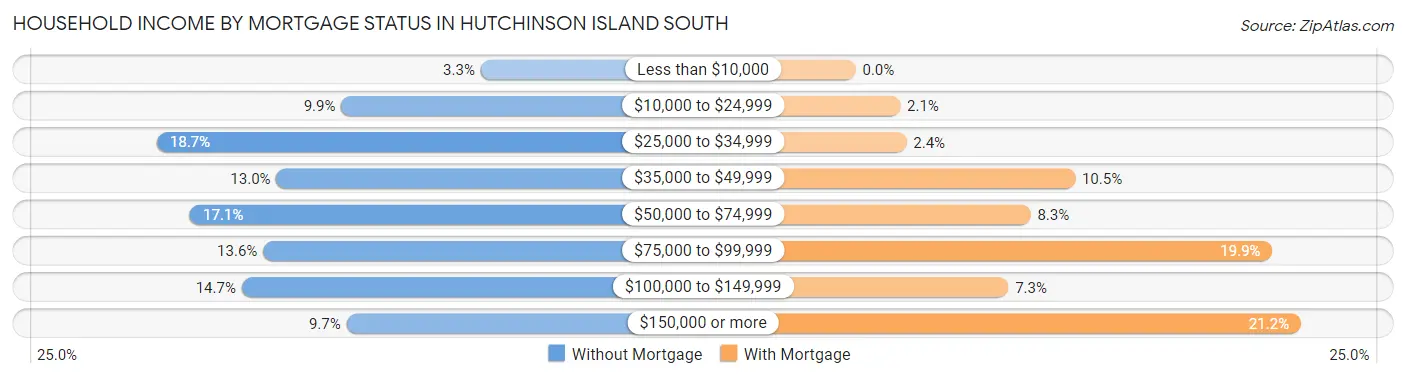
| Household Income | Without Mortgage | With Mortgage |
| Less than $10,000 | 52 (3.3%) | 0 (0.0%) |
| $10,000 to $24,999 | 157 (9.9%) | 14 (2.1%) |
| $25,000 to $34,999 | 296 (18.7%) | 16 (2.4%) |
| $35,000 to $49,999 | 206 (13.0%) | 69 (10.4%) |
| $50,000 to $74,999 | 271 (17.1%) | 55 (8.3%) |
| $75,000 to $99,999 | 216 (13.6%) | 131 (19.9%) |
| $100,000 to $149,999 | 232 (14.7%) | 48 (7.3%) |
| $150,000 or more | 153 (9.7%) | 140 (21.2%) |
| Total | 1,583 (100.0%) | 660 (100.0%) |
Property Value to Household Income Ratio in Hutchinson Island South
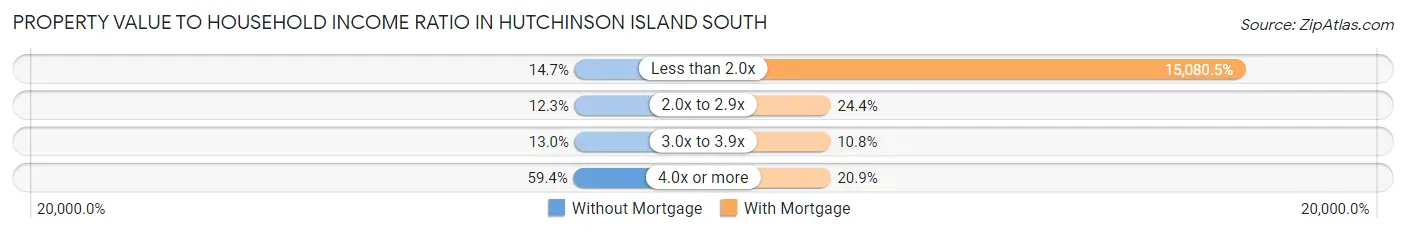
| Value-to-Income Ratio | Without Mortgage | With Mortgage |
| Less than 2.0x | 233 (14.7%) | 99,531 (15,080.4%) |
| 2.0x to 2.9x | 195 (12.3%) | 161 (24.4%) |
| 3.0x to 3.9x | 206 (13.0%) | 71 (10.8%) |
| 4.0x or more | 940 (59.4%) | 138 (20.9%) |
| Total | 1,583 (100.0%) | 660 (100.0%) |
Real Estate Taxes by Mortgage Status in Hutchinson Island South
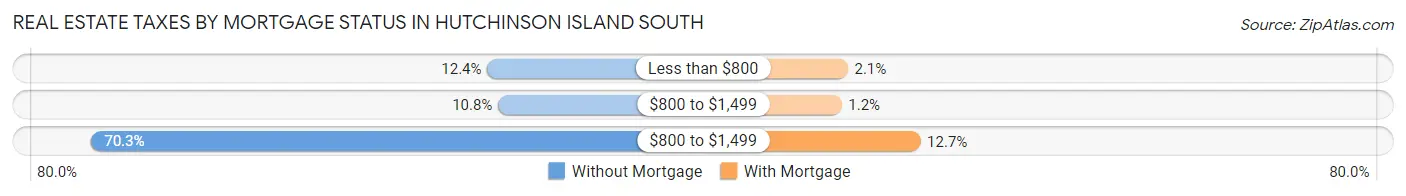
| Property Taxes | Without Mortgage | With Mortgage |
| Less than $800 | 196 (12.4%) | 14 (2.1%) |
| $800 to $1,499 | 171 (10.8%) | 8 (1.2%) |
| $800 to $1,499 | 1,112 (70.3%) | 84 (12.7%) |
| Total | 1,583 (100.0%) | 660 (100.0%) |
Health & Disability in Hutchinson Island South
Health Insurance Coverage by Age in Hutchinson Island South
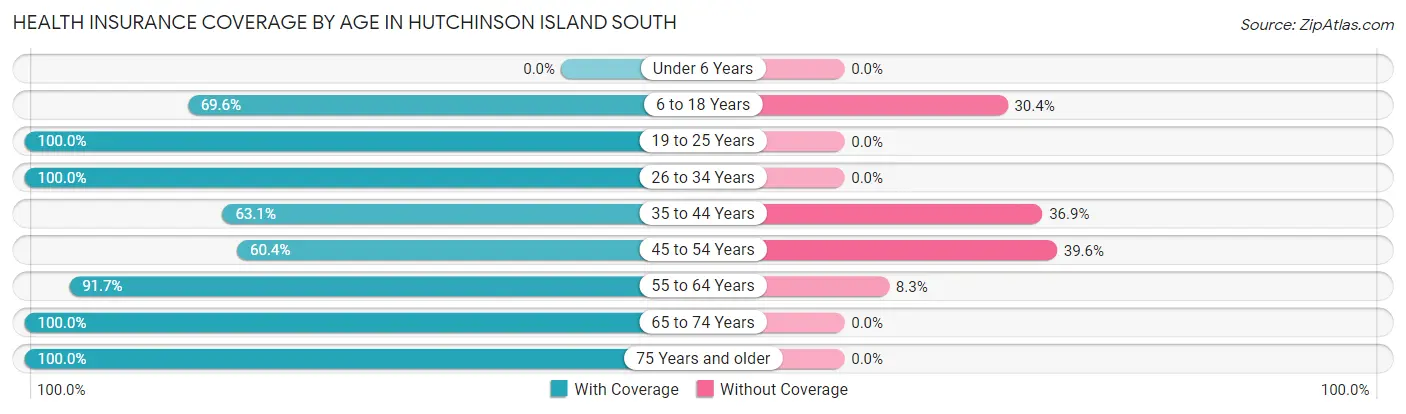
| Age Bracket | With Coverage | Without Coverage |
| Under 6 Years | 0 (0.0%) | 0 (0.0%) |
| 6 to 18 Years | 48 (69.6%) | 21 (30.4%) |
| 19 to 25 Years | 51 (100.0%) | 0 (0.0%) |
| 26 to 34 Years | 114 (100.0%) | 0 (0.0%) |
| 35 to 44 Years | 94 (63.1%) | 55 (36.9%) |
| 45 to 54 Years | 131 (60.4%) | 86 (39.6%) |
| 55 to 64 Years | 551 (91.7%) | 50 (8.3%) |
| 65 to 74 Years | 1,455 (100.0%) | 0 (0.0%) |
| 75 Years and older | 1,547 (100.0%) | 0 (0.0%) |
| Total | 3,991 (95.0%) | 212 (5.0%) |
Health Insurance Coverage by Citizenship Status in Hutchinson Island South
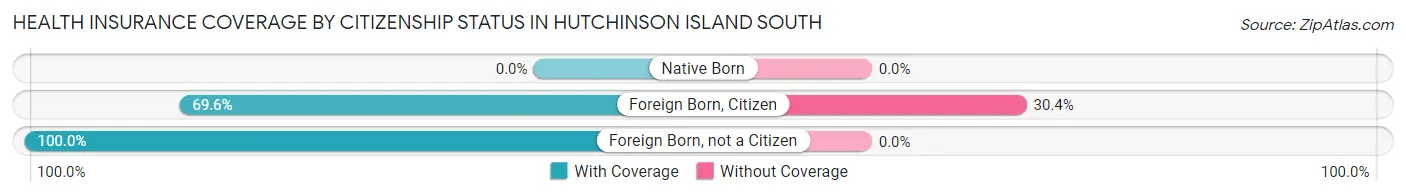
| Citizenship Status | With Coverage | Without Coverage |
| Native Born | 0 (0.0%) | 0 (0.0%) |
| Foreign Born, Citizen | 48 (69.6%) | 21 (30.4%) |
| Foreign Born, not a Citizen | 51 (100.0%) | 0 (0.0%) |
Health Insurance Coverage by Household Income in Hutchinson Island South
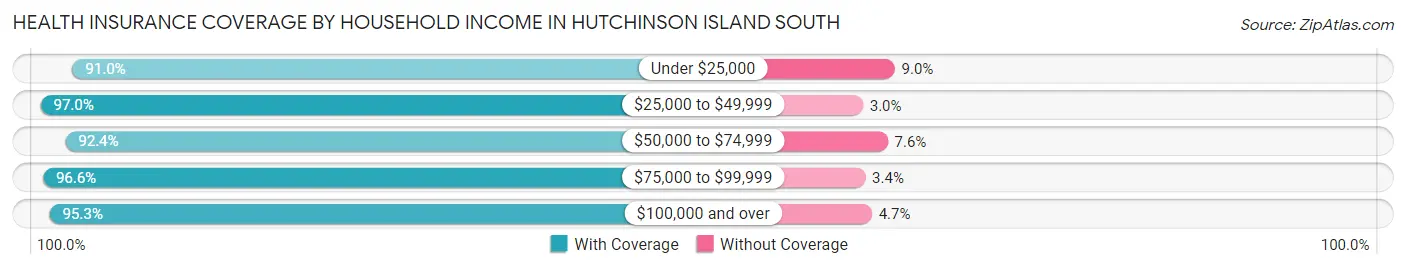
| Household Income | With Coverage | Without Coverage |
| Under $25,000 | 315 (91.0%) | 31 (9.0%) |
| $25,000 to $49,999 | 906 (97.0%) | 28 (3.0%) |
| $50,000 to $74,999 | 713 (92.4%) | 59 (7.6%) |
| $75,000 to $99,999 | 506 (96.6%) | 18 (3.4%) |
| $100,000 and over | 1,551 (95.3%) | 76 (4.7%) |
Public vs Private Health Insurance Coverage by Age in Hutchinson Island South
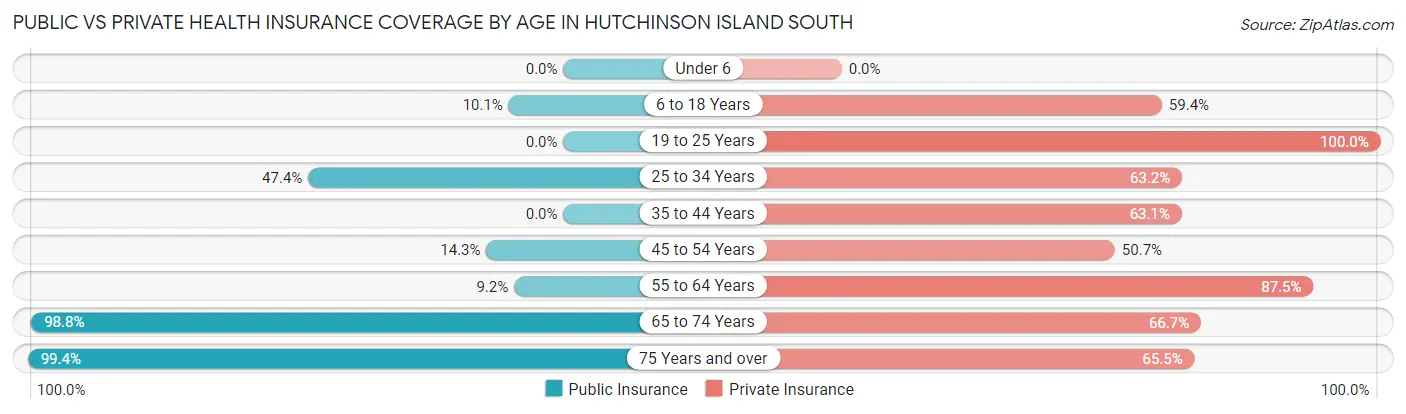
| Age Bracket | Public Insurance | Private Insurance |
| Under 6 | 0 (0.0%) | 0 (0.0%) |
| 6 to 18 Years | 7 (10.1%) | 41 (59.4%) |
| 19 to 25 Years | 0 (0.0%) | 51 (100.0%) |
| 25 to 34 Years | 54 (47.4%) | 72 (63.2%) |
| 35 to 44 Years | 0 (0.0%) | 94 (63.1%) |
| 45 to 54 Years | 31 (14.3%) | 110 (50.7%) |
| 55 to 64 Years | 55 (9.1%) | 526 (87.5%) |
| 65 to 74 Years | 1,437 (98.8%) | 970 (66.7%) |
| 75 Years and over | 1,538 (99.4%) | 1,013 (65.5%) |
| Total | 3,122 (74.3%) | 2,877 (68.4%) |
Disability Status by Sex by Age in Hutchinson Island South
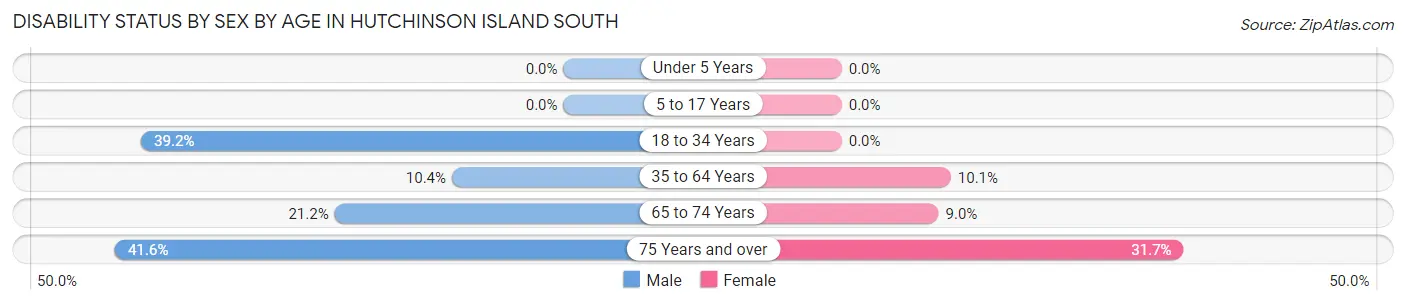
| Age Bracket | Male | Female |
| Under 5 Years | 0 (0.0%) | 0 (0.0%) |
| 5 to 17 Years | 0 (0.0%) | 0 (0.0%) |
| 18 to 34 Years | 38 (39.2%) | 0 (0.0%) |
| 35 to 64 Years | 50 (10.3%) | 49 (10.1%) |
| 65 to 74 Years | 127 (21.2%) | 77 (9.0%) |
| 75 Years and over | 347 (41.6%) | 226 (31.7%) |
Disability Class by Sex by Age in Hutchinson Island South
Disability Class: Hearing Difficulty
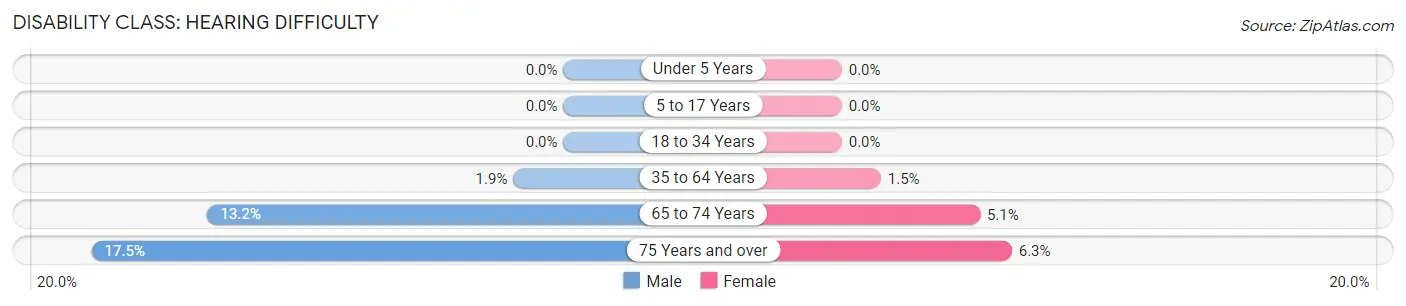
| Age Bracket | Male | Female |
| Under 5 Years | 0 (0.0%) | 0 (0.0%) |
| 5 to 17 Years | 0 (0.0%) | 0 (0.0%) |
| 18 to 34 Years | 0 (0.0%) | 0 (0.0%) |
| 35 to 64 Years | 9 (1.9%) | 7 (1.5%) |
| 65 to 74 Years | 79 (13.2%) | 44 (5.1%) |
| 75 Years and over | 146 (17.5%) | 45 (6.3%) |
Disability Class: Vision Difficulty
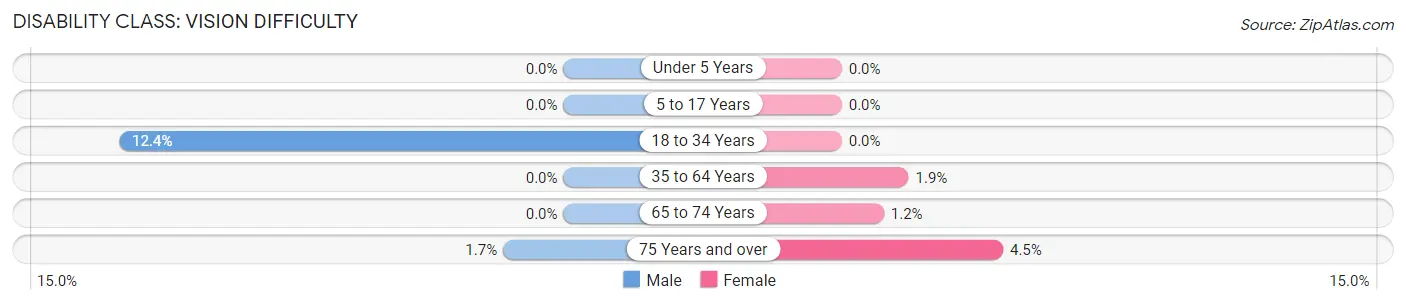
| Age Bracket | Male | Female |
| Under 5 Years | 0 (0.0%) | 0 (0.0%) |
| 5 to 17 Years | 0 (0.0%) | 0 (0.0%) |
| 18 to 34 Years | 12 (12.4%) | 0 (0.0%) |
| 35 to 64 Years | 0 (0.0%) | 9 (1.9%) |
| 65 to 74 Years | 0 (0.0%) | 10 (1.2%) |
| 75 Years and over | 14 (1.7%) | 32 (4.5%) |
Disability Class: Cognitive Difficulty
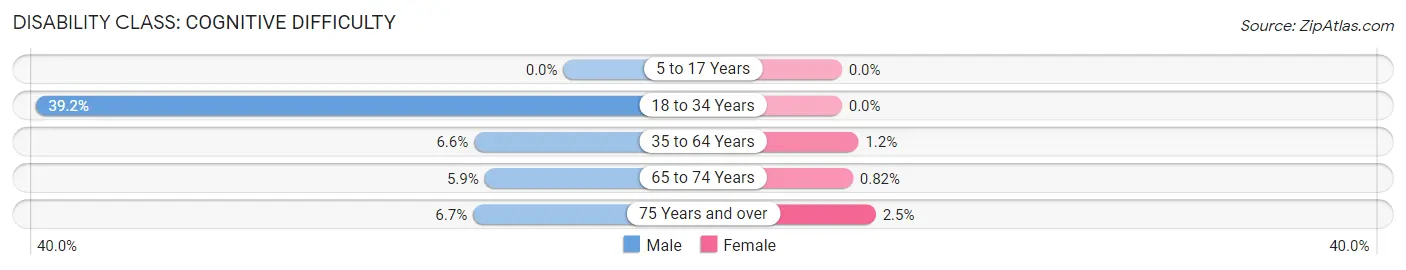
| Age Bracket | Male | Female |
| 5 to 17 Years | 0 (0.0%) | 0 (0.0%) |
| 18 to 34 Years | 38 (39.2%) | 0 (0.0%) |
| 35 to 64 Years | 32 (6.6%) | 6 (1.2%) |
| 65 to 74 Years | 35 (5.9%) | 7 (0.8%) |
| 75 Years and over | 56 (6.7%) | 18 (2.5%) |
Disability Class: Ambulatory Difficulty
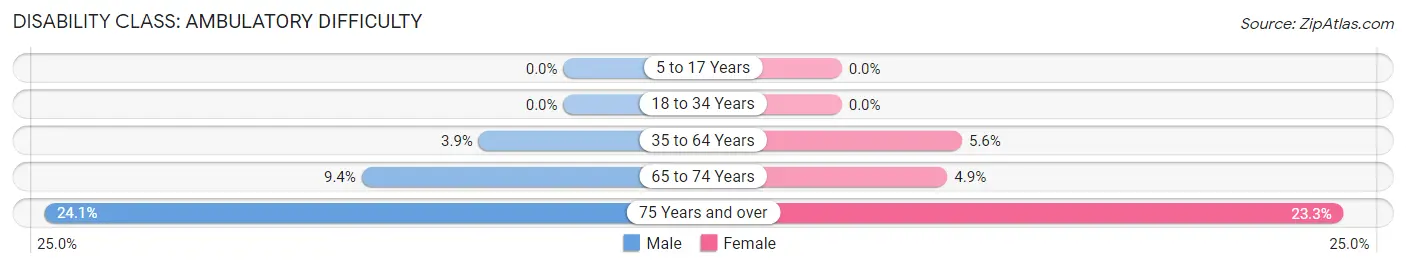
| Age Bracket | Male | Female |
| 5 to 17 Years | 0 (0.0%) | 0 (0.0%) |
| 18 to 34 Years | 0 (0.0%) | 0 (0.0%) |
| 35 to 64 Years | 19 (3.9%) | 27 (5.6%) |
| 65 to 74 Years | 56 (9.4%) | 42 (4.9%) |
| 75 Years and over | 201 (24.1%) | 166 (23.3%) |
Disability Class: Self-Care Difficulty
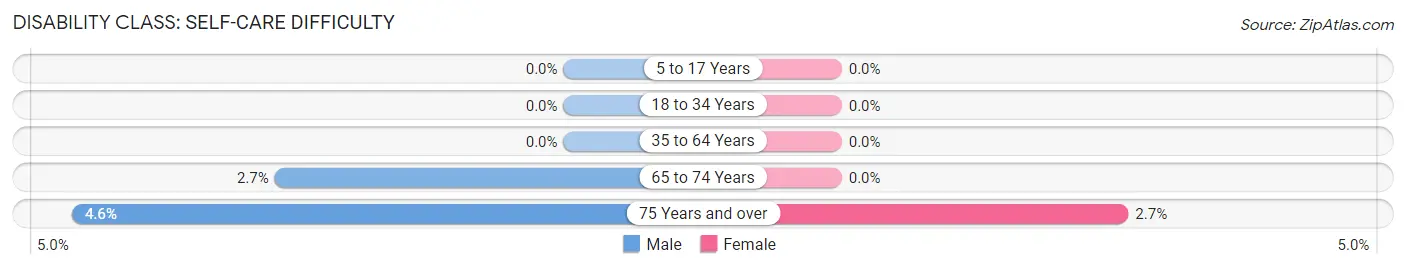
| Age Bracket | Male | Female |
| 5 to 17 Years | 0 (0.0%) | 0 (0.0%) |
| 18 to 34 Years | 0 (0.0%) | 0 (0.0%) |
| 35 to 64 Years | 0 (0.0%) | 0 (0.0%) |
| 65 to 74 Years | 16 (2.7%) | 0 (0.0%) |
| 75 Years and over | 38 (4.6%) | 19 (2.7%) |
Technology Access in Hutchinson Island South
Computing Device Access in Hutchinson Island South
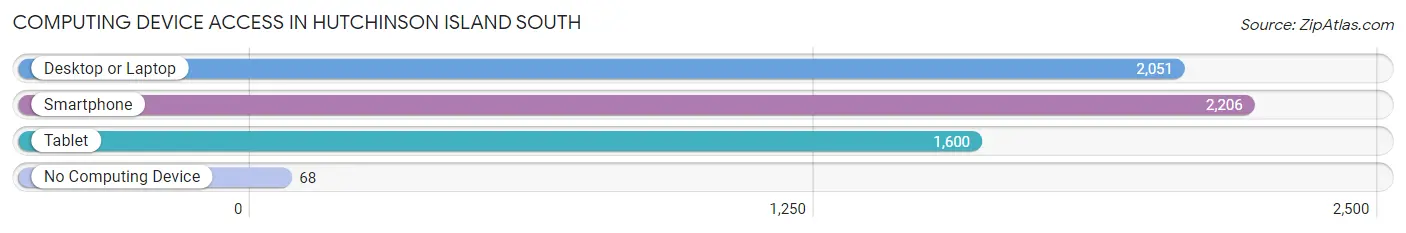
| Device Type | # Households | % Households |
| Desktop or Laptop | 2,051 | 82.2% |
| Smartphone | 2,206 | 88.4% |
| Tablet | 1,600 | 64.1% |
| No Computing Device | 68 | 2.7% |
| Total | 2,494 | 100.0% |
Internet Access in Hutchinson Island South
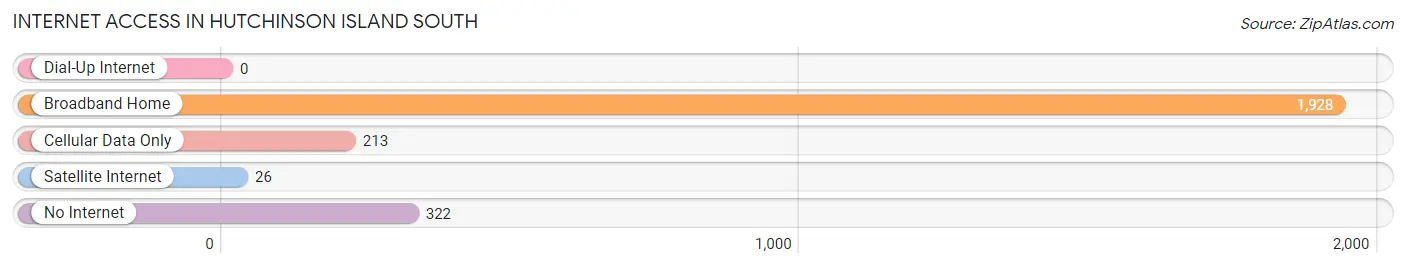
| Internet Type | # Households | % Households |
| Dial-Up Internet | 0 | 0.0% |
| Broadband Home | 1,928 | 77.3% |
| Cellular Data Only | 213 | 8.5% |
| Satellite Internet | 26 | 1.0% |
| No Internet | 322 | 12.9% |
| Total | 2,494 | 100.0% |
Hutchinson Island South Summary
Hutchinson Island South, FL is a small barrier island located in the Indian River Lagoon on the east coast of Florida. It is part of Martin County and is located between the cities of Stuart and Fort Pierce. The island is approximately 8 miles long and 1 mile wide and is home to a variety of wildlife, including sea turtles, manatees, and dolphins.
History
Hutchinson Island South has a long and varied history. The island was first inhabited by the Ais Indians, who lived in the area for thousands of years before the arrival of Europeans. The island was named after Captain William Hutchinson, who was the first European to explore the area in the late 1600s. In the early 1800s, the island was used as a base for the Seminole Indians during the Second Seminole War.
In the late 1800s, the island was used as a quarantine station for immigrants arriving in the United States. In the early 1900s, the island was used as a base for the Coast Guard and the Navy. During World War II, the island was used as a training base for the Navy.
In the 1950s, the island was developed as a resort destination. The island was home to several resorts, including the Hutchinson Island Beach Club, the Hutchinson Island Hotel, and the Hutchinson Island Inn. The island also became a popular destination for fishing and boating.
In the late 1970s, the island was designated as a state park. The park is now known as the Hutchinson Island South State Park and is home to a variety of wildlife, including sea turtles, manatees, and dolphins.
Geography
Hutchinson Island South is located in the Indian River Lagoon on the east coast of Florida. The island is approximately 8 miles long and 1 mile wide. The island is bordered by the Atlantic Ocean to the east and the Indian River Lagoon to the west. The island is connected to the mainland by a bridge.
The island is home to a variety of wildlife, including sea turtles, manatees, and dolphins. The island is also home to a variety of plant life, including mangroves, sea oats, and sea grasses.
Economy
Hutchinson Island South is a popular tourist destination. The island is home to several resorts, including the Hutchinson Island Beach Club, the Hutchinson Island Hotel, and the Hutchinson Island Inn. The island is also home to a variety of restaurants, bars, and shops.
The island is also home to a variety of businesses, including boat charters, fishing charters, and water sports companies. The island is also home to a variety of real estate companies, which specialize in selling and renting properties on the island.
Demographics
As of the 2010 census, the population of Hutchinson Island South was 4,845. The population is primarily white (90.3%) and the median age is 57. The median household income is $50,000 and the median home value is $400,000.
Conclusion
Hutchinson Island South is a small barrier island located in the Indian River Lagoon on the east coast of Florida. The island has a long and varied history and is home to a variety of wildlife, including sea turtles, manatees, and dolphins. The island is a popular tourist destination and is home to several resorts, restaurants, bars, and shops. The population of the island is primarily white and the median age is 57. The median household income is $50,000 and the median home value is $400,000.
Common Questions
What is the Total Population of Hutchinson Island South?
Total Population of Hutchinson Island South is 4,203.
What is the Total Male Population of Hutchinson Island South?
Total Male Population of Hutchinson Island South is 2,065.
What is the Total Female Population of Hutchinson Island South?
Total Female Population of Hutchinson Island South is 2,138.
What is the Ratio of Males per 100 Females in Hutchinson Island South?
There are 96.59 Males per 100 Females in Hutchinson Island South.
What is the Ratio of Females per 100 Males in Hutchinson Island South?
There are 103.54 Females per 100 Males in Hutchinson Island South.
What is the Median Population Age in Hutchinson Island South?
Median Population Age in Hutchinson Island South is 72.1 Years.
What is the Average Family Size in Hutchinson Island South
Average Family Size in Hutchinson Island South is 2.1 People.
What is the Average Household Size in Hutchinson Island South
Average Household Size in Hutchinson Island South is 1.7 People.
What is Per Capita Income in Hutchinson Island South?
Per Capita income in Hutchinson Island South is $54,489.
What is the Median Family Income in Hutchinson Island South?
Median Family Income in Hutchinson Island South is $92,955.
What is the Median Household income in Hutchinson Island South?
Median Household Income in Hutchinson Island South is $63,300.
What is Income or Wage Gap in Hutchinson Island South?
Income or Wage Gap in Hutchinson Island South is 20.6%.
Women in Hutchinson Island South earn 79.4 cents for every dollar earned by a man.
What is Family Income Deficit in Hutchinson Island South?
Family Income Deficit in Hutchinson Island South is $7,575.
Families that are below poverty line in Hutchinson Island South earn $7,575 less on average than the poverty threshold level.
What is Inequality or Gini Index in Hutchinson Island South?
Inequality or Gini Index in Hutchinson Island South is 0.45.
How Large is the Labor Force in Hutchinson Island South?
There are 1,029 People in the Labor Forcein in Hutchinson Island South.
What is the Percentage of People in the Labor Force in Hutchinson Island South?
24.9% of People are in the Labor Force in Hutchinson Island South.
What is the Unemployment Rate in Hutchinson Island South?
Unemployment Rate in Hutchinson Island South is 5.4%.