Homestead Base, FL
Homestead Base Map
Homestead Base Overview
1,242
TOTAL POPULATION
517
MALE POPULATION
725
FEMALE POPULATION
71.31
MALES / 100 FEMALES
140.23
FEMALES / 100 MALES
20.2
MEDIAN AGE
4.2
AVG FAMILY SIZE
4.2
AVG HOUSEHOLD SIZE
$5,241
PER CAPITA INCOME
$17,472
FAMILY INCOME DEFICIT
0.49
INEQUALITY / GINI INDEX
293
LABOR FORCE [ PEOPLE ]
41.3%
PERCENT IN LABOR FORCE
50.0%
UNEMPLOYMENT RATE
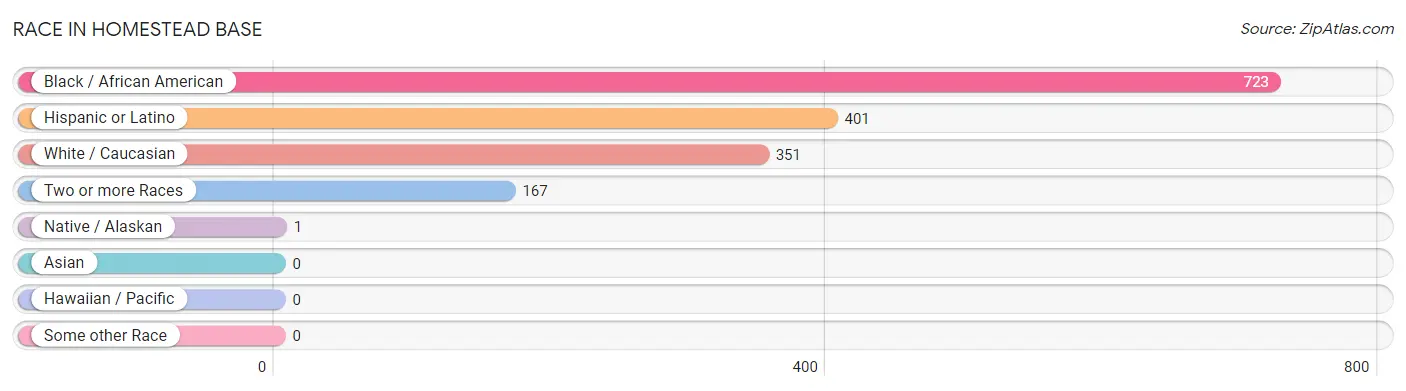
Race in Homestead Base
The most populous races in Homestead Base are Black / African American (723 | 58.2%), Hispanic or Latino (401 | 32.3%), and White / Caucasian (351 | 28.3%).
| Race | # Population | % Population |
| Asian | 0 | 0.0% |
| Black / African American | 723 | 58.2% |
| Hawaiian / Pacific | 0 | 0.0% |
| Hispanic or Latino | 401 | 32.3% |
| Native / Alaskan | 1 | 0.1% |
| White / Caucasian | 351 | 28.3% |
| Two or more Races | 167 | 13.5% |
| Some other Race | 0 | 0.0% |
| Total | 1,242 | 100.0% |
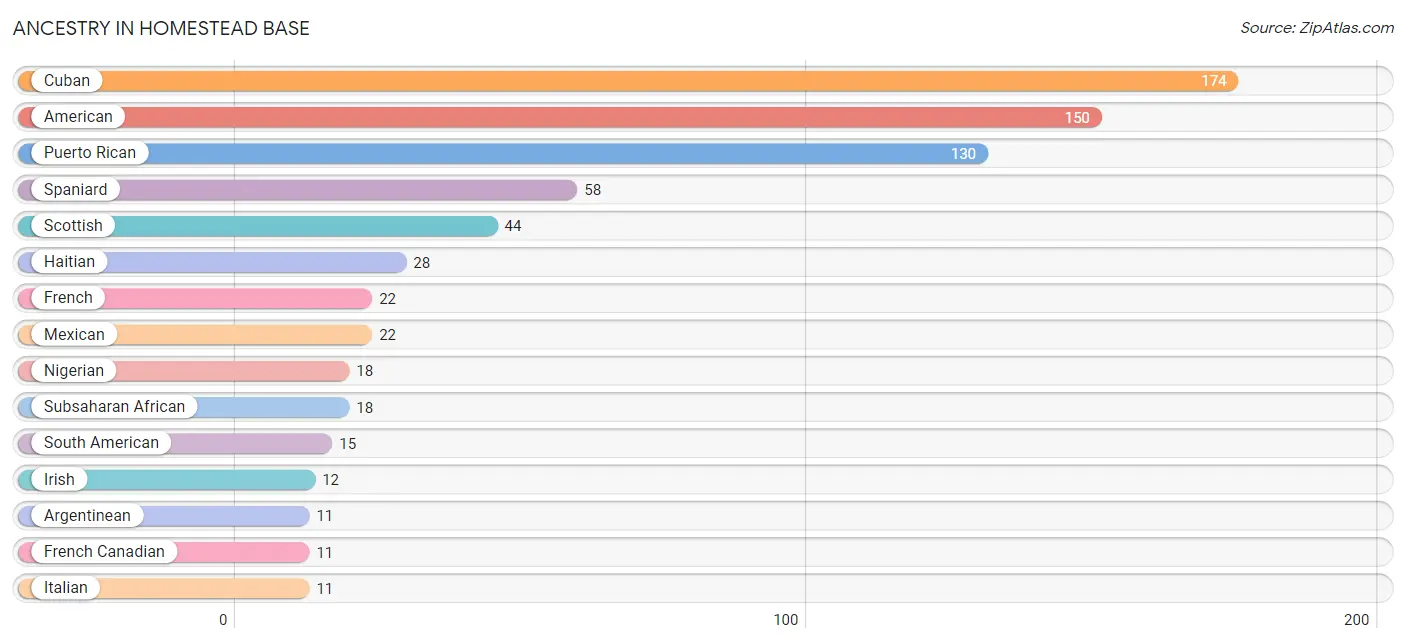
Ancestry in Homestead Base
The most populous ancestries reported in Homestead Base are Cuban (174 | 14.0%), American (150 | 12.1%), Puerto Rican (130 | 10.5%), Spaniard (58 | 4.7%), and Scottish (44 | 3.5%), together accounting for 44.8% of all Homestead Base residents.
| Ancestry | # Population | % Population |
| American | 150 | 12.1% |
| Argentinean | 11 | 0.9% |
| British | 2 | 0.2% |
| Central American Indian | 6 | 0.5% |
| Cuban | 174 | 14.0% |
| French | 22 | 1.8% |
| French Canadian | 11 | 0.9% |
| Haitian | 28 | 2.2% |
| Irish | 12 | 1.0% |
| Italian | 11 | 0.9% |
| Jamaican | 11 | 0.9% |
| Mexican | 22 | 1.8% |
| Nigerian | 18 | 1.5% |
| Puerto Rican | 130 | 10.5% |
| Scottish | 44 | 3.5% |
| South American | 15 | 1.2% |
| Spaniard | 58 | 4.7% |
| Subsaharan African | 18 | 1.5% |
| Venezuelan | 4 | 0.3% | View All 19 Rows |
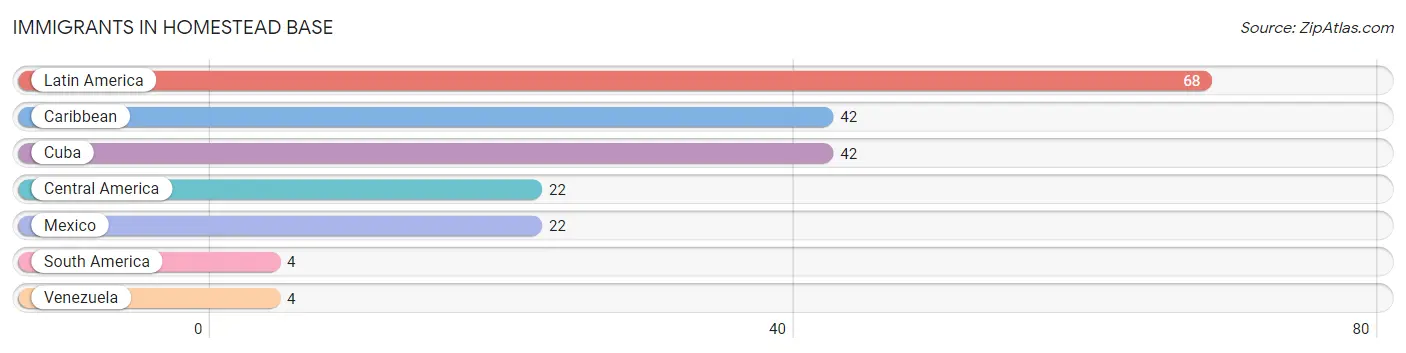
Immigrants in Homestead Base
The most numerous immigrant groups reported in Homestead Base came from Latin America (68 | 5.5%), Caribbean (42 | 3.4%), Cuba (42 | 3.4%), Central America (22 | 1.8%), and Mexico (22 | 1.8%), together accounting for 15.8% of all Homestead Base residents.
| Immigration Origin | # Population | % Population |
| Caribbean | 42 | 3.4% |
| Central America | 22 | 1.8% |
| Cuba | 42 | 3.4% |
| Latin America | 68 | 5.5% |
| Mexico | 22 | 1.8% |
| South America | 4 | 0.3% |
| Venezuela | 4 | 0.3% | View All 7 Rows |
Sex and Age in Homestead Base
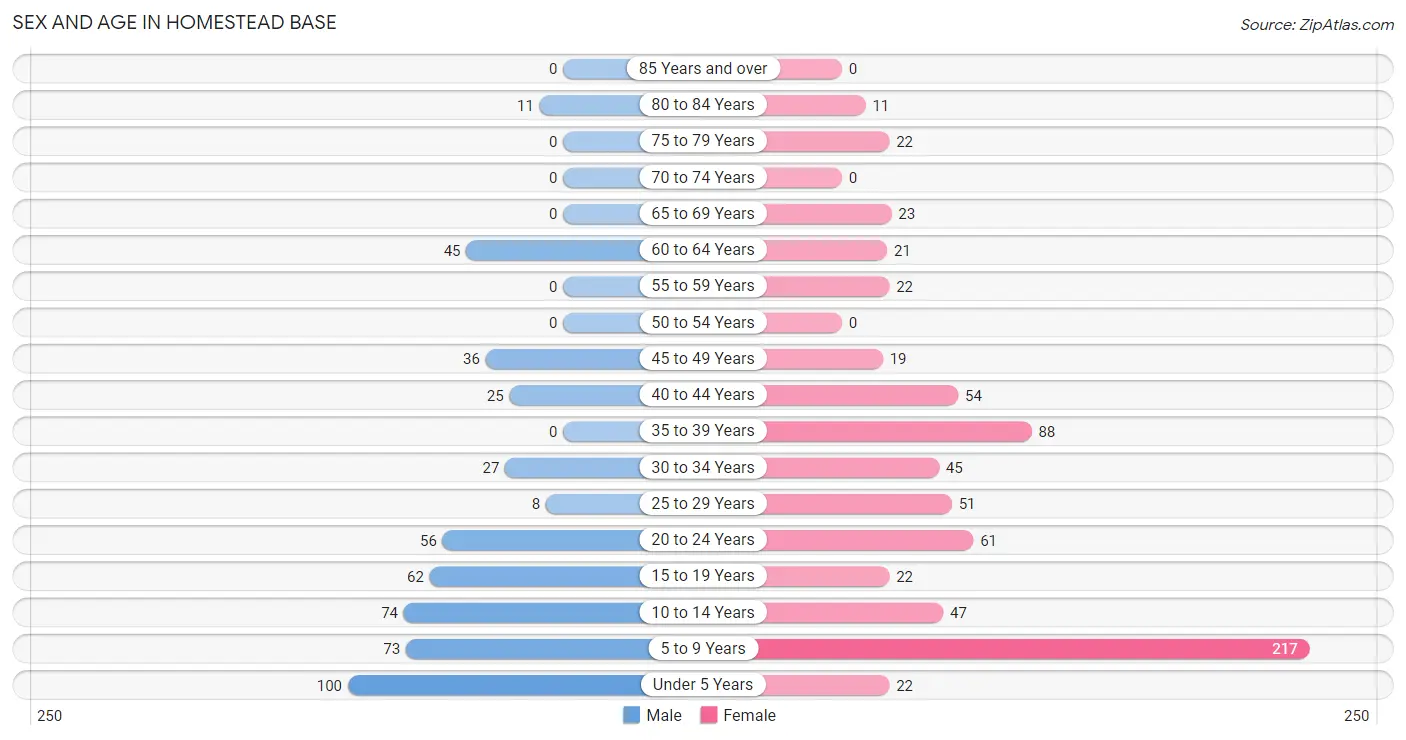
Sex and Age in Homestead Base
The most populous age groups in Homestead Base are Under 5 Years (100 | 19.3%) for men and 5 to 9 Years (217 | 29.9%) for women.
| Age Bracket | Male | Female |
| Under 5 Years | 100 (19.3%) | 22 (3.0%) |
| 5 to 9 Years | 73 (14.1%) | 217 (29.9%) |
| 10 to 14 Years | 74 (14.3%) | 47 (6.5%) |
| 15 to 19 Years | 62 (12.0%) | 22 (3.0%) |
| 20 to 24 Years | 56 (10.8%) | 61 (8.4%) |
| 25 to 29 Years | 8 (1.5%) | 51 (7.0%) |
| 30 to 34 Years | 27 (5.2%) | 45 (6.2%) |
| 35 to 39 Years | 0 (0.0%) | 88 (12.1%) |
| 40 to 44 Years | 25 (4.8%) | 54 (7.4%) |
| 45 to 49 Years | 36 (7.0%) | 19 (2.6%) |
| 50 to 54 Years | 0 (0.0%) | 0 (0.0%) |
| 55 to 59 Years | 0 (0.0%) | 22 (3.0%) |
| 60 to 64 Years | 45 (8.7%) | 21 (2.9%) |
| 65 to 69 Years | 0 (0.0%) | 23 (3.2%) |
| 70 to 74 Years | 0 (0.0%) | 0 (0.0%) |
| 75 to 79 Years | 0 (0.0%) | 22 (3.0%) |
| 80 to 84 Years | 11 (2.1%) | 11 (1.5%) |
| 85 Years and over | 0 (0.0%) | 0 (0.0%) |
| Total | 517 (100.0%) | 725 (100.0%) |
Families and Households in Homestead Base
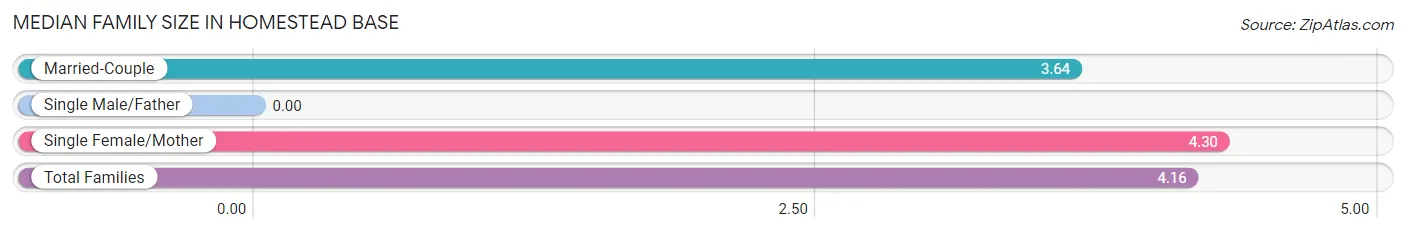
Median Family Size in Homestead Base
| Family Type | # Families | Family Size |
| Married-Couple | 44 (20.9%) | 3.64 |
| Single Male/Father | 0 (0.0%) | - |
| Single Female/Mother | 166 (79.0%) | 4.30 |
| Total Families | 210 (100.0%) | 4.16 |
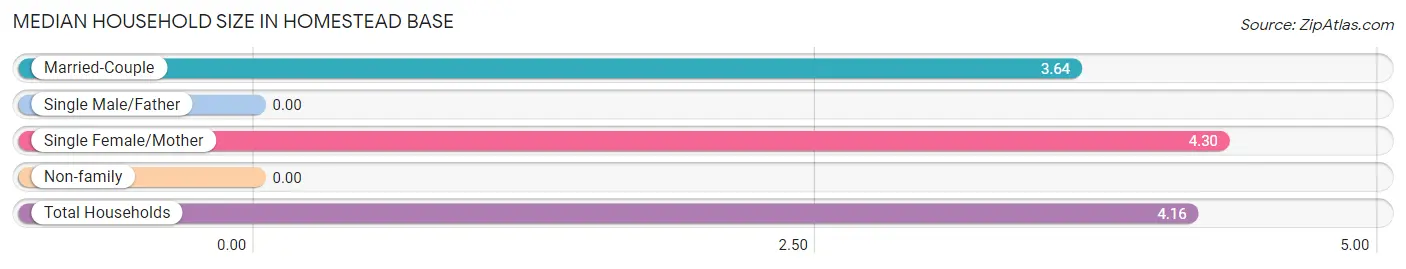
Median Household Size in Homestead Base
| Household Type | # Households | Household Size |
| Married-Couple | 44 (20.9%) | 3.64 |
| Single Male/Father | 0 (0.0%) | - |
| Single Female/Mother | 166 (79.0%) | 4.30 |
| Non-family | 0 (0.0%) | - |
| Total Households | 210 (100.0%) | 4.16 |
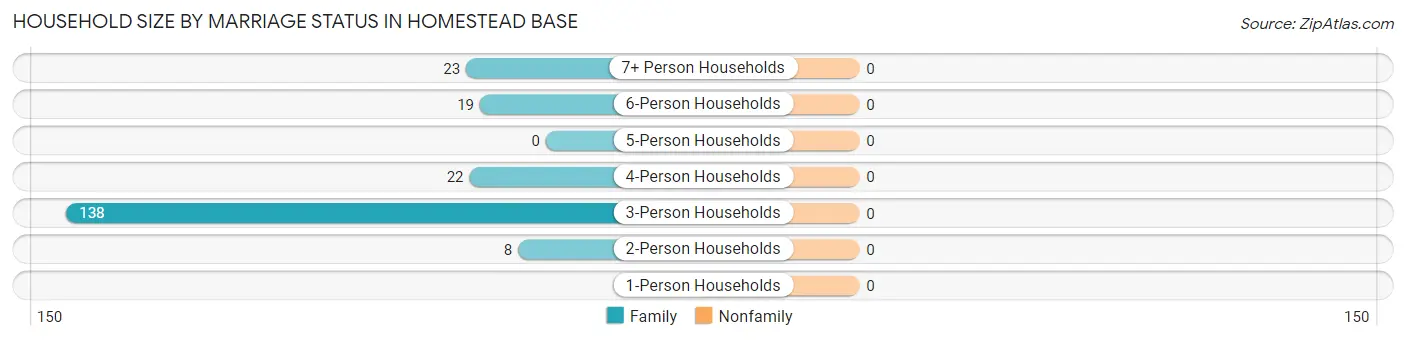
Household Size by Marriage Status in Homestead Base
| Household Size | Family Households | Nonfamily Households |
| 1-Person Households | - | 0 (0.0%) |
| 2-Person Households | 8 (3.8%) | 0 (0.0%) |
| 3-Person Households | 138 (65.7%) | 0 (0.0%) |
| 4-Person Households | 22 (10.5%) | 0 (0.0%) |
| 5-Person Households | 0 (0.0%) | 0 (0.0%) |
| 6-Person Households | 19 (9.0%) | 0 (0.0%) |
| 7+ Person Households | 23 (11.0%) | 0 (0.0%) |
| Total | 210 (100.0%) | 0 (0.0%) |
Female Fertility in Homestead Base
Fertility by Age in Homestead Base
Average fertility rate in Homestead Base is 68.0 births per 1,000 women. Women in the age bracket of 20 to 34 years have the highest fertility rate with 146.0 births per 1,000 women. Women in the age bracket of 20 to 34 years acount for 100.0% of all women with births.

| Age Bracket | Women with Births | Births / 1,000 Women |
| 15 to 19 years | 0 (0.0%) | 0.0 |
| 20 to 34 years | 23 (100.0%) | 146.0 |
| 35 to 50 years | 0 (0.0%) | 0.0 |
| Total | 23 (100.0%) | 68.0 |
Fertility by Age by Marriage Status in Homestead Base
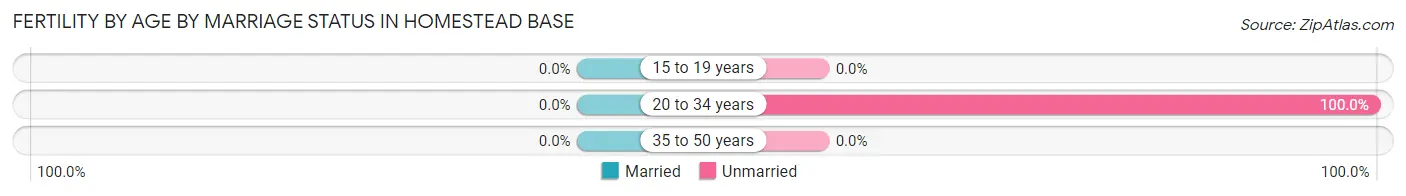
| Age Bracket | Married | Unmarried |
| 15 to 19 years | 0 (0.0%) | 0 (0.0%) |
| 20 to 34 years | 0 (0.0%) | 23 (100.0%) |
| 35 to 50 years | 0 (0.0%) | 0 (0.0%) |
| Total | 0 (0.0%) | 23 (100.0%) |
Fertility by Education in Homestead Base
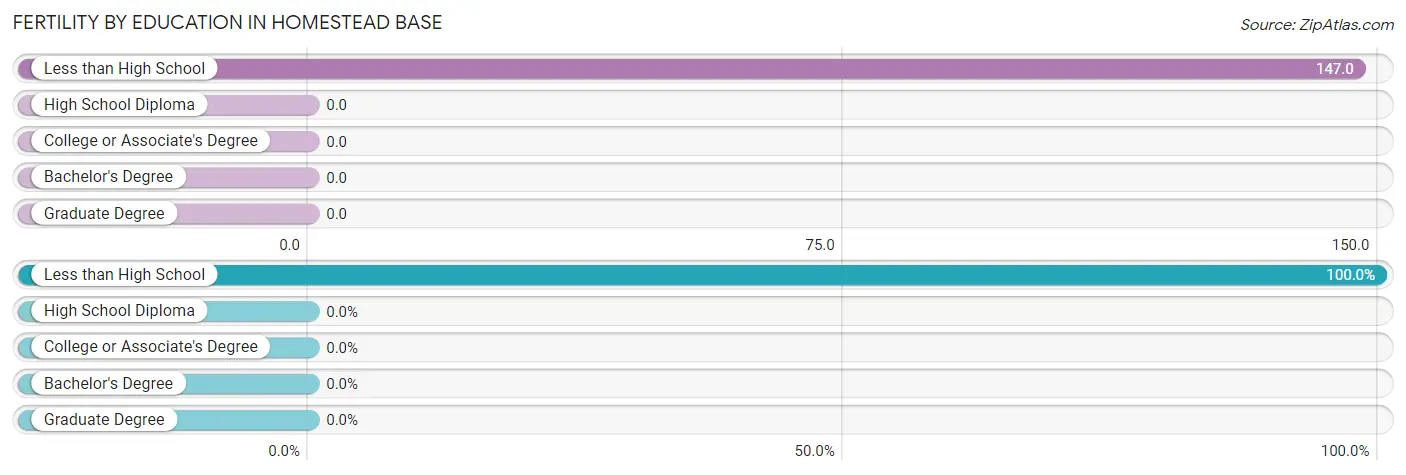
| Educational Attainment | Women with Births | Births / 1,000 Women |
| Less than High School | 23 (100.0%) | 147.0 |
| High School Diploma | 0 (0.0%) | 0.0 |
| College or Associate's Degree | 0 (0.0%) | 0.0 |
| Bachelor's Degree | 0 (0.0%) | 0.0 |
| Graduate Degree | 0 (0.0%) | 0.0 |
| Total | 23 (100.0%) | 68.0 |
Fertility by Education by Marriage Status in Homestead Base
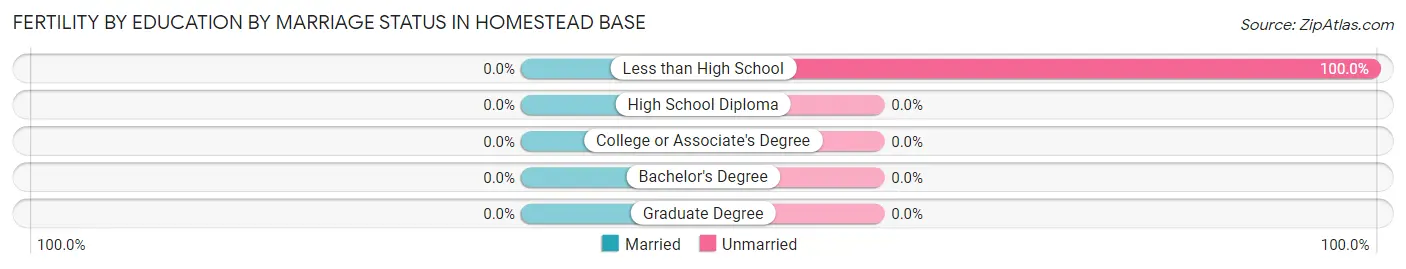
| Educational Attainment | Married | Unmarried |
| Less than High School | 0 (0.0%) | 23 (100.0%) |
| High School Diploma | 0 (0.0%) | 0 (0.0%) |
| College or Associate's Degree | 0 (0.0%) | 0 (0.0%) |
| Bachelor's Degree | 0 (0.0%) | 0 (0.0%) |
| Graduate Degree | 0 (0.0%) | 0 (0.0%) |
| Total | 0 (0.0%) | 23 (100.0%) |
Income in Homestead Base
Income Overview in Homestead Base
| Characteristic | Number | Measure |
| Per Capita Income | 1,242 | $5,241 |
| Median Family Income | 210 | $0 |
| Mean Family Income | 210 | $18,078 |
| Median Household Income | 210 | $0 |
| Mean Household Income | 210 | $18,078 |
| Income Deficit | 210 | $17,472 |
| Wage / Income Gap (%) | 1,242 | 0.00% |
| Wage / Income Gap ($) | 1,242 | 100.00¢ per $1 |
| Gini / Inequality Index | 1,242 | 0.49 |
Earnings by Sex in Homestead Base
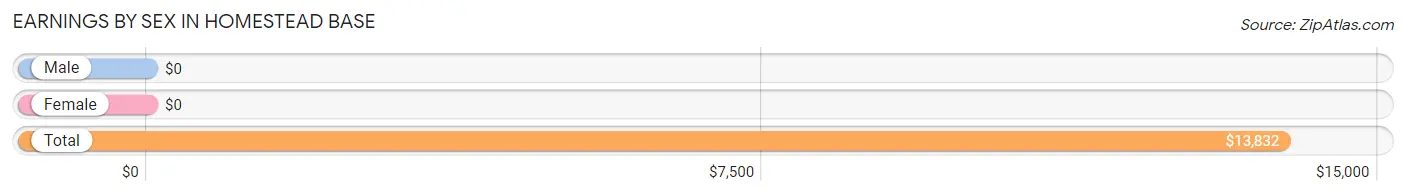
| Sex | Number | Average Earnings |
| Male | 138 (49.5%) | $0 |
| Female | 141 (50.5%) | $0 |
| Total | 279 (100.0%) | $13,832 |
Earnings by Sex by Income Bracket in Homestead Base
The most common earnings brackets in Homestead Base are $22,500 to $24,999 for men (27 | 19.6%) and $12,500 to $14,999 for women (39 | 27.7%).
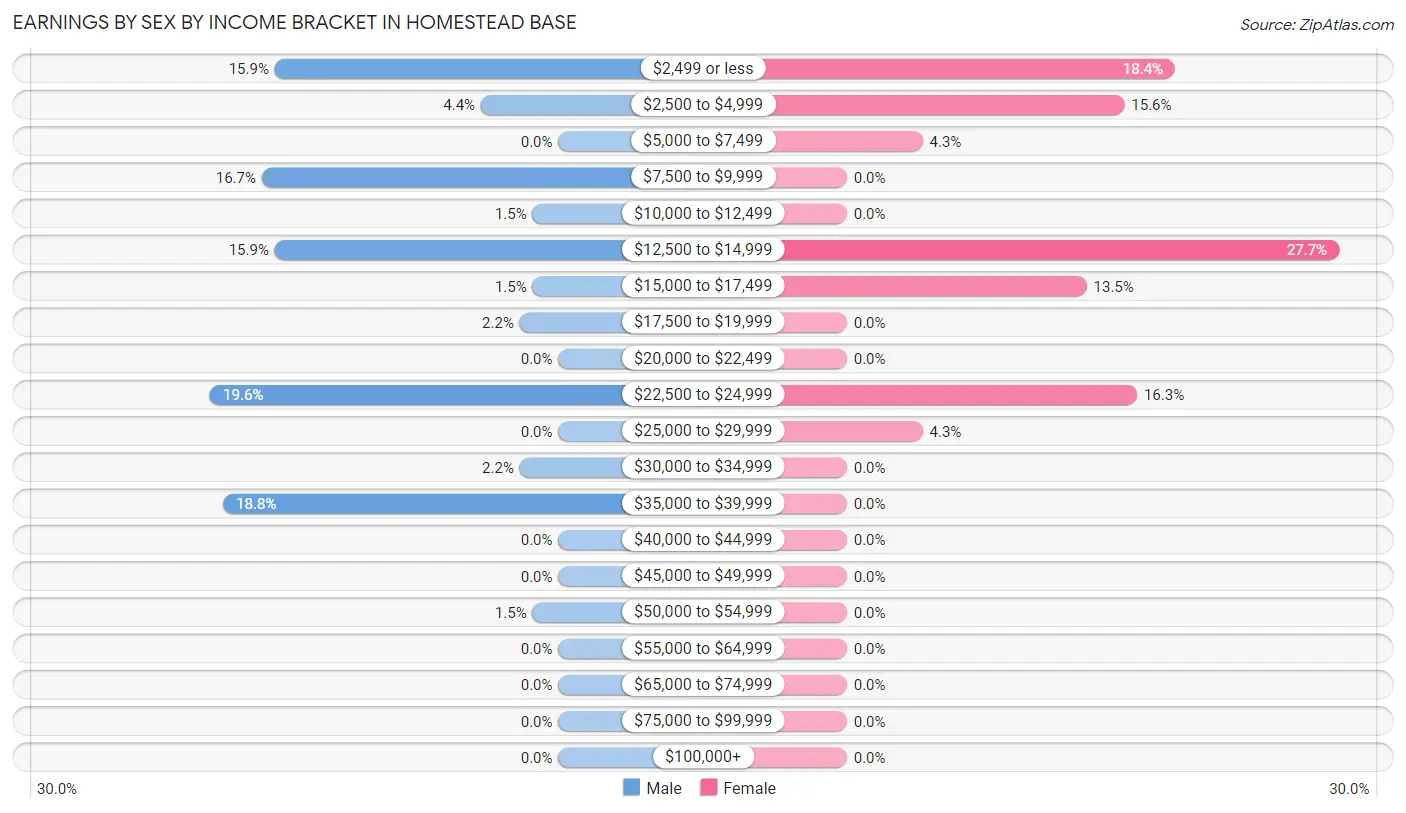
| Income | Male | Female |
| $2,499 or less | 22 (15.9%) | 26 (18.4%) |
| $2,500 to $4,999 | 6 (4.3%) | 22 (15.6%) |
| $5,000 to $7,499 | 0 (0.0%) | 6 (4.3%) |
| $7,500 to $9,999 | 23 (16.7%) | 0 (0.0%) |
| $10,000 to $12,499 | 2 (1.5%) | 0 (0.0%) |
| $12,500 to $14,999 | 22 (15.9%) | 39 (27.7%) |
| $15,000 to $17,499 | 2 (1.5%) | 19 (13.5%) |
| $17,500 to $19,999 | 3 (2.2%) | 0 (0.0%) |
| $20,000 to $22,499 | 0 (0.0%) | 0 (0.0%) |
| $22,500 to $24,999 | 27 (19.6%) | 23 (16.3%) |
| $25,000 to $29,999 | 0 (0.0%) | 6 (4.3%) |
| $30,000 to $34,999 | 3 (2.2%) | 0 (0.0%) |
| $35,000 to $39,999 | 26 (18.8%) | 0 (0.0%) |
| $40,000 to $44,999 | 0 (0.0%) | 0 (0.0%) |
| $45,000 to $49,999 | 0 (0.0%) | 0 (0.0%) |
| $50,000 to $54,999 | 2 (1.5%) | 0 (0.0%) |
| $55,000 to $64,999 | 0 (0.0%) | 0 (0.0%) |
| $65,000 to $74,999 | 0 (0.0%) | 0 (0.0%) |
| $75,000 to $99,999 | 0 (0.0%) | 0 (0.0%) |
| $100,000+ | 0 (0.0%) | 0 (0.0%) |
| Total | 138 (100.0%) | 141 (100.0%) |
Earnings by Sex by Educational Attainment in Homestead Base
Average earnings in Homestead Base are $22,639 for men and $13,878 for women, a difference of 38.7%. Men with an educational attainment of high school diploma enjoy the highest average annual earnings of $23,704, while those with high school diploma education earn the least with $23,704. Women with an educational attainment of college or associate's degree earn the most with the average annual earnings of $16,184, while those with college or associate's degree education have the smallest earnings of $16,184.
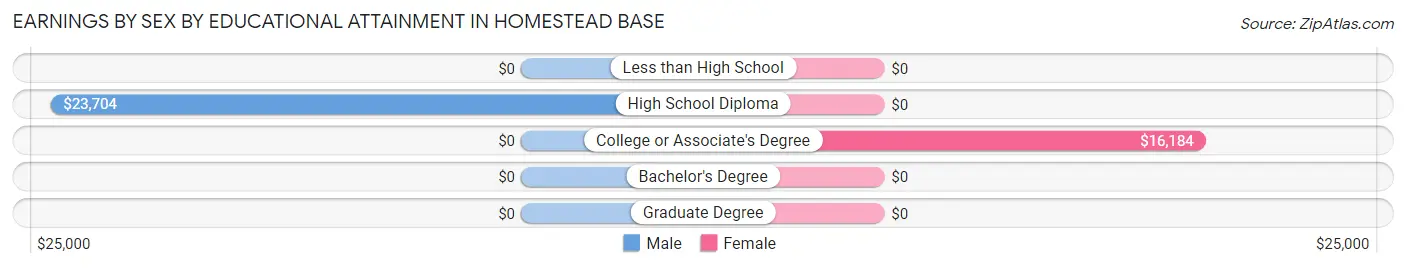
| Educational Attainment | Male Income | Female Income |
| Less than High School | - | - |
| High School Diploma | $23,704 | $0 |
| College or Associate's Degree | - | - |
| Bachelor's Degree | - | - |
| Graduate Degree | - | - |
| Total | $22,639 | $13,878 |
Family Income in Homestead Base
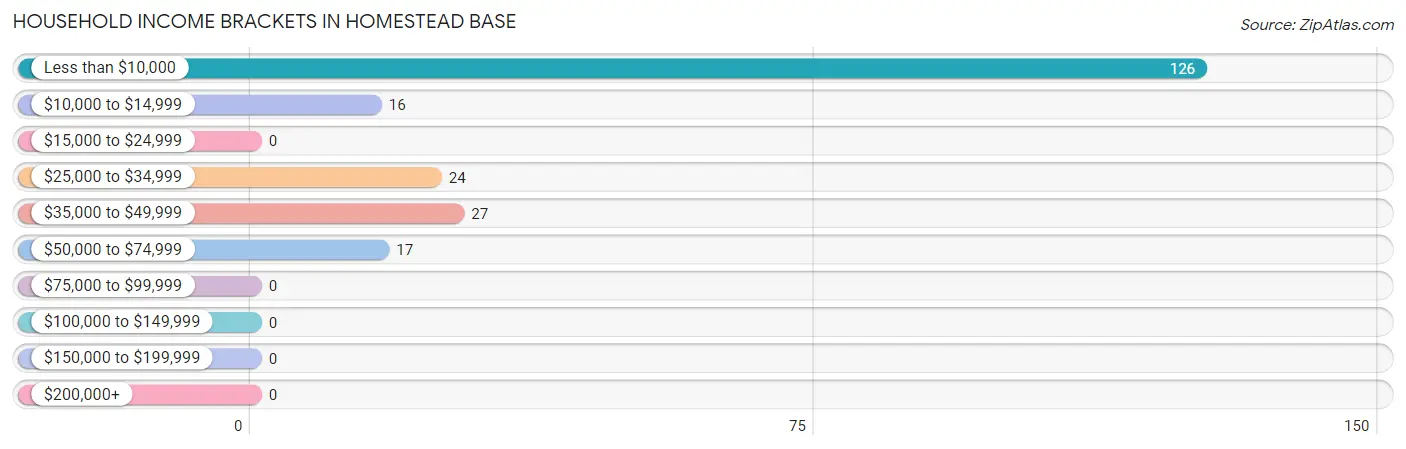
Family Income Brackets in Homestead Base
According to the Homestead Base family income data, there are 126 families falling into the less than $10,000 income range, which is the most common income bracket and makes up 60.0% of all families.
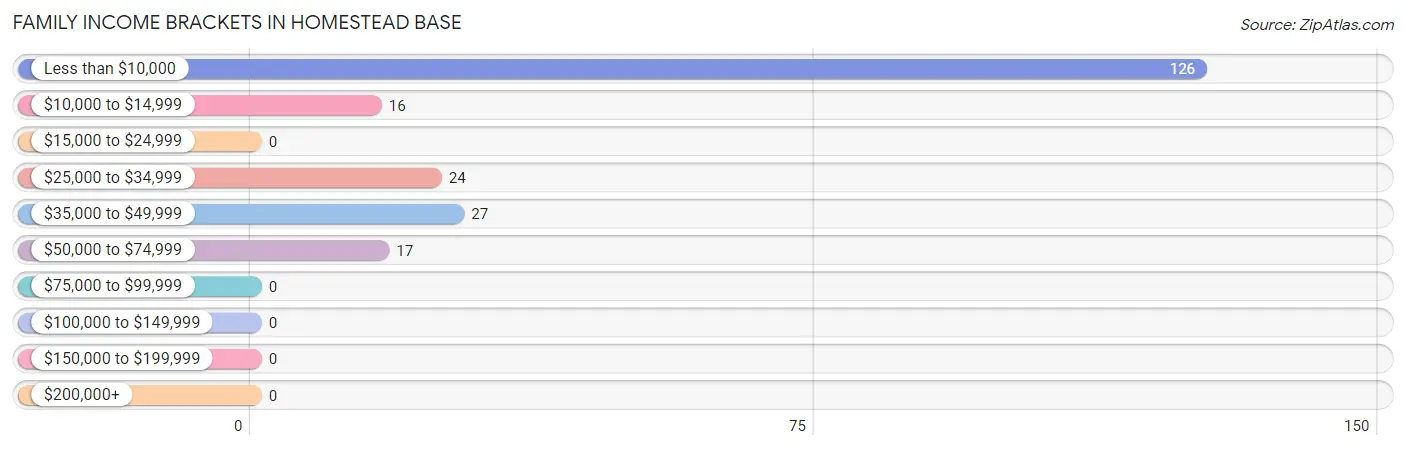
| Income Bracket | # Families | % Families |
| Less than $10,000 | 126 | 60.0% |
| $10,000 to $14,999 | 16 | 7.6% |
| $15,000 to $24,999 | 0 | 0.0% |
| $25,000 to $34,999 | 24 | 11.4% |
| $35,000 to $49,999 | 27 | 12.9% |
| $50,000 to $74,999 | 17 | 8.1% |
| $75,000 to $99,999 | 0 | 0.0% |
| $100,000 to $149,999 | 0 | 0.0% |
| $150,000 to $199,999 | 0 | 0.0% |
| $200,000+ | 0 | 0.0% |
Family Income by Famaliy Size in Homestead Base
3-person families (138 | 65.7%) account for the highest median family income in Homestead Base with $6,250 per family, while 3-person families (138 | 65.7%) have the highest median income of $2,083 per family member.
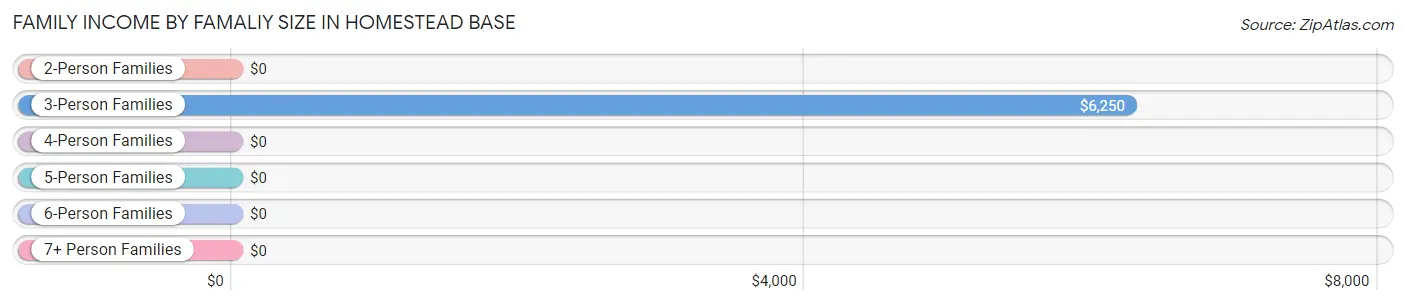
| Income Bracket | # Families | Median Income |
| 2-Person Families | 8 (3.8%) | $0 |
| 3-Person Families | 138 (65.7%) | $6,250 |
| 4-Person Families | 22 (10.5%) | $0 |
| 5-Person Families | 0 (0.0%) | $0 |
| 6-Person Families | 19 (9.0%) | $0 |
| 7+ Person Families | 23 (11.0%) | $0 |
| Total | 210 (100.0%) | $0 |
Family Income by Number of Earners in Homestead Base
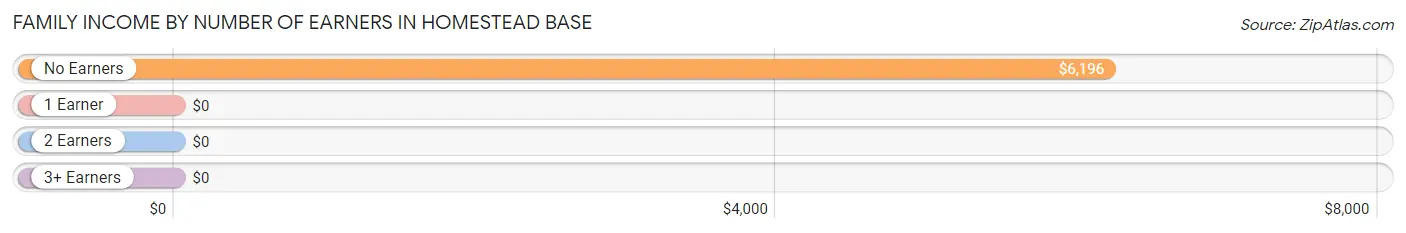
| Number of Earners | # Families | Median Income |
| No Earners | 94 (44.8%) | $6,196 |
| 1 Earner | 89 (42.4%) | $0 |
| 2 Earners | 27 (12.9%) | $0 |
| 3+ Earners | 0 (0.0%) | $0 |
| Total | 210 (100.0%) | $0 |
Household Income in Homestead Base
Household Income Brackets in Homestead Base
With 126 households falling in the category, the less than $10,000 income range is the most frequent in Homestead Base, accounting for 60.0% of all households.
| Income Bracket | # Households | % Households |
| Less than $10,000 | 126 | 60.0% |
| $10,000 to $14,999 | 16 | 7.6% |
| $15,000 to $24,999 | 0 | 0.0% |
| $25,000 to $34,999 | 24 | 11.4% |
| $35,000 to $49,999 | 27 | 12.9% |
| $50,000 to $74,999 | 17 | 8.1% |
| $75,000 to $99,999 | 0 | 0.0% |
| $100,000 to $149,999 | 0 | 0.0% |
| $150,000 to $199,999 | 0 | 0.0% |
| $200,000+ | 0 | 0.0% |
Household Income by Householder Age in Homestead Base
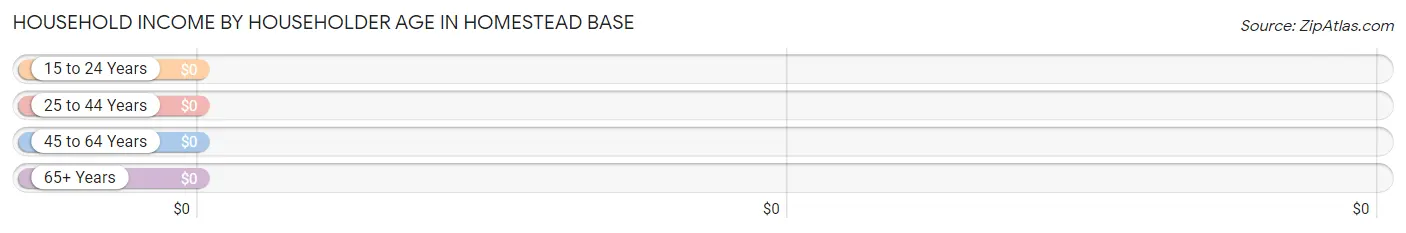
| Income Bracket | # Households | Median Income |
| 15 to 24 Years | 34 (16.2%) | $0 |
| 25 to 44 Years | 168 (80.0%) | $0 |
| 45 to 64 Years | 8 (3.8%) | $0 |
| 65+ Years | 0 (0.0%) | $0 |
| Total | 210 (100.0%) | $0 |
Poverty in Homestead Base
Income Below Poverty by Sex and Age in Homestead Base
With 75.9% poverty level for males and 87.6% for females among the residents of Homestead Base, under 5 year old males and under 5 year old females are the most vulnerable to poverty, with 100 males (100.0%) and 22 females (100.0%) in their respective age groups living below the poverty level.
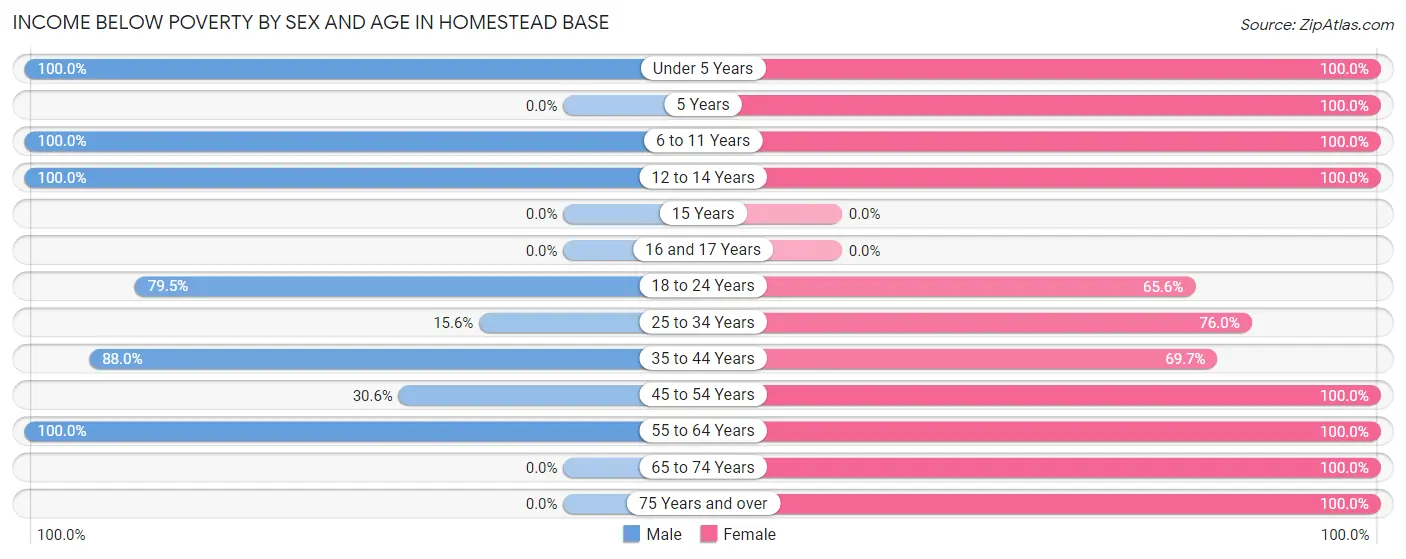
| Age Bracket | Male | Female |
| Under 5 Years | 100 (100.0%) | 22 (100.0%) |
| 5 Years | 0 (0.0%) | 27 (100.0%) |
| 6 to 11 Years | 54 (100.0%) | 227 (100.0%) |
| 12 to 14 Years | 43 (100.0%) | 10 (100.0%) |
| 15 Years | 0 (0.0%) | 0 (0.0%) |
| 16 and 17 Years | 0 (0.0%) | 0 (0.0%) |
| 18 to 24 Years | 66 (79.5%) | 40 (65.6%) |
| 25 to 34 Years | 5 (15.6%) | 73 (76.0%) |
| 35 to 44 Years | 22 (88.0%) | 99 (69.7%) |
| 45 to 54 Years | 11 (30.6%) | 19 (100.0%) |
| 55 to 64 Years | 45 (100.0%) | 43 (100.0%) |
| 65 to 74 Years | 0 (0.0%) | 23 (100.0%) |
| 75 Years and over | 0 (0.0%) | 33 (100.0%) |
| Total | 346 (75.9%) | 616 (87.6%) |
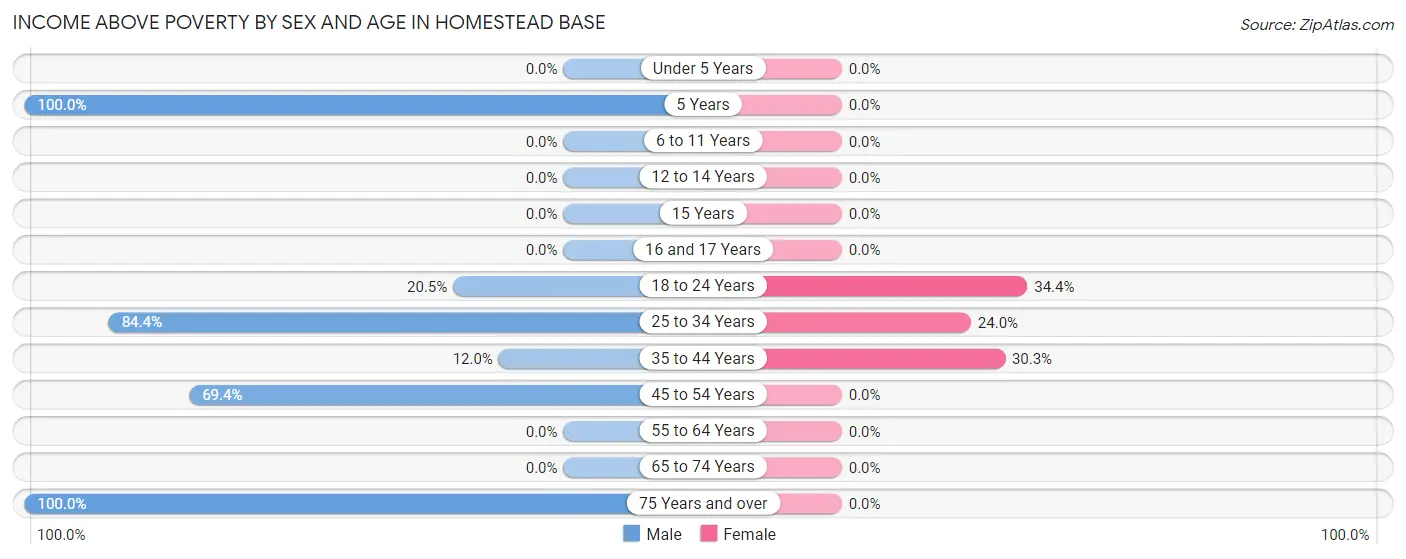
Income Above Poverty by Sex and Age in Homestead Base
According to the poverty statistics in Homestead Base, males aged 5 years and females aged 18 to 24 years are the age groups that are most secure financially, with 100.0% of males and 34.4% of females in these age groups living above the poverty line.
| Age Bracket | Male | Female |
| Under 5 Years | 0 (0.0%) | 0 (0.0%) |
| 5 Years | 27 (100.0%) | 0 (0.0%) |
| 6 to 11 Years | 0 (0.0%) | 0 (0.0%) |
| 12 to 14 Years | 0 (0.0%) | 0 (0.0%) |
| 15 Years | 0 (0.0%) | 0 (0.0%) |
| 16 and 17 Years | 0 (0.0%) | 0 (0.0%) |
| 18 to 24 Years | 17 (20.5%) | 21 (34.4%) |
| 25 to 34 Years | 27 (84.4%) | 23 (24.0%) |
| 35 to 44 Years | 3 (12.0%) | 43 (30.3%) |
| 45 to 54 Years | 25 (69.4%) | 0 (0.0%) |
| 55 to 64 Years | 0 (0.0%) | 0 (0.0%) |
| 65 to 74 Years | 0 (0.0%) | 0 (0.0%) |
| 75 Years and over | 11 (100.0%) | 0 (0.0%) |
| Total | 110 (24.1%) | 87 (12.4%) |
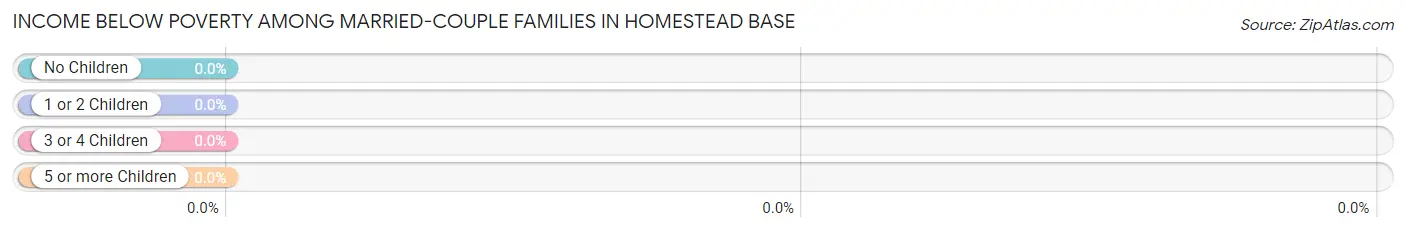
Income Below Poverty Among Married-Couple Families in Homestead Base
| Children | Above Poverty | Below Poverty |
| No Children | 17 (100.0%) | 0 (0.0%) |
| 1 or 2 Children | 27 (100.0%) | 0 (0.0%) |
| 3 or 4 Children | 0 (0.0%) | 0 (0.0%) |
| 5 or more Children | 0 (0.0%) | 0 (0.0%) |
| Total | 44 (100.0%) | 0 (0.0%) |
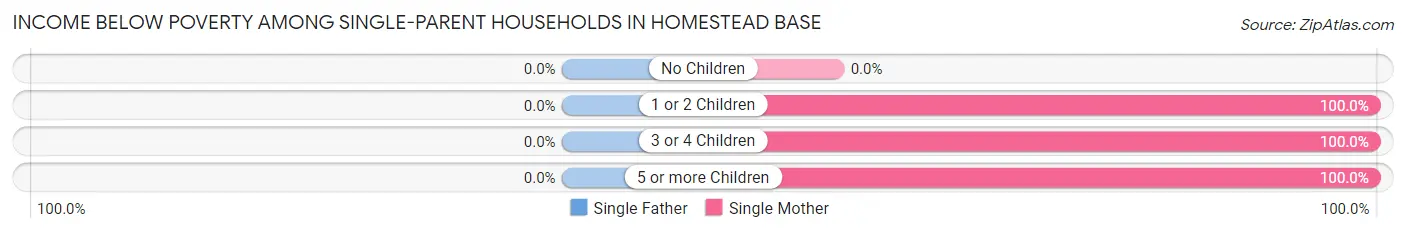
Income Below Poverty Among Single-Parent Households in Homestead Base
| Children | Single Father | Single Mother |
| No Children | 0 (0.0%) | 0 (0.0%) |
| 1 or 2 Children | 0 (0.0%) | 119 (100.0%) |
| 3 or 4 Children | 0 (0.0%) | 24 (100.0%) |
| 5 or more Children | 0 (0.0%) | 23 (100.0%) |
| Total | 0 (0.0%) | 166 (100.0%) |
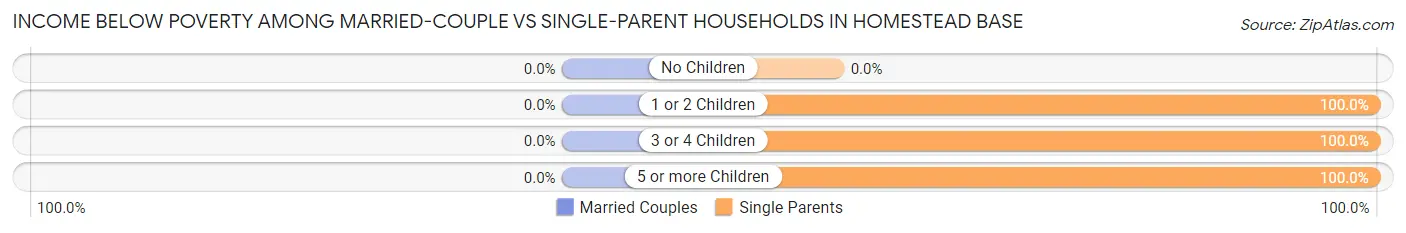
Income Below Poverty Among Married-Couple vs Single-Parent Households in Homestead Base
| Children | Married-Couple Families | Single-Parent Households |
| No Children | 0 (0.0%) | 0 (0.0%) |
| 1 or 2 Children | 0 (0.0%) | 119 (100.0%) |
| 3 or 4 Children | 0 (0.0%) | 24 (100.0%) |
| 5 or more Children | 0 (0.0%) | 23 (100.0%) |
| Total | 0 (0.0%) | 166 (100.0%) |
Employment Characteristics in Homestead Base
Employment by Class of Employer in Homestead Base
Among the 146 employed individuals in Homestead Base, private company employees (103 | 70.6%), self-employed (not incorporated) (25 | 17.1%), and federal government employees (12 | 8.2%) make up the most common classes of employment.
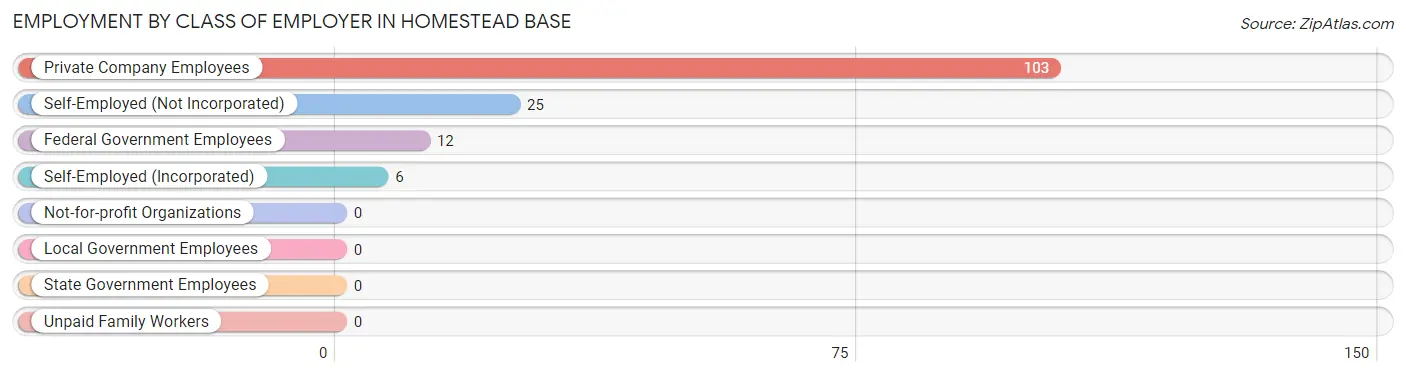
| Employer Class | # Employees | % Employees |
| Private Company Employees | 103 | 70.6% |
| Self-Employed (Incorporated) | 6 | 4.1% |
| Self-Employed (Not Incorporated) | 25 | 17.1% |
| Not-for-profit Organizations | 0 | 0.0% |
| Local Government Employees | 0 | 0.0% |
| State Government Employees | 0 | 0.0% |
| Federal Government Employees | 12 | 8.2% |
| Unpaid Family Workers | 0 | 0.0% |
| Total | 146 | 100.0% |
Employment Status by Age in Homestead Base
According to the labor force statistics for Homestead Base, out of the total population over 16 years of age (709), 41.3% or 293 individuals are in the labor force, with 50.0% or 146 of them unemployed. The age group with the highest labor force participation rate is 30 to 34 years, with 100.0% or 72 individuals in the labor force. Within the labor force, the 25 to 29 years age range has the highest percentage of unemployed individuals, with 100.0% or 34 of them being unemployed.
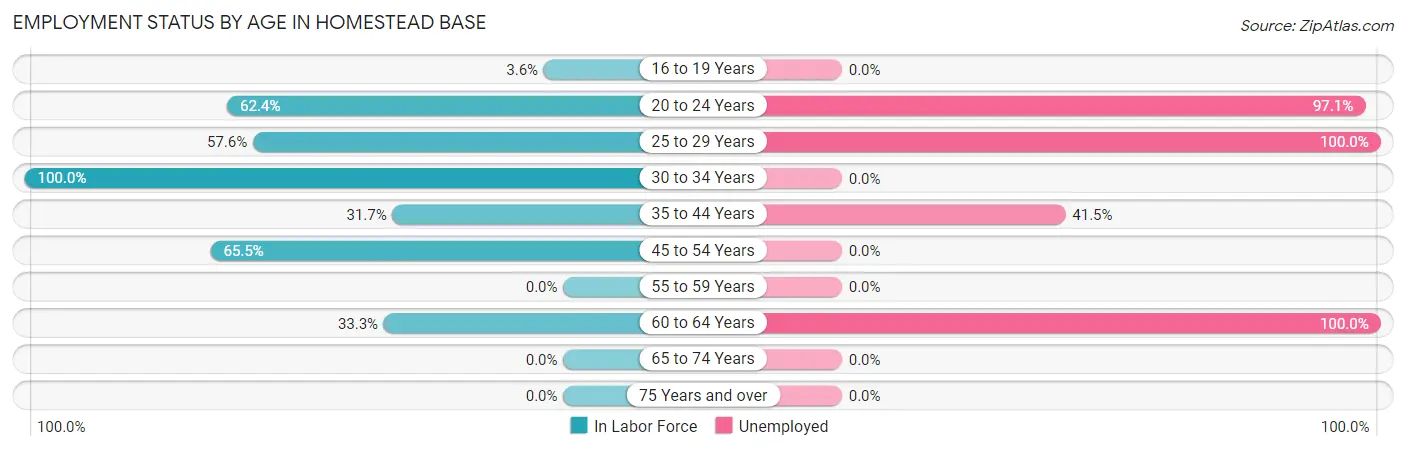
| Age Bracket | In Labor Force | Unemployed |
| 16 to 19 Years | 3 (3.6%) | 0 (0.0%) |
| 20 to 24 Years | 73 (62.4%) | 71 (97.1%) |
| 25 to 29 Years | 34 (57.6%) | 34 (100.0%) |
| 30 to 34 Years | 72 (100.0%) | 0 (0.0%) |
| 35 to 44 Years | 53 (31.7%) | 22 (41.5%) |
| 45 to 54 Years | 36 (65.5%) | 0 (0.0%) |
| 55 to 59 Years | 0 (0.0%) | 0 (0.0%) |
| 60 to 64 Years | 22 (33.3%) | 22 (100.0%) |
| 65 to 74 Years | 0 (0.0%) | 0 (0.0%) |
| 75 Years and over | 0 (0.0%) | 0 (0.0%) |
| Total | 293 (41.3%) | 146 (50.0%) |
Employment Status by Educational Attainment in Homestead Base
According to labor force statistics for Homestead Base, 49.2% of individuals (217) out of the total population between 25 and 64 years of age (441) are in the labor force, with 35.0% or 76 of them being unemployed. The group with the highest labor force participation rate are those with the educational attainment of bachelor's degree or higher, with 100.0% or 27 individuals in the labor force. Within the labor force, individuals with bachelor's degree or higher education have the highest percentage of unemployment, with 100.0% or 27 of them being unemployed.
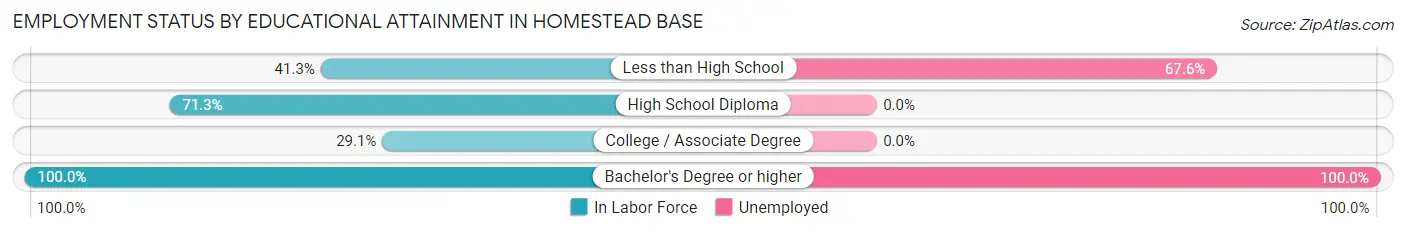
| Educational Attainment | In Labor Force | Unemployed |
| Less than High School | 71 (41.3%) | 116 (67.6%) |
| High School Diploma | 82 (71.3%) | 0 (0.0%) |
| College / Associate Degree | 37 (29.1%) | 0 (0.0%) |
| Bachelor's Degree or higher | 27 (100.0%) | 27 (100.0%) |
| Total | 217 (49.2%) | 154 (35.0%) |
Employment Occupations by Sex in Homestead Base
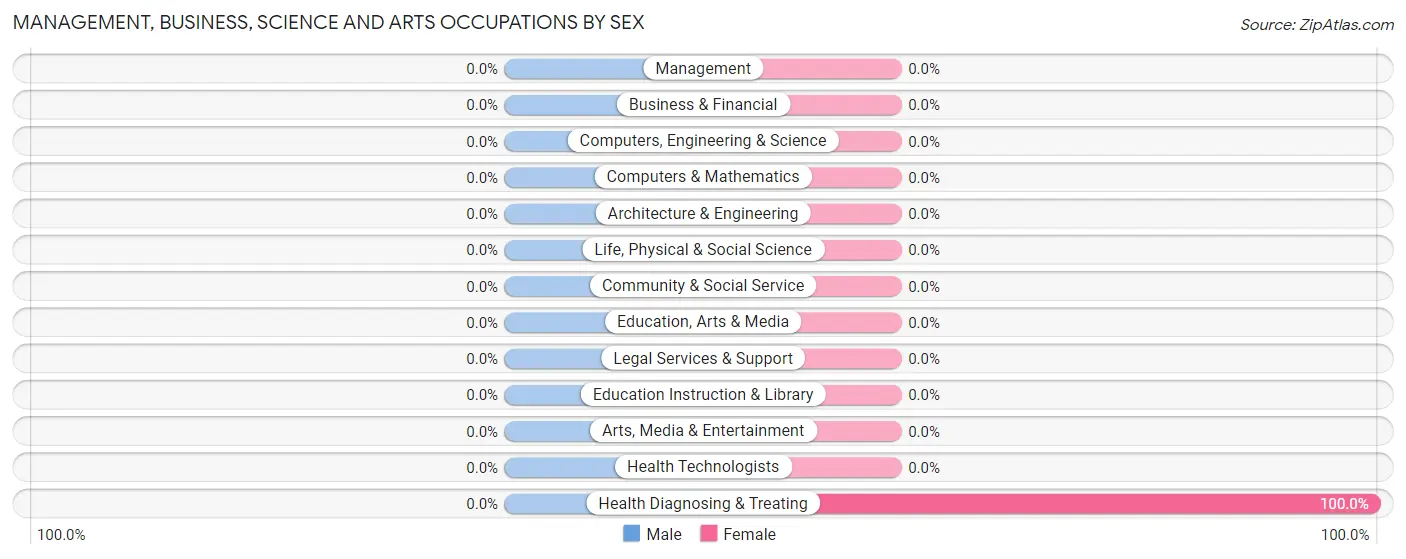
Management, Business, Science and Arts Occupations
The most common Management, Business, Science and Arts occupations in Homestead Base are , and Health Diagnosing & Treating (1 | 0.7%).
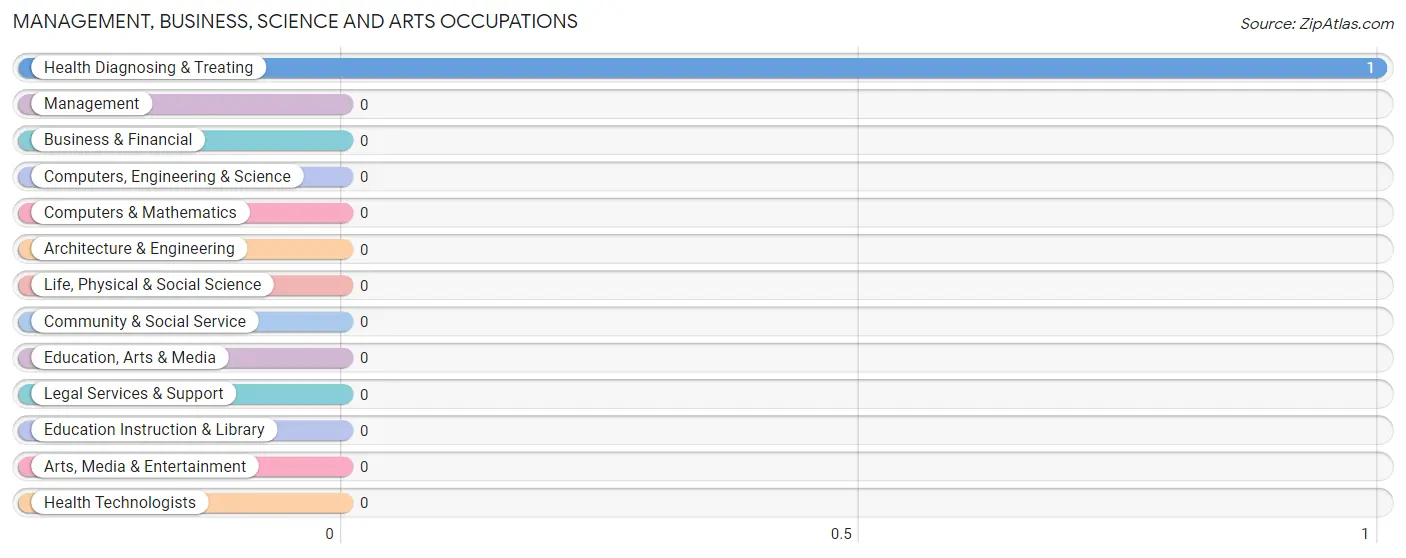
Management, Business, Science and Arts Occupations by Sex
| Occupation | Male | Female |
| Management | 0 (0.0%) | 0 (0.0%) |
| Business & Financial | 0 (0.0%) | 0 (0.0%) |
| Computers, Engineering & Science | 0 (0.0%) | 0 (0.0%) |
| Computers & Mathematics | 0 (0.0%) | 0 (0.0%) |
| Architecture & Engineering | 0 (0.0%) | 0 (0.0%) |
| Life, Physical & Social Science | 0 (0.0%) | 0 (0.0%) |
| Community & Social Service | 0 (0.0%) | 0 (0.0%) |
| Education, Arts & Media | 0 (0.0%) | 0 (0.0%) |
| Legal Services & Support | 0 (0.0%) | 0 (0.0%) |
| Education Instruction & Library | 0 (0.0%) | 0 (0.0%) |
| Arts, Media & Entertainment | 0 (0.0%) | 0 (0.0%) |
| Health Diagnosing & Treating | 0 (0.0%) | 1 (100.0%) |
| Health Technologists | 0 (0.0%) | 0 (0.0%) |
| Total (Category) | 0 (0.0%) | 1 (100.0%) |
| Total (Overall) | 57 (40.1%) | 85 (59.9%) |
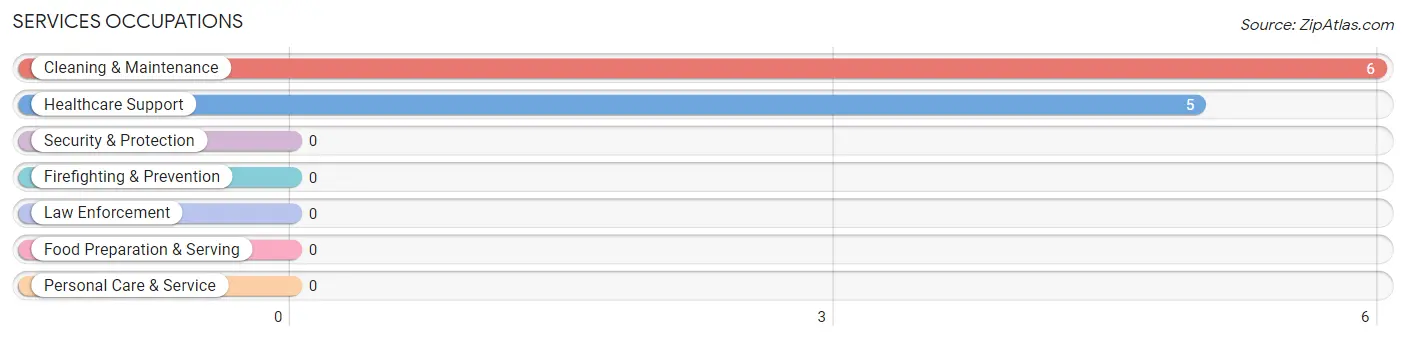
Services Occupations
The most common Services occupations in Homestead Base are Cleaning & Maintenance (6 | 4.2%), and Healthcare Support (5 | 3.5%).
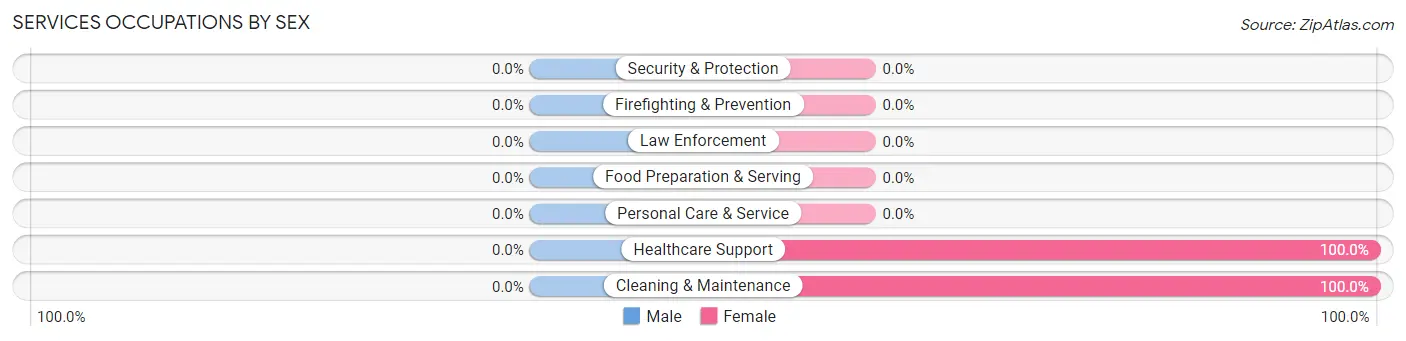
Services Occupations by Sex
| Occupation | Male | Female |
| Healthcare Support | 0 (0.0%) | 5 (100.0%) |
| Security & Protection | 0 (0.0%) | 0 (0.0%) |
| Firefighting & Prevention | 0 (0.0%) | 0 (0.0%) |
| Law Enforcement | 0 (0.0%) | 0 (0.0%) |
| Food Preparation & Serving | 0 (0.0%) | 0 (0.0%) |
| Cleaning & Maintenance | 0 (0.0%) | 6 (100.0%) |
| Personal Care & Service | 0 (0.0%) | 0 (0.0%) |
| Total (Category) | 0 (0.0%) | 11 (100.0%) |
| Total (Overall) | 57 (40.1%) | 85 (59.9%) |
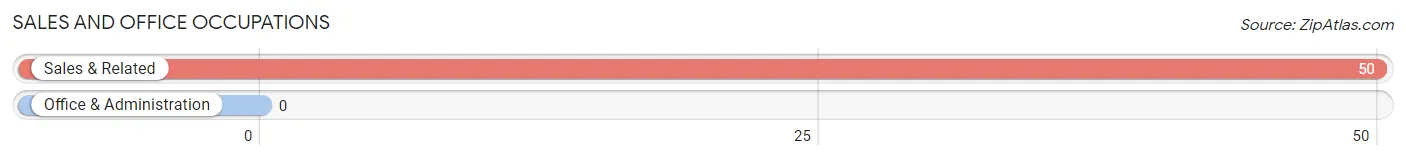
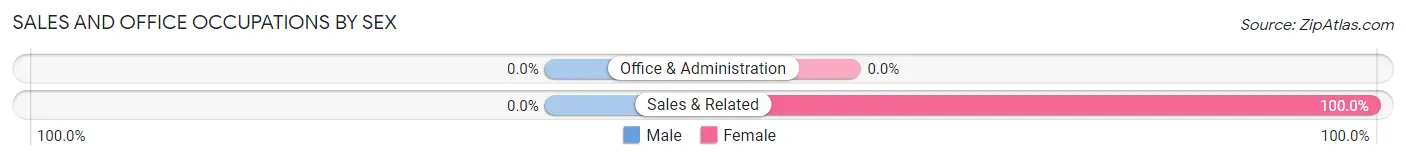
Sales and Office Occupations
The most common Sales and Office occupations in Homestead Base are , and Sales & Related (50 | 35.2%).
Sales and Office Occupations by Sex
| Occupation | Male | Female |
| Sales & Related | 0 (0.0%) | 50 (100.0%) |
| Office & Administration | 0 (0.0%) | 0 (0.0%) |
| Total (Category) | 0 (0.0%) | 50 (100.0%) |
| Total (Overall) | 57 (40.1%) | 85 (59.9%) |
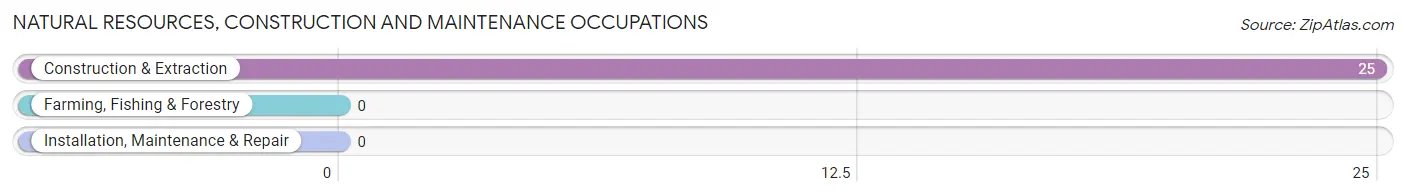
Natural Resources, Construction and Maintenance Occupations
The most common Natural Resources, Construction and Maintenance occupations in Homestead Base are , and Construction & Extraction (25 | 17.6%).
Natural Resources, Construction and Maintenance Occupations by Sex
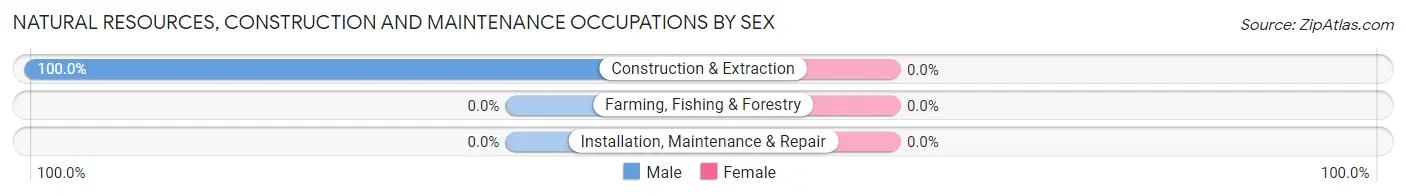
| Occupation | Male | Female |
| Farming, Fishing & Forestry | 0 (0.0%) | 0 (0.0%) |
| Construction & Extraction | 25 (100.0%) | 0 (0.0%) |
| Installation, Maintenance & Repair | 0 (0.0%) | 0 (0.0%) |
| Total (Category) | 25 (100.0%) | 0 (0.0%) |
| Total (Overall) | 57 (40.1%) | 85 (59.9%) |
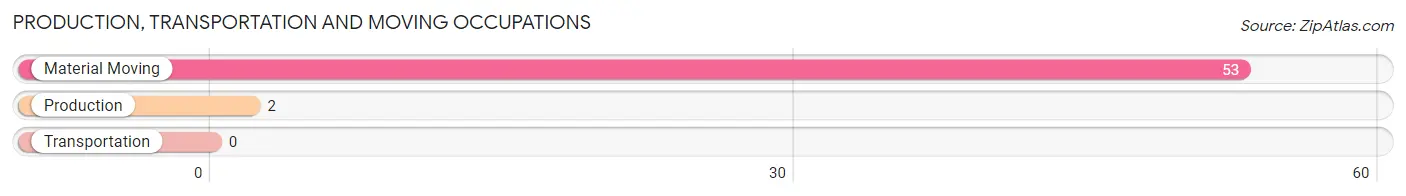
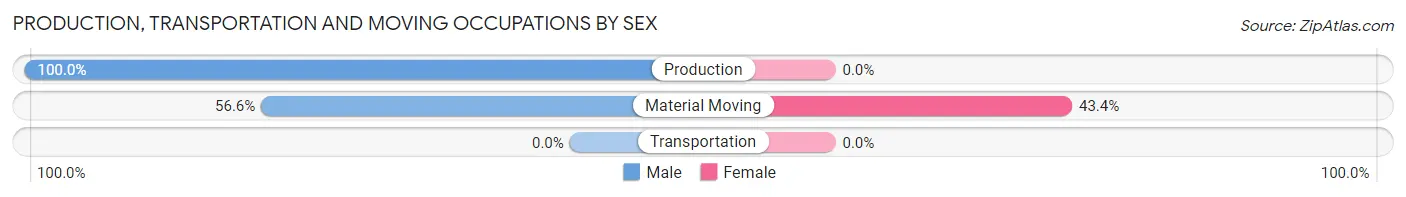
Production, Transportation and Moving Occupations
The most common Production, Transportation and Moving occupations in Homestead Base are Material Moving (53 | 37.3%), and Production (2 | 1.4%).
Production, Transportation and Moving Occupations by Sex
| Occupation | Male | Female |
| Production | 2 (100.0%) | 0 (0.0%) |
| Transportation | 0 (0.0%) | 0 (0.0%) |
| Material Moving | 30 (56.6%) | 23 (43.4%) |
| Total (Category) | 32 (58.2%) | 23 (41.8%) |
| Total (Overall) | 57 (40.1%) | 85 (59.9%) |
Employment Industries by Sex in Homestead Base
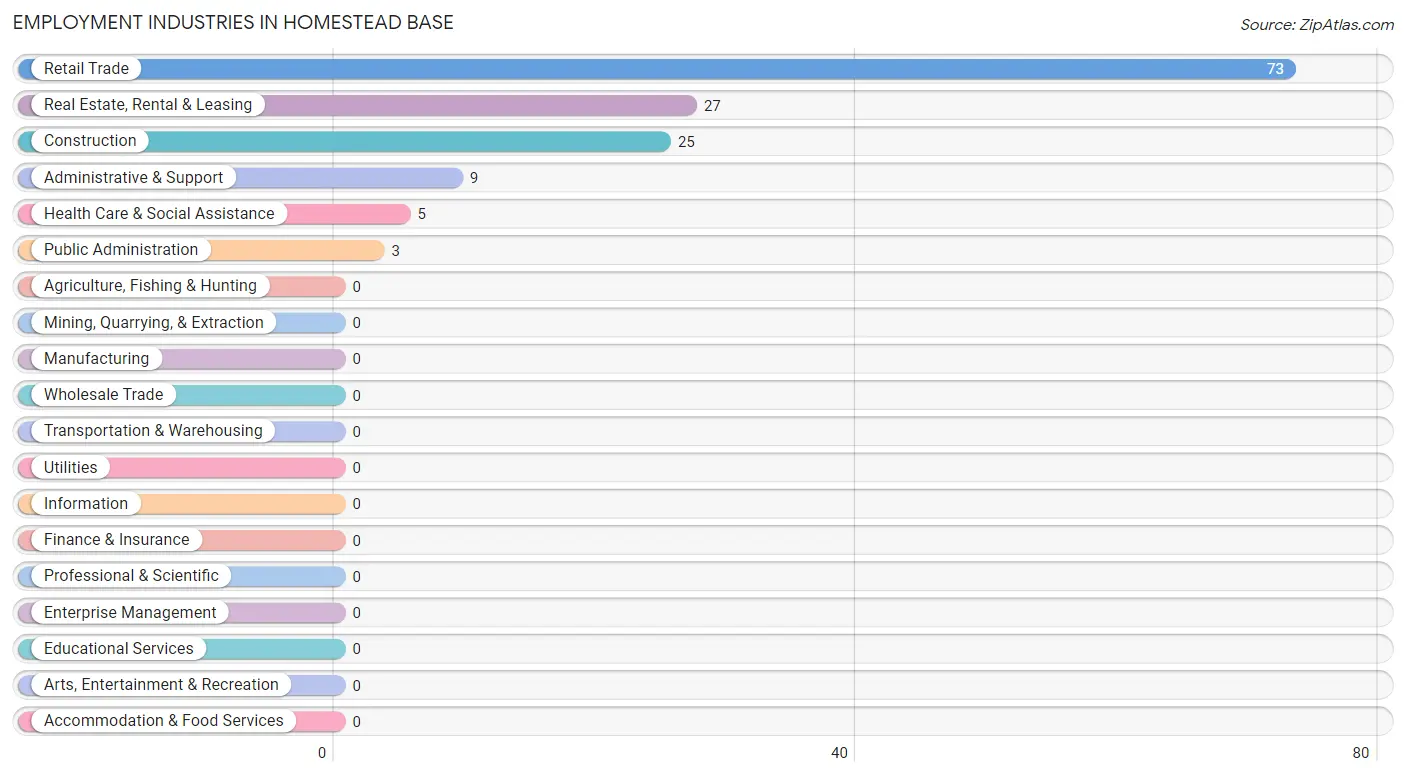
Employment Industries in Homestead Base
The major employment industries in Homestead Base include Retail Trade (73 | 51.4%), Real Estate, Rental & Leasing (27 | 19.0%), Construction (25 | 17.6%), Administrative & Support (9 | 6.3%), and Health Care & Social Assistance (5 | 3.5%).
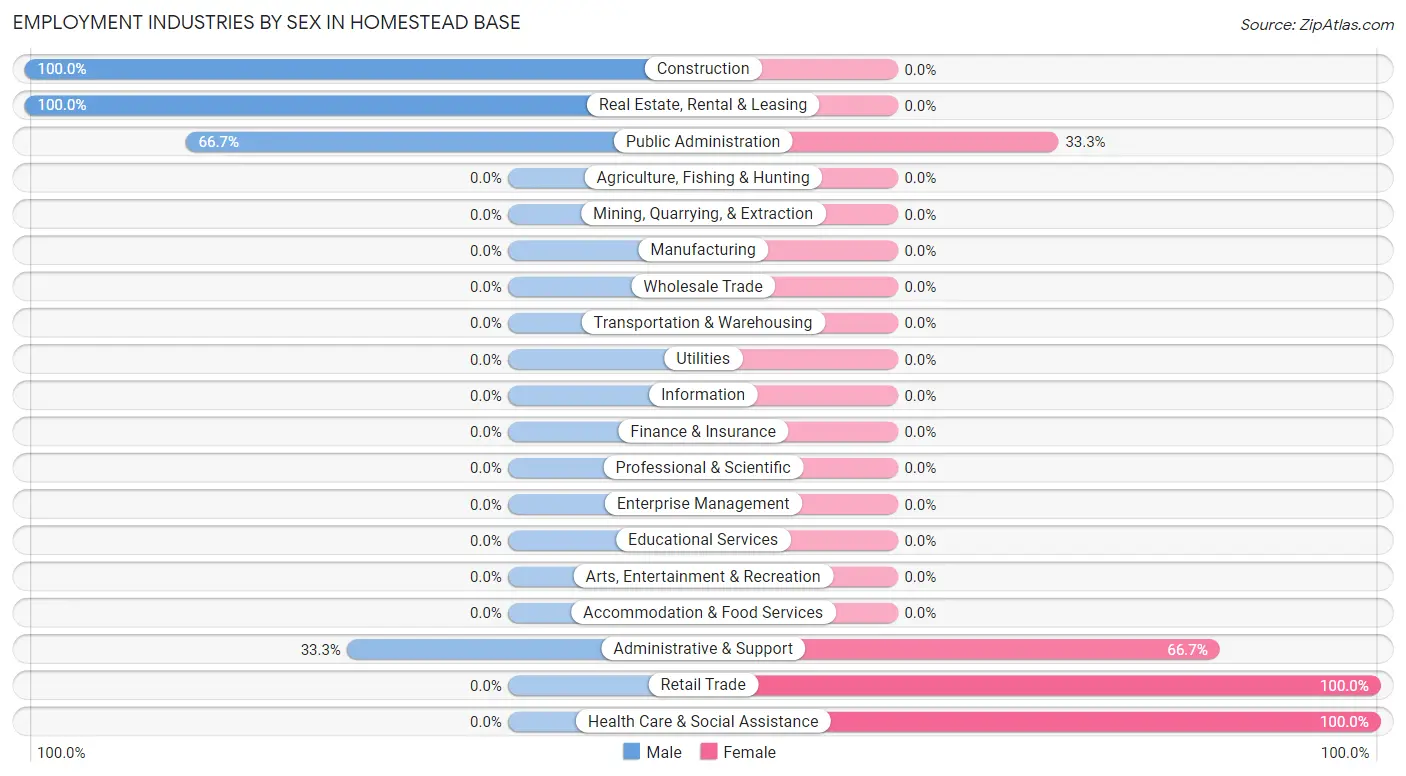
Employment Industries by Sex in Homestead Base
The Homestead Base industries that see more men than women are Construction (100.0%), Real Estate, Rental & Leasing (100.0%), and Public Administration (66.7%), whereas the industries that tend to have a higher number of women are Retail Trade (100.0%), Health Care & Social Assistance (100.0%), and Administrative & Support (66.7%).
| Industry | Male | Female |
| Agriculture, Fishing & Hunting | 0 (0.0%) | 0 (0.0%) |
| Mining, Quarrying, & Extraction | 0 (0.0%) | 0 (0.0%) |
| Construction | 25 (100.0%) | 0 (0.0%) |
| Manufacturing | 0 (0.0%) | 0 (0.0%) |
| Wholesale Trade | 0 (0.0%) | 0 (0.0%) |
| Retail Trade | 0 (0.0%) | 73 (100.0%) |
| Transportation & Warehousing | 0 (0.0%) | 0 (0.0%) |
| Utilities | 0 (0.0%) | 0 (0.0%) |
| Information | 0 (0.0%) | 0 (0.0%) |
| Finance & Insurance | 0 (0.0%) | 0 (0.0%) |
| Real Estate, Rental & Leasing | 27 (100.0%) | 0 (0.0%) |
| Professional & Scientific | 0 (0.0%) | 0 (0.0%) |
| Enterprise Management | 0 (0.0%) | 0 (0.0%) |
| Administrative & Support | 3 (33.3%) | 6 (66.7%) |
| Educational Services | 0 (0.0%) | 0 (0.0%) |
| Health Care & Social Assistance | 0 (0.0%) | 5 (100.0%) |
| Arts, Entertainment & Recreation | 0 (0.0%) | 0 (0.0%) |
| Accommodation & Food Services | 0 (0.0%) | 0 (0.0%) |
| Public Administration | 2 (66.7%) | 1 (33.3%) |
| Total | 57 (40.1%) | 85 (59.9%) |
Education in Homestead Base
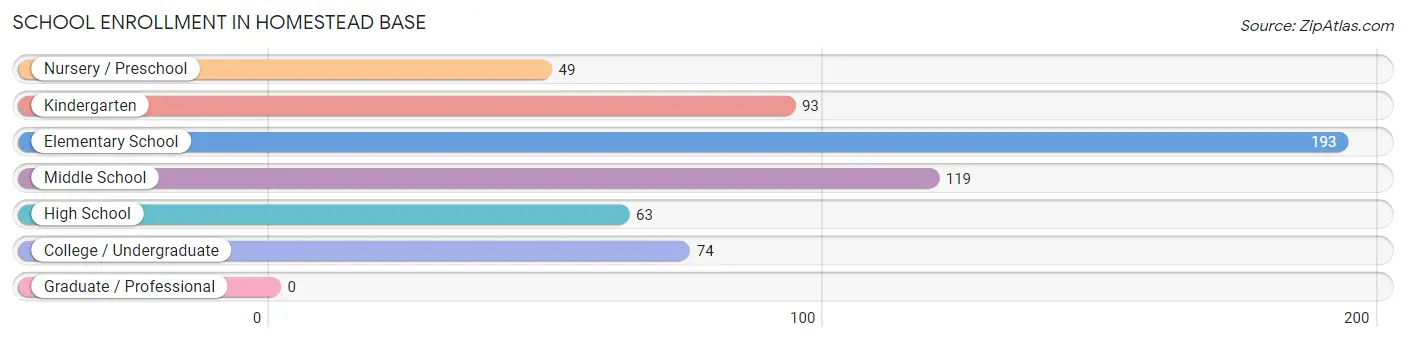
School Enrollment in Homestead Base
The most common levels of schooling among the 591 students in Homestead Base are elementary school (193 | 32.7%), middle school (119 | 20.1%), and kindergarten (93 | 15.7%).
| School Level | # Students | % Students |
| Nursery / Preschool | 49 | 8.3% |
| Kindergarten | 93 | 15.7% |
| Elementary School | 193 | 32.7% |
| Middle School | 119 | 20.1% |
| High School | 63 | 10.7% |
| College / Undergraduate | 74 | 12.5% |
| Graduate / Professional | 0 | 0.0% |
| Total | 591 | 100.0% |
School Enrollment by Age by Funding Source in Homestead Base
Out of a total of 591 students who are enrolled in schools in Homestead Base, 54 (9.1%) attend a private institution, while the remaining 537 (90.9%) are enrolled in public schools. The age group of 18 to 19 year olds has the highest likelihood of being enrolled in private schools, with 22 (56.4% in the age bracket) enrolled. Conversely, the age group of 5 to 9 year old has the lowest likelihood of being enrolled in a private school, with 263 (100.0% in the age bracket) attending a public institution.
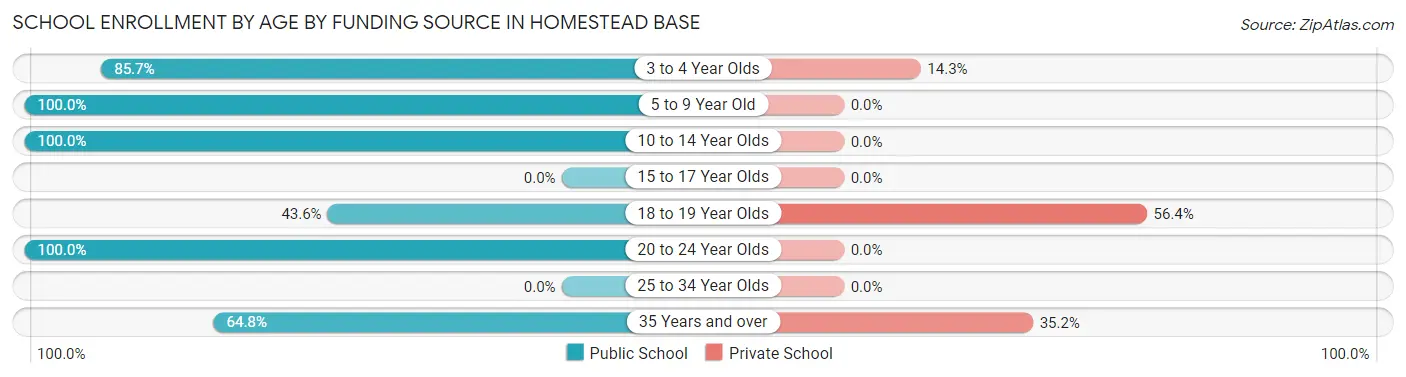
| Age Bracket | Public School | Private School |
| 3 to 4 Year Olds | 42 (85.7%) | 7 (14.3%) |
| 5 to 9 Year Old | 263 (100.0%) | 0 (0.0%) |
| 10 to 14 Year Olds | 121 (100.0%) | 0 (0.0%) |
| 15 to 17 Year Olds | 0 (0.0%) | 0 (0.0%) |
| 18 to 19 Year Olds | 17 (43.6%) | 22 (56.4%) |
| 20 to 24 Year Olds | 48 (100.0%) | 0 (0.0%) |
| 25 to 34 Year Olds | 0 (0.0%) | 0 (0.0%) |
| 35 Years and over | 46 (64.8%) | 25 (35.2%) |
| Total | 537 (90.9%) | 54 (9.1%) |
Educational Attainment by Field of Study in Homestead Base
Business (22 | 81.5%), and physical & health sciences (5 | 18.5%) are the most common fields of study among 27 individuals in Homestead Base who have obtained a bachelor's degree or higher.
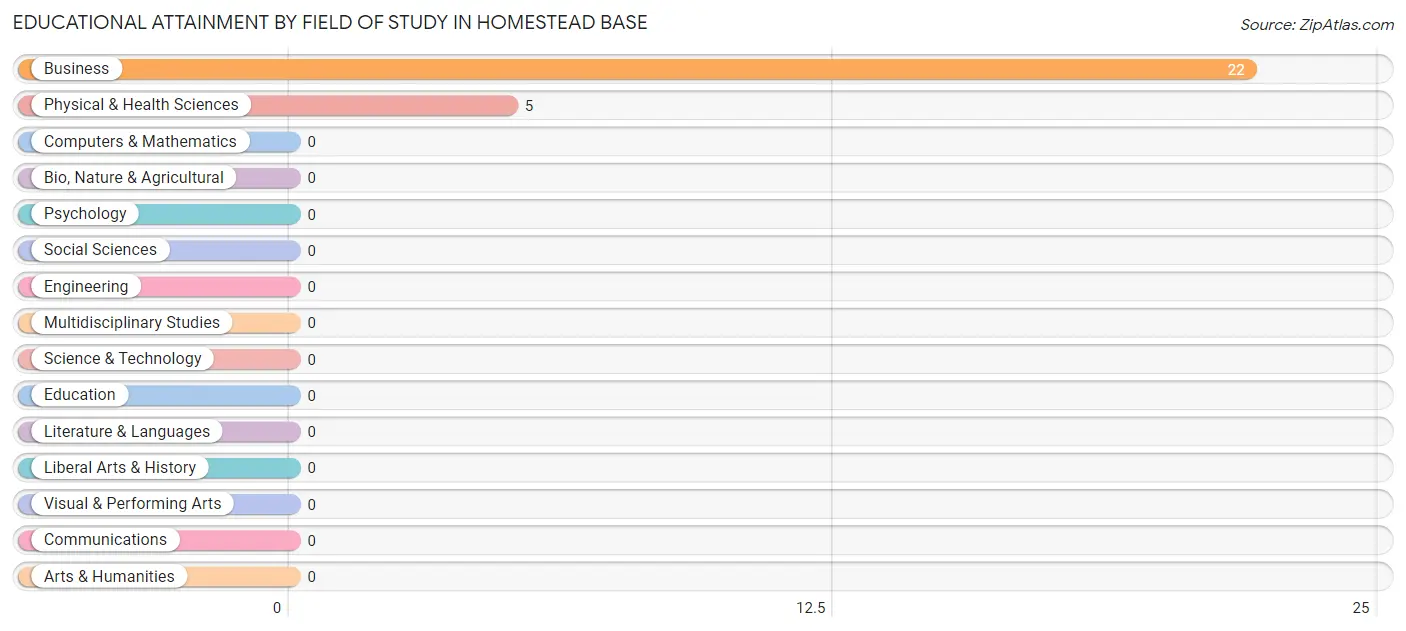
| Field of Study | # Graduates | % Graduates |
| Computers & Mathematics | 0 | 0.0% |
| Bio, Nature & Agricultural | 0 | 0.0% |
| Physical & Health Sciences | 5 | 18.5% |
| Psychology | 0 | 0.0% |
| Social Sciences | 0 | 0.0% |
| Engineering | 0 | 0.0% |
| Multidisciplinary Studies | 0 | 0.0% |
| Science & Technology | 0 | 0.0% |
| Business | 22 | 81.5% |
| Education | 0 | 0.0% |
| Literature & Languages | 0 | 0.0% |
| Liberal Arts & History | 0 | 0.0% |
| Visual & Performing Arts | 0 | 0.0% |
| Communications | 0 | 0.0% |
| Arts & Humanities | 0 | 0.0% |
| Total | 27 | 100.0% |
Transportation & Commute in Homestead Base
Vehicle Availability by Sex in Homestead Base
The most prevalent vehicle ownership categories in Homestead Base are males with 2 vehicles (52, accounting for 100.0%) and females with 2 vehicles (23, making up 115.6%).
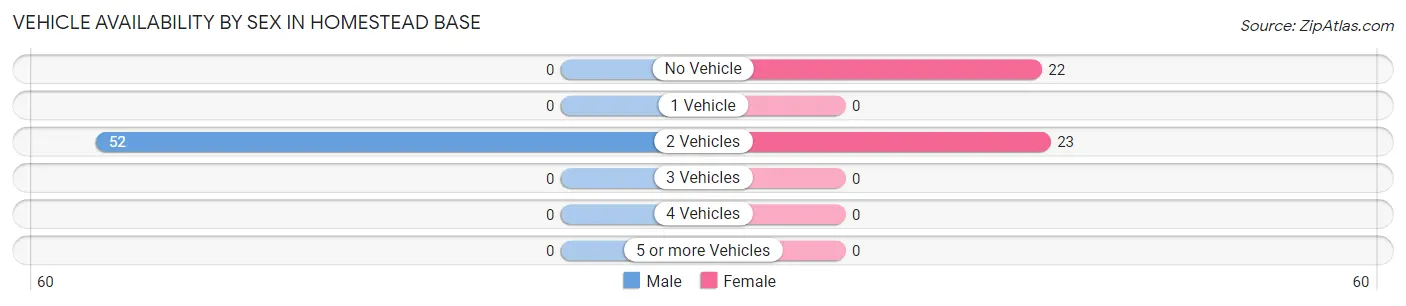
| Vehicles Available | Male | Female |
| No Vehicle | 0 (0.0%) | 22 (48.9%) |
| 1 Vehicle | 0 (0.0%) | 0 (0.0%) |
| 2 Vehicles | 52 (100.0%) | 23 (51.1%) |
| 3 Vehicles | 0 (0.0%) | 0 (0.0%) |
| 4 Vehicles | 0 (0.0%) | 0 (0.0%) |
| 5 or more Vehicles | 0 (0.0%) | 0 (0.0%) |
| Total | 52 (100.0%) | 45 (100.0%) |
Commute Time in Homestead Base
The most frequently occuring commute durations in Homestead Base are 60 to 89 minutes (32 commuters, 22.7%), 5 to 9 minutes (28 commuters, 19.9%), and 15 to 19 minutes (25 commuters, 17.7%).
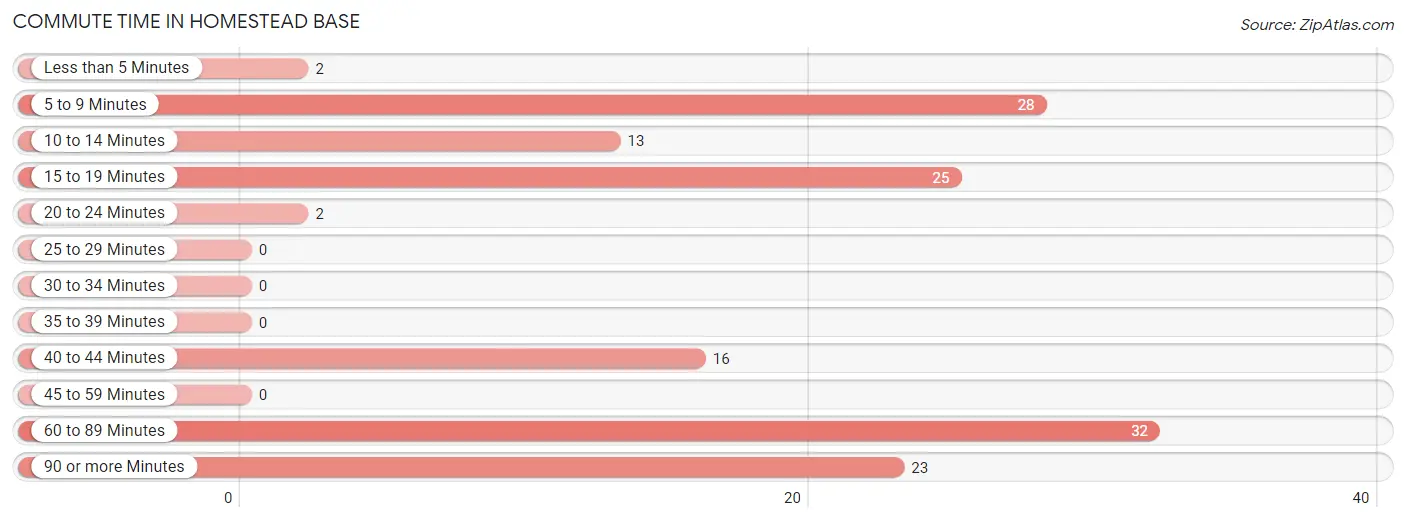
| Commute Time | # Commuters | % Commuters |
| Less than 5 Minutes | 2 | 1.4% |
| 5 to 9 Minutes | 28 | 19.9% |
| 10 to 14 Minutes | 13 | 9.2% |
| 15 to 19 Minutes | 25 | 17.7% |
| 20 to 24 Minutes | 2 | 1.4% |
| 25 to 29 Minutes | 0 | 0.0% |
| 30 to 34 Minutes | 0 | 0.0% |
| 35 to 39 Minutes | 0 | 0.0% |
| 40 to 44 Minutes | 16 | 11.4% |
| 45 to 59 Minutes | 0 | 0.0% |
| 60 to 89 Minutes | 32 | 22.7% |
| 90 or more Minutes | 23 | 16.3% |
Commute Time by Sex in Homestead Base
The most common commute times in Homestead Base are 5 to 9 minutes (28 commuters, 45.9%) for males and 60 to 89 minutes (29 commuters, 36.2%) for females.
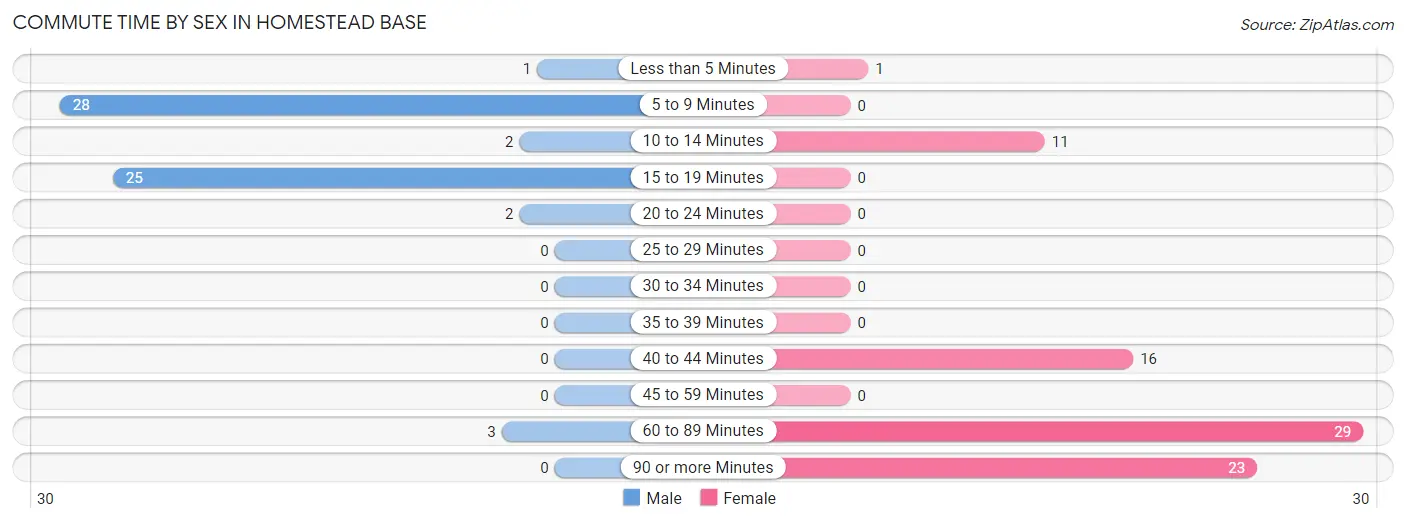
| Commute Time | Male | Female |
| Less than 5 Minutes | 1 (1.6%) | 1 (1.3%) |
| 5 to 9 Minutes | 28 (45.9%) | 0 (0.0%) |
| 10 to 14 Minutes | 2 (3.3%) | 11 (13.8%) |
| 15 to 19 Minutes | 25 (41.0%) | 0 (0.0%) |
| 20 to 24 Minutes | 2 (3.3%) | 0 (0.0%) |
| 25 to 29 Minutes | 0 (0.0%) | 0 (0.0%) |
| 30 to 34 Minutes | 0 (0.0%) | 0 (0.0%) |
| 35 to 39 Minutes | 0 (0.0%) | 0 (0.0%) |
| 40 to 44 Minutes | 0 (0.0%) | 16 (20.0%) |
| 45 to 59 Minutes | 0 (0.0%) | 0 (0.0%) |
| 60 to 89 Minutes | 3 (4.9%) | 29 (36.2%) |
| 90 or more Minutes | 0 (0.0%) | 23 (28.7%) |
Time of Departure to Work by Sex in Homestead Base
The most frequent times of departure to work in Homestead Base are 6:30 AM to 6:59 AM (29, 47.5%) for males and 4:00 PM to 11:59 PM (40, 50.0%) for females.
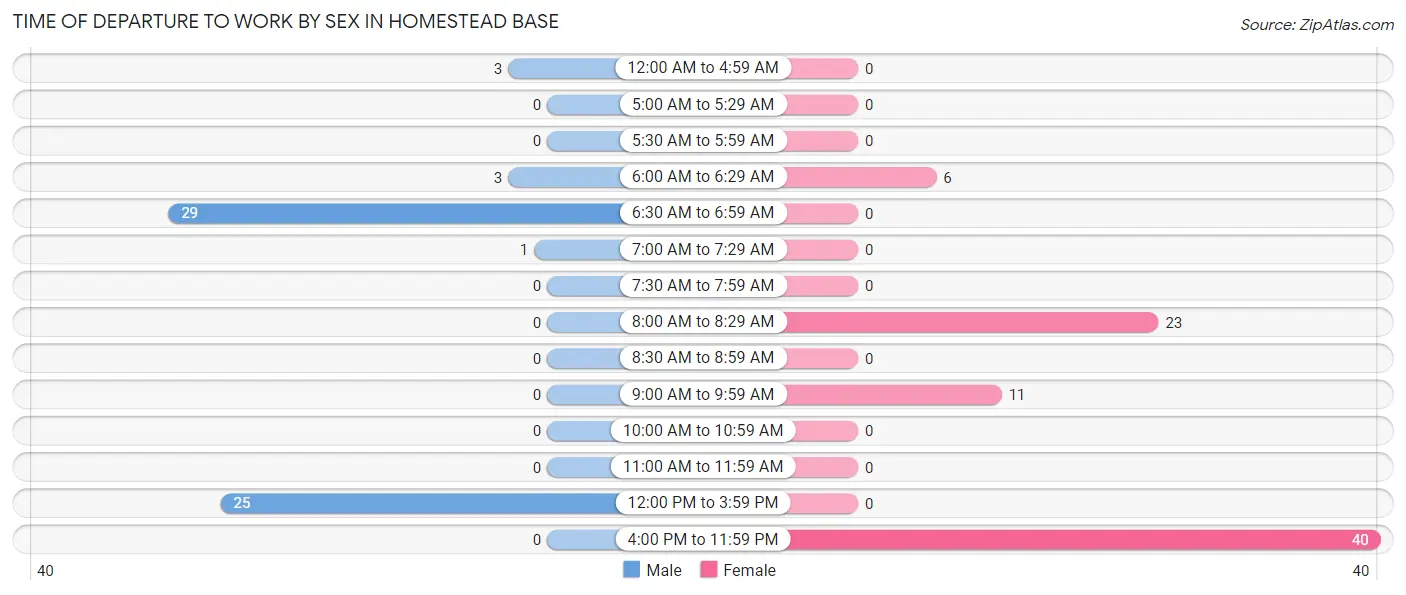
| Time of Departure | Male | Female |
| 12:00 AM to 4:59 AM | 3 (4.9%) | 0 (0.0%) |
| 5:00 AM to 5:29 AM | 0 (0.0%) | 0 (0.0%) |
| 5:30 AM to 5:59 AM | 0 (0.0%) | 0 (0.0%) |
| 6:00 AM to 6:29 AM | 3 (4.9%) | 6 (7.5%) |
| 6:30 AM to 6:59 AM | 29 (47.5%) | 0 (0.0%) |
| 7:00 AM to 7:29 AM | 1 (1.6%) | 0 (0.0%) |
| 7:30 AM to 7:59 AM | 0 (0.0%) | 0 (0.0%) |
| 8:00 AM to 8:29 AM | 0 (0.0%) | 23 (28.7%) |
| 8:30 AM to 8:59 AM | 0 (0.0%) | 0 (0.0%) |
| 9:00 AM to 9:59 AM | 0 (0.0%) | 11 (13.8%) |
| 10:00 AM to 10:59 AM | 0 (0.0%) | 0 (0.0%) |
| 11:00 AM to 11:59 AM | 0 (0.0%) | 0 (0.0%) |
| 12:00 PM to 3:59 PM | 25 (41.0%) | 0 (0.0%) |
| 4:00 PM to 11:59 PM | 0 (0.0%) | 40 (50.0%) |
| Total | 61 (100.0%) | 80 (100.0%) |
Housing Occupancy in Homestead Base
Occupancy by Ownership in Homestead Base
Of the total 210 dwellings in Homestead Base, owner-occupied units account for 0 (0.0%), while renter-occupied units make up 210 (100.0%).
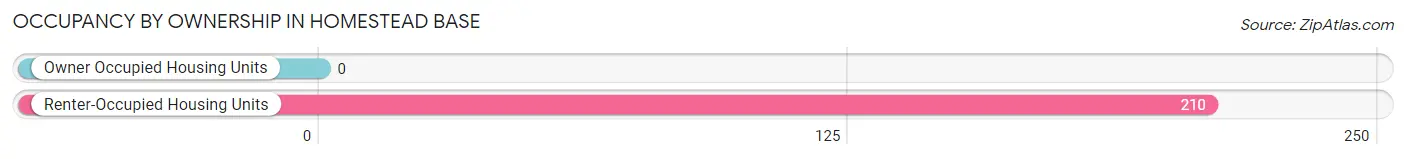
| Occupancy | # Housing Units | % Housing Units |
| Owner Occupied Housing Units | 0 | 0.0% |
| Renter-Occupied Housing Units | 210 | 100.0% |
| Total Occupied Housing Units | 210 | 100.0% |
Occupancy by Household Size in Homestead Base
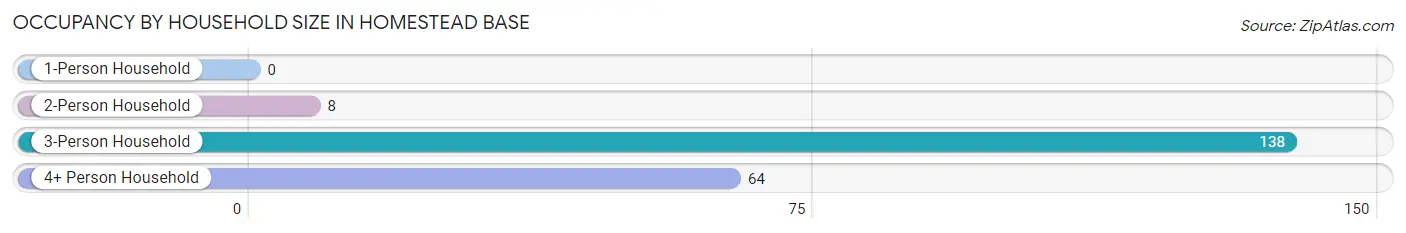
| Household Size | # Housing Units | % Housing Units |
| 1-Person Household | 0 | 0.0% |
| 2-Person Household | 8 | 3.8% |
| 3-Person Household | 138 | 65.7% |
| 4+ Person Household | 64 | 30.5% |
| Total Housing Units | 210 | 100.0% |
Occupancy by Ownership by Household Size in Homestead Base
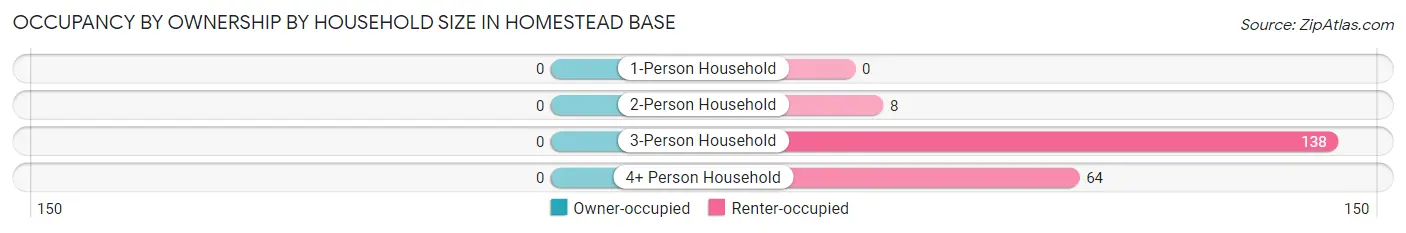
| Household Size | Owner-occupied | Renter-occupied |
| 1-Person Household | 0 (0.0%) | 0 (0.0%) |
| 2-Person Household | 0 (0.0%) | 8 (100.0%) |
| 3-Person Household | 0 (0.0%) | 138 (100.0%) |
| 4+ Person Household | 0 (0.0%) | 64 (100.0%) |
| Total Housing Units | 0 (0.0%) | 210 (100.0%) |
Occupancy by Educational Attainment in Homestead Base
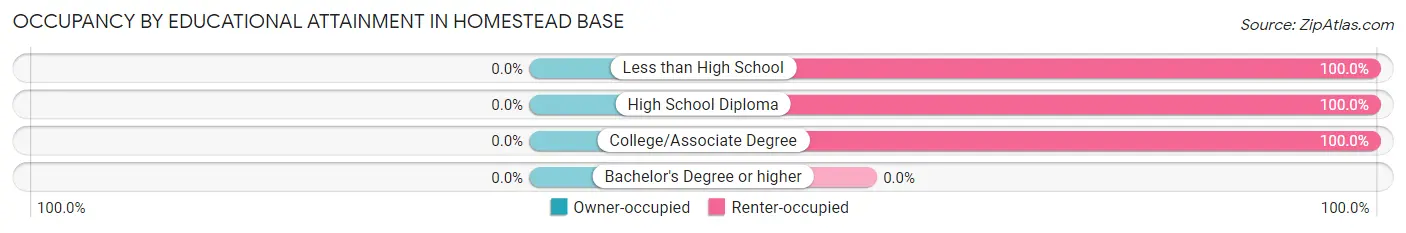
| Household Size | Owner-occupied | Renter-occupied |
| Less than High School | 0 (0.0%) | 106 (100.0%) |
| High School Diploma | 0 (0.0%) | 66 (100.0%) |
| College/Associate Degree | 0 (0.0%) | 38 (100.0%) |
| Bachelor's Degree or higher | 0 (0.0%) | 0 (0.0%) |
Occupancy by Age of Householder in Homestead Base
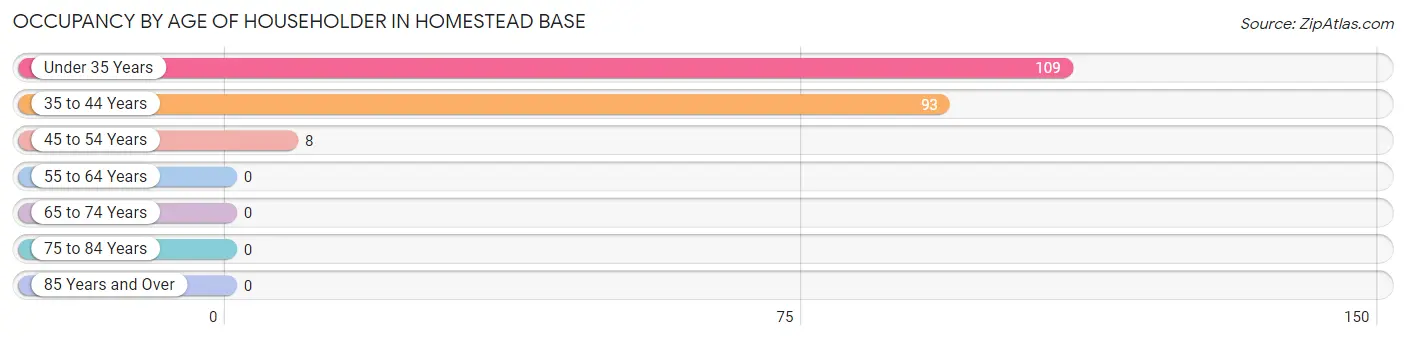
| Age Bracket | # Households | % Households |
| Under 35 Years | 109 | 51.9% |
| 35 to 44 Years | 93 | 44.3% |
| 45 to 54 Years | 8 | 3.8% |
| 55 to 64 Years | 0 | 0.0% |
| 65 to 74 Years | 0 | 0.0% |
| 75 to 84 Years | 0 | 0.0% |
| 85 Years and Over | 0 | 0.0% |
| Total | 210 | 100.0% |
Housing Finances in Homestead Base
Median Income by Occupancy in Homestead Base
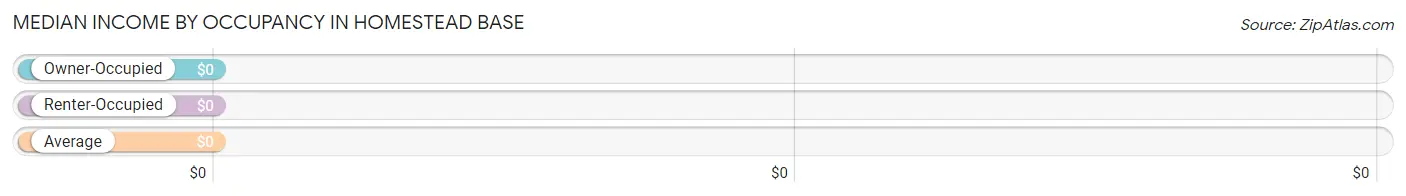
| Occupancy Type | # Households | Median Income |
| Owner-Occupied | 0 (0.0%) | $0 |
| Renter-Occupied | 210 (100.0%) | $0 |
| Average | 210 (100.0%) | $0 |
Occupancy by Householder Income Bracket in Homestead Base
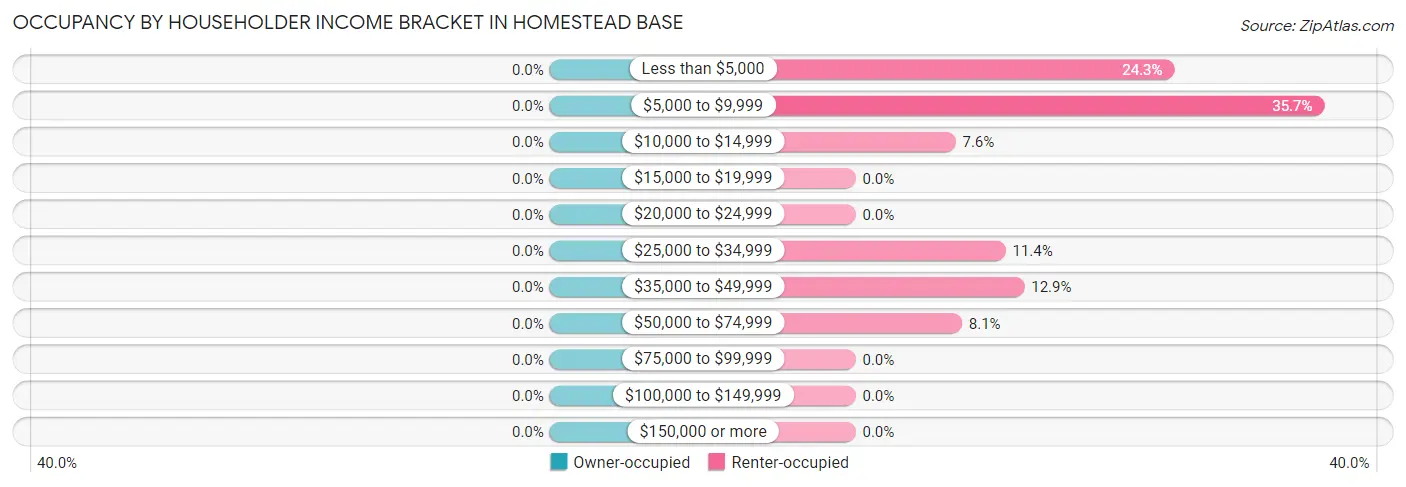
| Income Bracket | Owner-occupied | Renter-occupied |
| Less than $5,000 | 0 (0.0%) | 51 (24.3%) |
| $5,000 to $9,999 | 0 (0.0%) | 75 (35.7%) |
| $10,000 to $14,999 | 0 (0.0%) | 16 (7.6%) |
| $15,000 to $19,999 | 0 (0.0%) | 0 (0.0%) |
| $20,000 to $24,999 | 0 (0.0%) | 0 (0.0%) |
| $25,000 to $34,999 | 0 (0.0%) | 24 (11.4%) |
| $35,000 to $49,999 | 0 (0.0%) | 27 (12.9%) |
| $50,000 to $74,999 | 0 (0.0%) | 17 (8.1%) |
| $75,000 to $99,999 | 0 (0.0%) | 0 (0.0%) |
| $100,000 to $149,999 | 0 (0.0%) | 0 (0.0%) |
| $150,000 or more | 0 (0.0%) | 0 (0.0%) |
| Total | 0 (0.0%) | 210 (100.0%) |
Monthly Housing Cost Tiers in Homestead Base
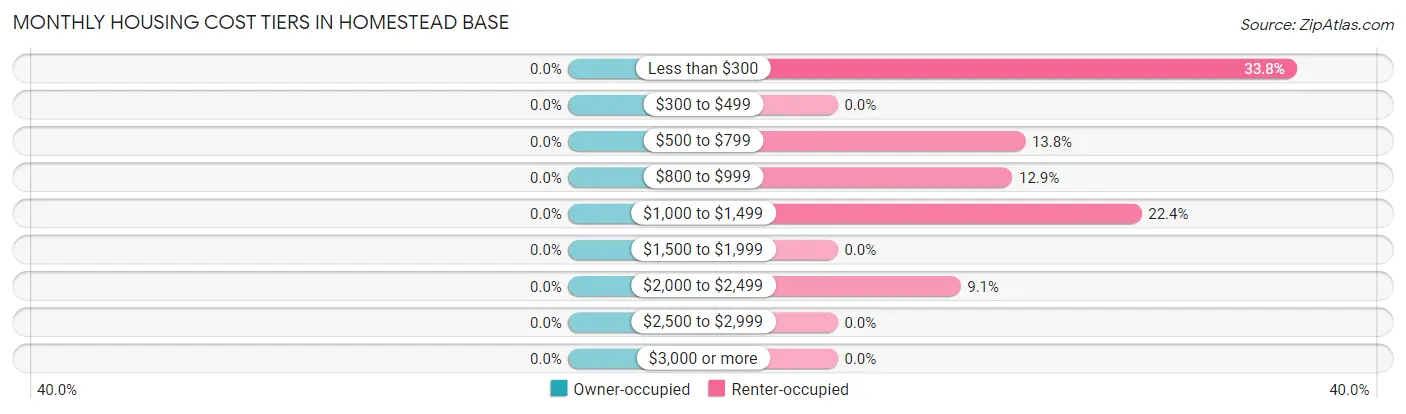
| Monthly Cost | Owner-occupied | Renter-occupied |
| Less than $300 | 0 (0.0%) | 71 (33.8%) |
| $300 to $499 | 0 (0.0%) | 0 (0.0%) |
| $500 to $799 | 0 (0.0%) | 29 (13.8%) |
| $800 to $999 | 0 (0.0%) | 27 (12.9%) |
| $1,000 to $1,499 | 0 (0.0%) | 47 (22.4%) |
| $1,500 to $1,999 | 0 (0.0%) | 0 (0.0%) |
| $2,000 to $2,499 | 0 (0.0%) | 19 (9.0%) |
| $2,500 to $2,999 | 0 (0.0%) | 0 (0.0%) |
| $3,000 or more | 0 (0.0%) | 0 (0.0%) |
| Total | 0 (0.0%) | 210 (100.0%) |
Physical Housing Characteristics in Homestead Base
Housing Structures in Homestead Base
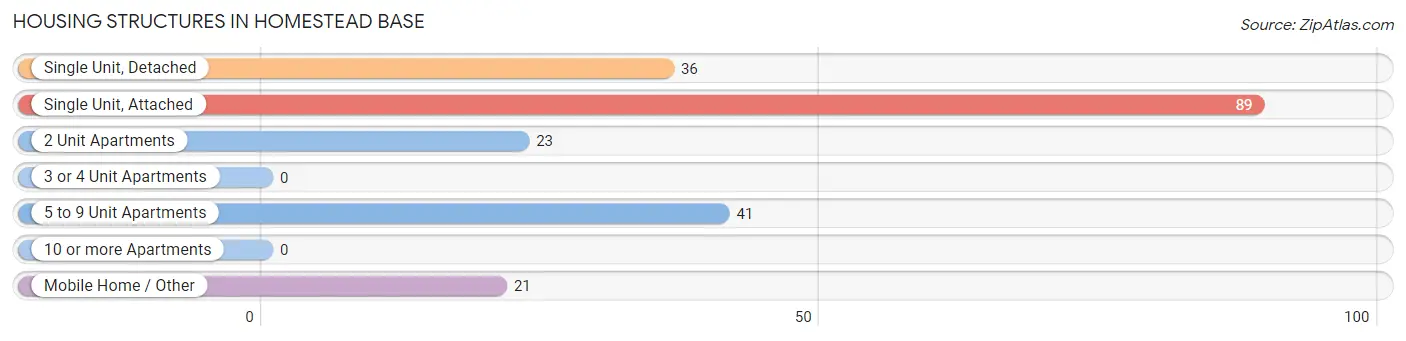
| Structure Type | # Housing Units | % Housing Units |
| Single Unit, Detached | 36 | 17.1% |
| Single Unit, Attached | 89 | 42.4% |
| 2 Unit Apartments | 23 | 11.0% |
| 3 or 4 Unit Apartments | 0 | 0.0% |
| 5 to 9 Unit Apartments | 41 | 19.5% |
| 10 or more Apartments | 0 | 0.0% |
| Mobile Home / Other | 21 | 10.0% |
| Total | 210 | 100.0% |
Housing Structures by Occupancy in Homestead Base
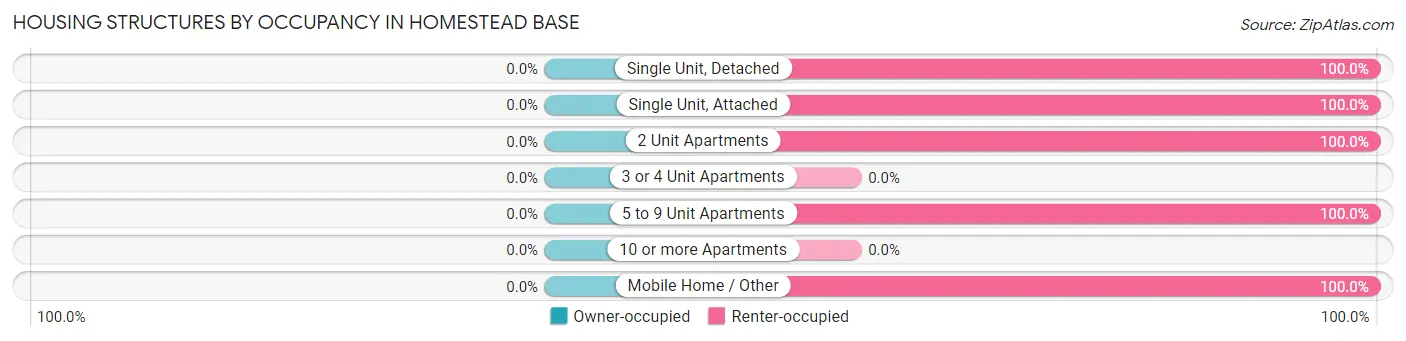
| Structure Type | Owner-occupied | Renter-occupied |
| Single Unit, Detached | 0 (0.0%) | 36 (100.0%) |
| Single Unit, Attached | 0 (0.0%) | 89 (100.0%) |
| 2 Unit Apartments | 0 (0.0%) | 23 (100.0%) |
| 3 or 4 Unit Apartments | 0 (0.0%) | 0 (0.0%) |
| 5 to 9 Unit Apartments | 0 (0.0%) | 41 (100.0%) |
| 10 or more Apartments | 0 (0.0%) | 0 (0.0%) |
| Mobile Home / Other | 0 (0.0%) | 21 (100.0%) |
| Total | 0 (0.0%) | 210 (100.0%) |
Housing Structures by Number of Rooms in Homestead Base
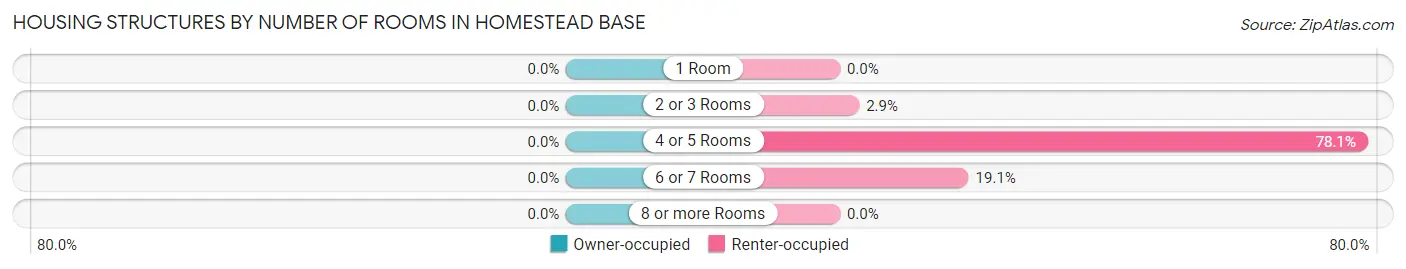
| Number of Rooms | Owner-occupied | Renter-occupied |
| 1 Room | 0 (0.0%) | 0 (0.0%) |
| 2 or 3 Rooms | 0 (0.0%) | 6 (2.9%) |
| 4 or 5 Rooms | 0 (0.0%) | 164 (78.1%) |
| 6 or 7 Rooms | 0 (0.0%) | 40 (19.1%) |
| 8 or more Rooms | 0 (0.0%) | 0 (0.0%) |
| Total | 0 (0.0%) | 210 (100.0%) |
Housing Structure by Heating Type in Homestead Base
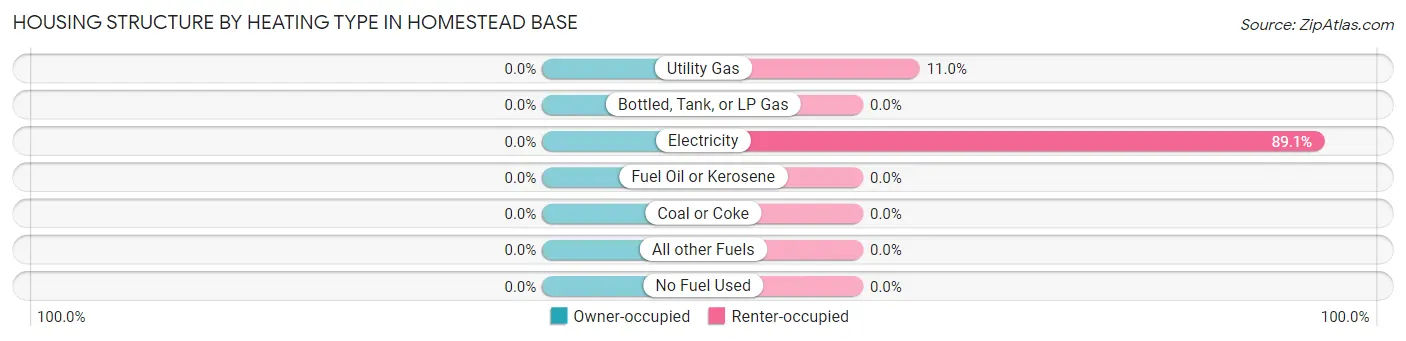
| Heating Type | Owner-occupied | Renter-occupied |
| Utility Gas | 0 (0.0%) | 23 (11.0%) |
| Bottled, Tank, or LP Gas | 0 (0.0%) | 0 (0.0%) |
| Electricity | 0 (0.0%) | 187 (89.0%) |
| Fuel Oil or Kerosene | 0 (0.0%) | 0 (0.0%) |
| Coal or Coke | 0 (0.0%) | 0 (0.0%) |
| All other Fuels | 0 (0.0%) | 0 (0.0%) |
| No Fuel Used | 0 (0.0%) | 0 (0.0%) |
| Total | 0 (0.0%) | 210 (100.0%) |
Household Vehicle Usage in Homestead Base
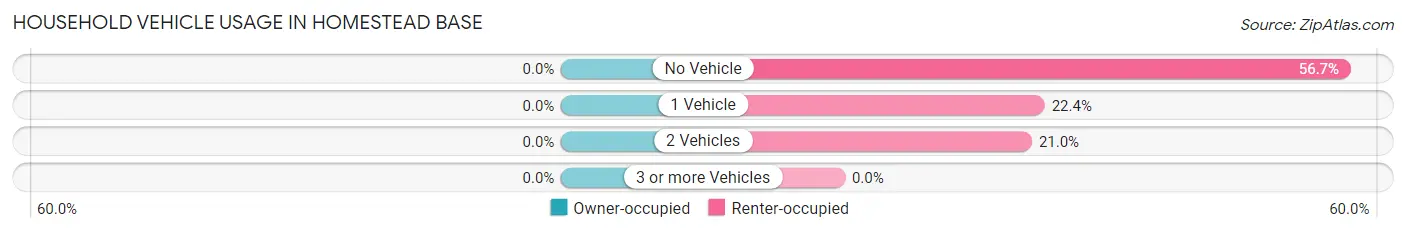
| Vehicles per Household | Owner-occupied | Renter-occupied |
| No Vehicle | 0 (0.0%) | 119 (56.7%) |
| 1 Vehicle | 0 (0.0%) | 47 (22.4%) |
| 2 Vehicles | 0 (0.0%) | 44 (20.9%) |
| 3 or more Vehicles | 0 (0.0%) | 0 (0.0%) |
| Total | 0 (0.0%) | 210 (100.0%) |
Real Estate & Mortgages in Homestead Base
Real Estate and Mortgage Overview in Homestead Base
| Characteristic | Without Mortgage | With Mortgage |
| Housing Units | 0 | 0 |
| Median Property Value | - | - |
| Median Household Income | - | - |
| Monthly Housing Costs | - | - |
| Real Estate Taxes | - | - |
Property Value by Mortgage Status in Homestead Base
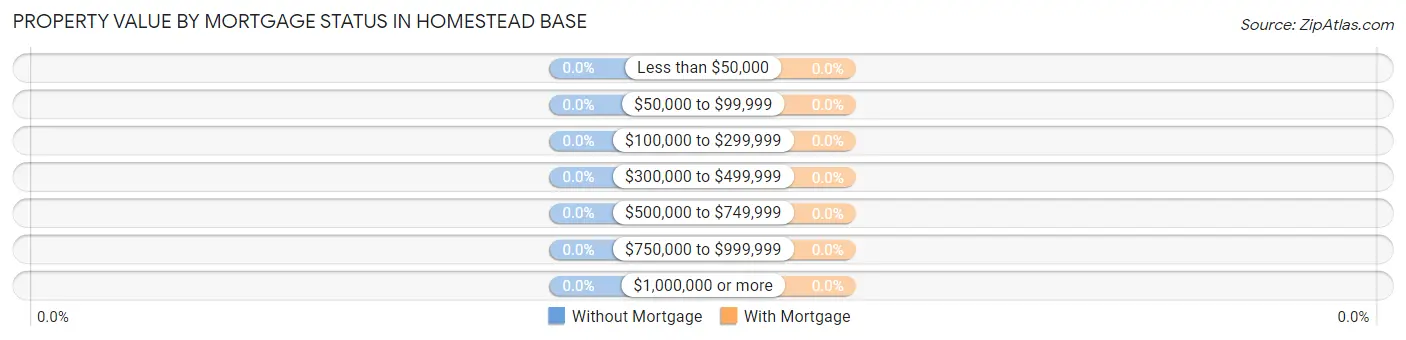
| Property Value | Without Mortgage | With Mortgage |
| Less than $50,000 | 0 (0.0%) | 0 (0.0%) |
| $50,000 to $99,999 | 0 (0.0%) | 0 (0.0%) |
| $100,000 to $299,999 | 0 (0.0%) | 0 (0.0%) |
| $300,000 to $499,999 | 0 (0.0%) | 0 (0.0%) |
| $500,000 to $749,999 | 0 (0.0%) | 0 (0.0%) |
| $750,000 to $999,999 | 0 (0.0%) | 0 (0.0%) |
| $1,000,000 or more | 0 (0.0%) | 0 (0.0%) |
| Total | 0 (0.0%) | 0 (0.0%) |
Household Income by Mortgage Status in Homestead Base
| Household Income | Without Mortgage | With Mortgage |
| Less than $10,000 | 0 (0.0%) | 0 (0.0%) |
| $10,000 to $24,999 | 0 (0.0%) | 0 (0.0%) |
| $25,000 to $34,999 | 0 (0.0%) | 0 (0.0%) |
| $35,000 to $49,999 | 0 (0.0%) | 0 (0.0%) |
| $50,000 to $74,999 | 0 (0.0%) | 0 (0.0%) |
| $75,000 to $99,999 | 0 (0.0%) | 0 (0.0%) |
| $100,000 to $149,999 | 0 (0.0%) | 0 (0.0%) |
| $150,000 or more | 0 (0.0%) | 0 (0.0%) |
| Total | 0 (0.0%) | 0 (0.0%) |
Property Value to Household Income Ratio in Homestead Base
| Value-to-Income Ratio | Without Mortgage | With Mortgage |
| Less than 2.0x | 0 (0.0%) | 0 (0.0%) |
| 2.0x to 2.9x | 0 (0.0%) | 0 (0.0%) |
| 3.0x to 3.9x | 0 (0.0%) | 0 (0.0%) |
| 4.0x or more | 0 (0.0%) | 0 (0.0%) |
| Total | 0 (0.0%) | 0 (0.0%) |
Real Estate Taxes by Mortgage Status in Homestead Base
| Property Taxes | Without Mortgage | With Mortgage |
| Less than $800 | 0 (0.0%) | 0 (0.0%) |
| $800 to $1,499 | 0 (0.0%) | 0 (0.0%) |
| $800 to $1,499 | 0 (0.0%) | 0 (0.0%) |
| Total | 0 (0.0%) | 0 (0.0%) |
Health & Disability in Homestead Base
Health Insurance Coverage by Age in Homestead Base
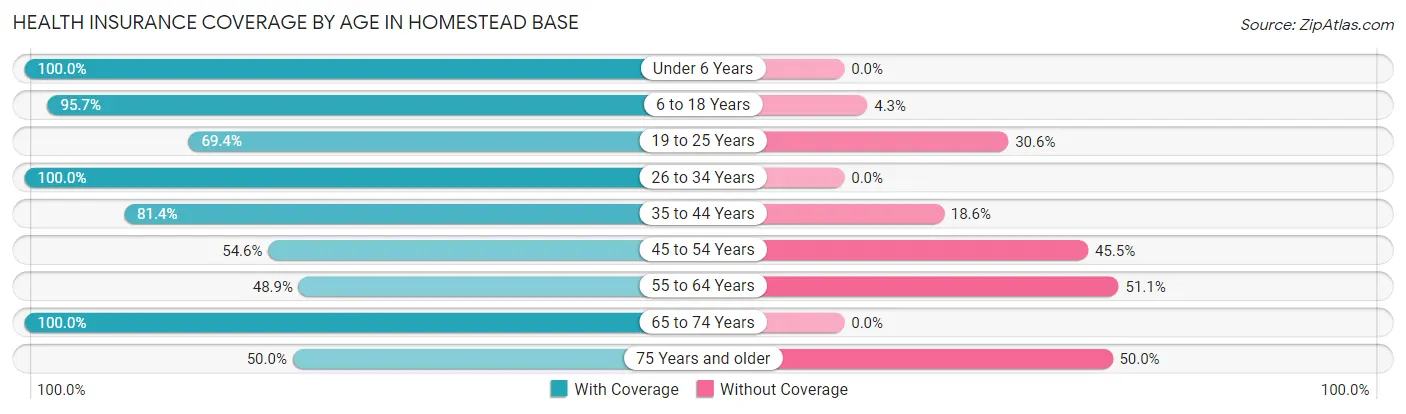
| Age Bracket | With Coverage | Without Coverage |
| Under 6 Years | 176 (100.0%) | 0 (0.0%) |
| 6 to 18 Years | 379 (95.7%) | 17 (4.3%) |
| 19 to 25 Years | 109 (69.4%) | 48 (30.6%) |
| 26 to 34 Years | 124 (100.0%) | 0 (0.0%) |
| 35 to 44 Years | 136 (81.4%) | 31 (18.6%) |
| 45 to 54 Years | 30 (54.5%) | 25 (45.5%) |
| 55 to 64 Years | 43 (48.9%) | 45 (51.1%) |
| 65 to 74 Years | 23 (100.0%) | 0 (0.0%) |
| 75 Years and older | 22 (50.0%) | 22 (50.0%) |
| Total | 1,042 (84.7%) | 188 (15.3%) |
Health Insurance Coverage by Citizenship Status in Homestead Base
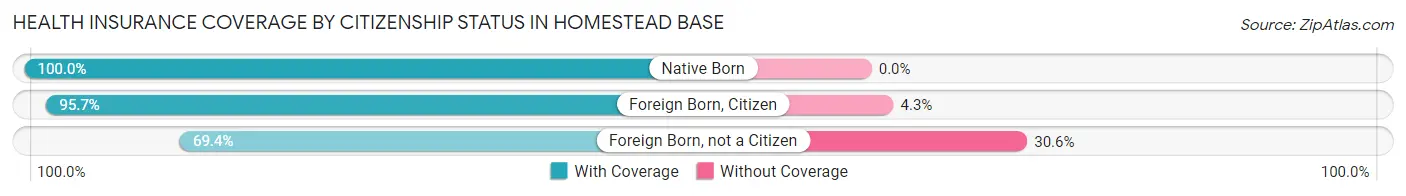
| Citizenship Status | With Coverage | Without Coverage |
| Native Born | 176 (100.0%) | 0 (0.0%) |
| Foreign Born, Citizen | 379 (95.7%) | 17 (4.3%) |
| Foreign Born, not a Citizen | 109 (69.4%) | 48 (30.6%) |
Health Insurance Coverage by Household Income in Homestead Base
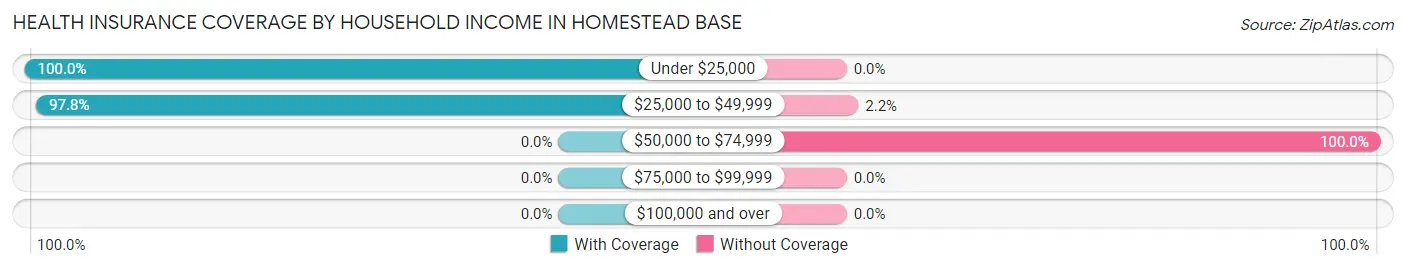
| Household Income | With Coverage | Without Coverage |
| Under $25,000 | 559 (100.0%) | 0 (0.0%) |
| $25,000 to $49,999 | 226 (97.8%) | 5 (2.2%) |
| $50,000 to $74,999 | 0 (0.0%) | 83 (100.0%) |
| $75,000 to $99,999 | 0 (0.0%) | 0 (0.0%) |
| $100,000 and over | 0 (0.0%) | 0 (0.0%) |
Public vs Private Health Insurance Coverage by Age in Homestead Base
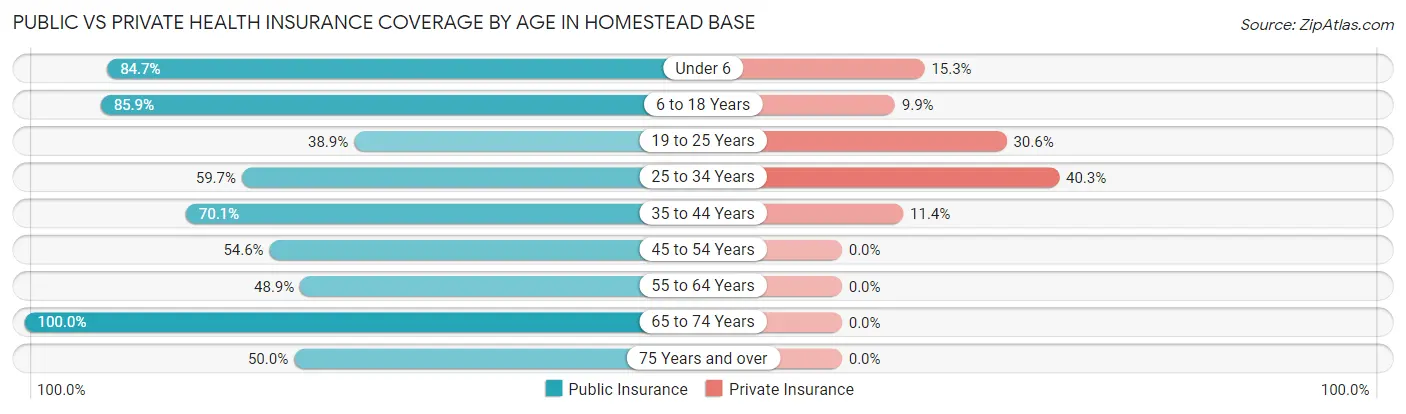
| Age Bracket | Public Insurance | Private Insurance |
| Under 6 | 149 (84.7%) | 27 (15.3%) |
| 6 to 18 Years | 340 (85.9%) | 39 (9.9%) |
| 19 to 25 Years | 61 (38.9%) | 48 (30.6%) |
| 25 to 34 Years | 74 (59.7%) | 50 (40.3%) |
| 35 to 44 Years | 117 (70.1%) | 19 (11.4%) |
| 45 to 54 Years | 30 (54.5%) | 0 (0.0%) |
| 55 to 64 Years | 43 (48.9%) | 0 (0.0%) |
| 65 to 74 Years | 23 (100.0%) | 0 (0.0%) |
| 75 Years and over | 22 (50.0%) | 0 (0.0%) |
| Total | 859 (69.8%) | 183 (14.9%) |
Disability Status by Sex by Age in Homestead Base
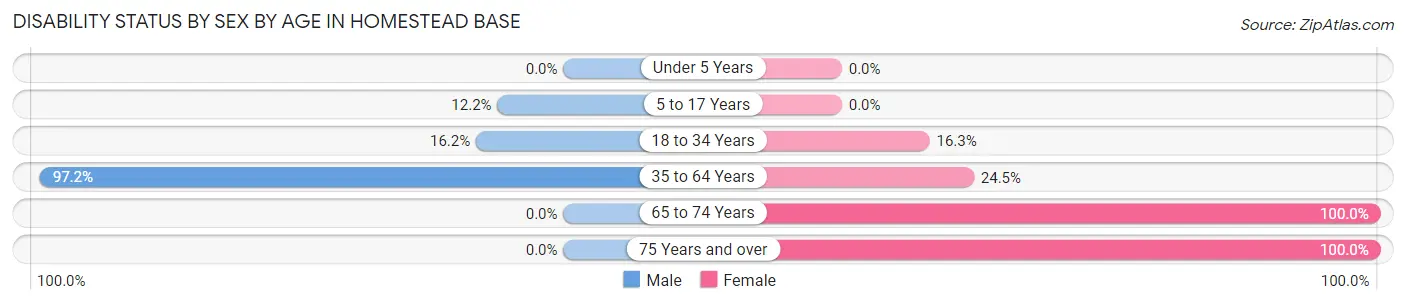
| Age Bracket | Male | Female |
| Under 5 Years | 0 (0.0%) | 0 (0.0%) |
| 5 to 17 Years | 18 (12.2%) | 0 (0.0%) |
| 18 to 34 Years | 23 (16.2%) | 29 (16.3%) |
| 35 to 64 Years | 103 (97.2%) | 50 (24.5%) |
| 65 to 74 Years | 0 (0.0%) | 23 (100.0%) |
| 75 Years and over | 0 (0.0%) | 33 (100.0%) |
Disability Class by Sex by Age in Homestead Base
Disability Class: Hearing Difficulty
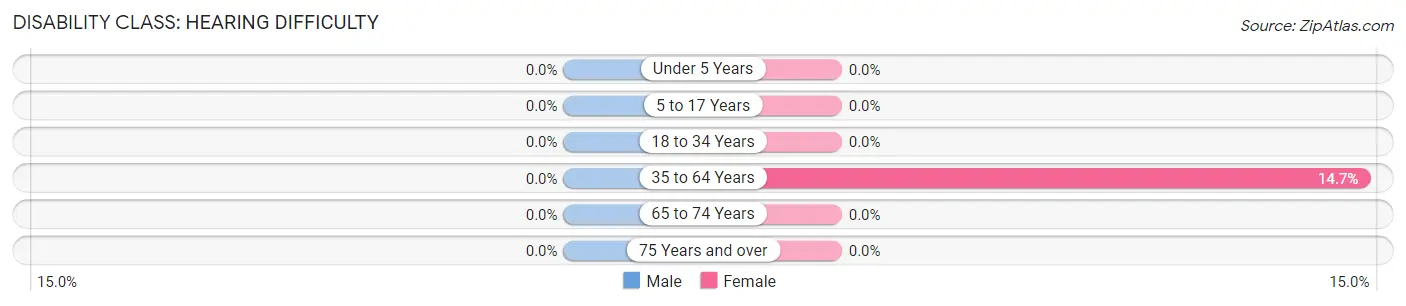
| Age Bracket | Male | Female |
| Under 5 Years | 0 (0.0%) | 0 (0.0%) |
| 5 to 17 Years | 0 (0.0%) | 0 (0.0%) |
| 18 to 34 Years | 0 (0.0%) | 0 (0.0%) |
| 35 to 64 Years | 0 (0.0%) | 30 (14.7%) |
| 65 to 74 Years | 0 (0.0%) | 0 (0.0%) |
| 75 Years and over | 0 (0.0%) | 0 (0.0%) |
Disability Class: Vision Difficulty
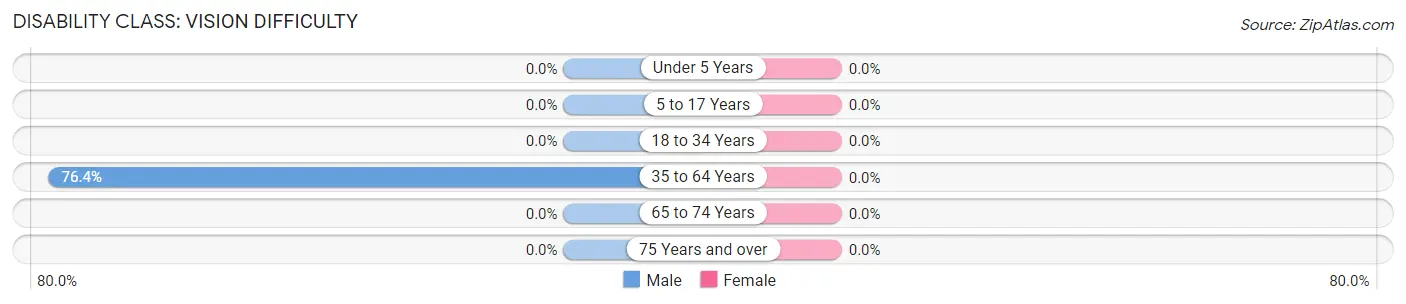
| Age Bracket | Male | Female |
| Under 5 Years | 0 (0.0%) | 0 (0.0%) |
| 5 to 17 Years | 0 (0.0%) | 0 (0.0%) |
| 18 to 34 Years | 0 (0.0%) | 0 (0.0%) |
| 35 to 64 Years | 81 (76.4%) | 0 (0.0%) |
| 65 to 74 Years | 0 (0.0%) | 0 (0.0%) |
| 75 Years and over | 0 (0.0%) | 0 (0.0%) |
Disability Class: Cognitive Difficulty
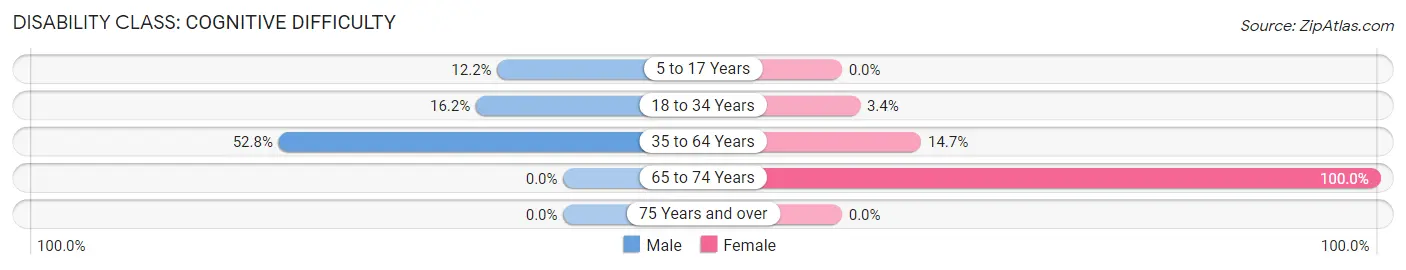
| Age Bracket | Male | Female |
| 5 to 17 Years | 18 (12.2%) | 0 (0.0%) |
| 18 to 34 Years | 23 (16.2%) | 6 (3.4%) |
| 35 to 64 Years | 56 (52.8%) | 30 (14.7%) |
| 65 to 74 Years | 0 (0.0%) | 23 (100.0%) |
| 75 Years and over | 0 (0.0%) | 0 (0.0%) |
Disability Class: Ambulatory Difficulty
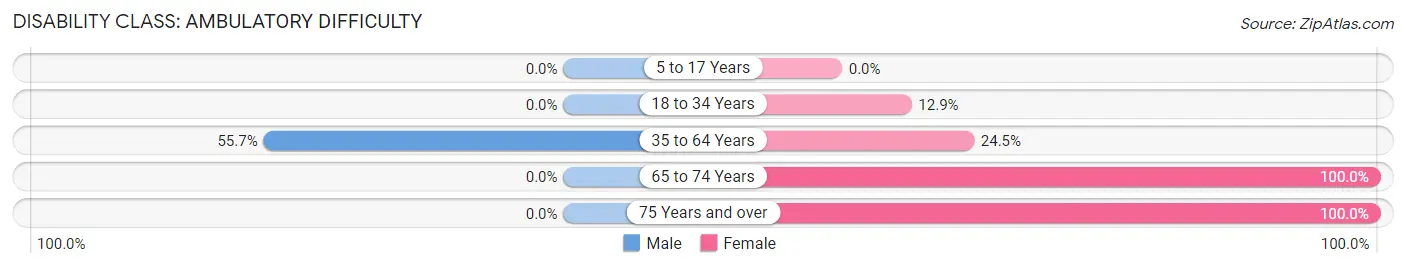
| Age Bracket | Male | Female |
| 5 to 17 Years | 0 (0.0%) | 0 (0.0%) |
| 18 to 34 Years | 0 (0.0%) | 23 (12.9%) |
| 35 to 64 Years | 59 (55.7%) | 50 (24.5%) |
| 65 to 74 Years | 0 (0.0%) | 23 (100.0%) |
| 75 Years and over | 0 (0.0%) | 33 (100.0%) |
Disability Class: Self-Care Difficulty
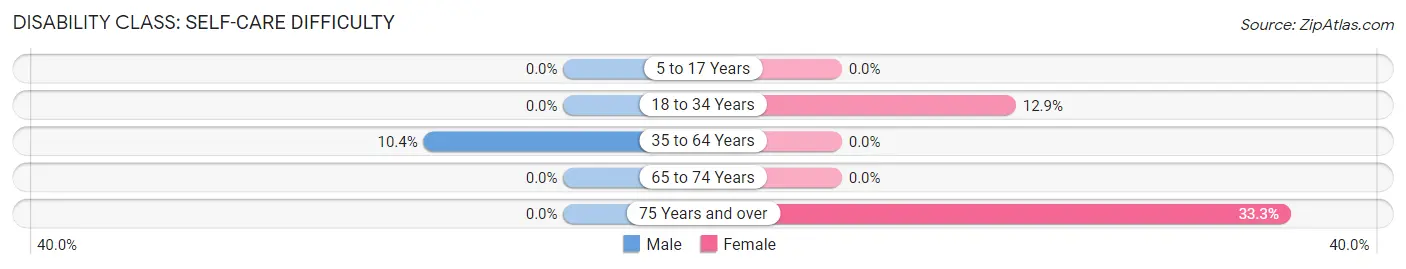
| Age Bracket | Male | Female |
| 5 to 17 Years | 0 (0.0%) | 0 (0.0%) |
| 18 to 34 Years | 0 (0.0%) | 23 (12.9%) |
| 35 to 64 Years | 11 (10.4%) | 0 (0.0%) |
| 65 to 74 Years | 0 (0.0%) | 0 (0.0%) |
| 75 Years and over | 0 (0.0%) | 11 (33.3%) |
Technology Access in Homestead Base
Computing Device Access in Homestead Base
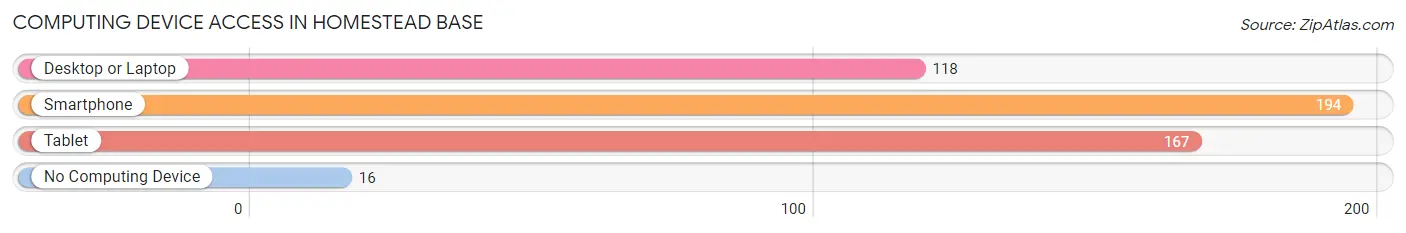
| Device Type | # Households | % Households |
| Desktop or Laptop | 118 | 56.2% |
| Smartphone | 194 | 92.4% |
| Tablet | 167 | 79.5% |
| No Computing Device | 16 | 7.6% |
| Total | 210 | 100.0% |
Internet Access in Homestead Base
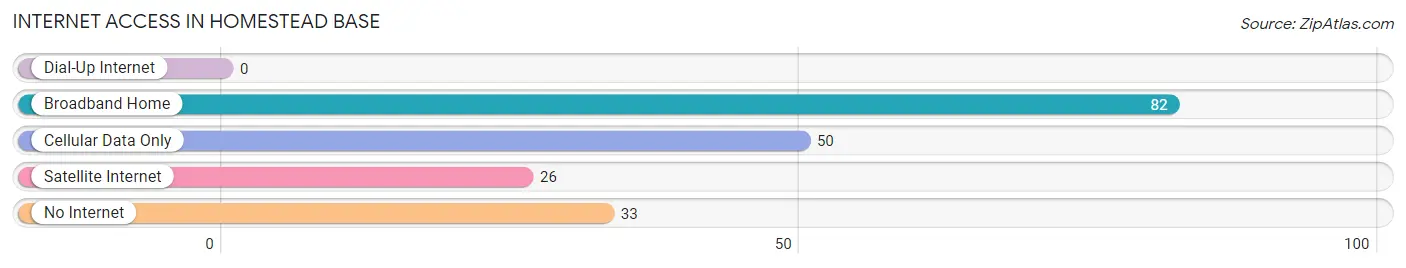
| Internet Type | # Households | % Households |
| Dial-Up Internet | 0 | 0.0% |
| Broadband Home | 82 | 39.1% |
| Cellular Data Only | 50 | 23.8% |
| Satellite Internet | 26 | 12.4% |
| No Internet | 33 | 15.7% |
| Total | 210 | 100.0% |
Homestead Base Summary
Homestead Base, Florida is a small town located in Miami-Dade County, Florida. It is situated on the southern tip of the Florida peninsula, just south of Miami. The town is home to a population of approximately 8,000 people, and is part of the larger Miami metropolitan area.
History
Homestead Base was originally inhabited by the Tequesta Indians, who were the first known inhabitants of the area. The Tequesta Indians were a peaceful tribe that lived in the area for centuries before the arrival of Europeans. The first Europeans to settle in the area were Spanish explorers, who arrived in the late 1500s. The Spanish established a mission in the area, which was later abandoned.
In the late 1800s, the area was settled by homesteaders, who established farms and ranches in the area. The town was officially founded in 1891, and was named after the homesteaders who settled the area.
In the early 1900s, the town began to grow and develop. The Florida East Coast Railway was built through the town, and the Homestead Air Force Base was established in 1942. The base was used during World War II and the Korean War, and was later closed in the early 1990s.
Geography
Homestead Base is located in Miami-Dade County, Florida. It is situated on the southern tip of the Florida peninsula, just south of Miami. The town is located on the Atlantic Coast, and is bordered by the Everglades National Park to the west. The town is located at an elevation of 10 feet above sea level.
The town has a total area of 4.2 square miles, of which 0.2 square miles is water. The town is located in a tropical climate, with hot and humid summers and mild winters. The average temperature in the summer is around 90 degrees Fahrenheit, and the average temperature in the winter is around 70 degrees Fahrenheit.
Economy
The economy of Homestead Base is largely based on tourism and agriculture. The town is home to several tourist attractions, including the Homestead Air Force Base Museum, the Everglades National Park, and the Homestead Speedway. The town is also home to several agricultural businesses, including nurseries, farms, and ranches.
The town is also home to several manufacturing businesses, including a paper mill and a metal fabrication plant. The town is also home to several retail businesses, including restaurants, grocery stores, and clothing stores.
Demographics
As of the 2010 census, the population of Homestead Base was 8,000. The racial makeup of the town was 79.3% White, 11.2% African American, 0.3% Native American, 0.7% Asian, and 8.5% from other races. The median household income in the town was $37,000, and the median family income was $41,000.
The town is home to a large Hispanic population, with approximately 60% of the population identifying as Hispanic or Latino. The town is also home to a large Cuban-American population, with approximately 20% of the population identifying as Cuban-American.
Conclusion
Homestead Base, Florida is a small town located in Miami-Dade County, Florida. It is situated on the southern tip of the Florida peninsula, just south of Miami. The town is home to a population of approximately 8,000 people, and is part of the larger Miami metropolitan area. The town has a rich history, and is home to several tourist attractions, agricultural businesses, and manufacturing businesses. The town is also home to a large Hispanic and Cuban-American population. The town has a tropical climate, and is a popular destination for tourists and locals alike.
Common Questions
What is the Total Population of Homestead Base?
Total Population of Homestead Base is 1,242.
What is the Total Male Population of Homestead Base?
Total Male Population of Homestead Base is 517.
What is the Total Female Population of Homestead Base?
Total Female Population of Homestead Base is 725.
What is the Ratio of Males per 100 Females in Homestead Base?
There are 71.31 Males per 100 Females in Homestead Base.
What is the Ratio of Females per 100 Males in Homestead Base?
There are 140.23 Females per 100 Males in Homestead Base.
What is the Median Population Age in Homestead Base?
Median Population Age in Homestead Base is 20.2 Years.
What is the Average Family Size in Homestead Base
Average Family Size in Homestead Base is 4.2 People.
What is the Average Household Size in Homestead Base
Average Household Size in Homestead Base is 4.2 People.
What is Per Capita Income in Homestead Base?
Per Capita income in Homestead Base is $5,241.
What is Family Income Deficit in Homestead Base?
Family Income Deficit in Homestead Base is $17,472.
Families that are below poverty line in Homestead Base earn $17,472 less on average than the poverty threshold level.
What is Inequality or Gini Index in Homestead Base?
Inequality or Gini Index in Homestead Base is 0.49.
How Large is the Labor Force in Homestead Base?
There are 293 People in the Labor Forcein in Homestead Base.
What is the Percentage of People in the Labor Force in Homestead Base?
41.3% of People are in the Labor Force in Homestead Base.
What is the Unemployment Rate in Homestead Base?
Unemployment Rate in Homestead Base is 50.0%.