Hilliard, FL
Hilliard Map
Hilliard Overview
2,975
TOTAL POPULATION
1,282
MALE POPULATION
1,693
FEMALE POPULATION
75.72
MALES / 100 FEMALES
132.06
FEMALES / 100 MALES
34.7
MEDIAN AGE
2.9
AVG FAMILY SIZE
2.5
AVG HOUSEHOLD SIZE
$25,365
PER CAPITA INCOME
$71,446
AVG FAMILY INCOME
$64,375
AVG HOUSEHOLD INCOME
10.1%
WAGE / INCOME GAP [ % ]
89.9¢/ $1
WAGE / INCOME GAP [ $ ]
0.37
INEQUALITY / GINI INDEX
1,392
LABOR FORCE [ PEOPLE ]
61.9%
PERCENT IN LABOR FORCE
5.8%
UNEMPLOYMENT RATE
Hilliard Zip Codes
Hilliard Area Codes
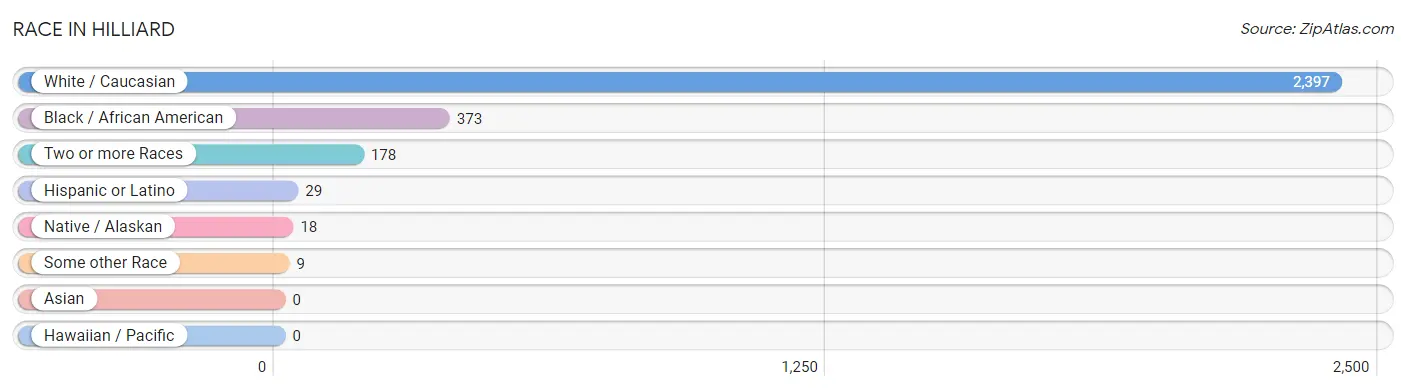
Race in Hilliard
The most populous races in Hilliard are White / Caucasian (2,397 | 80.6%), Black / African American (373 | 12.5%), and Two or more Races (178 | 6.0%).
| Race | # Population | % Population |
| Asian | 0 | 0.0% |
| Black / African American | 373 | 12.5% |
| Hawaiian / Pacific | 0 | 0.0% |
| Hispanic or Latino | 29 | 1.0% |
| Native / Alaskan | 18 | 0.6% |
| White / Caucasian | 2,397 | 80.6% |
| Two or more Races | 178 | 6.0% |
| Some other Race | 9 | 0.3% |
| Total | 2,975 | 100.0% |
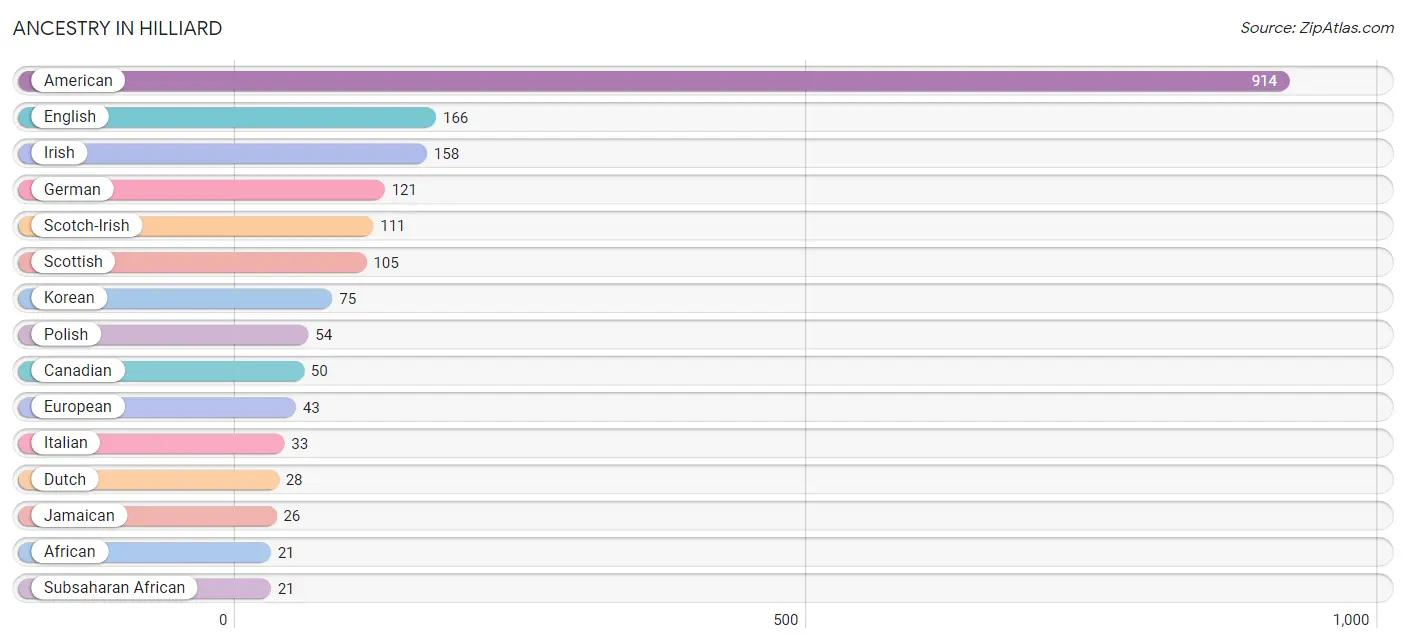
Ancestry in Hilliard
The most populous ancestries reported in Hilliard are American (914 | 30.7%), English (166 | 5.6%), Irish (158 | 5.3%), German (121 | 4.1%), and Scotch-Irish (111 | 3.7%), together accounting for 49.4% of all Hilliard residents.
| Ancestry | # Population | % Population |
| African | 21 | 0.7% |
| American | 914 | 30.7% |
| British | 14 | 0.5% |
| Canadian | 50 | 1.7% |
| Central American | 5 | 0.2% |
| Cherokee | 16 | 0.5% |
| Colombian | 15 | 0.5% |
| Costa Rican | 5 | 0.2% |
| Cuban | 5 | 0.2% |
| Dutch | 28 | 0.9% |
| English | 166 | 5.6% |
| European | 43 | 1.5% |
| French | 19 | 0.6% |
| French Canadian | 6 | 0.2% |
| German | 121 | 4.1% |
| Irish | 158 | 5.3% |
| Italian | 33 | 1.1% |
| Jamaican | 26 | 0.9% |
| Korean | 75 | 2.5% |
| Mexican | 4 | 0.1% |
| Polish | 54 | 1.8% |
| Scotch-Irish | 111 | 3.7% |
| Scottish | 105 | 3.5% |
| South American | 15 | 0.5% |
| Subsaharan African | 21 | 0.7% |
| Swedish | 10 | 0.3% |
| Welsh | 2 | 0.1% | View All 27 Rows |
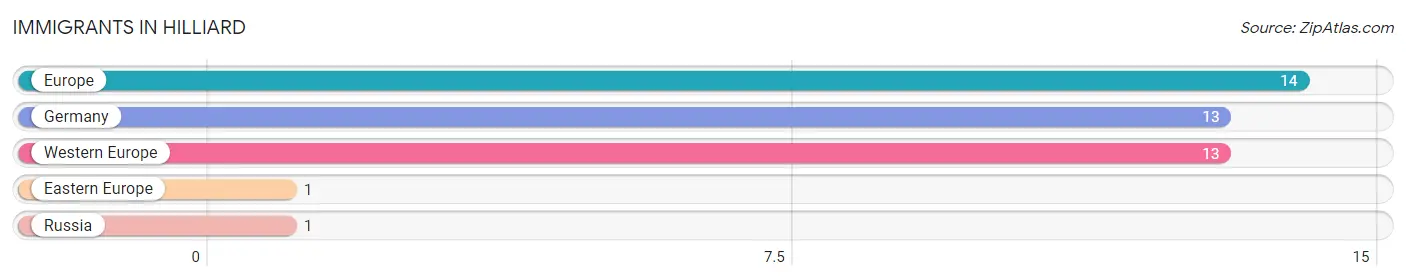
Immigrants in Hilliard
The most numerous immigrant groups reported in Hilliard came from Europe (14 | 0.5%), Germany (13 | 0.4%), Western Europe (13 | 0.4%), Eastern Europe (1 | 0.0%), and Russia (1 | 0.0%), together accounting for 1.4% of all Hilliard residents.
| Immigration Origin | # Population | % Population |
| Eastern Europe | 1 | 0.0% |
| Europe | 14 | 0.5% |
| Germany | 13 | 0.4% |
| Russia | 1 | 0.0% |
| Western Europe | 13 | 0.4% | View All 5 Rows |
Sex and Age in Hilliard
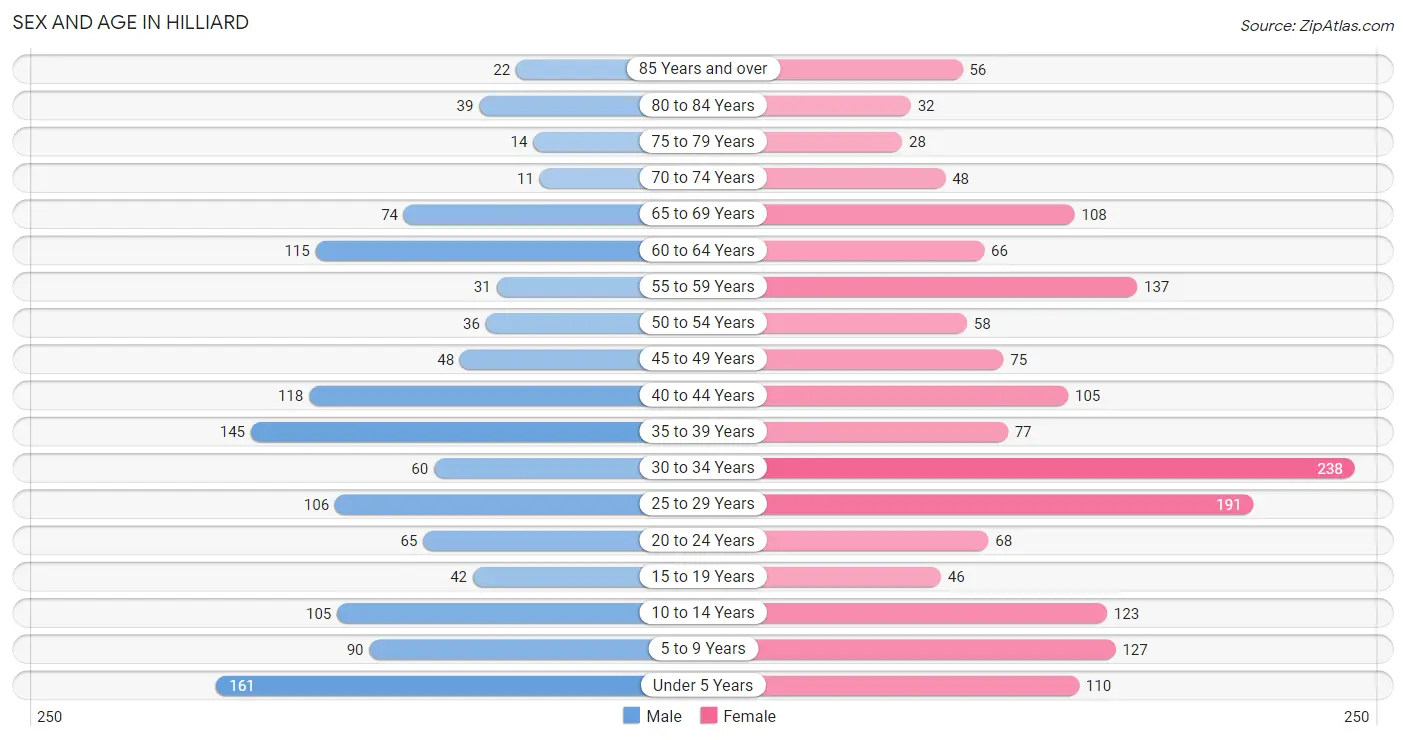
Sex and Age in Hilliard
The most populous age groups in Hilliard are Under 5 Years (161 | 12.6%) for men and 30 to 34 Years (238 | 14.1%) for women.
| Age Bracket | Male | Female |
| Under 5 Years | 161 (12.6%) | 110 (6.5%) |
| 5 to 9 Years | 90 (7.0%) | 127 (7.5%) |
| 10 to 14 Years | 105 (8.2%) | 123 (7.3%) |
| 15 to 19 Years | 42 (3.3%) | 46 (2.7%) |
| 20 to 24 Years | 65 (5.1%) | 68 (4.0%) |
| 25 to 29 Years | 106 (8.3%) | 191 (11.3%) |
| 30 to 34 Years | 60 (4.7%) | 238 (14.1%) |
| 35 to 39 Years | 145 (11.3%) | 77 (4.5%) |
| 40 to 44 Years | 118 (9.2%) | 105 (6.2%) |
| 45 to 49 Years | 48 (3.7%) | 75 (4.4%) |
| 50 to 54 Years | 36 (2.8%) | 58 (3.4%) |
| 55 to 59 Years | 31 (2.4%) | 137 (8.1%) |
| 60 to 64 Years | 115 (9.0%) | 66 (3.9%) |
| 65 to 69 Years | 74 (5.8%) | 108 (6.4%) |
| 70 to 74 Years | 11 (0.9%) | 48 (2.8%) |
| 75 to 79 Years | 14 (1.1%) | 28 (1.7%) |
| 80 to 84 Years | 39 (3.0%) | 32 (1.9%) |
| 85 Years and over | 22 (1.7%) | 56 (3.3%) |
| Total | 1,282 (100.0%) | 1,693 (100.0%) |
Families and Households in Hilliard
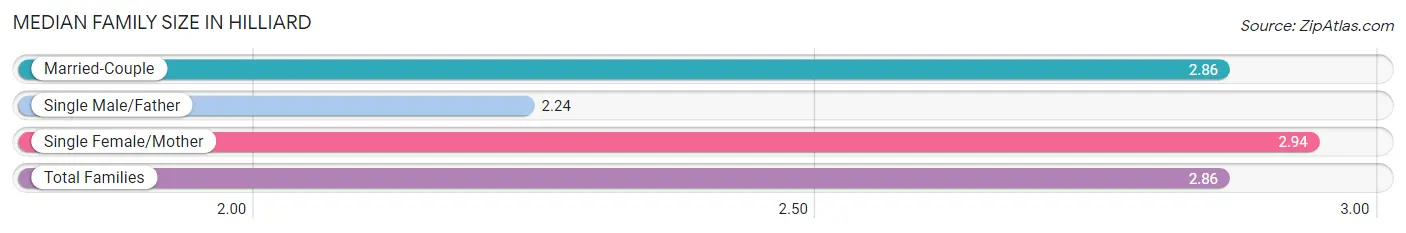
Median Family Size in Hilliard
The median family size in Hilliard is 2.86 persons per family, with single female/mother families (264 | 31.9%) accounting for the largest median family size of 2.94 persons per family. On the other hand, single male/father families (34 | 4.1%) represent the smallest median family size with 2.24 persons per family.
| Family Type | # Families | Family Size |
| Married-Couple | 529 (64.0%) | 2.86 |
| Single Male/Father | 34 (4.1%) | 2.24 |
| Single Female/Mother | 264 (31.9%) | 2.94 |
| Total Families | 827 (100.0%) | 2.86 |
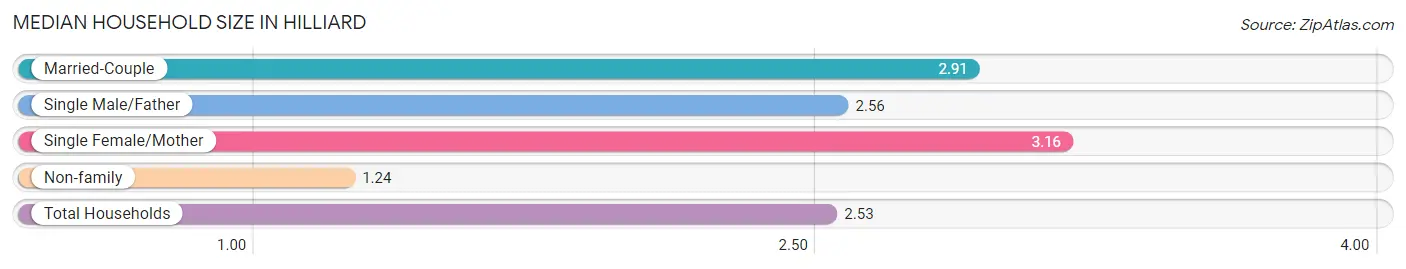
Median Household Size in Hilliard
The median household size in Hilliard is 2.53 persons per household, with single female/mother households (264 | 23.7%) accounting for the largest median household size of 3.16 persons per household. non-family households (286 | 25.7%) represent the smallest median household size with 1.24 persons per household.
| Household Type | # Households | Household Size |
| Married-Couple | 529 (47.5%) | 2.91 |
| Single Male/Father | 34 (3.0%) | 2.56 |
| Single Female/Mother | 264 (23.7%) | 3.16 |
| Non-family | 286 (25.7%) | 1.24 |
| Total Households | 1,113 (100.0%) | 2.53 |
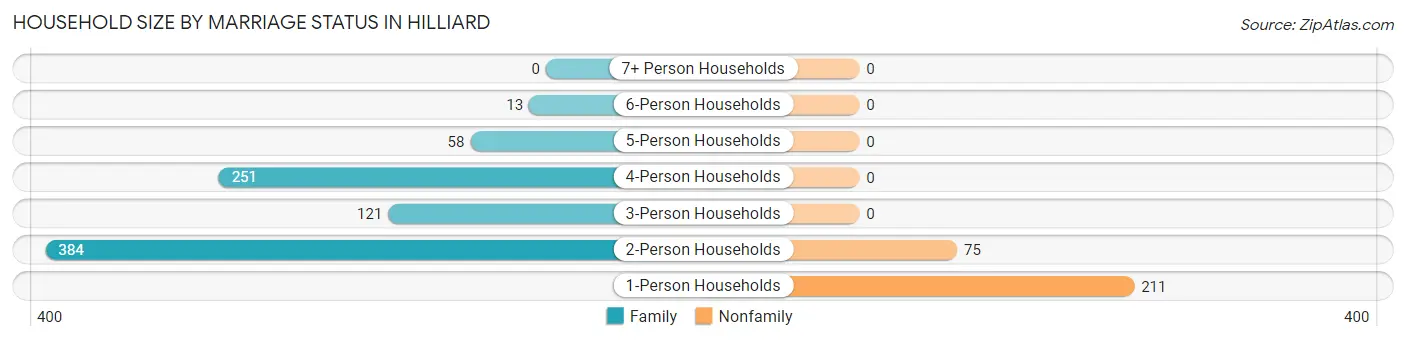
Household Size by Marriage Status in Hilliard
Out of a total of 1,113 households in Hilliard, 827 (74.3%) are family households, while 286 (25.7%) are nonfamily households. The most numerous type of family households are 2-person households, comprising 384, and the most common type of nonfamily households are 1-person households, comprising 211.
| Household Size | Family Households | Nonfamily Households |
| 1-Person Households | - | 211 (19.0%) |
| 2-Person Households | 384 (34.5%) | 75 (6.7%) |
| 3-Person Households | 121 (10.9%) | 0 (0.0%) |
| 4-Person Households | 251 (22.6%) | 0 (0.0%) |
| 5-Person Households | 58 (5.2%) | 0 (0.0%) |
| 6-Person Households | 13 (1.2%) | 0 (0.0%) |
| 7+ Person Households | 0 (0.0%) | 0 (0.0%) |
| Total | 827 (74.3%) | 286 (25.7%) |
Female Fertility in Hilliard
Fertility by Age in Hilliard
Average fertility rate in Hilliard is 36.0 births per 1,000 women. Women in the age bracket of 20 to 34 years have the highest fertility rate with 58.0 births per 1,000 women. Women in the age bracket of 20 to 34 years acount for 100.0% of all women with births.
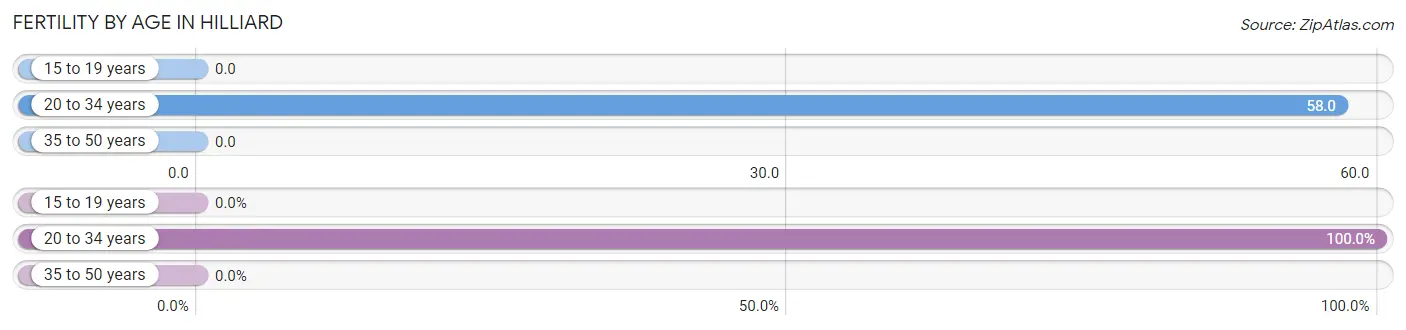
| Age Bracket | Women with Births | Births / 1,000 Women |
| 15 to 19 years | 0 (0.0%) | 0.0 |
| 20 to 34 years | 29 (100.0%) | 58.0 |
| 35 to 50 years | 0 (0.0%) | 0.0 |
| Total | 29 (100.0%) | 36.0 |
Fertility by Age by Marriage Status in Hilliard
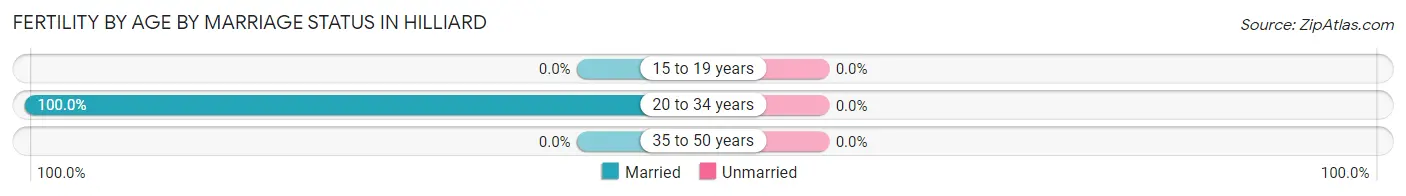
| Age Bracket | Married | Unmarried |
| 15 to 19 years | 0 (0.0%) | 0 (0.0%) |
| 20 to 34 years | 29 (100.0%) | 0 (0.0%) |
| 35 to 50 years | 0 (0.0%) | 0 (0.0%) |
| Total | 29 (100.0%) | 0 (0.0%) |
Fertility by Education in Hilliard
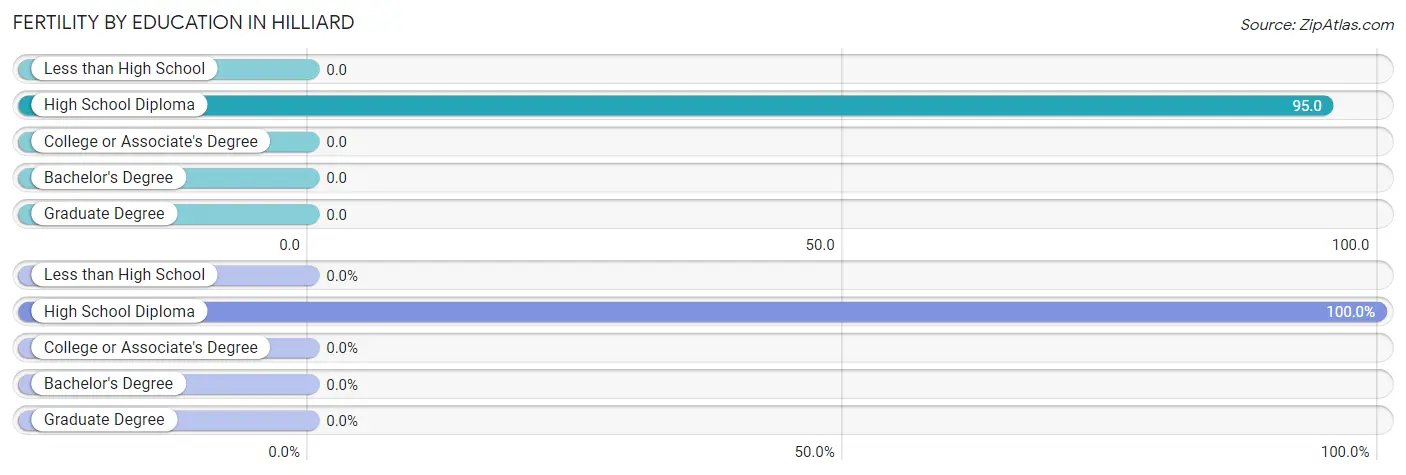
| Educational Attainment | Women with Births | Births / 1,000 Women |
| Less than High School | 0 (0.0%) | 0.0 |
| High School Diploma | 29 (100.0%) | 95.0 |
| College or Associate's Degree | 0 (0.0%) | 0.0 |
| Bachelor's Degree | 0 (0.0%) | 0.0 |
| Graduate Degree | 0 (0.0%) | 0.0 |
| Total | 29 (100.0%) | 36.0 |
Fertility by Education by Marriage Status in Hilliard
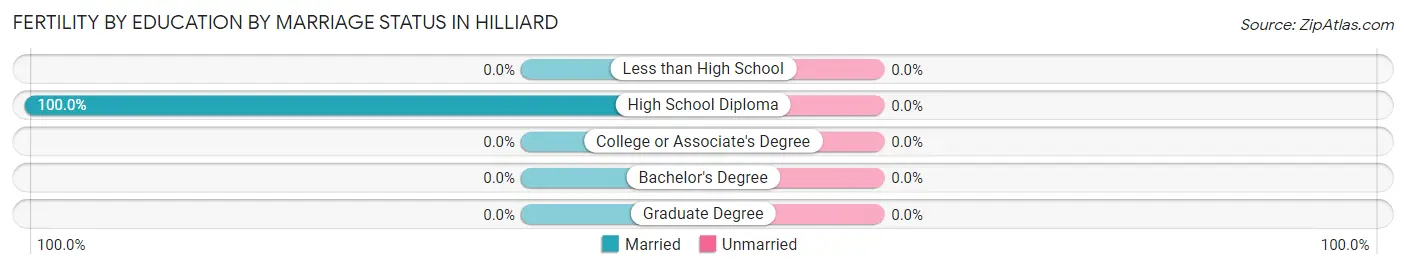
| Educational Attainment | Married | Unmarried |
| Less than High School | 0 (0.0%) | 0 (0.0%) |
| High School Diploma | 29 (100.0%) | 0 (0.0%) |
| College or Associate's Degree | 0 (0.0%) | 0 (0.0%) |
| Bachelor's Degree | 0 (0.0%) | 0 (0.0%) |
| Graduate Degree | 0 (0.0%) | 0 (0.0%) |
| Total | 29 (100.0%) | 0 (0.0%) |
Income in Hilliard
Income Overview in Hilliard
Per Capita Income in Hilliard is $25,365, while median incomes of families and households are $71,446 and $64,375 respectively.
| Characteristic | Number | Measure |
| Per Capita Income | 2,975 | $25,365 |
| Median Family Income | 827 | $71,446 |
| Mean Family Income | 827 | $74,315 |
| Median Household Income | 1,113 | $64,375 |
| Mean Household Income | 1,113 | $64,816 |
| Income Deficit | 827 | $0 |
| Wage / Income Gap (%) | 2,975 | 10.13% |
| Wage / Income Gap ($) | 2,975 | 89.87¢ per $1 |
| Gini / Inequality Index | 2,975 | 0.37 |
Earnings by Sex in Hilliard
Average Earnings in Hilliard are $38,071, $40,306 for men and $36,221 for women, a difference of 10.1%.
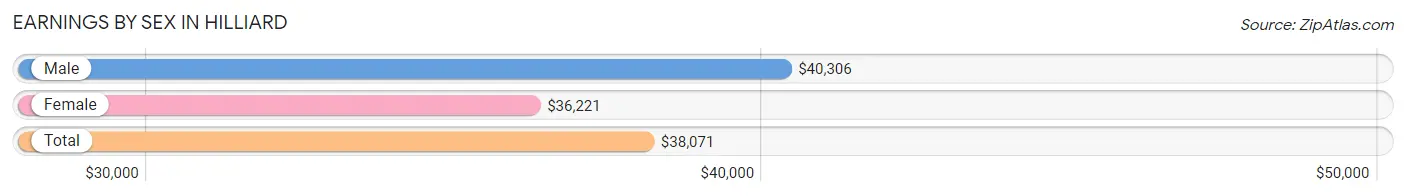
| Sex | Number | Average Earnings |
| Male | 663 (45.6%) | $40,306 |
| Female | 790 (54.4%) | $36,221 |
| Total | 1,453 (100.0%) | $38,071 |
Earnings by Sex by Income Bracket in Hilliard
The most common earnings brackets in Hilliard are $40,000 to $44,999 for men (88 | 13.3%) and $40,000 to $44,999 for women (108 | 13.7%).
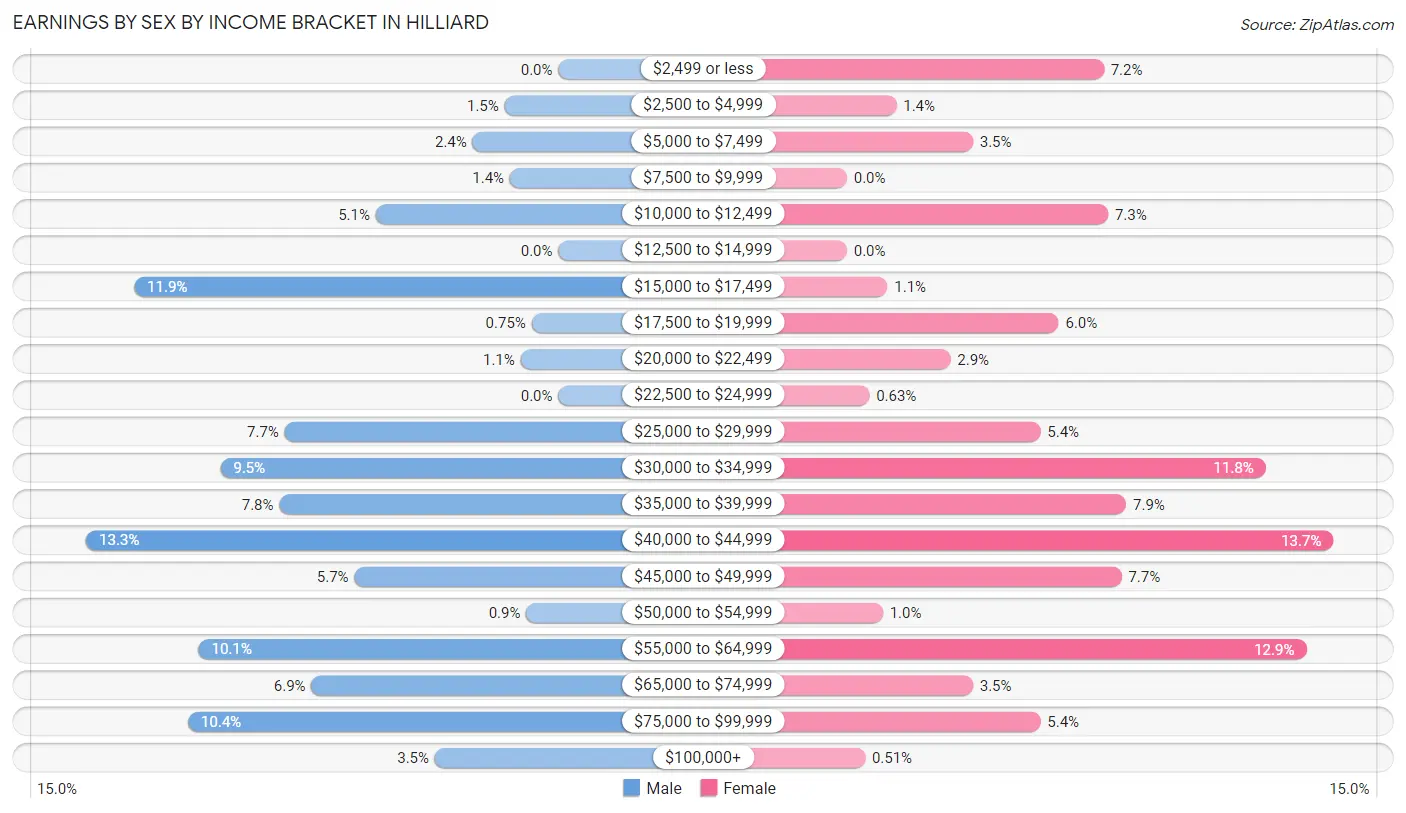
| Income | Male | Female |
| $2,499 or less | 0 (0.0%) | 57 (7.2%) |
| $2,500 to $4,999 | 10 (1.5%) | 11 (1.4%) |
| $5,000 to $7,499 | 16 (2.4%) | 28 (3.5%) |
| $7,500 to $9,999 | 9 (1.4%) | 0 (0.0%) |
| $10,000 to $12,499 | 34 (5.1%) | 58 (7.3%) |
| $12,500 to $14,999 | 0 (0.0%) | 0 (0.0%) |
| $15,000 to $17,499 | 79 (11.9%) | 9 (1.1%) |
| $17,500 to $19,999 | 5 (0.7%) | 47 (5.9%) |
| $20,000 to $22,499 | 7 (1.1%) | 23 (2.9%) |
| $22,500 to $24,999 | 0 (0.0%) | 5 (0.6%) |
| $25,000 to $29,999 | 51 (7.7%) | 43 (5.4%) |
| $30,000 to $34,999 | 63 (9.5%) | 93 (11.8%) |
| $35,000 to $39,999 | 52 (7.8%) | 62 (7.9%) |
| $40,000 to $44,999 | 88 (13.3%) | 108 (13.7%) |
| $45,000 to $49,999 | 38 (5.7%) | 61 (7.7%) |
| $50,000 to $54,999 | 6 (0.9%) | 8 (1.0%) |
| $55,000 to $64,999 | 67 (10.1%) | 102 (12.9%) |
| $65,000 to $74,999 | 46 (6.9%) | 28 (3.5%) |
| $75,000 to $99,999 | 69 (10.4%) | 43 (5.4%) |
| $100,000+ | 23 (3.5%) | 4 (0.5%) |
| Total | 663 (100.0%) | 790 (100.0%) |
Earnings by Sex by Educational Attainment in Hilliard
Average earnings in Hilliard are $40,389 for men and $38,553 for women, a difference of 4.5%. Men with an educational attainment of college or associate's degree enjoy the highest average annual earnings of $57,019, while those with less than high school education earn the least with $28,407. Women with an educational attainment of college or associate's degree earn the most with the average annual earnings of $41,092, while those with high school diploma education have the smallest earnings of $33,618.
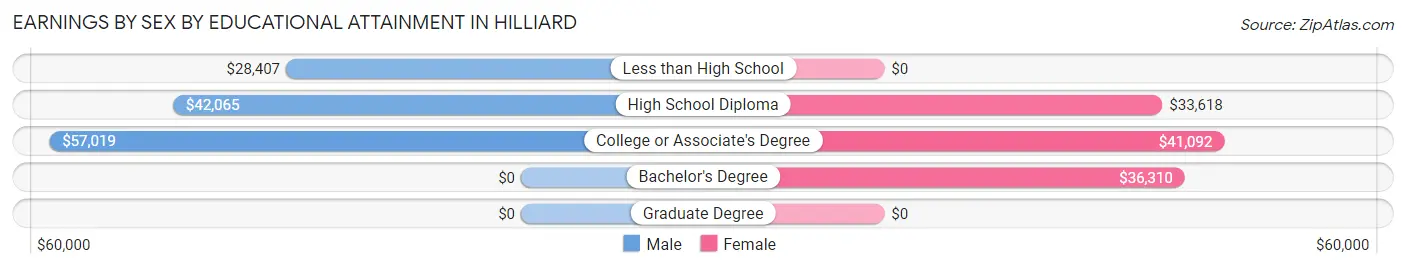
| Educational Attainment | Male Income | Female Income |
| Less than High School | $28,407 | $0 |
| High School Diploma | $42,065 | $33,618 |
| College or Associate's Degree | $57,019 | $41,092 |
| Bachelor's Degree | - | - |
| Graduate Degree | - | - |
| Total | $40,389 | $38,553 |
Family Income in Hilliard
Family Income Brackets in Hilliard
According to the Hilliard family income data, there are 210 families falling into the $50,000 to $74,999 income range, which is the most common income bracket and makes up 25.4% of all families. Conversely, the $200,000+ income bracket is the least frequent group with only 14 families (1.7%) belonging to this category.
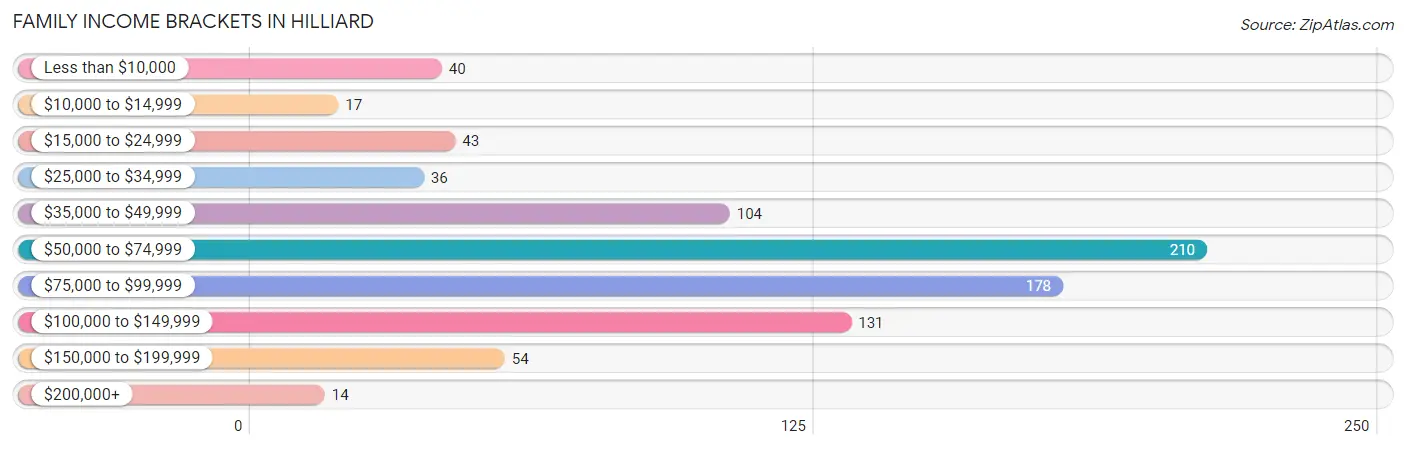
| Income Bracket | # Families | % Families |
| Less than $10,000 | 40 | 4.8% |
| $10,000 to $14,999 | 17 | 2.1% |
| $15,000 to $24,999 | 43 | 5.2% |
| $25,000 to $34,999 | 36 | 4.4% |
| $35,000 to $49,999 | 104 | 12.6% |
| $50,000 to $74,999 | 210 | 25.4% |
| $75,000 to $99,999 | 178 | 21.5% |
| $100,000 to $149,999 | 131 | 15.8% |
| $150,000 to $199,999 | 54 | 6.5% |
| $200,000+ | 14 | 1.7% |
Family Income by Famaliy Size in Hilliard
5-person families (62 | 7.5%) account for the highest median family income in Hilliard with $87,917 per family, while 2-person families (397 | 48.0%) have the highest median income of $39,328 per family member.
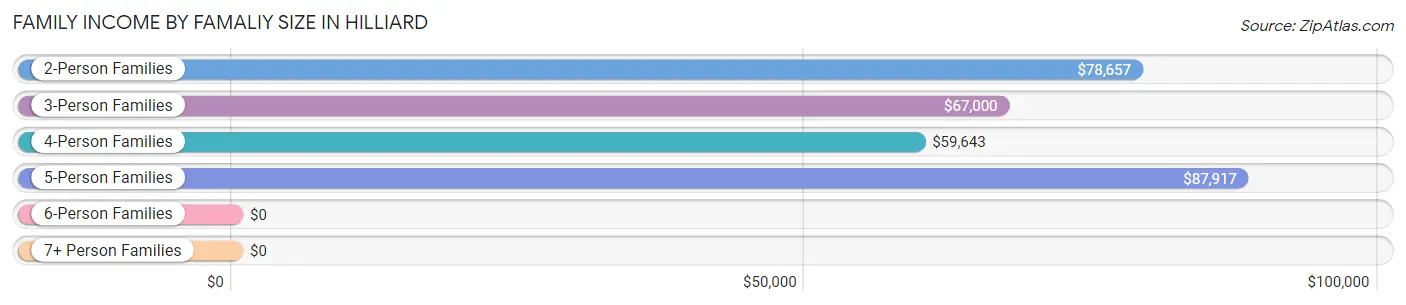
| Income Bracket | # Families | Median Income |
| 2-Person Families | 397 (48.0%) | $78,657 |
| 3-Person Families | 168 (20.3%) | $67,000 |
| 4-Person Families | 200 (24.2%) | $59,643 |
| 5-Person Families | 62 (7.5%) | $87,917 |
| 6-Person Families | 0 (0.0%) | $0 |
| 7+ Person Families | 0 (0.0%) | $0 |
| Total | 827 (100.0%) | $71,446 |
Family Income by Number of Earners in Hilliard
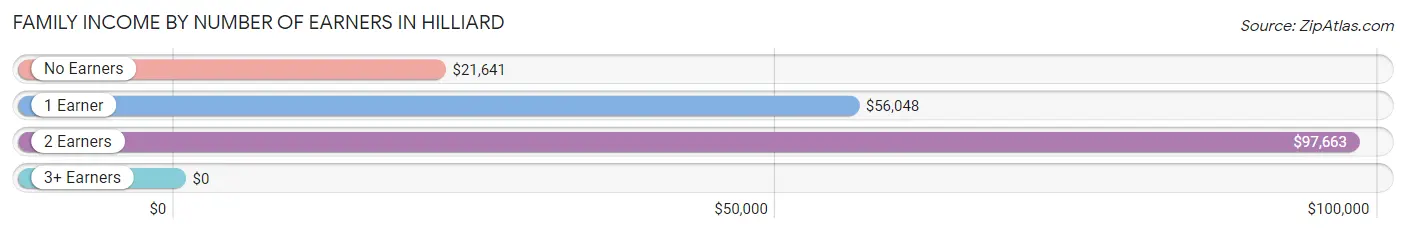
| Number of Earners | # Families | Median Income |
| No Earners | 105 (12.7%) | $21,641 |
| 1 Earner | 336 (40.6%) | $56,048 |
| 2 Earners | 353 (42.7%) | $97,663 |
| 3+ Earners | 33 (4.0%) | $0 |
| Total | 827 (100.0%) | $71,446 |
Household Income in Hilliard
Household Income Brackets in Hilliard
With 280 households falling in the category, the $50,000 to $74,999 income range is the most frequent in Hilliard, accounting for 25.2% of all households. In contrast, only 14 households (1.3%) fall into the $200,000+ income bracket, making it the least populous group.
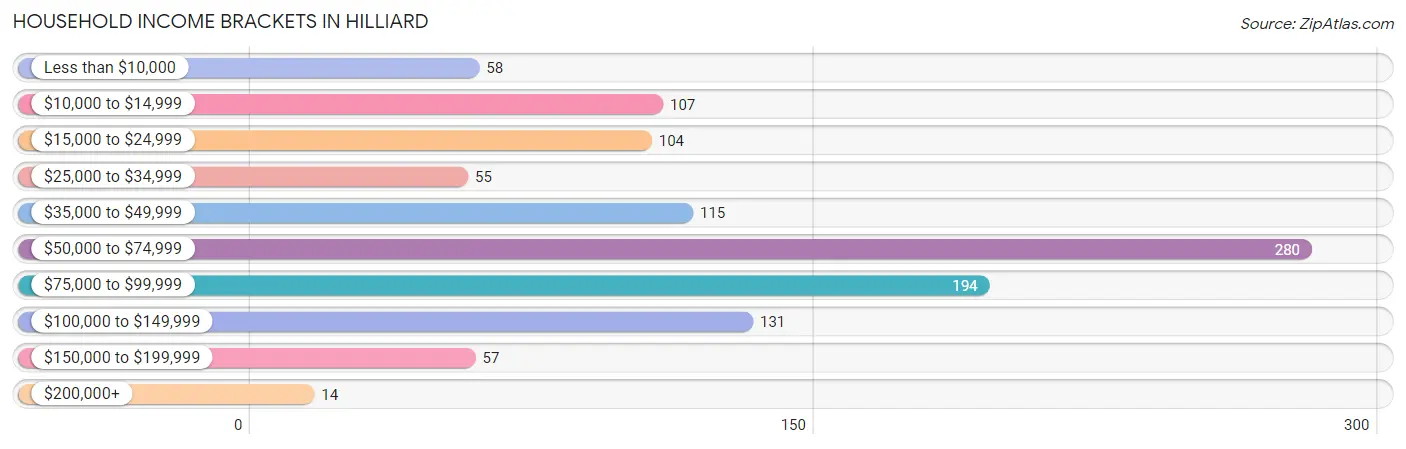
| Income Bracket | # Households | % Households |
| Less than $10,000 | 58 | 5.2% |
| $10,000 to $14,999 | 107 | 9.6% |
| $15,000 to $24,999 | 104 | 9.3% |
| $25,000 to $34,999 | 55 | 4.9% |
| $35,000 to $49,999 | 115 | 10.3% |
| $50,000 to $74,999 | 280 | 25.2% |
| $75,000 to $99,999 | 194 | 17.4% |
| $100,000 to $149,999 | 131 | 11.8% |
| $150,000 to $199,999 | 57 | 5.1% |
| $200,000+ | 14 | 1.3% |
Household Income by Householder Age in Hilliard
The median household income in Hilliard is $64,375, with the highest median household income of $71,797 found in the 15 to 24 years age bracket for the primary householder. A total of 64 households (5.8%) fall into this category. Meanwhile, the 45 to 64 years age bracket for the primary householder has the lowest median household income of $56,250, with 321 households (28.8%) in this group.
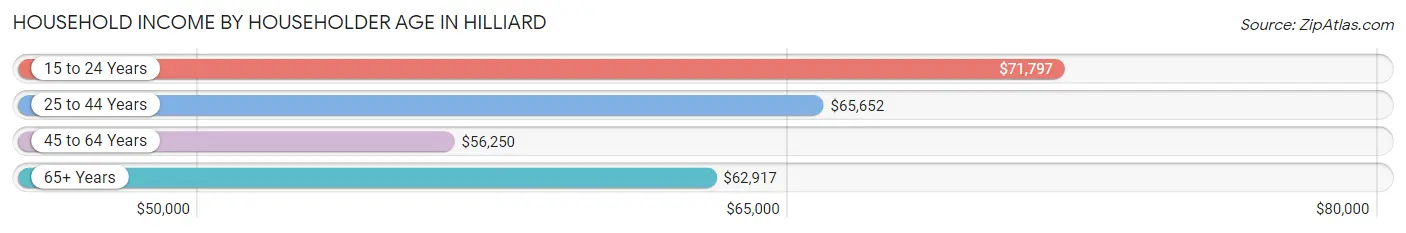
| Income Bracket | # Households | Median Income |
| 15 to 24 Years | 64 (5.8%) | $71,797 |
| 25 to 44 Years | 540 (48.5%) | $65,652 |
| 45 to 64 Years | 321 (28.8%) | $56,250 |
| 65+ Years | 188 (16.9%) | $62,917 |
| Total | 1,113 (100.0%) | $64,375 |
Poverty in Hilliard
Income Below Poverty by Sex and Age in Hilliard
With 13.0% poverty level for males and 20.1% for females among the residents of Hilliard, 18 to 24 year old males and 15 year old females are the most vulnerable to poverty, with 36 males (46.8%) and 10 females (100.0%) in their respective age groups living below the poverty level.

| Age Bracket | Male | Female |
| Under 5 Years | 29 (22.8%) | 0 (0.0%) |
| 5 Years | 0 (0.0%) | 24 (42.1%) |
| 6 to 11 Years | 20 (23.8%) | 24 (22.2%) |
| 12 to 14 Years | 10 (10.7%) | 23 (27.1%) |
| 15 Years | 0 (0.0%) | 10 (100.0%) |
| 16 and 17 Years | 0 (0.0%) | 0 (0.0%) |
| 18 to 24 Years | 36 (46.8%) | 13 (14.4%) |
| 25 to 34 Years | 21 (12.7%) | 93 (21.7%) |
| 35 to 44 Years | 0 (0.0%) | 45 (24.7%) |
| 45 to 54 Years | 28 (33.3%) | 25 (18.8%) |
| 55 to 64 Years | 14 (10.1%) | 32 (17.9%) |
| 65 to 74 Years | 0 (0.0%) | 20 (16.1%) |
| 75 Years and over | 0 (0.0%) | 7 (14.0%) |
| Total | 158 (13.0%) | 316 (20.1%) |
Income Above Poverty by Sex and Age in Hilliard
According to the poverty statistics in Hilliard, males aged 5 years and females aged under 5 years are the age groups that are most secure financially, with 100.0% of males and 100.0% of females in these age groups living above the poverty line.
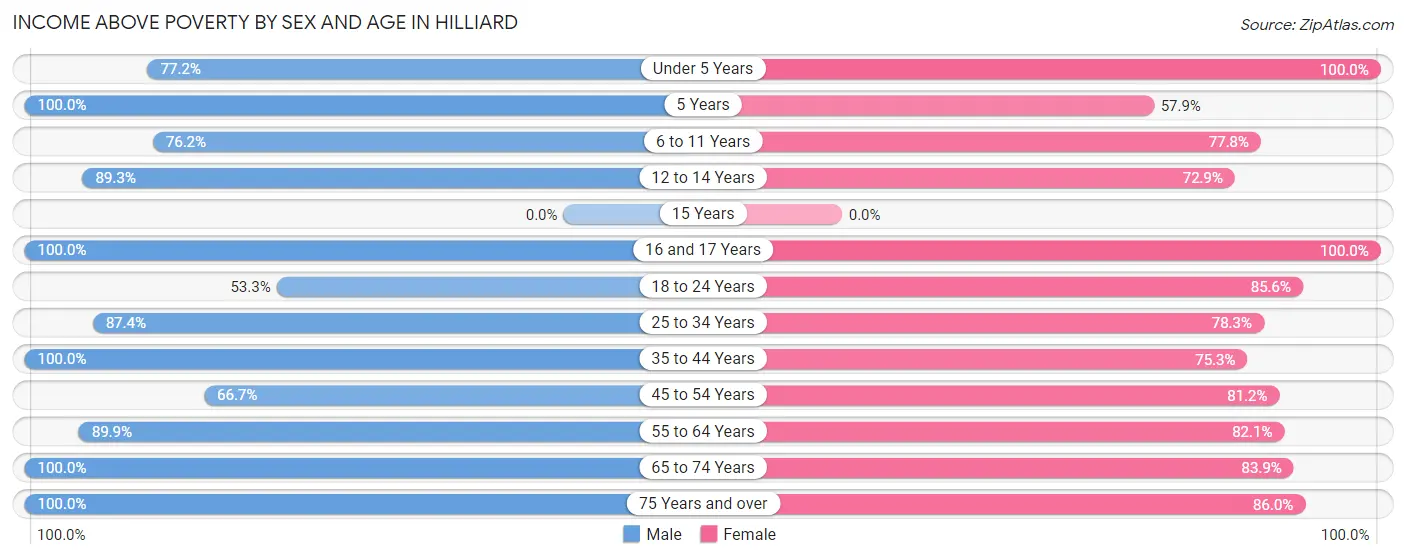
| Age Bracket | Male | Female |
| Under 5 Years | 98 (77.2%) | 110 (100.0%) |
| 5 Years | 18 (100.0%) | 33 (57.9%) |
| 6 to 11 Years | 64 (76.2%) | 84 (77.8%) |
| 12 to 14 Years | 83 (89.2%) | 62 (72.9%) |
| 15 Years | 0 (0.0%) | 0 (0.0%) |
| 16 and 17 Years | 30 (100.0%) | 14 (100.0%) |
| 18 to 24 Years | 41 (53.2%) | 77 (85.6%) |
| 25 to 34 Years | 145 (87.4%) | 336 (78.3%) |
| 35 to 44 Years | 263 (100.0%) | 137 (75.3%) |
| 45 to 54 Years | 56 (66.7%) | 108 (81.2%) |
| 55 to 64 Years | 125 (89.9%) | 147 (82.1%) |
| 65 to 74 Years | 85 (100.0%) | 104 (83.9%) |
| 75 Years and over | 46 (100.0%) | 43 (86.0%) |
| Total | 1,054 (87.0%) | 1,255 (79.9%) |
Income Below Poverty Among Married-Couple Families in Hilliard
The poverty statistics for married-couple families in Hilliard show that 2.8% or 15 of the total 529 families live below the poverty line. Families with 1 or 2 children have the highest poverty rate of 7.8%, comprising of 12 families. On the other hand, families with 3 or 4 children have the lowest poverty rate of 0.0%, which includes 0 families.
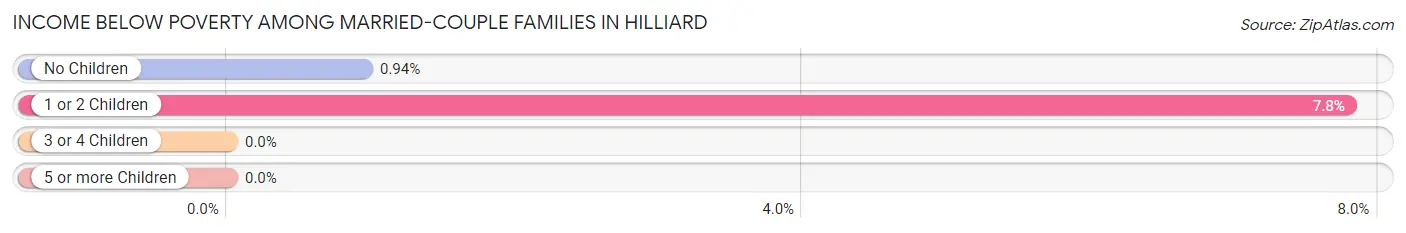
| Children | Above Poverty | Below Poverty |
| No Children | 316 (99.1%) | 3 (0.9%) |
| 1 or 2 Children | 142 (92.2%) | 12 (7.8%) |
| 3 or 4 Children | 56 (100.0%) | 0 (0.0%) |
| 5 or more Children | 0 (0.0%) | 0 (0.0%) |
| Total | 514 (97.2%) | 15 (2.8%) |
Income Below Poverty Among Single-Parent Households in Hilliard
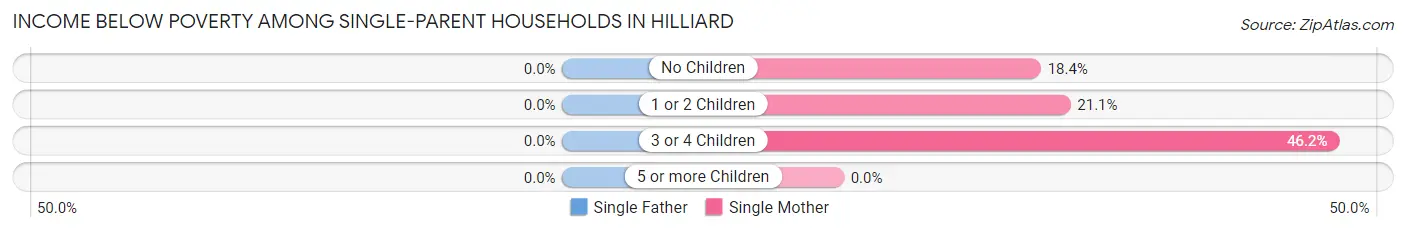
| Children | Single Father | Single Mother |
| No Children | 0 (0.0%) | 20 (18.3%) |
| 1 or 2 Children | 0 (0.0%) | 19 (21.1%) |
| 3 or 4 Children | 0 (0.0%) | 30 (46.2%) |
| 5 or more Children | 0 (0.0%) | 0 (0.0%) |
| Total | 0 (0.0%) | 69 (26.1%) |
Income Below Poverty Among Married-Couple vs Single-Parent Households in Hilliard
The poverty data for Hilliard shows that 15 of the married-couple family households (2.8%) and 69 of the single-parent households (23.2%) are living below the poverty level. Within the married-couple family households, those with 1 or 2 children have the highest poverty rate, with 12 households (7.8%) falling below the poverty line. Among the single-parent households, those with 3 or 4 children have the highest poverty rate, with 30 household (46.2%) living below poverty.
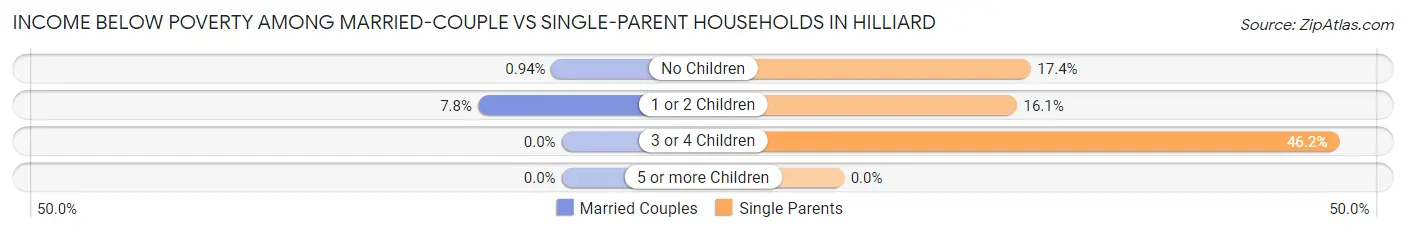
| Children | Married-Couple Families | Single-Parent Households |
| No Children | 3 (0.9%) | 20 (17.4%) |
| 1 or 2 Children | 12 (7.8%) | 19 (16.1%) |
| 3 or 4 Children | 0 (0.0%) | 30 (46.2%) |
| 5 or more Children | 0 (0.0%) | 0 (0.0%) |
| Total | 15 (2.8%) | 69 (23.2%) |
Employment Characteristics in Hilliard
Employment by Class of Employer in Hilliard
Among the 1,285 employed individuals in Hilliard, private company employees (996 | 77.5%), federal government employees (84 | 6.5%), and not-for-profit organizations (67 | 5.2%) make up the most common classes of employment.
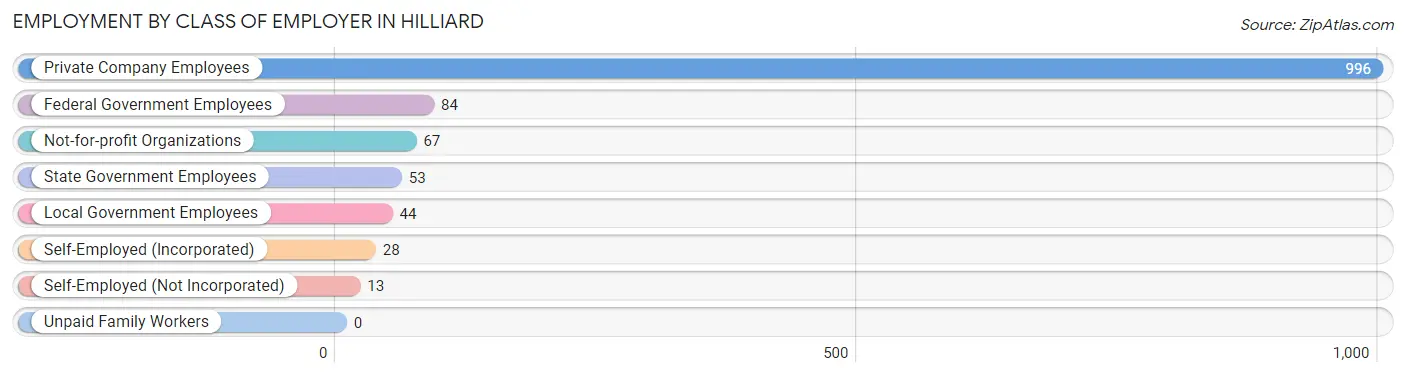
| Employer Class | # Employees | % Employees |
| Private Company Employees | 996 | 77.5% |
| Self-Employed (Incorporated) | 28 | 2.2% |
| Self-Employed (Not Incorporated) | 13 | 1.0% |
| Not-for-profit Organizations | 67 | 5.2% |
| Local Government Employees | 44 | 3.4% |
| State Government Employees | 53 | 4.1% |
| Federal Government Employees | 84 | 6.5% |
| Unpaid Family Workers | 0 | 0.0% |
| Total | 1,285 | 100.0% |
Employment Status by Age in Hilliard
According to the labor force statistics for Hilliard, out of the total population over 16 years of age (2,249), 61.9% or 1,392 individuals are in the labor force, with 5.8% or 81 of them unemployed. The age group with the highest labor force participation rate is 25 to 29 years, with 98.3% or 292 individuals in the labor force. Within the labor force, the 16 to 19 years age range has the highest percentage of unemployed individuals, with 100.0% or 9 of them being unemployed.
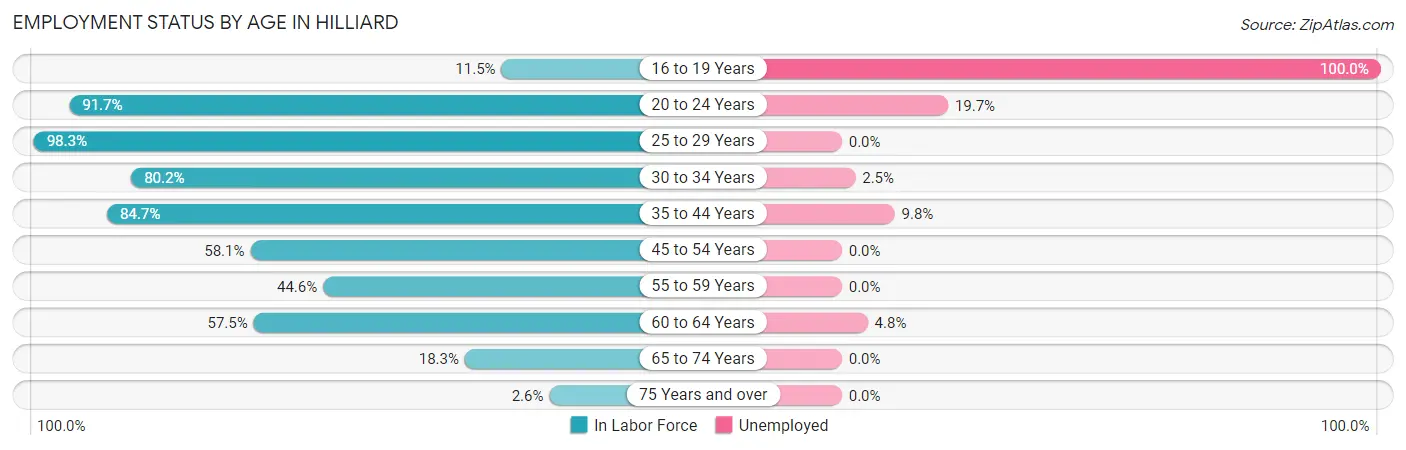
| Age Bracket | In Labor Force | Unemployed |
| 16 to 19 Years | 9 (11.5%) | 9 (100.0%) |
| 20 to 24 Years | 122 (91.7%) | 24 (19.7%) |
| 25 to 29 Years | 292 (98.3%) | 0 (0.0%) |
| 30 to 34 Years | 239 (80.2%) | 6 (2.5%) |
| 35 to 44 Years | 377 (84.7%) | 37 (9.8%) |
| 45 to 54 Years | 126 (58.1%) | 0 (0.0%) |
| 55 to 59 Years | 75 (44.6%) | 0 (0.0%) |
| 60 to 64 Years | 104 (57.5%) | 5 (4.8%) |
| 65 to 74 Years | 44 (18.3%) | 0 (0.0%) |
| 75 Years and over | 5 (2.6%) | 0 (0.0%) |
| Total | 1,392 (61.9%) | 81 (5.8%) |
Employment Status by Educational Attainment in Hilliard
According to labor force statistics for Hilliard, 75.5% of individuals (1,213) out of the total population between 25 and 64 years of age (1,606) are in the labor force, with 4.0% or 49 of them being unemployed. The group with the highest labor force participation rate are those with the educational attainment of college / associate degree, with 92.7% or 367 individuals in the labor force. Within the labor force, individuals with bachelor's degree or higher education have the highest percentage of unemployment, with 27.8% or 30 of them being unemployed.
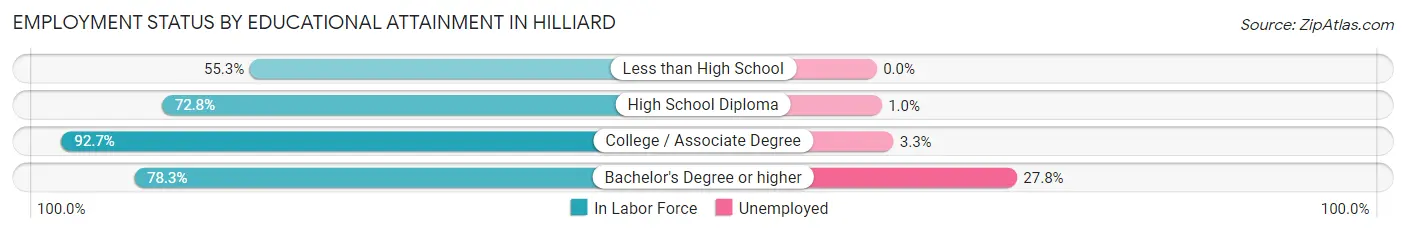
| Educational Attainment | In Labor Force | Unemployed |
| Less than High School | 135 (55.3%) | 0 (0.0%) |
| High School Diploma | 603 (72.8%) | 8 (1.0%) |
| College / Associate Degree | 367 (92.7%) | 13 (3.3%) |
| Bachelor's Degree or higher | 108 (78.3%) | 38 (27.8%) |
| Total | 1,213 (75.5%) | 64 (4.0%) |
Employment Occupations by Sex in Hilliard
Management, Business, Science and Arts Occupations
The most common Management, Business, Science and Arts occupations in Hilliard are Management (119 | 9.1%), Community & Social Service (84 | 6.4%), Education, Arts & Media (61 | 4.6%), Health Diagnosing & Treating (49 | 3.7%), and Computers, Engineering & Science (37 | 2.8%).
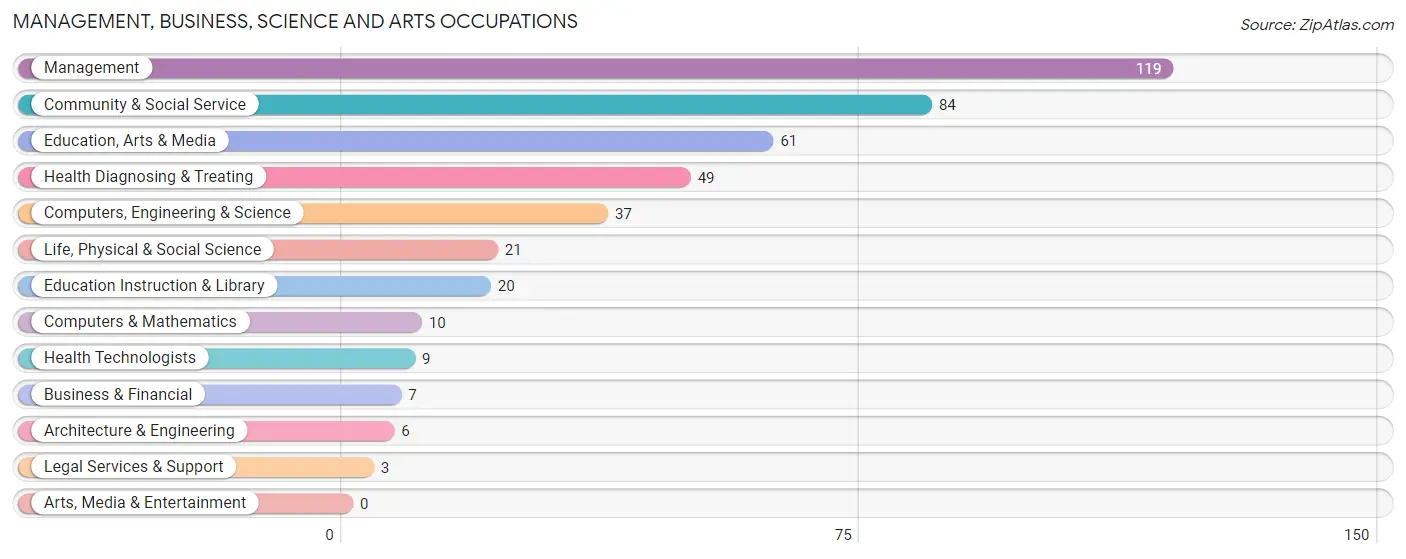
Management, Business, Science and Arts Occupations by Sex
Within the Management, Business, Science and Arts occupations in Hilliard, the most male-oriented occupations are Architecture & Engineering (100.0%), Computers & Mathematics (70.0%), and Management (63.0%), while the most female-oriented occupations are Business & Financial (100.0%), Life, Physical & Social Science (100.0%), and Legal Services & Support (100.0%).
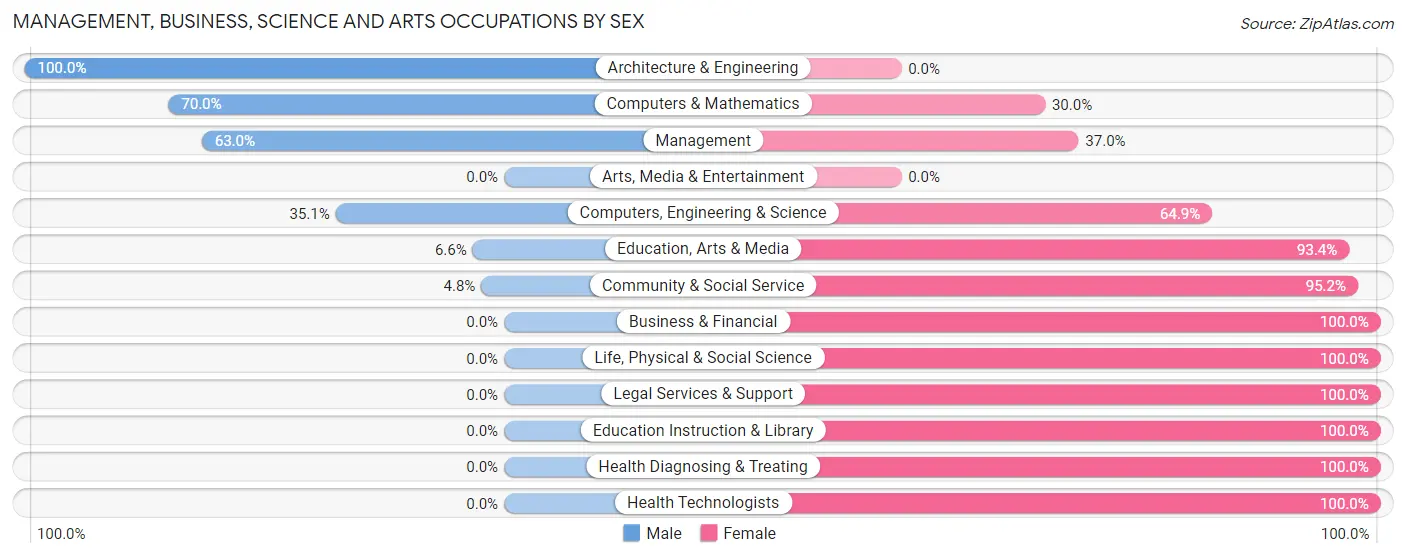
| Occupation | Male | Female |
| Management | 75 (63.0%) | 44 (37.0%) |
| Business & Financial | 0 (0.0%) | 7 (100.0%) |
| Computers, Engineering & Science | 13 (35.1%) | 24 (64.9%) |
| Computers & Mathematics | 7 (70.0%) | 3 (30.0%) |
| Architecture & Engineering | 6 (100.0%) | 0 (0.0%) |
| Life, Physical & Social Science | 0 (0.0%) | 21 (100.0%) |
| Community & Social Service | 4 (4.8%) | 80 (95.2%) |
| Education, Arts & Media | 4 (6.6%) | 57 (93.4%) |
| Legal Services & Support | 0 (0.0%) | 3 (100.0%) |
| Education Instruction & Library | 0 (0.0%) | 20 (100.0%) |
| Arts, Media & Entertainment | 0 (0.0%) | 0 (0.0%) |
| Health Diagnosing & Treating | 0 (0.0%) | 49 (100.0%) |
| Health Technologists | 0 (0.0%) | 9 (100.0%) |
| Total (Category) | 92 (31.1%) | 204 (68.9%) |
| Total (Overall) | 609 (46.4%) | 703 (53.6%) |
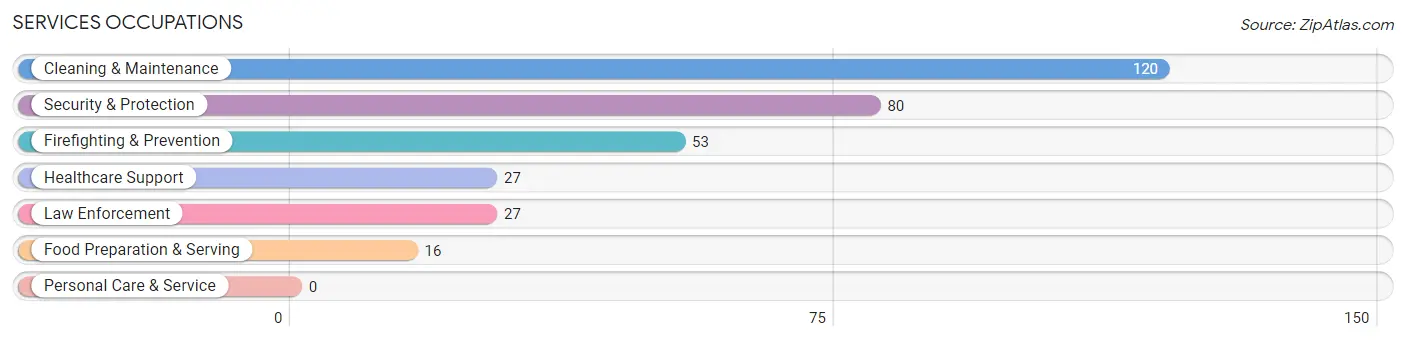
Services Occupations
The most common Services occupations in Hilliard are Cleaning & Maintenance (120 | 9.1%), Security & Protection (80 | 6.1%), Firefighting & Prevention (53 | 4.0%), Healthcare Support (27 | 2.1%), and Law Enforcement (27 | 2.1%).
Services Occupations by Sex
Within the Services occupations in Hilliard, the most male-oriented occupations are Law Enforcement (100.0%), Cleaning & Maintenance (65.8%), and Food Preparation & Serving (56.2%), while the most female-oriented occupations are Healthcare Support (100.0%), Firefighting & Prevention (69.8%), and Security & Protection (46.3%).
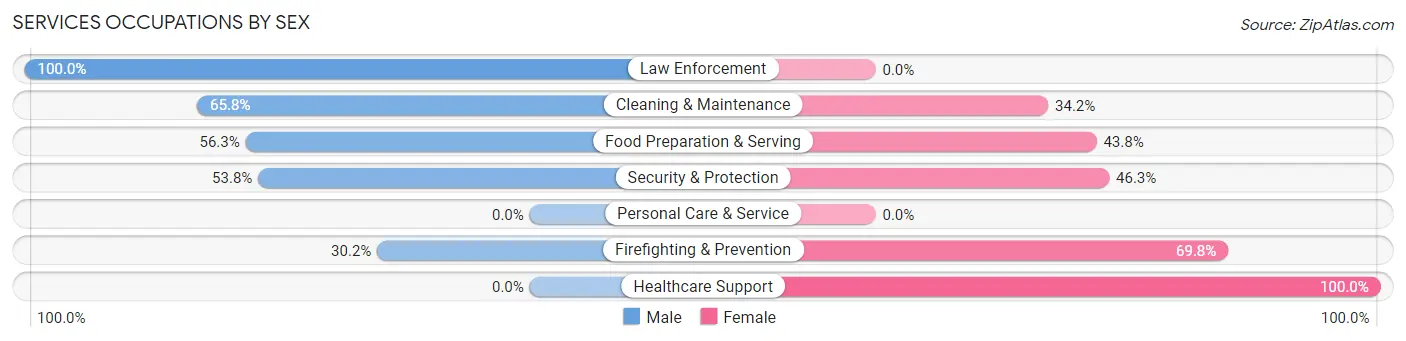
| Occupation | Male | Female |
| Healthcare Support | 0 (0.0%) | 27 (100.0%) |
| Security & Protection | 43 (53.7%) | 37 (46.3%) |
| Firefighting & Prevention | 16 (30.2%) | 37 (69.8%) |
| Law Enforcement | 27 (100.0%) | 0 (0.0%) |
| Food Preparation & Serving | 9 (56.2%) | 7 (43.8%) |
| Cleaning & Maintenance | 79 (65.8%) | 41 (34.2%) |
| Personal Care & Service | 0 (0.0%) | 0 (0.0%) |
| Total (Category) | 131 (53.9%) | 112 (46.1%) |
| Total (Overall) | 609 (46.4%) | 703 (53.6%) |
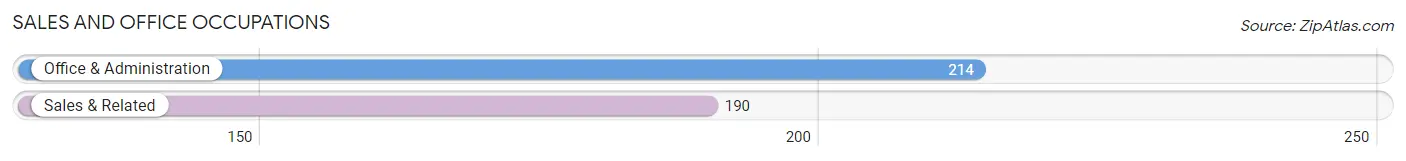
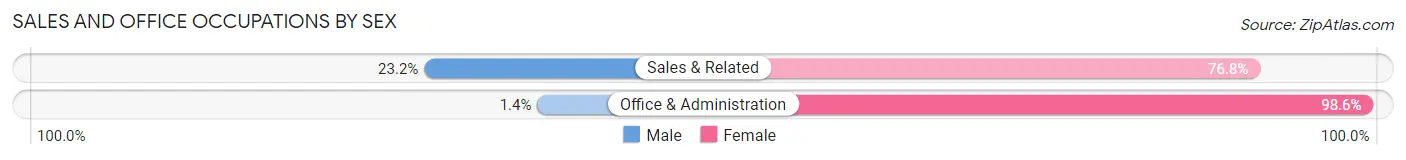
Sales and Office Occupations
The most common Sales and Office occupations in Hilliard are Office & Administration (214 | 16.3%), and Sales & Related (190 | 14.5%).
Sales and Office Occupations by Sex
| Occupation | Male | Female |
| Sales & Related | 44 (23.2%) | 146 (76.8%) |
| Office & Administration | 3 (1.4%) | 211 (98.6%) |
| Total (Category) | 47 (11.6%) | 357 (88.4%) |
| Total (Overall) | 609 (46.4%) | 703 (53.6%) |
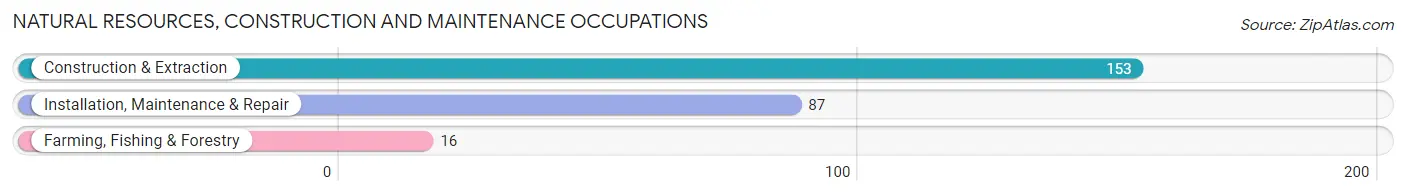
Natural Resources, Construction and Maintenance Occupations
The most common Natural Resources, Construction and Maintenance occupations in Hilliard are Construction & Extraction (153 | 11.7%), Installation, Maintenance & Repair (87 | 6.6%), and Farming, Fishing & Forestry (16 | 1.2%).
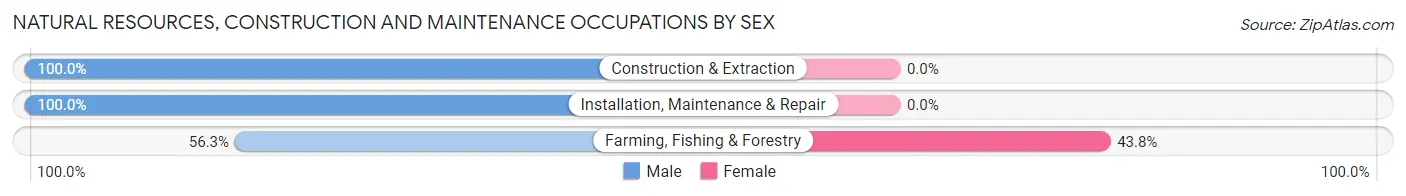
Natural Resources, Construction and Maintenance Occupations by Sex
| Occupation | Male | Female |
| Farming, Fishing & Forestry | 9 (56.2%) | 7 (43.8%) |
| Construction & Extraction | 153 (100.0%) | 0 (0.0%) |
| Installation, Maintenance & Repair | 87 (100.0%) | 0 (0.0%) |
| Total (Category) | 249 (97.3%) | 7 (2.7%) |
| Total (Overall) | 609 (46.4%) | 703 (53.6%) |
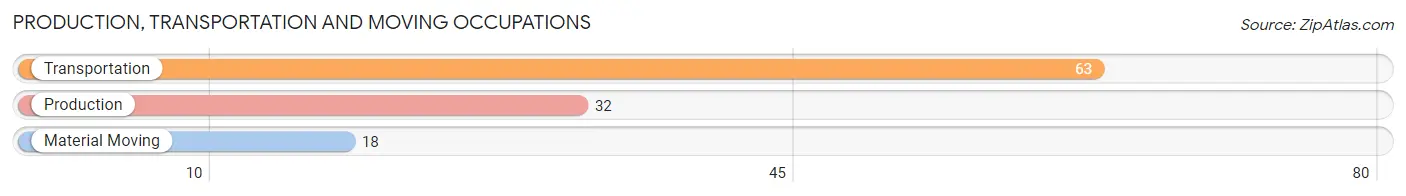
Production, Transportation and Moving Occupations
The most common Production, Transportation and Moving occupations in Hilliard are Transportation (63 | 4.8%), Production (32 | 2.4%), and Material Moving (18 | 1.4%).
Production, Transportation and Moving Occupations by Sex
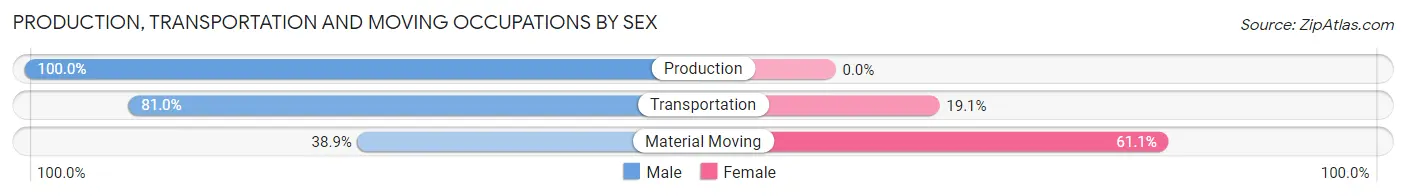
| Occupation | Male | Female |
| Production | 32 (100.0%) | 0 (0.0%) |
| Transportation | 51 (80.9%) | 12 (19.1%) |
| Material Moving | 7 (38.9%) | 11 (61.1%) |
| Total (Category) | 90 (79.6%) | 23 (20.3%) |
| Total (Overall) | 609 (46.4%) | 703 (53.6%) |
Employment Industries by Sex in Hilliard
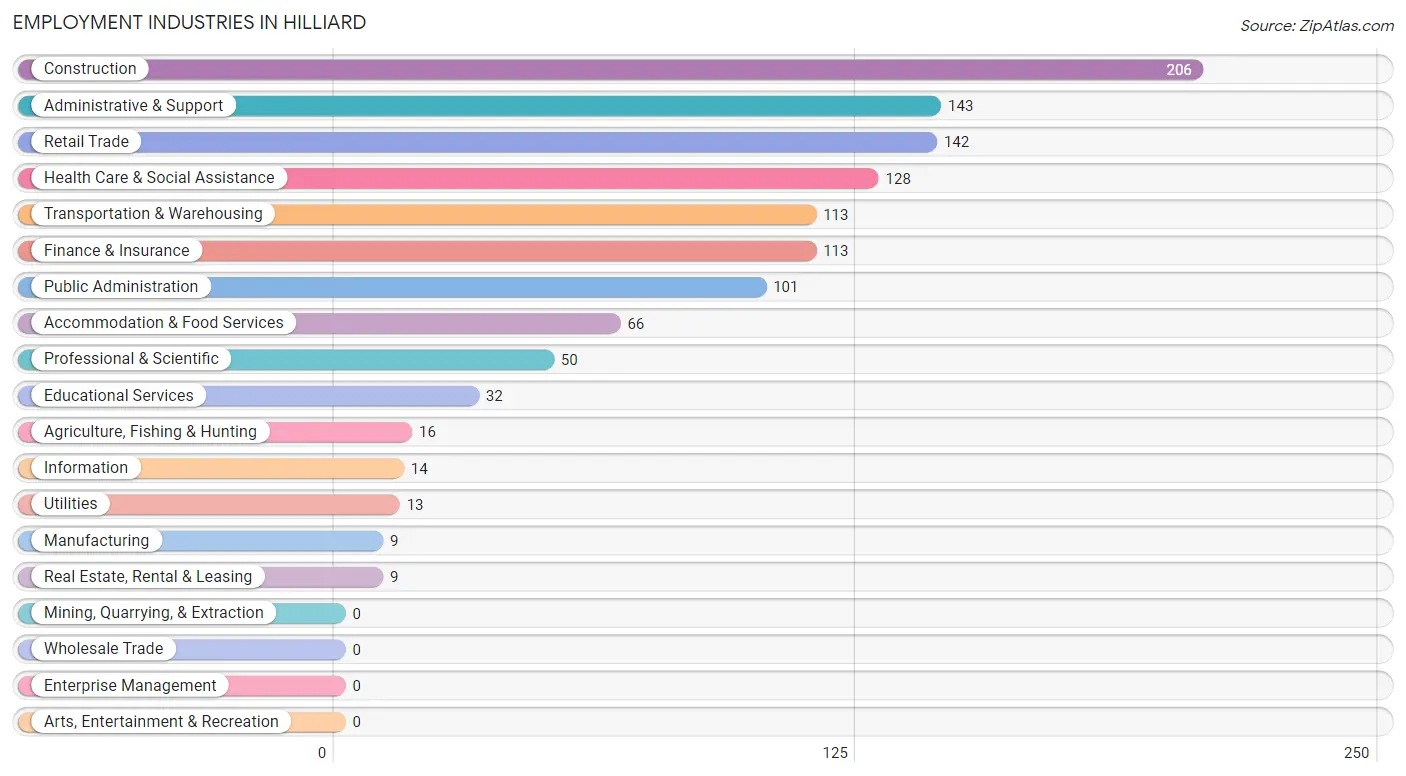
Employment Industries in Hilliard
The major employment industries in Hilliard include Construction (206 | 15.7%), Administrative & Support (143 | 10.9%), Retail Trade (142 | 10.8%), Health Care & Social Assistance (128 | 9.8%), and Transportation & Warehousing (113 | 8.6%).
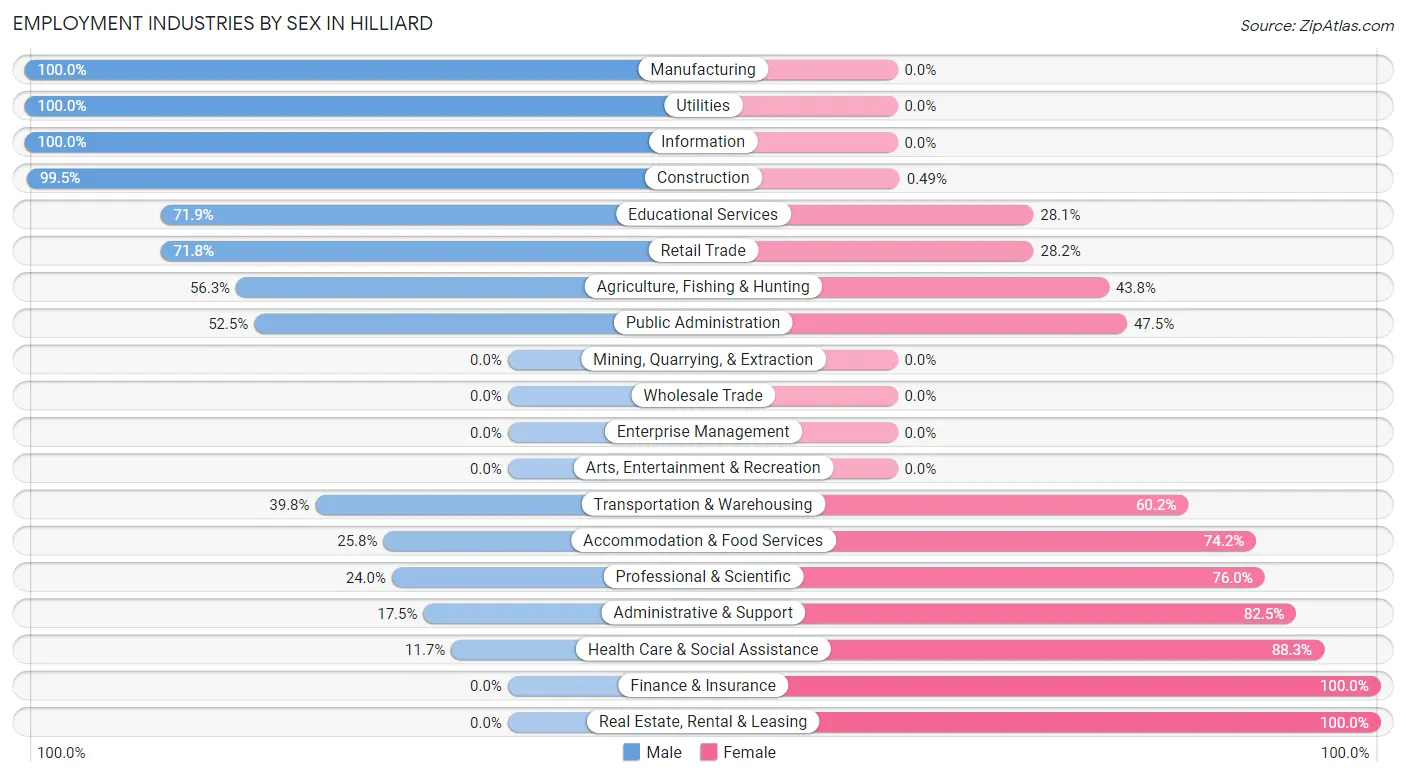
Employment Industries by Sex in Hilliard
The Hilliard industries that see more men than women are Manufacturing (100.0%), Utilities (100.0%), and Information (100.0%), whereas the industries that tend to have a higher number of women are Finance & Insurance (100.0%), Real Estate, Rental & Leasing (100.0%), and Health Care & Social Assistance (88.3%).
| Industry | Male | Female |
| Agriculture, Fishing & Hunting | 9 (56.2%) | 7 (43.8%) |
| Mining, Quarrying, & Extraction | 0 (0.0%) | 0 (0.0%) |
| Construction | 205 (99.5%) | 1 (0.5%) |
| Manufacturing | 9 (100.0%) | 0 (0.0%) |
| Wholesale Trade | 0 (0.0%) | 0 (0.0%) |
| Retail Trade | 102 (71.8%) | 40 (28.2%) |
| Transportation & Warehousing | 45 (39.8%) | 68 (60.2%) |
| Utilities | 13 (100.0%) | 0 (0.0%) |
| Information | 14 (100.0%) | 0 (0.0%) |
| Finance & Insurance | 0 (0.0%) | 113 (100.0%) |
| Real Estate, Rental & Leasing | 0 (0.0%) | 9 (100.0%) |
| Professional & Scientific | 12 (24.0%) | 38 (76.0%) |
| Enterprise Management | 0 (0.0%) | 0 (0.0%) |
| Administrative & Support | 25 (17.5%) | 118 (82.5%) |
| Educational Services | 23 (71.9%) | 9 (28.1%) |
| Health Care & Social Assistance | 15 (11.7%) | 113 (88.3%) |
| Arts, Entertainment & Recreation | 0 (0.0%) | 0 (0.0%) |
| Accommodation & Food Services | 17 (25.8%) | 49 (74.2%) |
| Public Administration | 53 (52.5%) | 48 (47.5%) |
| Total | 609 (46.4%) | 703 (53.6%) |
Education in Hilliard
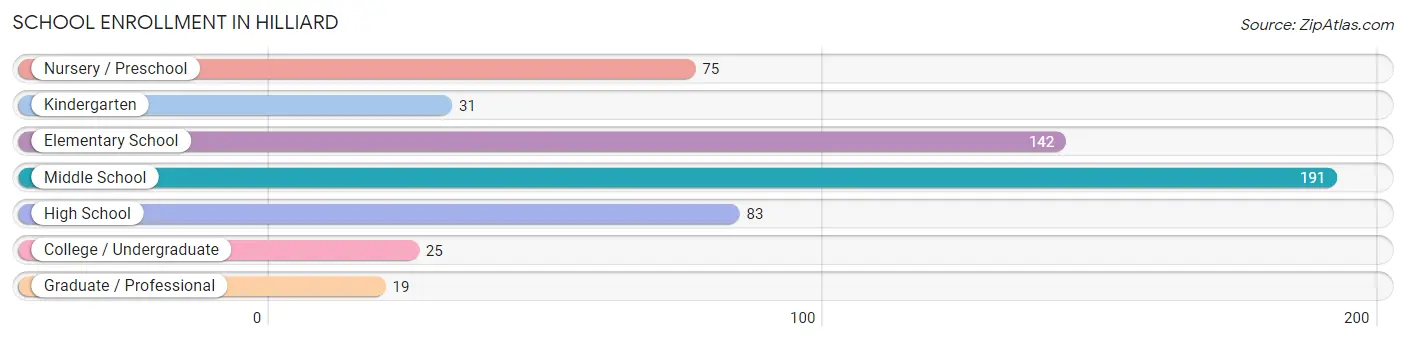
School Enrollment in Hilliard
The most common levels of schooling among the 566 students in Hilliard are middle school (191 | 33.8%), elementary school (142 | 25.1%), and high school (83 | 14.7%).
| School Level | # Students | % Students |
| Nursery / Preschool | 75 | 13.3% |
| Kindergarten | 31 | 5.5% |
| Elementary School | 142 | 25.1% |
| Middle School | 191 | 33.8% |
| High School | 83 | 14.7% |
| College / Undergraduate | 25 | 4.4% |
| Graduate / Professional | 19 | 3.4% |
| Total | 566 | 100.0% |
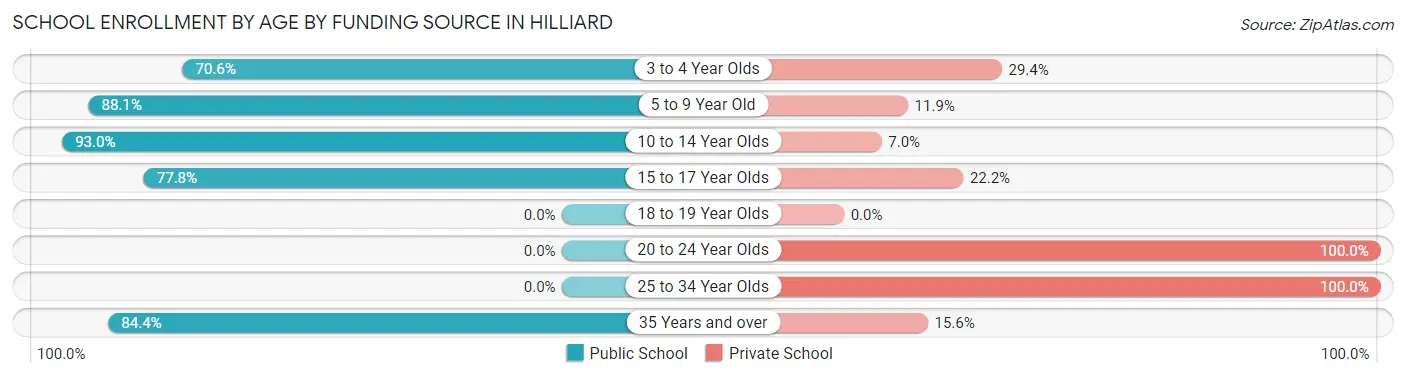
School Enrollment by Age by Funding Source in Hilliard
Out of a total of 566 students who are enrolled in schools in Hilliard, 86 (15.2%) attend a private institution, while the remaining 480 (84.8%) are enrolled in public schools. The age group of 20 to 24 year olds has the highest likelihood of being enrolled in private schools, with 3 (100.0% in the age bracket) enrolled. Conversely, the age group of 10 to 14 year olds has the lowest likelihood of being enrolled in a private school, with 212 (93.0% in the age bracket) attending a public institution.
| Age Bracket | Public School | Private School |
| 3 to 4 Year Olds | 36 (70.6%) | 15 (29.4%) |
| 5 to 9 Year Old | 170 (88.1%) | 23 (11.9%) |
| 10 to 14 Year Olds | 212 (93.0%) | 16 (7.0%) |
| 15 to 17 Year Olds | 35 (77.8%) | 10 (22.2%) |
| 18 to 19 Year Olds | 0 (0.0%) | 0 (0.0%) |
| 20 to 24 Year Olds | 0 (0.0%) | 3 (100.0%) |
| 25 to 34 Year Olds | 0 (0.0%) | 14 (100.0%) |
| 35 Years and over | 27 (84.4%) | 5 (15.6%) |
| Total | 480 (84.8%) | 86 (15.2%) |
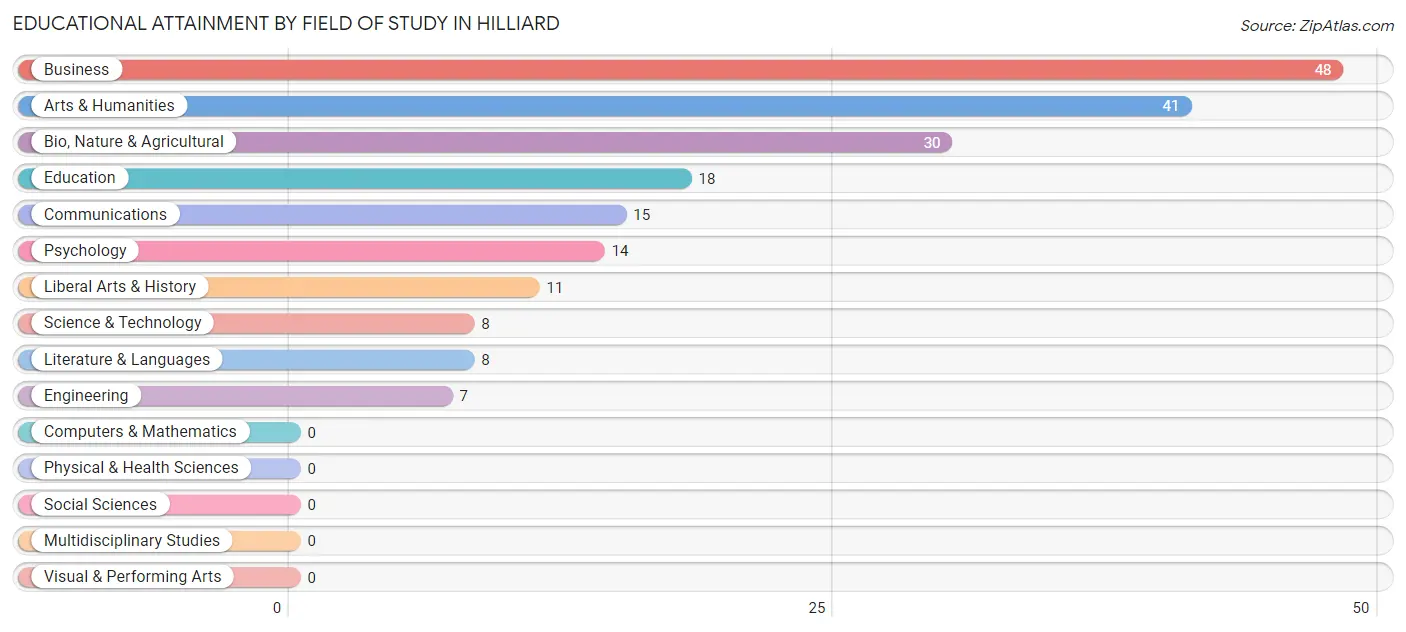
Educational Attainment by Field of Study in Hilliard
Business (48 | 24.0%), arts & humanities (41 | 20.5%), bio, nature & agricultural (30 | 15.0%), education (18 | 9.0%), and communications (15 | 7.5%) are the most common fields of study among 200 individuals in Hilliard who have obtained a bachelor's degree or higher.
| Field of Study | # Graduates | % Graduates |
| Computers & Mathematics | 0 | 0.0% |
| Bio, Nature & Agricultural | 30 | 15.0% |
| Physical & Health Sciences | 0 | 0.0% |
| Psychology | 14 | 7.0% |
| Social Sciences | 0 | 0.0% |
| Engineering | 7 | 3.5% |
| Multidisciplinary Studies | 0 | 0.0% |
| Science & Technology | 8 | 4.0% |
| Business | 48 | 24.0% |
| Education | 18 | 9.0% |
| Literature & Languages | 8 | 4.0% |
| Liberal Arts & History | 11 | 5.5% |
| Visual & Performing Arts | 0 | 0.0% |
| Communications | 15 | 7.5% |
| Arts & Humanities | 41 | 20.5% |
| Total | 200 | 100.0% |
Transportation & Commute in Hilliard
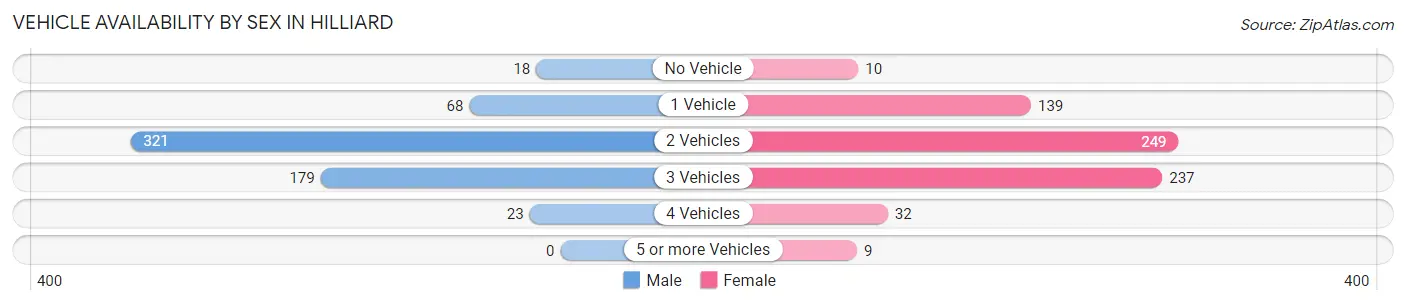
Vehicle Availability by Sex in Hilliard
The most prevalent vehicle ownership categories in Hilliard are males with 2 vehicles (321, accounting for 52.7%) and females with 2 vehicles (249, making up 47.5%).
| Vehicles Available | Male | Female |
| No Vehicle | 18 (3.0%) | 10 (1.5%) |
| 1 Vehicle | 68 (11.2%) | 139 (20.6%) |
| 2 Vehicles | 321 (52.7%) | 249 (36.8%) |
| 3 Vehicles | 179 (29.4%) | 237 (35.1%) |
| 4 Vehicles | 23 (3.8%) | 32 (4.7%) |
| 5 or more Vehicles | 0 (0.0%) | 9 (1.3%) |
| Total | 609 (100.0%) | 676 (100.0%) |
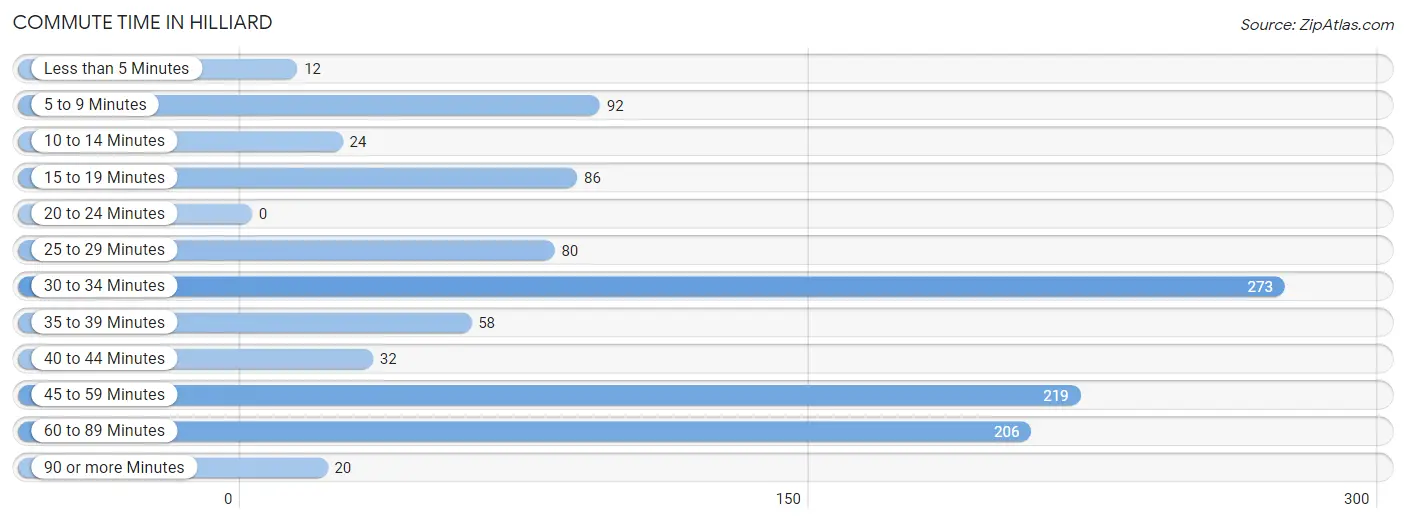
Commute Time in Hilliard
The most frequently occuring commute durations in Hilliard are 30 to 34 minutes (273 commuters, 24.8%), 45 to 59 minutes (219 commuters, 19.9%), and 60 to 89 minutes (206 commuters, 18.7%).
| Commute Time | # Commuters | % Commuters |
| Less than 5 Minutes | 12 | 1.1% |
| 5 to 9 Minutes | 92 | 8.4% |
| 10 to 14 Minutes | 24 | 2.2% |
| 15 to 19 Minutes | 86 | 7.8% |
| 20 to 24 Minutes | 0 | 0.0% |
| 25 to 29 Minutes | 80 | 7.3% |
| 30 to 34 Minutes | 273 | 24.8% |
| 35 to 39 Minutes | 58 | 5.3% |
| 40 to 44 Minutes | 32 | 2.9% |
| 45 to 59 Minutes | 219 | 19.9% |
| 60 to 89 Minutes | 206 | 18.7% |
| 90 or more Minutes | 20 | 1.8% |
Commute Time by Sex in Hilliard
The most common commute times in Hilliard are 60 to 89 minutes (122 commuters, 24.6%) for males and 30 to 34 minutes (169 commuters, 27.8%) for females.
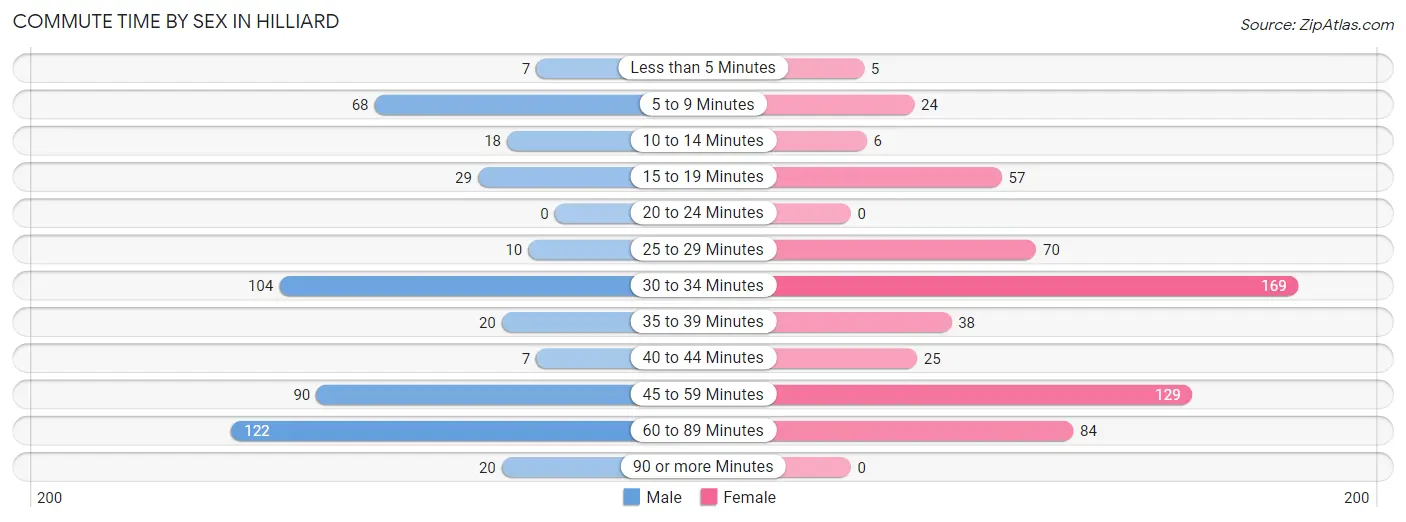
| Commute Time | Male | Female |
| Less than 5 Minutes | 7 (1.4%) | 5 (0.8%) |
| 5 to 9 Minutes | 68 (13.7%) | 24 (4.0%) |
| 10 to 14 Minutes | 18 (3.6%) | 6 (1.0%) |
| 15 to 19 Minutes | 29 (5.9%) | 57 (9.4%) |
| 20 to 24 Minutes | 0 (0.0%) | 0 (0.0%) |
| 25 to 29 Minutes | 10 (2.0%) | 70 (11.5%) |
| 30 to 34 Minutes | 104 (21.0%) | 169 (27.8%) |
| 35 to 39 Minutes | 20 (4.0%) | 38 (6.3%) |
| 40 to 44 Minutes | 7 (1.4%) | 25 (4.1%) |
| 45 to 59 Minutes | 90 (18.2%) | 129 (21.2%) |
| 60 to 89 Minutes | 122 (24.6%) | 84 (13.8%) |
| 90 or more Minutes | 20 (4.0%) | 0 (0.0%) |
Time of Departure to Work by Sex in Hilliard
The most frequent times of departure to work in Hilliard are 6:00 AM to 6:29 AM (147, 29.7%) for males and 7:00 AM to 7:29 AM (196, 32.3%) for females.
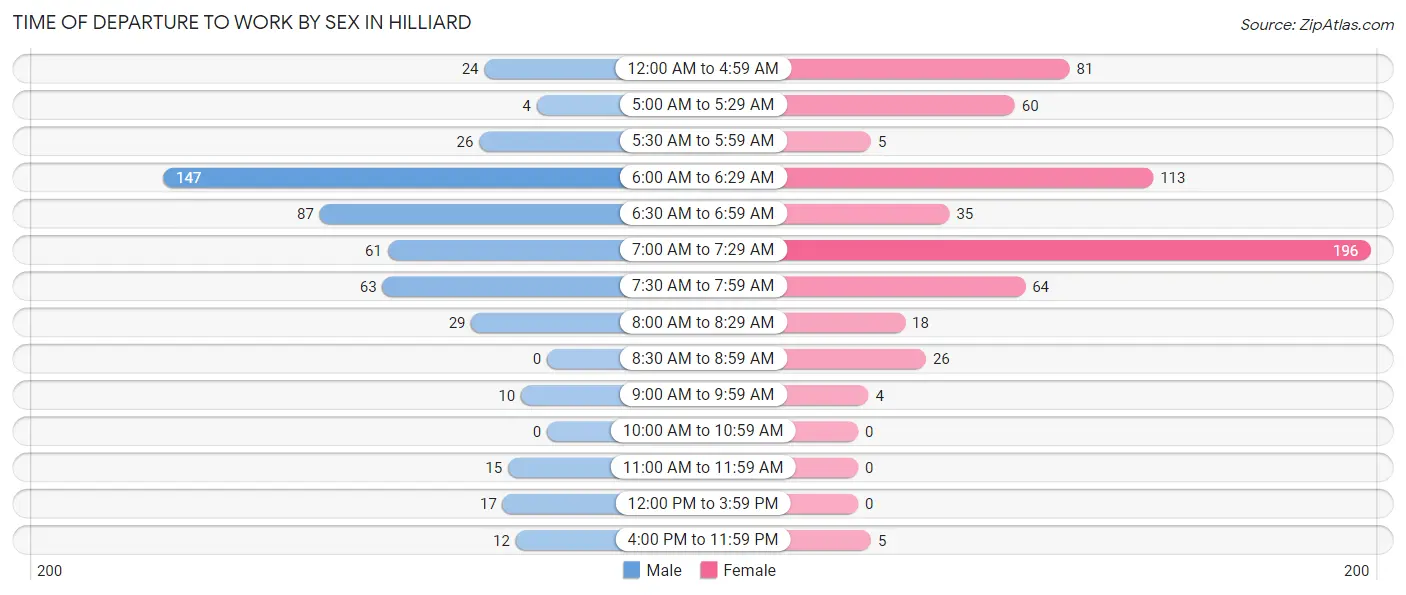
| Time of Departure | Male | Female |
| 12:00 AM to 4:59 AM | 24 (4.9%) | 81 (13.3%) |
| 5:00 AM to 5:29 AM | 4 (0.8%) | 60 (9.9%) |
| 5:30 AM to 5:59 AM | 26 (5.2%) | 5 (0.8%) |
| 6:00 AM to 6:29 AM | 147 (29.7%) | 113 (18.6%) |
| 6:30 AM to 6:59 AM | 87 (17.6%) | 35 (5.8%) |
| 7:00 AM to 7:29 AM | 61 (12.3%) | 196 (32.3%) |
| 7:30 AM to 7:59 AM | 63 (12.7%) | 64 (10.5%) |
| 8:00 AM to 8:29 AM | 29 (5.9%) | 18 (3.0%) |
| 8:30 AM to 8:59 AM | 0 (0.0%) | 26 (4.3%) |
| 9:00 AM to 9:59 AM | 10 (2.0%) | 4 (0.7%) |
| 10:00 AM to 10:59 AM | 0 (0.0%) | 0 (0.0%) |
| 11:00 AM to 11:59 AM | 15 (3.0%) | 0 (0.0%) |
| 12:00 PM to 3:59 PM | 17 (3.4%) | 0 (0.0%) |
| 4:00 PM to 11:59 PM | 12 (2.4%) | 5 (0.8%) |
| Total | 495 (100.0%) | 607 (100.0%) |
Housing Occupancy in Hilliard
Occupancy by Ownership in Hilliard
Of the total 1,113 dwellings in Hilliard, owner-occupied units account for 611 (54.9%), while renter-occupied units make up 502 (45.1%).
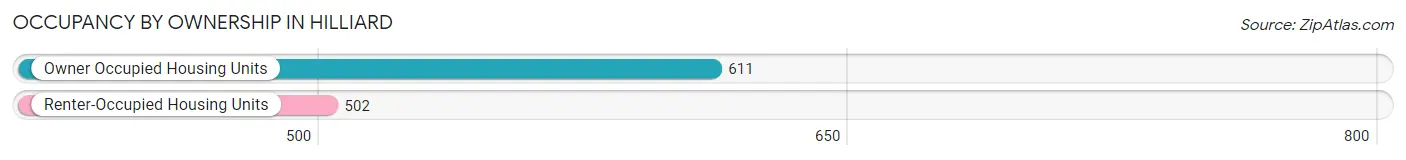
| Occupancy | # Housing Units | % Housing Units |
| Owner Occupied Housing Units | 611 | 54.9% |
| Renter-Occupied Housing Units | 502 | 45.1% |
| Total Occupied Housing Units | 1,113 | 100.0% |
Occupancy by Household Size in Hilliard
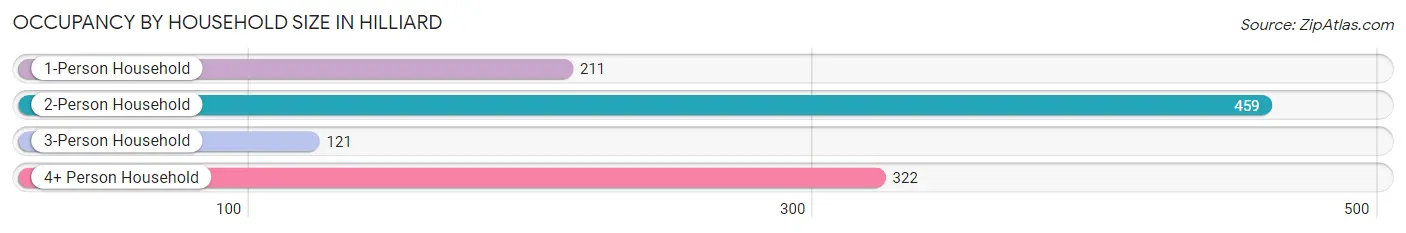
| Household Size | # Housing Units | % Housing Units |
| 1-Person Household | 211 | 19.0% |
| 2-Person Household | 459 | 41.2% |
| 3-Person Household | 121 | 10.9% |
| 4+ Person Household | 322 | 28.9% |
| Total Housing Units | 1,113 | 100.0% |
Occupancy by Ownership by Household Size in Hilliard
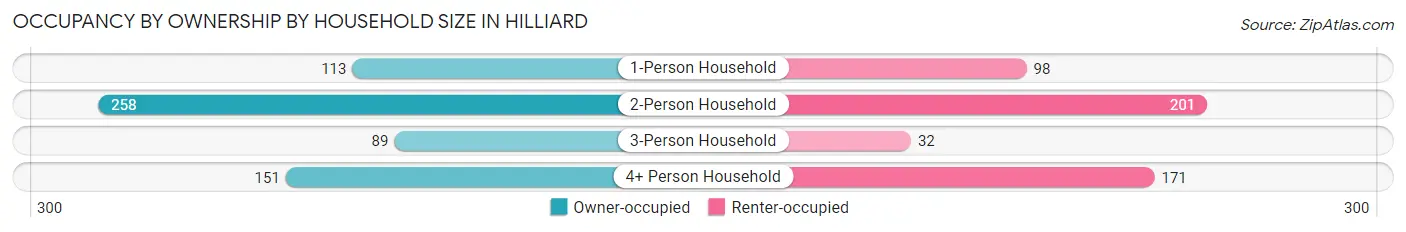
| Household Size | Owner-occupied | Renter-occupied |
| 1-Person Household | 113 (53.5%) | 98 (46.5%) |
| 2-Person Household | 258 (56.2%) | 201 (43.8%) |
| 3-Person Household | 89 (73.6%) | 32 (26.5%) |
| 4+ Person Household | 151 (46.9%) | 171 (53.1%) |
| Total Housing Units | 611 (54.9%) | 502 (45.1%) |
Occupancy by Educational Attainment in Hilliard
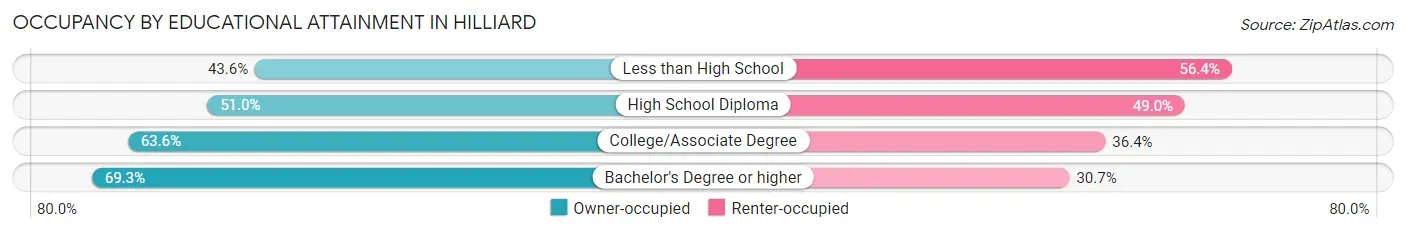
| Household Size | Owner-occupied | Renter-occupied |
| Less than High School | 82 (43.6%) | 106 (56.4%) |
| High School Diploma | 273 (51.0%) | 262 (49.0%) |
| College/Associate Degree | 161 (63.6%) | 92 (36.4%) |
| Bachelor's Degree or higher | 95 (69.3%) | 42 (30.7%) |
Occupancy by Age of Householder in Hilliard
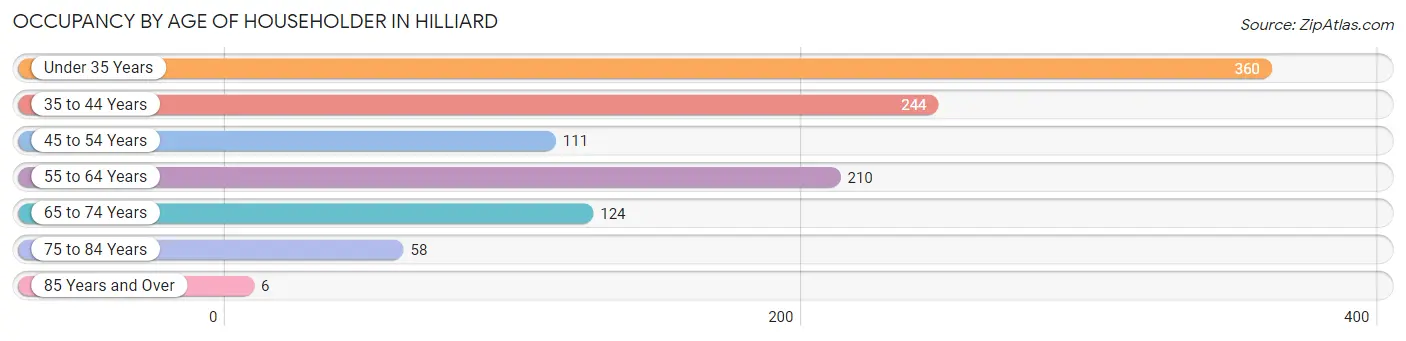
| Age Bracket | # Households | % Households |
| Under 35 Years | 360 | 32.4% |
| 35 to 44 Years | 244 | 21.9% |
| 45 to 54 Years | 111 | 10.0% |
| 55 to 64 Years | 210 | 18.9% |
| 65 to 74 Years | 124 | 11.1% |
| 75 to 84 Years | 58 | 5.2% |
| 85 Years and Over | 6 | 0.5% |
| Total | 1,113 | 100.0% |
Housing Finances in Hilliard
Median Income by Occupancy in Hilliard
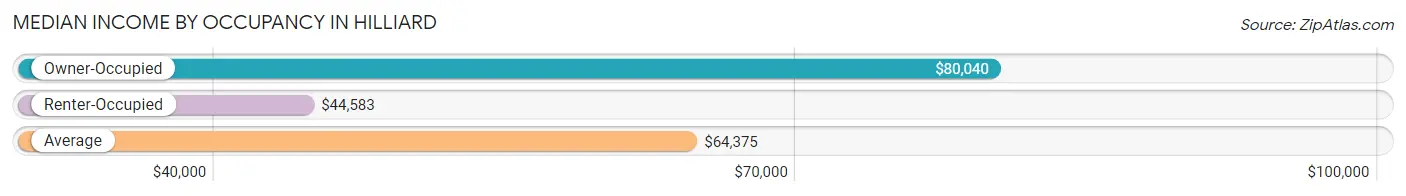
| Occupancy Type | # Households | Median Income |
| Owner-Occupied | 611 (54.9%) | $80,040 |
| Renter-Occupied | 502 (45.1%) | $44,583 |
| Average | 1,113 (100.0%) | $64,375 |
Occupancy by Householder Income Bracket in Hilliard
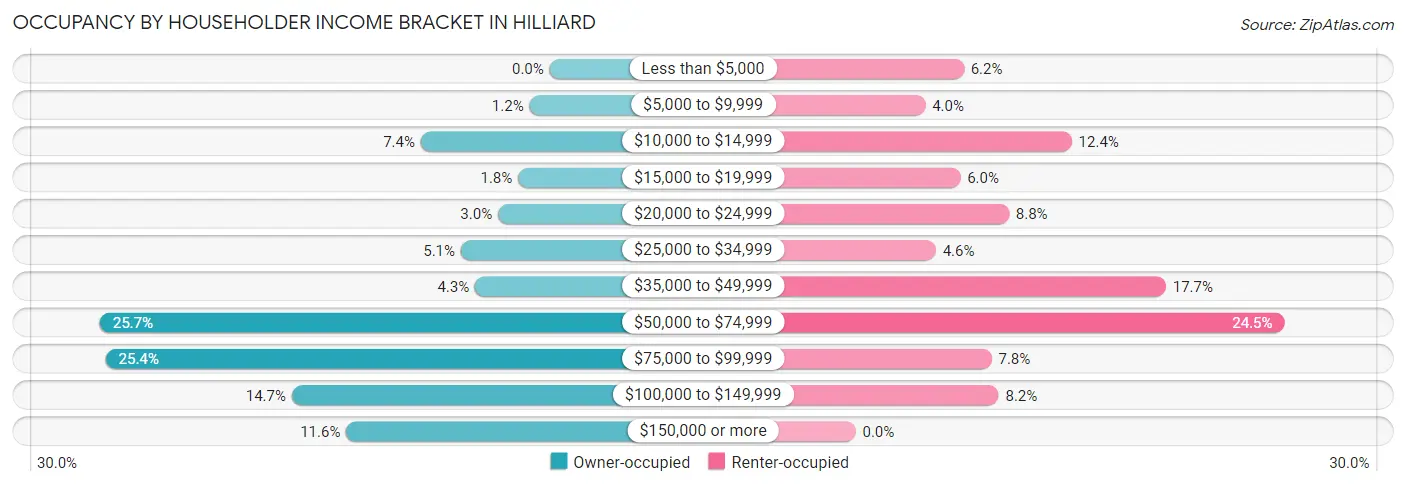
| Income Bracket | Owner-occupied | Renter-occupied |
| Less than $5,000 | 0 (0.0%) | 31 (6.2%) |
| $5,000 to $9,999 | 7 (1.1%) | 20 (4.0%) |
| $10,000 to $14,999 | 45 (7.4%) | 62 (12.3%) |
| $15,000 to $19,999 | 11 (1.8%) | 30 (6.0%) |
| $20,000 to $24,999 | 18 (2.9%) | 44 (8.8%) |
| $25,000 to $34,999 | 31 (5.1%) | 23 (4.6%) |
| $35,000 to $49,999 | 26 (4.3%) | 89 (17.7%) |
| $50,000 to $74,999 | 157 (25.7%) | 123 (24.5%) |
| $75,000 to $99,999 | 155 (25.4%) | 39 (7.8%) |
| $100,000 to $149,999 | 90 (14.7%) | 41 (8.2%) |
| $150,000 or more | 71 (11.6%) | 0 (0.0%) |
| Total | 611 (100.0%) | 502 (100.0%) |
Monthly Housing Cost Tiers in Hilliard
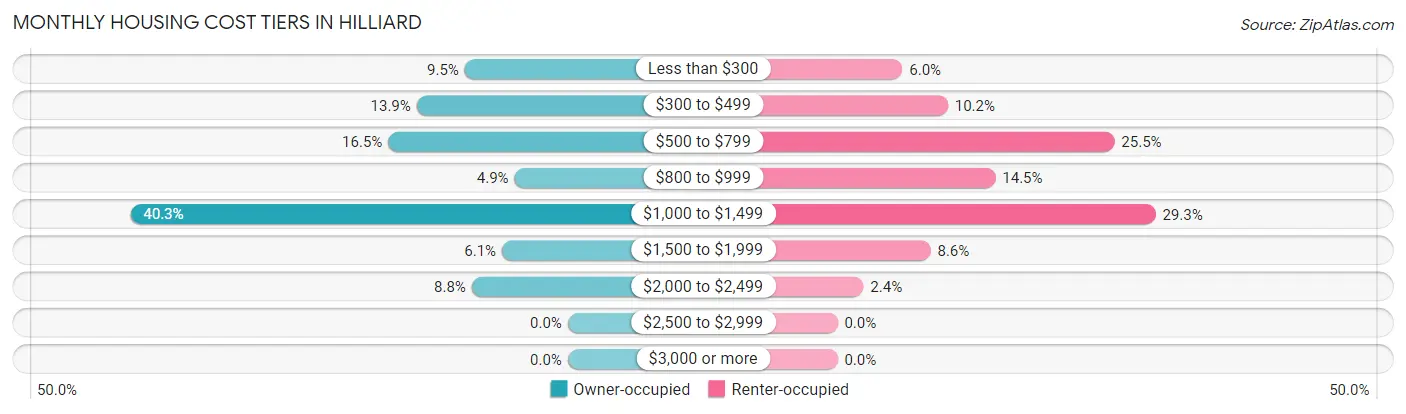
| Monthly Cost | Owner-occupied | Renter-occupied |
| Less than $300 | 58 (9.5%) | 30 (6.0%) |
| $300 to $499 | 85 (13.9%) | 51 (10.2%) |
| $500 to $799 | 101 (16.5%) | 128 (25.5%) |
| $800 to $999 | 30 (4.9%) | 73 (14.5%) |
| $1,000 to $1,499 | 246 (40.3%) | 147 (29.3%) |
| $1,500 to $1,999 | 37 (6.1%) | 43 (8.6%) |
| $2,000 to $2,499 | 54 (8.8%) | 12 (2.4%) |
| $2,500 to $2,999 | 0 (0.0%) | 0 (0.0%) |
| $3,000 or more | 0 (0.0%) | 0 (0.0%) |
| Total | 611 (100.0%) | 502 (100.0%) |
Physical Housing Characteristics in Hilliard
Housing Structures in Hilliard
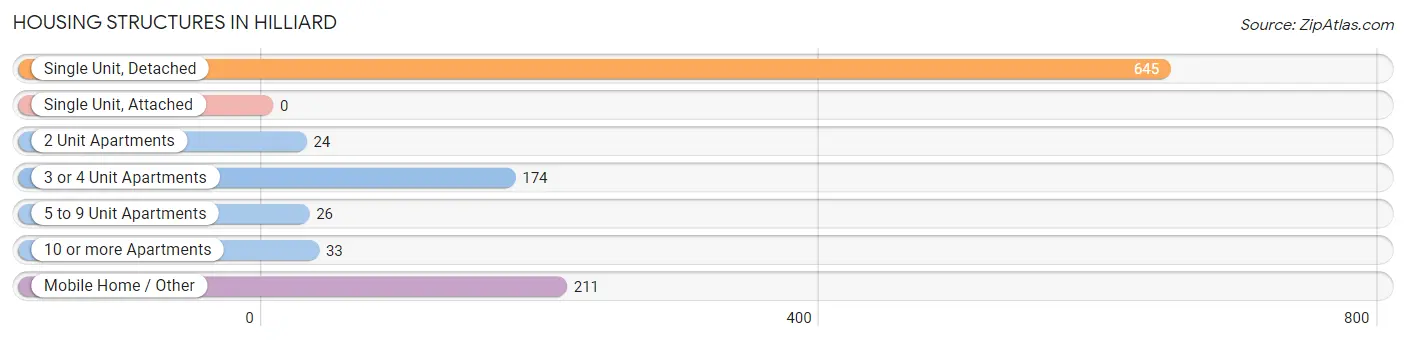
| Structure Type | # Housing Units | % Housing Units |
| Single Unit, Detached | 645 | 58.0% |
| Single Unit, Attached | 0 | 0.0% |
| 2 Unit Apartments | 24 | 2.2% |
| 3 or 4 Unit Apartments | 174 | 15.6% |
| 5 to 9 Unit Apartments | 26 | 2.3% |
| 10 or more Apartments | 33 | 3.0% |
| Mobile Home / Other | 211 | 19.0% |
| Total | 1,113 | 100.0% |
Housing Structures by Occupancy in Hilliard
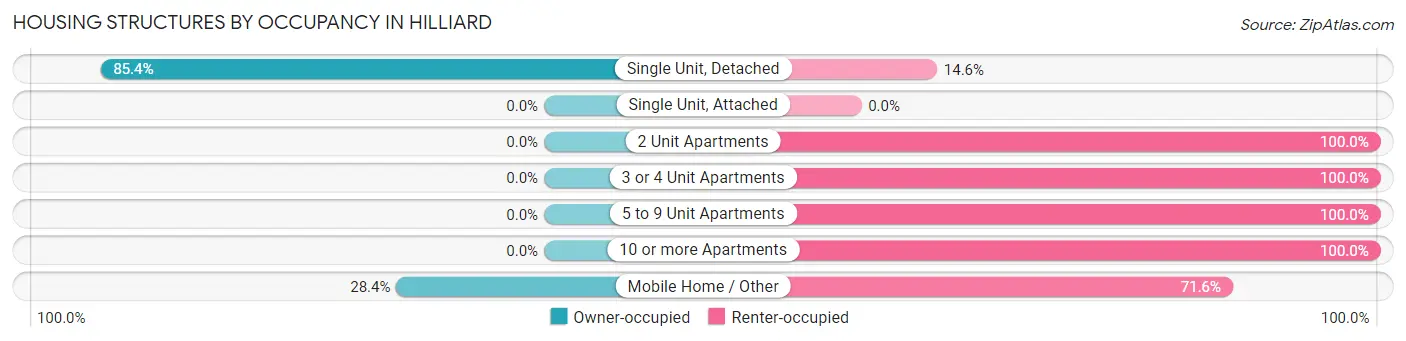
| Structure Type | Owner-occupied | Renter-occupied |
| Single Unit, Detached | 551 (85.4%) | 94 (14.6%) |
| Single Unit, Attached | 0 (0.0%) | 0 (0.0%) |
| 2 Unit Apartments | 0 (0.0%) | 24 (100.0%) |
| 3 or 4 Unit Apartments | 0 (0.0%) | 174 (100.0%) |
| 5 to 9 Unit Apartments | 0 (0.0%) | 26 (100.0%) |
| 10 or more Apartments | 0 (0.0%) | 33 (100.0%) |
| Mobile Home / Other | 60 (28.4%) | 151 (71.6%) |
| Total | 611 (54.9%) | 502 (45.1%) |
Housing Structures by Number of Rooms in Hilliard
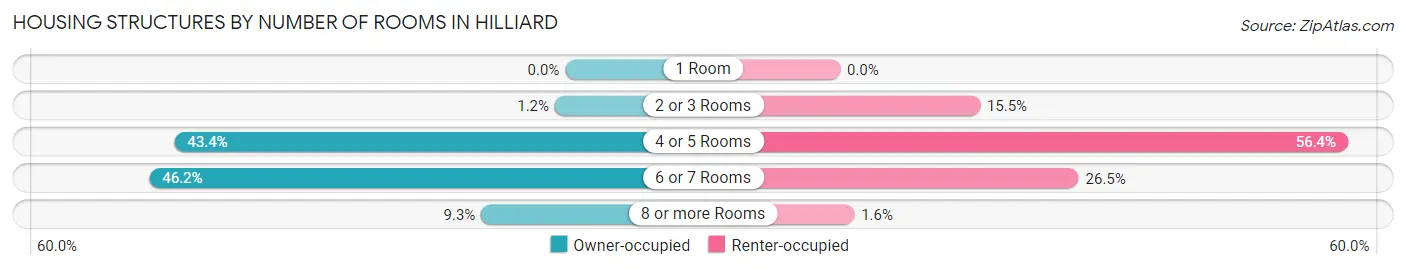
| Number of Rooms | Owner-occupied | Renter-occupied |
| 1 Room | 0 (0.0%) | 0 (0.0%) |
| 2 or 3 Rooms | 7 (1.1%) | 78 (15.5%) |
| 4 or 5 Rooms | 265 (43.4%) | 283 (56.4%) |
| 6 or 7 Rooms | 282 (46.2%) | 133 (26.5%) |
| 8 or more Rooms | 57 (9.3%) | 8 (1.6%) |
| Total | 611 (100.0%) | 502 (100.0%) |
Housing Structure by Heating Type in Hilliard
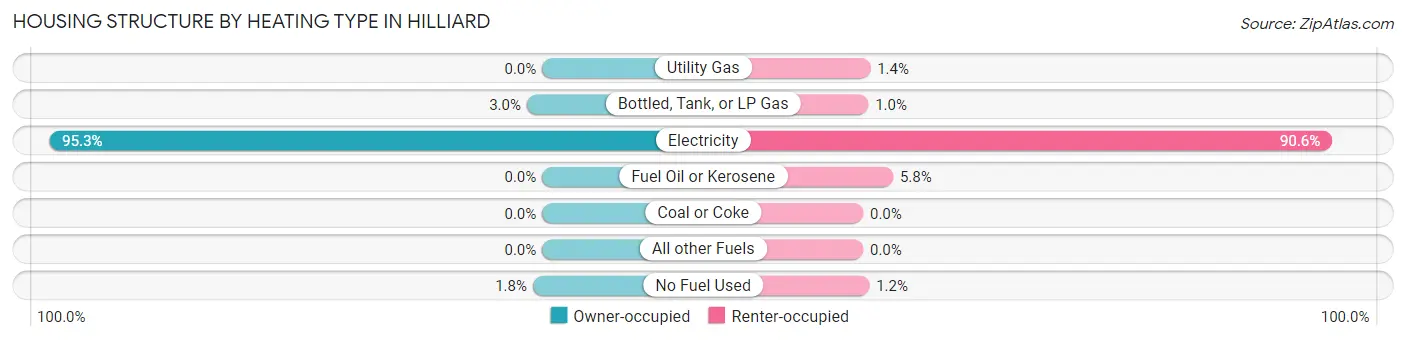
| Heating Type | Owner-occupied | Renter-occupied |
| Utility Gas | 0 (0.0%) | 7 (1.4%) |
| Bottled, Tank, or LP Gas | 18 (2.9%) | 5 (1.0%) |
| Electricity | 582 (95.3%) | 455 (90.6%) |
| Fuel Oil or Kerosene | 0 (0.0%) | 29 (5.8%) |
| Coal or Coke | 0 (0.0%) | 0 (0.0%) |
| All other Fuels | 0 (0.0%) | 0 (0.0%) |
| No Fuel Used | 11 (1.8%) | 6 (1.2%) |
| Total | 611 (100.0%) | 502 (100.0%) |
Household Vehicle Usage in Hilliard
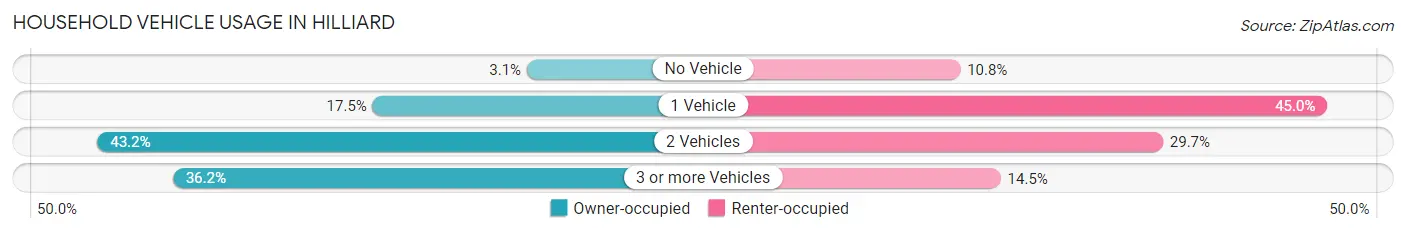
| Vehicles per Household | Owner-occupied | Renter-occupied |
| No Vehicle | 19 (3.1%) | 54 (10.8%) |
| 1 Vehicle | 107 (17.5%) | 226 (45.0%) |
| 2 Vehicles | 264 (43.2%) | 149 (29.7%) |
| 3 or more Vehicles | 221 (36.2%) | 73 (14.5%) |
| Total | 611 (100.0%) | 502 (100.0%) |
Real Estate & Mortgages in Hilliard
Real Estate and Mortgage Overview in Hilliard
| Characteristic | Without Mortgage | With Mortgage |
| Housing Units | 280 | 331 |
| Median Property Value | $215,300 | $233,500 |
| Median Household Income | $57,317 | $61 |
| Monthly Housing Costs | $495 | $0 |
| Real Estate Taxes | $1,020 | $0 |
Property Value by Mortgage Status in Hilliard
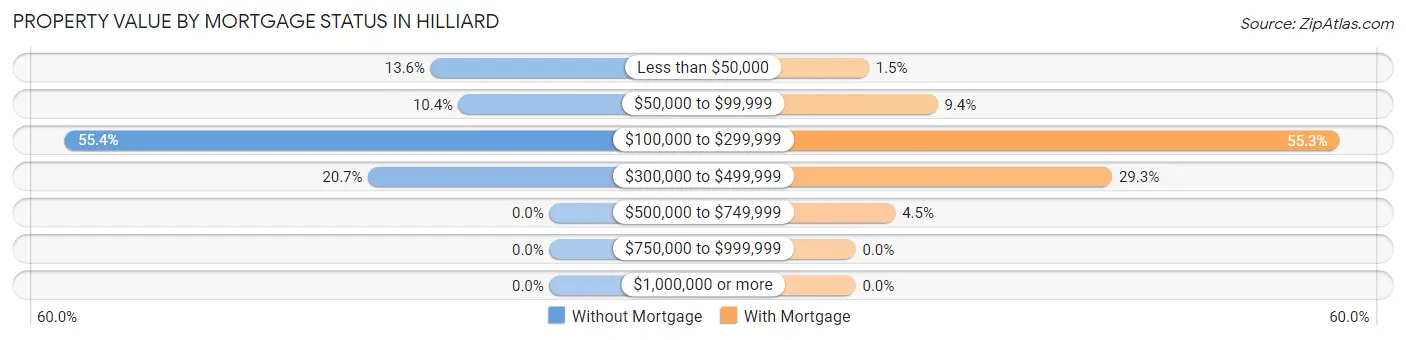
| Property Value | Without Mortgage | With Mortgage |
| Less than $50,000 | 38 (13.6%) | 5 (1.5%) |
| $50,000 to $99,999 | 29 (10.4%) | 31 (9.4%) |
| $100,000 to $299,999 | 155 (55.4%) | 183 (55.3%) |
| $300,000 to $499,999 | 58 (20.7%) | 97 (29.3%) |
| $500,000 to $749,999 | 0 (0.0%) | 15 (4.5%) |
| $750,000 to $999,999 | 0 (0.0%) | 0 (0.0%) |
| $1,000,000 or more | 0 (0.0%) | 0 (0.0%) |
| Total | 280 (100.0%) | 331 (100.0%) |
Household Income by Mortgage Status in Hilliard
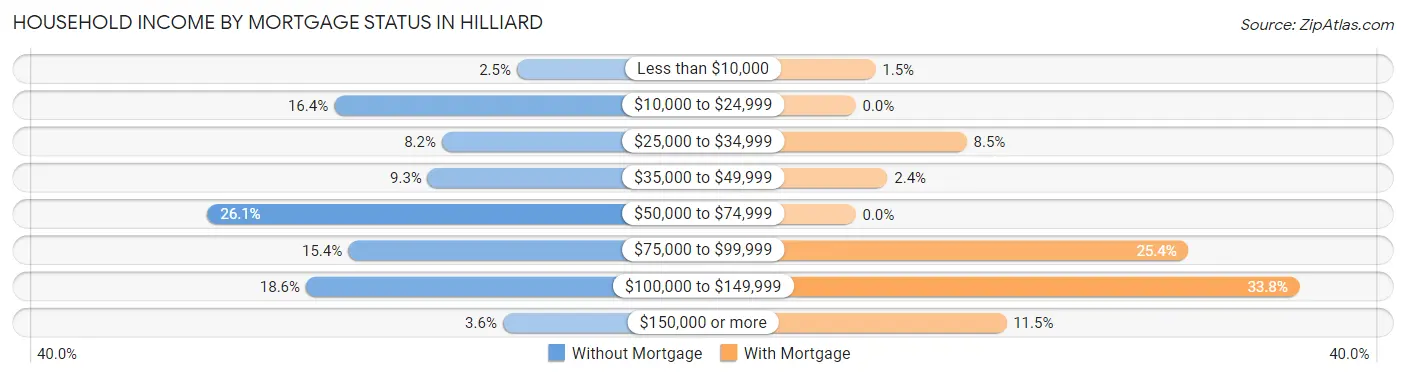
| Household Income | Without Mortgage | With Mortgage |
| Less than $10,000 | 7 (2.5%) | 5 (1.5%) |
| $10,000 to $24,999 | 46 (16.4%) | 0 (0.0%) |
| $25,000 to $34,999 | 23 (8.2%) | 28 (8.5%) |
| $35,000 to $49,999 | 26 (9.3%) | 8 (2.4%) |
| $50,000 to $74,999 | 73 (26.1%) | 0 (0.0%) |
| $75,000 to $99,999 | 43 (15.4%) | 84 (25.4%) |
| $100,000 to $149,999 | 52 (18.6%) | 112 (33.8%) |
| $150,000 or more | 10 (3.6%) | 38 (11.5%) |
| Total | 280 (100.0%) | 331 (100.0%) |
Property Value to Household Income Ratio in Hilliard
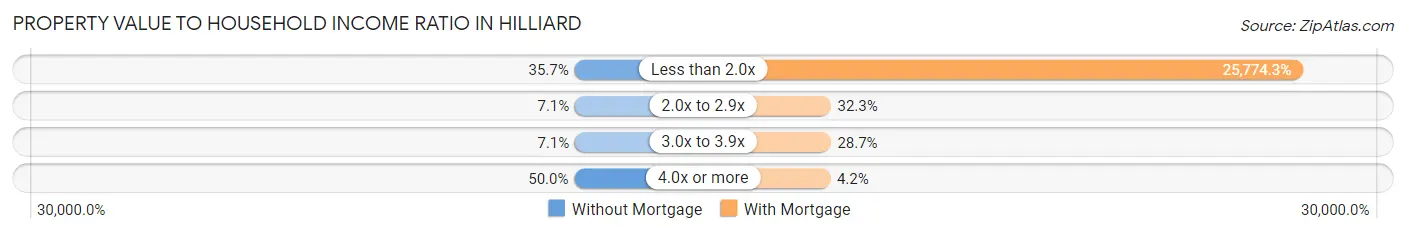
| Value-to-Income Ratio | Without Mortgage | With Mortgage |
| Less than 2.0x | 100 (35.7%) | 85,313 (25,774.3%) |
| 2.0x to 2.9x | 20 (7.1%) | 107 (32.3%) |
| 3.0x to 3.9x | 20 (7.1%) | 95 (28.7%) |
| 4.0x or more | 140 (50.0%) | 14 (4.2%) |
| Total | 280 (100.0%) | 331 (100.0%) |
Real Estate Taxes by Mortgage Status in Hilliard
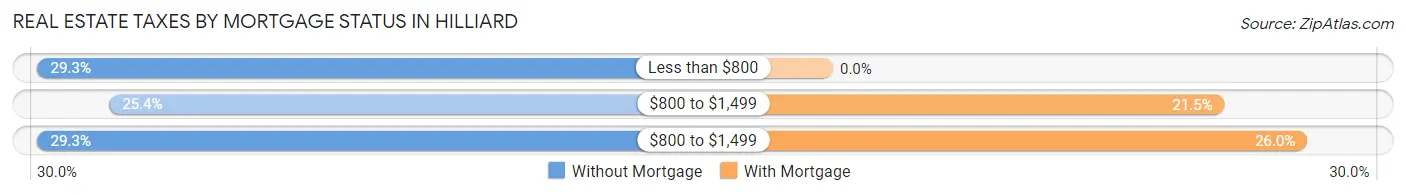
| Property Taxes | Without Mortgage | With Mortgage |
| Less than $800 | 82 (29.3%) | 0 (0.0%) |
| $800 to $1,499 | 71 (25.4%) | 71 (21.4%) |
| $800 to $1,499 | 82 (29.3%) | 86 (26.0%) |
| Total | 280 (100.0%) | 331 (100.0%) |
Health & Disability in Hilliard
Health Insurance Coverage by Age in Hilliard
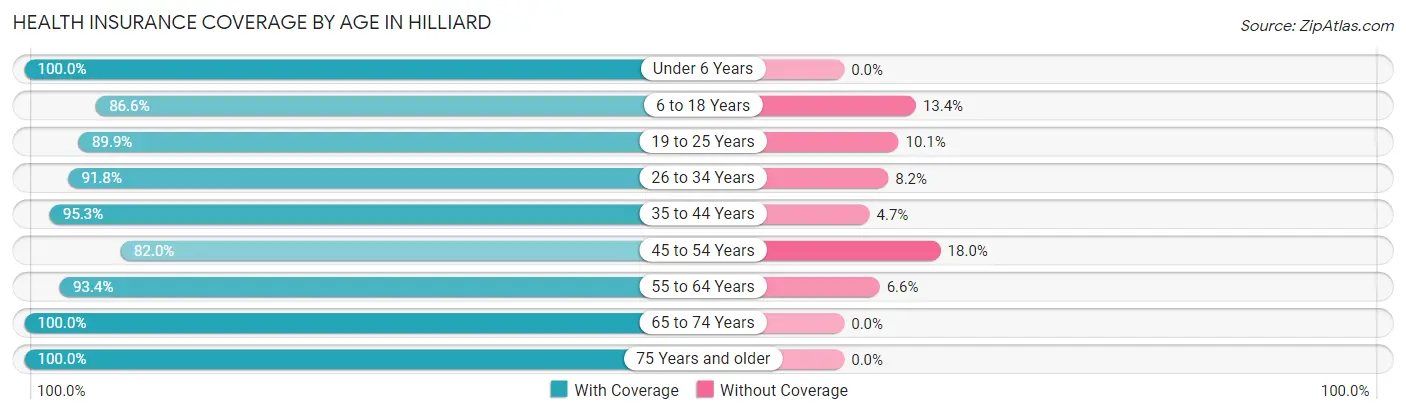
| Age Bracket | With Coverage | Without Coverage |
| Under 6 Years | 346 (100.0%) | 0 (0.0%) |
| 6 to 18 Years | 389 (86.6%) | 60 (13.4%) |
| 19 to 25 Years | 213 (89.9%) | 24 (10.1%) |
| 26 to 34 Years | 459 (91.8%) | 41 (8.2%) |
| 35 to 44 Years | 424 (95.3%) | 21 (4.7%) |
| 45 to 54 Years | 178 (82.0%) | 39 (18.0%) |
| 55 to 64 Years | 297 (93.4%) | 21 (6.6%) |
| 65 to 74 Years | 209 (100.0%) | 0 (0.0%) |
| 75 Years and older | 96 (100.0%) | 0 (0.0%) |
| Total | 2,611 (92.7%) | 206 (7.3%) |
Health Insurance Coverage by Citizenship Status in Hilliard
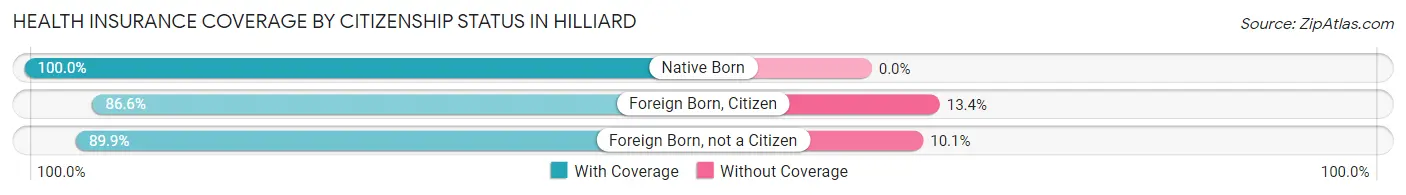
| Citizenship Status | With Coverage | Without Coverage |
| Native Born | 346 (100.0%) | 0 (0.0%) |
| Foreign Born, Citizen | 389 (86.6%) | 60 (13.4%) |
| Foreign Born, not a Citizen | 213 (89.9%) | 24 (10.1%) |
Health Insurance Coverage by Household Income in Hilliard
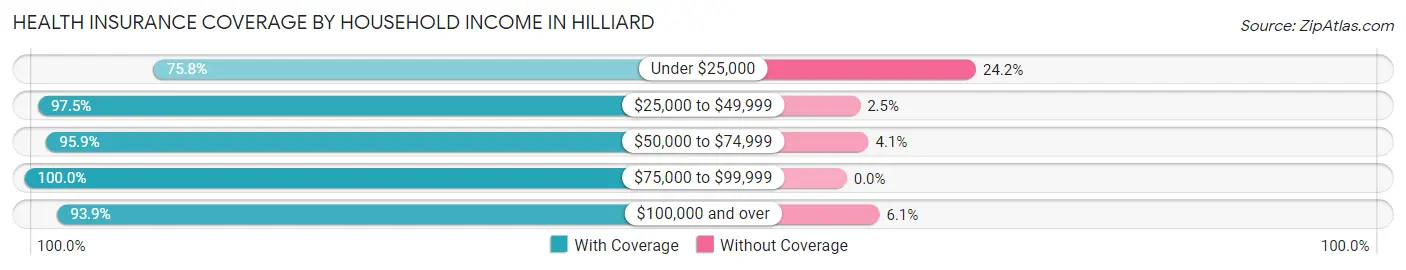
| Household Income | With Coverage | Without Coverage |
| Under $25,000 | 410 (75.8%) | 131 (24.2%) |
| $25,000 to $49,999 | 388 (97.5%) | 10 (2.5%) |
| $50,000 to $74,999 | 706 (95.9%) | 30 (4.1%) |
| $75,000 to $99,999 | 571 (100.0%) | 0 (0.0%) |
| $100,000 and over | 536 (93.9%) | 35 (6.1%) |
Public vs Private Health Insurance Coverage by Age in Hilliard
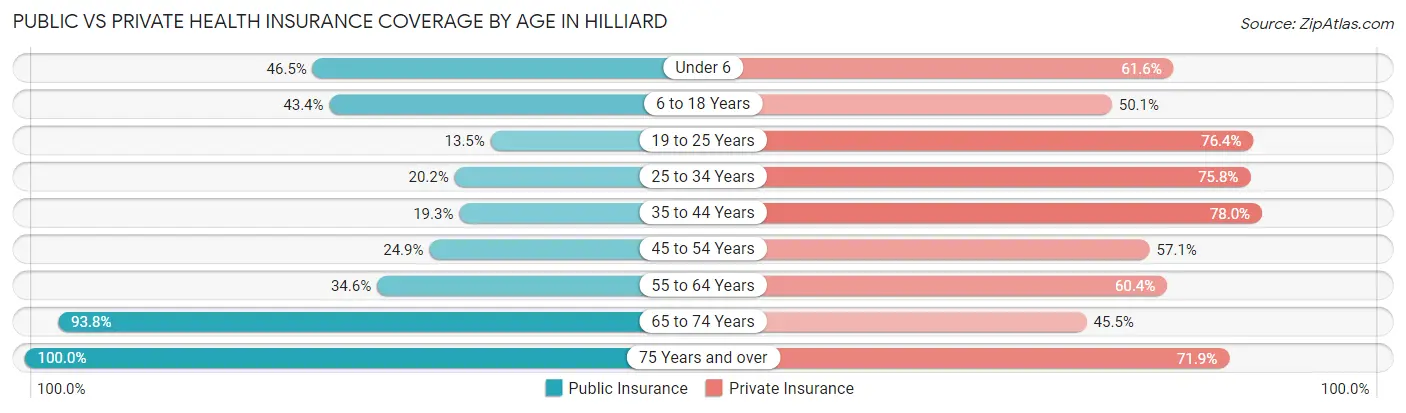
| Age Bracket | Public Insurance | Private Insurance |
| Under 6 | 161 (46.5%) | 213 (61.6%) |
| 6 to 18 Years | 195 (43.4%) | 225 (50.1%) |
| 19 to 25 Years | 32 (13.5%) | 181 (76.4%) |
| 25 to 34 Years | 101 (20.2%) | 379 (75.8%) |
| 35 to 44 Years | 86 (19.3%) | 347 (78.0%) |
| 45 to 54 Years | 54 (24.9%) | 124 (57.1%) |
| 55 to 64 Years | 110 (34.6%) | 192 (60.4%) |
| 65 to 74 Years | 196 (93.8%) | 95 (45.5%) |
| 75 Years and over | 96 (100.0%) | 69 (71.9%) |
| Total | 1,031 (36.6%) | 1,825 (64.8%) |
Disability Status by Sex by Age in Hilliard
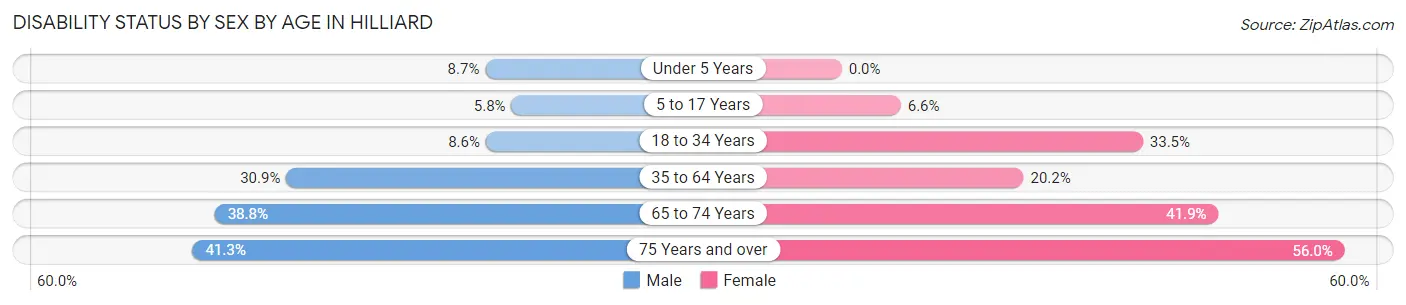
| Age Bracket | Male | Female |
| Under 5 Years | 14 (8.7%) | 0 (0.0%) |
| 5 to 17 Years | 13 (5.8%) | 18 (6.6%) |
| 18 to 34 Years | 21 (8.6%) | 174 (33.5%) |
| 35 to 64 Years | 150 (30.9%) | 100 (20.2%) |
| 65 to 74 Years | 33 (38.8%) | 52 (41.9%) |
| 75 Years and over | 19 (41.3%) | 28 (56.0%) |
Disability Class by Sex by Age in Hilliard
Disability Class: Hearing Difficulty
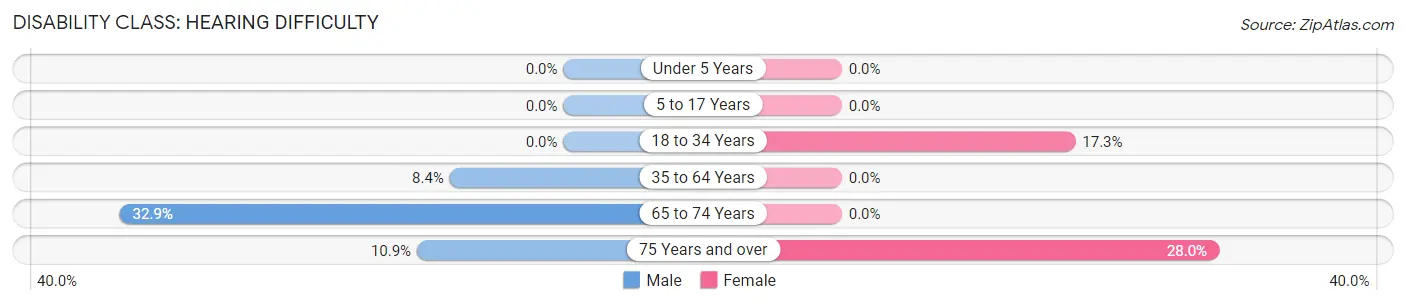
| Age Bracket | Male | Female |
| Under 5 Years | 0 (0.0%) | 0 (0.0%) |
| 5 to 17 Years | 0 (0.0%) | 0 (0.0%) |
| 18 to 34 Years | 0 (0.0%) | 90 (17.3%) |
| 35 to 64 Years | 41 (8.4%) | 0 (0.0%) |
| 65 to 74 Years | 28 (32.9%) | 0 (0.0%) |
| 75 Years and over | 5 (10.9%) | 14 (28.0%) |
Disability Class: Vision Difficulty
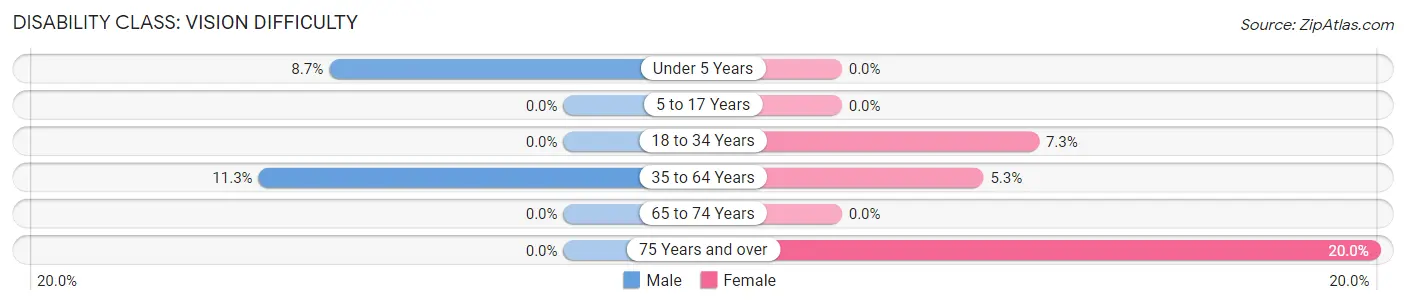
| Age Bracket | Male | Female |
| Under 5 Years | 14 (8.7%) | 0 (0.0%) |
| 5 to 17 Years | 0 (0.0%) | 0 (0.0%) |
| 18 to 34 Years | 0 (0.0%) | 38 (7.3%) |
| 35 to 64 Years | 55 (11.3%) | 26 (5.3%) |
| 65 to 74 Years | 0 (0.0%) | 0 (0.0%) |
| 75 Years and over | 0 (0.0%) | 10 (20.0%) |
Disability Class: Cognitive Difficulty
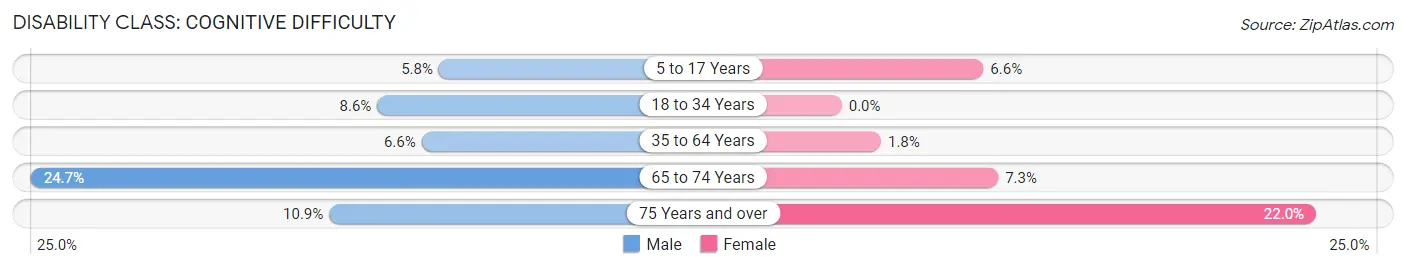
| Age Bracket | Male | Female |
| 5 to 17 Years | 13 (5.8%) | 18 (6.6%) |
| 18 to 34 Years | 21 (8.6%) | 0 (0.0%) |
| 35 to 64 Years | 32 (6.6%) | 9 (1.8%) |
| 65 to 74 Years | 21 (24.7%) | 9 (7.3%) |
| 75 Years and over | 5 (10.9%) | 11 (22.0%) |
Disability Class: Ambulatory Difficulty
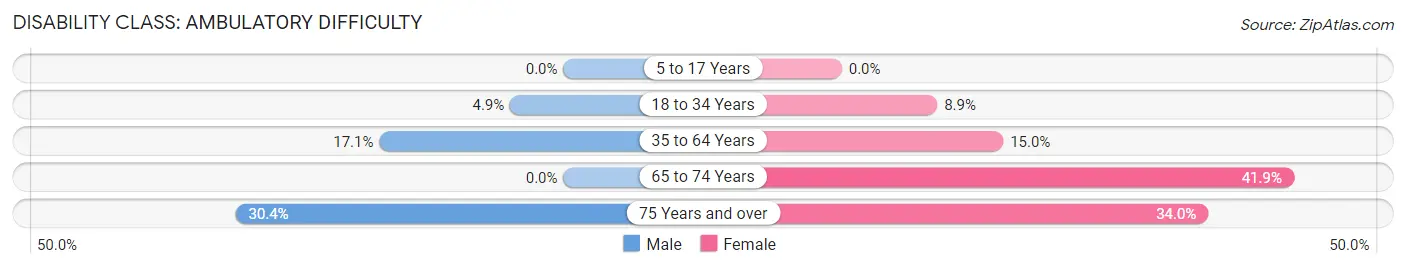
| Age Bracket | Male | Female |
| 5 to 17 Years | 0 (0.0%) | 0 (0.0%) |
| 18 to 34 Years | 12 (4.9%) | 46 (8.9%) |
| 35 to 64 Years | 83 (17.1%) | 74 (15.0%) |
| 65 to 74 Years | 0 (0.0%) | 52 (41.9%) |
| 75 Years and over | 14 (30.4%) | 17 (34.0%) |
Disability Class: Self-Care Difficulty
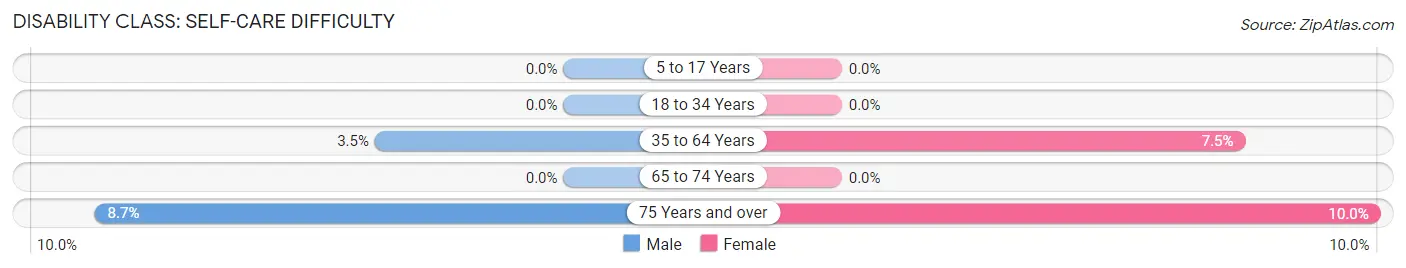
| Age Bracket | Male | Female |
| 5 to 17 Years | 0 (0.0%) | 0 (0.0%) |
| 18 to 34 Years | 0 (0.0%) | 0 (0.0%) |
| 35 to 64 Years | 17 (3.5%) | 37 (7.5%) |
| 65 to 74 Years | 0 (0.0%) | 0 (0.0%) |
| 75 Years and over | 4 (8.7%) | 5 (10.0%) |
Technology Access in Hilliard
Computing Device Access in Hilliard
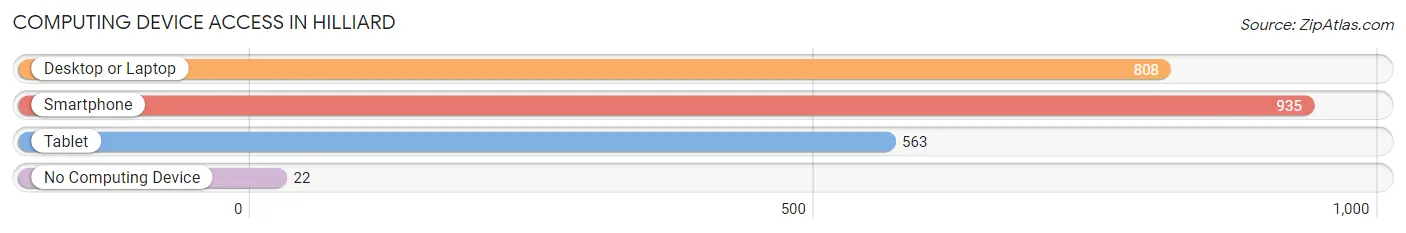
| Device Type | # Households | % Households |
| Desktop or Laptop | 808 | 72.6% |
| Smartphone | 935 | 84.0% |
| Tablet | 563 | 50.6% |
| No Computing Device | 22 | 2.0% |
| Total | 1,113 | 100.0% |
Internet Access in Hilliard
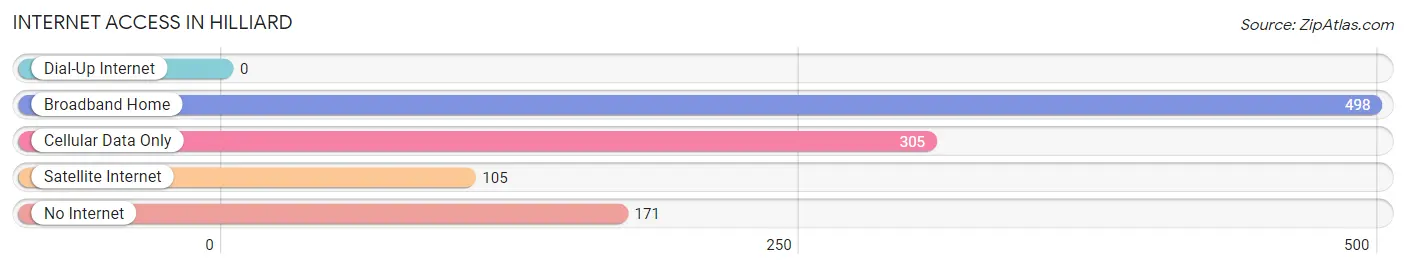
| Internet Type | # Households | % Households |
| Dial-Up Internet | 0 | 0.0% |
| Broadband Home | 498 | 44.7% |
| Cellular Data Only | 305 | 27.4% |
| Satellite Internet | 105 | 9.4% |
| No Internet | 171 | 15.4% |
| Total | 1,113 | 100.0% |
Hilliard Summary
Hilliard is a small town located in Nassau County, Florida. It is situated on the banks of the St. Marys River, which forms the border between Florida and Georgia. The town has a population of 1,845 as of the 2010 census.
History
Hilliard was founded in 1875 by William Hilliard, a former Confederate soldier. He named the town after himself and it was incorporated in 1887. The town was originally a farming community, but it soon became a center for timber and turpentine production. The town was also home to a number of sawmills and other industries.
In the early 1900s, Hilliard was a thriving community with a population of over 1,000. The town had a number of stores, churches, and a post office. The town also had a railroad station, which connected it to other towns in the area.
In the 1950s, the town began to decline as the timber and turpentine industries moved away. The population dropped to just over 500 by the 1970s. In the 1980s, the town began to experience a resurgence as new businesses moved in and the population began to grow again.
Geography
Hilliard is located in northeastern Florida, about 25 miles north of Jacksonville. The town is situated on the banks of the St. Marys River, which forms the border between Florida and Georgia. The town is surrounded by a number of small lakes and ponds, including Lake Hilliard, Lake Geneva, and Lake Johnson.
The town has a total area of 2.2 square miles, all of which is land. The town is located in a humid subtropical climate zone, with hot, humid summers and mild winters.
Economy
The economy of Hilliard is largely based on agriculture and tourism. The town is home to a number of farms, which produce a variety of crops, including corn, soybeans, and cotton. The town is also home to a number of tourist attractions, including the Hilliard Museum and the Hilliard Nature Center.
The town is also home to a number of businesses, including restaurants, retail stores, and a number of service-based businesses. The town is also home to a number of manufacturing companies, including a paper mill and a furniture factory.
Demographics
As of the 2010 census, Hilliard had a population of 1,845. The racial makeup of the town was 79.3% White, 16.2% African American, 0.5% Native American, 0.7% Asian, 0.1% Pacific Islander, and 3.2% from other races. Hispanic or Latino of any race were 4.2% of the population.
The median income for a household in Hilliard was $37,500, and the median income for a family was $45,000. The per capita income for the town was $19,000. About 15.3% of the population was below the poverty line.
Common Questions
What is the Total Population of Hilliard?
Total Population of Hilliard is 2,975.
What is the Total Male Population of Hilliard?
Total Male Population of Hilliard is 1,282.
What is the Total Female Population of Hilliard?
Total Female Population of Hilliard is 1,693.
What is the Ratio of Males per 100 Females in Hilliard?
There are 75.72 Males per 100 Females in Hilliard.
What is the Ratio of Females per 100 Males in Hilliard?
There are 132.06 Females per 100 Males in Hilliard.
What is the Median Population Age in Hilliard?
Median Population Age in Hilliard is 34.7 Years.
What is the Average Family Size in Hilliard
Average Family Size in Hilliard is 2.9 People.
What is the Average Household Size in Hilliard
Average Household Size in Hilliard is 2.5 People.
What is Per Capita Income in Hilliard?
Per Capita income in Hilliard is $25,365.
What is the Median Family Income in Hilliard?
Median Family Income in Hilliard is $71,446.
What is the Median Household income in Hilliard?
Median Household Income in Hilliard is $64,375.
What is Income or Wage Gap in Hilliard?
Income or Wage Gap in Hilliard is 10.1%.
Women in Hilliard earn 89.9 cents for every dollar earned by a man.
What is Inequality or Gini Index in Hilliard?
Inequality or Gini Index in Hilliard is 0.37.
How Large is the Labor Force in Hilliard?
There are 1,392 People in the Labor Forcein in Hilliard.
What is the Percentage of People in the Labor Force in Hilliard?
61.9% of People are in the Labor Force in Hilliard.
What is the Unemployment Rate in Hilliard?
Unemployment Rate in Hilliard is 5.8%.