Fleming Island, FL
Fleming Island Map
Fleming Island Overview
29,810
TOTAL POPULATION
14,623
MALE POPULATION
15,187
FEMALE POPULATION
96.29
MALES / 100 FEMALES
103.86
FEMALES / 100 MALES
47.0
MEDIAN AGE
2.9
AVG FAMILY SIZE
2.6
AVG HOUSEHOLD SIZE
$51,368
PER CAPITA INCOME
$133,957
AVG FAMILY INCOME
$117,414
AVG HOUSEHOLD INCOME
40.7%
WAGE / INCOME GAP [ % ]
59.3¢/ $1
WAGE / INCOME GAP [ $ ]
$15,300
FAMILY INCOME DEFICIT
0.38
INEQUALITY / GINI INDEX
14,746
LABOR FORCE [ PEOPLE ]
58.8%
PERCENT IN LABOR FORCE
4.3%
UNEMPLOYMENT RATE
Fleming Island Zip Codes
Fleming Island Area Codes
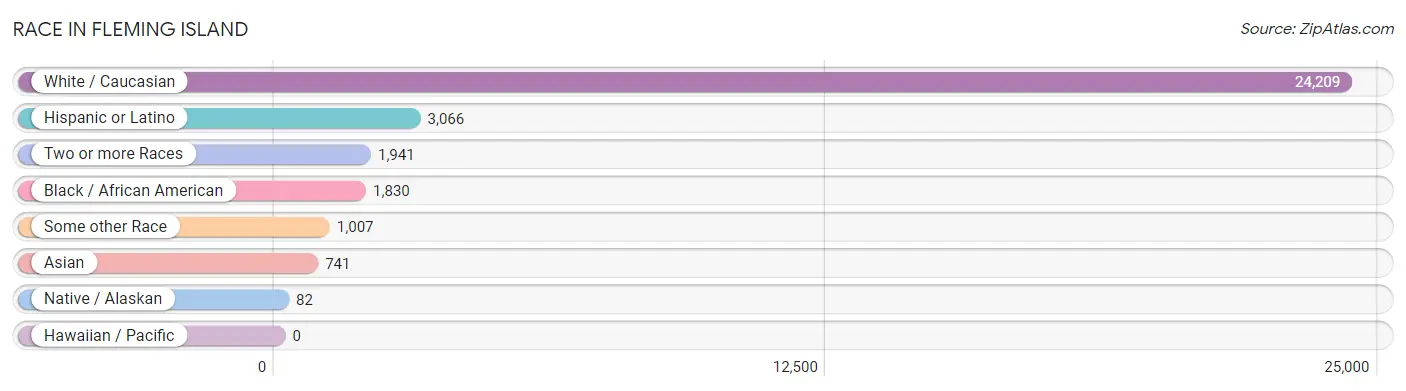
Race in Fleming Island
The most populous races in Fleming Island are White / Caucasian (24,209 | 81.2%), Hispanic or Latino (3,066 | 10.3%), and Two or more Races (1,941 | 6.5%).
| Race | # Population | % Population |
| Asian | 741 | 2.5% |
| Black / African American | 1,830 | 6.1% |
| Hawaiian / Pacific | 0 | 0.0% |
| Hispanic or Latino | 3,066 | 10.3% |
| Native / Alaskan | 82 | 0.3% |
| White / Caucasian | 24,209 | 81.2% |
| Two or more Races | 1,941 | 6.5% |
| Some other Race | 1,007 | 3.4% |
| Total | 29,810 | 100.0% |
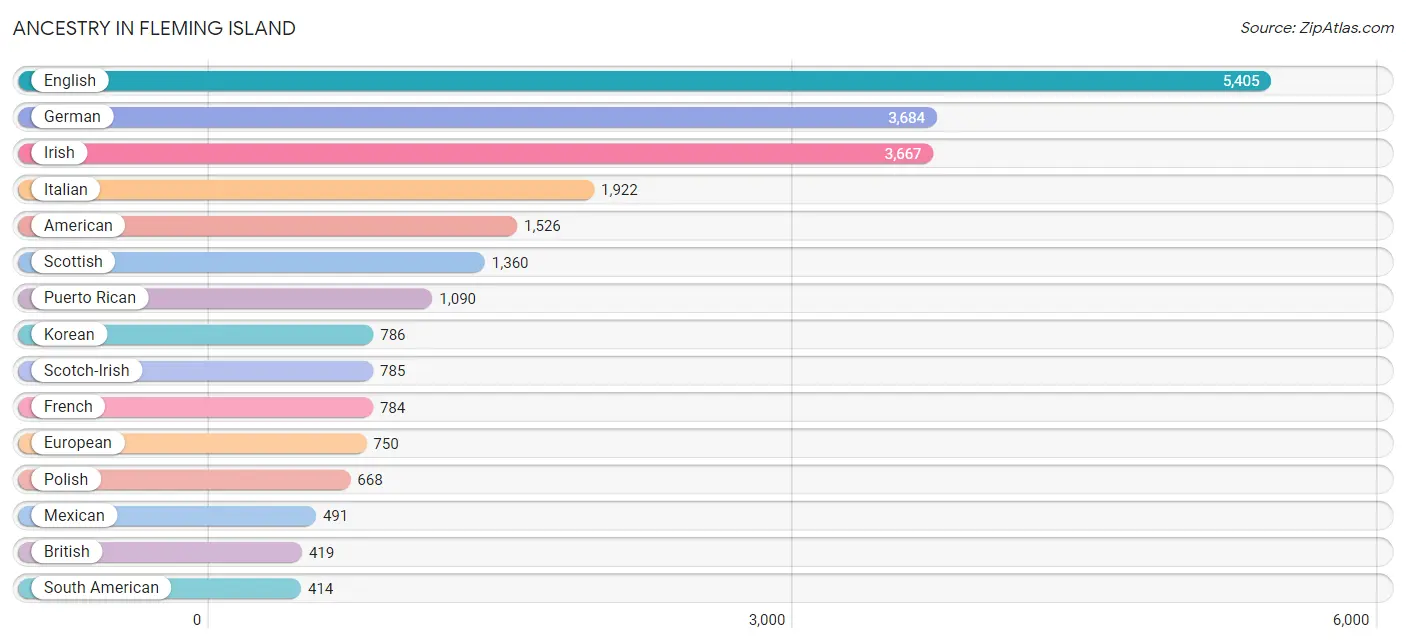
Ancestry in Fleming Island
The most populous ancestries reported in Fleming Island are English (5,405 | 18.1%), German (3,684 | 12.4%), Irish (3,667 | 12.3%), Italian (1,922 | 6.5%), and American (1,526 | 5.1%), together accounting for 54.4% of all Fleming Island residents.
| Ancestry | # Population | % Population |
| African | 27 | 0.1% |
| American | 1,526 | 5.1% |
| Arab | 69 | 0.2% |
| Argentinean | 103 | 0.4% |
| Australian | 6 | 0.0% |
| Austrian | 78 | 0.3% |
| Belgian | 14 | 0.1% |
| Bhutanese | 33 | 0.1% |
| Blackfeet | 20 | 0.1% |
| Brazilian | 105 | 0.4% |
| British | 419 | 1.4% |
| Burmese | 35 | 0.1% |
| Cajun | 33 | 0.1% |
| Canadian | 87 | 0.3% |
| Central American | 326 | 1.1% |
| Cherokee | 27 | 0.1% |
| Colombian | 83 | 0.3% |
| Costa Rican | 85 | 0.3% |
| Creek | 62 | 0.2% |
| Croatian | 34 | 0.1% |
| Cuban | 340 | 1.1% |
| Czechoslovakian | 90 | 0.3% |
| Danish | 32 | 0.1% |
| Dominican | 10 | 0.0% |
| Dutch | 265 | 0.9% |
| Eastern European | 38 | 0.1% |
| English | 5,405 | 18.1% |
| European | 750 | 2.5% |
| Finnish | 14 | 0.1% |
| French | 784 | 2.6% |
| French Canadian | 169 | 0.6% |
| German | 3,684 | 12.4% |
| Greek | 99 | 0.3% |
| Guamanian / Chamorro | 16 | 0.1% |
| Haitian | 278 | 0.9% |
| Honduran | 22 | 0.1% |
| Hungarian | 84 | 0.3% |
| Indian (Asian) | 192 | 0.6% |
| Irish | 3,667 | 12.3% |
| Italian | 1,922 | 6.5% |
| Jamaican | 122 | 0.4% |
| Jordanian | 22 | 0.1% |
| Korean | 786 | 2.6% |
| Lebanese | 26 | 0.1% |
| Lithuanian | 65 | 0.2% |
| Malaysian | 22 | 0.1% |
| Maltese | 18 | 0.1% |
| Mexican | 491 | 1.7% |
| Native Hawaiian | 134 | 0.4% |
| Nicaraguan | 200 | 0.7% |
| Norwegian | 269 | 0.9% |
| Pakistani | 95 | 0.3% |
| Panamanian | 19 | 0.1% |
| Pennsylvania German | 23 | 0.1% |
| Peruvian | 47 | 0.2% |
| Polish | 668 | 2.2% |
| Portuguese | 159 | 0.5% |
| Puerto Rican | 1,090 | 3.7% |
| Romanian | 120 | 0.4% |
| Russian | 36 | 0.1% |
| Scandinavian | 148 | 0.5% |
| Scotch-Irish | 785 | 2.6% |
| Scottish | 1,360 | 4.6% |
| Slovak | 149 | 0.5% |
| South American | 414 | 1.4% |
| Spaniard | 82 | 0.3% |
| Spanish | 313 | 1.1% |
| Sri Lankan | 68 | 0.2% |
| Subsaharan African | 27 | 0.1% |
| Swedish | 126 | 0.4% |
| Swiss | 33 | 0.1% |
| Syrian | 21 | 0.1% |
| Thai | 143 | 0.5% |
| Ukrainian | 14 | 0.1% |
| Venezuelan | 181 | 0.6% |
| Welsh | 289 | 1.0% | View All 76 Rows |
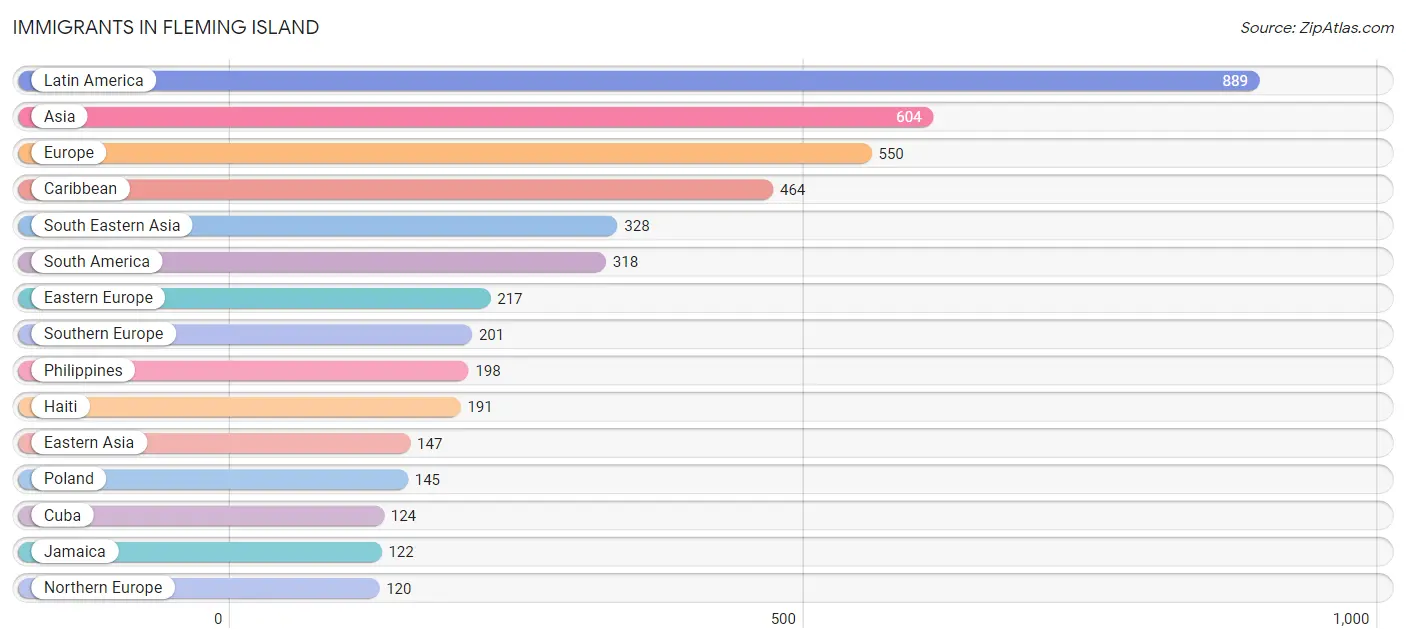
Immigrants in Fleming Island
The most numerous immigrant groups reported in Fleming Island came from Latin America (889 | 3.0%), Asia (604 | 2.0%), Europe (550 | 1.8%), Caribbean (464 | 1.6%), and South Eastern Asia (328 | 1.1%), together accounting for 9.5% of all Fleming Island residents.
| Immigration Origin | # Population | % Population |
| Africa | 33 | 0.1% |
| Argentina | 92 | 0.3% |
| Asia | 604 | 2.0% |
| Brazil | 76 | 0.3% |
| Canada | 68 | 0.2% |
| Caribbean | 464 | 1.6% |
| Central America | 107 | 0.4% |
| China | 101 | 0.3% |
| Colombia | 94 | 0.3% |
| Cuba | 124 | 0.4% |
| Eastern Asia | 147 | 0.5% |
| Eastern Europe | 217 | 0.7% |
| England | 49 | 0.2% |
| Europe | 550 | 1.8% |
| Germany | 12 | 0.0% |
| Haiti | 191 | 0.6% |
| India | 46 | 0.2% |
| Italy | 90 | 0.3% |
| Jamaica | 122 | 0.4% |
| Japan | 46 | 0.2% |
| Kazakhstan | 64 | 0.2% |
| Latin America | 889 | 3.0% |
| Lebanon | 10 | 0.0% |
| Mexico | 16 | 0.1% |
| Nicaragua | 91 | 0.3% |
| Northern Europe | 120 | 0.4% |
| Peru | 31 | 0.1% |
| Philippines | 198 | 0.7% |
| Poland | 145 | 0.5% |
| Romania | 72 | 0.2% |
| Scotland | 44 | 0.2% |
| South Africa | 33 | 0.1% |
| South America | 318 | 1.1% |
| South Central Asia | 110 | 0.4% |
| South Eastern Asia | 328 | 1.1% |
| Southern Europe | 201 | 0.7% |
| Spain | 111 | 0.4% |
| Syria | 9 | 0.0% |
| Thailand | 60 | 0.2% |
| Venezuela | 25 | 0.1% |
| Vietnam | 70 | 0.2% |
| Western Asia | 19 | 0.1% |
| Western Europe | 12 | 0.0% | View All 43 Rows |
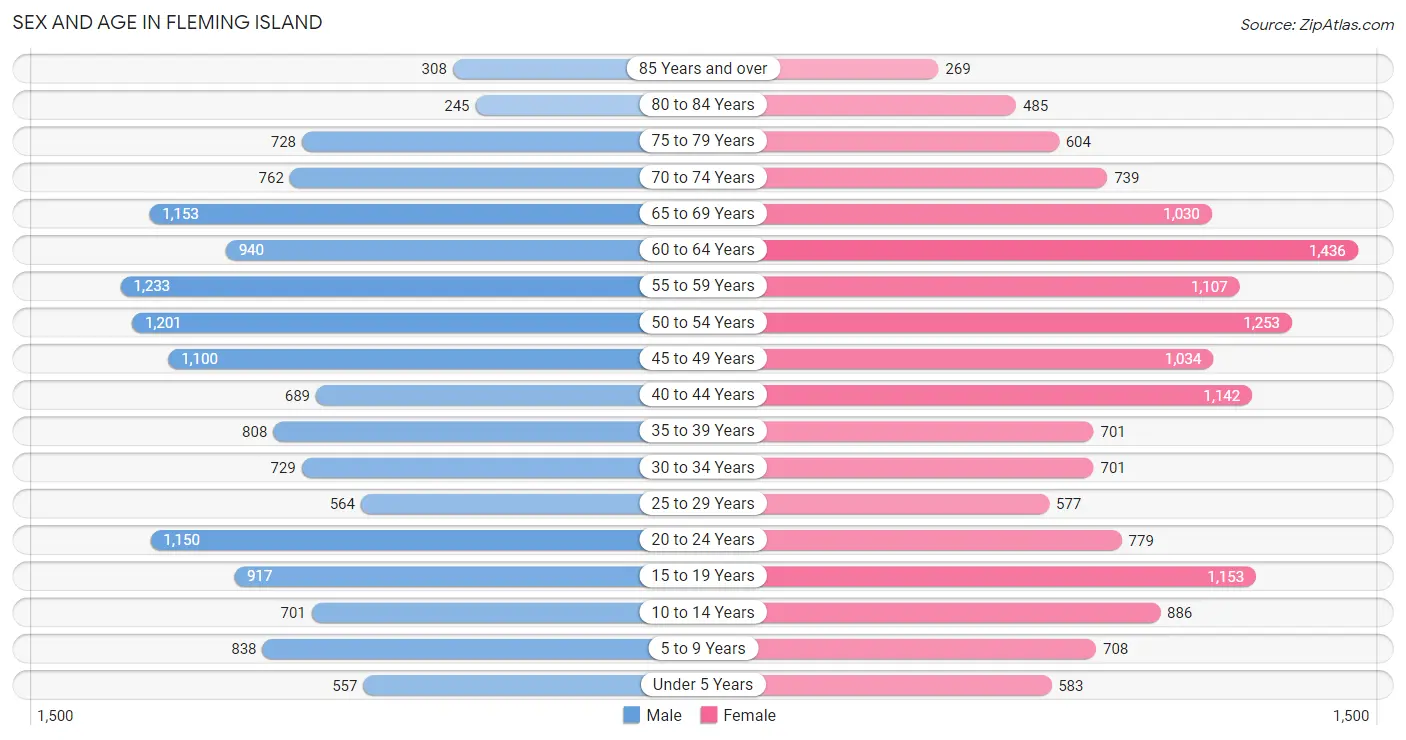
Sex and Age in Fleming Island
Sex and Age in Fleming Island
The most populous age groups in Fleming Island are 55 to 59 Years (1,233 | 8.4%) for men and 60 to 64 Years (1,436 | 9.5%) for women.
| Age Bracket | Male | Female |
| Under 5 Years | 557 (3.8%) | 583 (3.8%) |
| 5 to 9 Years | 838 (5.7%) | 708 (4.7%) |
| 10 to 14 Years | 701 (4.8%) | 886 (5.8%) |
| 15 to 19 Years | 917 (6.3%) | 1,153 (7.6%) |
| 20 to 24 Years | 1,150 (7.9%) | 779 (5.1%) |
| 25 to 29 Years | 564 (3.9%) | 577 (3.8%) |
| 30 to 34 Years | 729 (5.0%) | 701 (4.6%) |
| 35 to 39 Years | 808 (5.5%) | 701 (4.6%) |
| 40 to 44 Years | 689 (4.7%) | 1,142 (7.5%) |
| 45 to 49 Years | 1,100 (7.5%) | 1,034 (6.8%) |
| 50 to 54 Years | 1,201 (8.2%) | 1,253 (8.3%) |
| 55 to 59 Years | 1,233 (8.4%) | 1,107 (7.3%) |
| 60 to 64 Years | 940 (6.4%) | 1,436 (9.5%) |
| 65 to 69 Years | 1,153 (7.9%) | 1,030 (6.8%) |
| 70 to 74 Years | 762 (5.2%) | 739 (4.9%) |
| 75 to 79 Years | 728 (5.0%) | 604 (4.0%) |
| 80 to 84 Years | 245 (1.7%) | 485 (3.2%) |
| 85 Years and over | 308 (2.1%) | 269 (1.8%) |
| Total | 14,623 (100.0%) | 15,187 (100.0%) |
Families and Households in Fleming Island
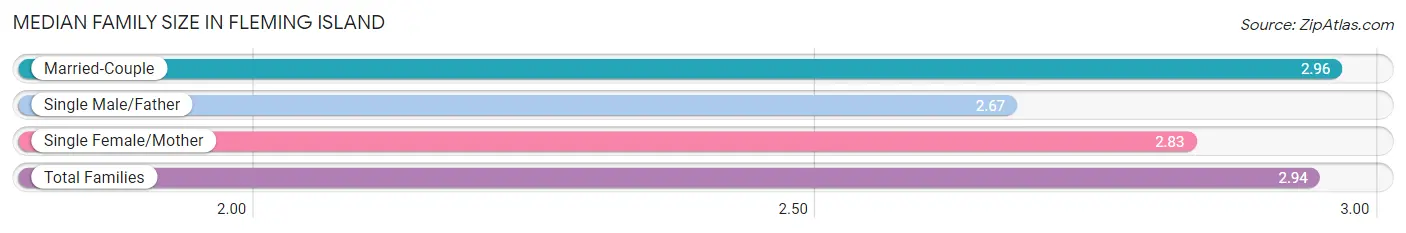
Median Family Size in Fleming Island
The median family size in Fleming Island is 2.94 persons per family, with married-couple families (8,076 | 88.7%) accounting for the largest median family size of 2.96 persons per family. On the other hand, single male/father families (206 | 2.3%) represent the smallest median family size with 2.67 persons per family.
| Family Type | # Families | Family Size |
| Married-Couple | 8,076 (88.7%) | 2.96 |
| Single Male/Father | 206 (2.3%) | 2.67 |
| Single Female/Mother | 819 (9.0%) | 2.83 |
| Total Families | 9,101 (100.0%) | 2.94 |
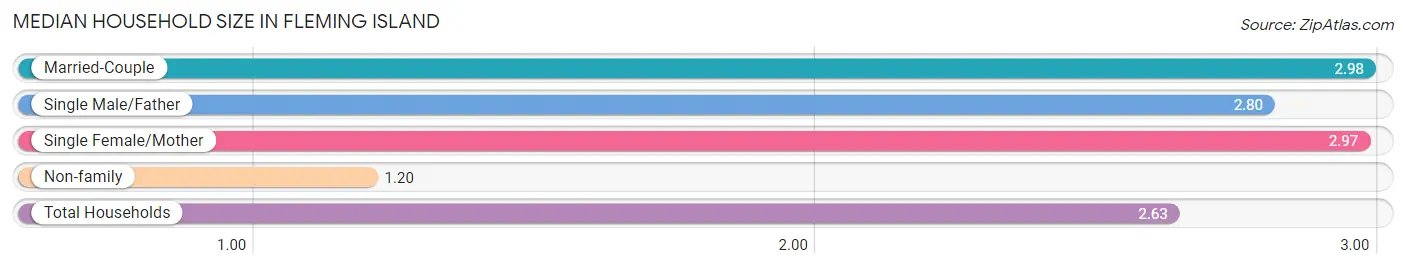
Median Household Size in Fleming Island
The median household size in Fleming Island is 2.63 persons per household, with married-couple households (8,076 | 71.5%) accounting for the largest median household size of 2.98 persons per household. non-family households (2,190 | 19.4%) represent the smallest median household size with 1.20 persons per household.
| Household Type | # Households | Household Size |
| Married-Couple | 8,076 (71.5%) | 2.98 |
| Single Male/Father | 206 (1.8%) | 2.80 |
| Single Female/Mother | 819 (7.2%) | 2.97 |
| Non-family | 2,190 (19.4%) | 1.20 |
| Total Households | 11,291 (100.0%) | 2.63 |
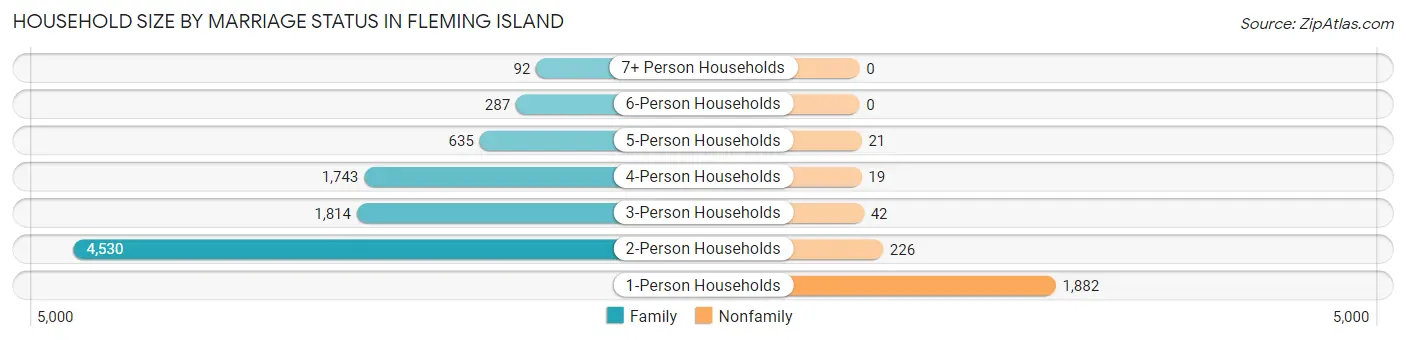
Household Size by Marriage Status in Fleming Island
Out of a total of 11,291 households in Fleming Island, 9,101 (80.6%) are family households, while 2,190 (19.4%) are nonfamily households. The most numerous type of family households are 2-person households, comprising 4,530, and the most common type of nonfamily households are 1-person households, comprising 1,882.
| Household Size | Family Households | Nonfamily Households |
| 1-Person Households | - | 1,882 (16.7%) |
| 2-Person Households | 4,530 (40.1%) | 226 (2.0%) |
| 3-Person Households | 1,814 (16.1%) | 42 (0.4%) |
| 4-Person Households | 1,743 (15.4%) | 19 (0.2%) |
| 5-Person Households | 635 (5.6%) | 21 (0.2%) |
| 6-Person Households | 287 (2.5%) | 0 (0.0%) |
| 7+ Person Households | 92 (0.8%) | 0 (0.0%) |
| Total | 9,101 (80.6%) | 2,190 (19.4%) |
Female Fertility in Fleming Island
Fertility by Age in Fleming Island
Average fertility rate in Fleming Island is 31.0 births per 1,000 women. Women in the age bracket of 20 to 34 years have the highest fertility rate with 55.0 births per 1,000 women. Women in the age bracket of 20 to 34 years acount for 57.6% of all women with births.
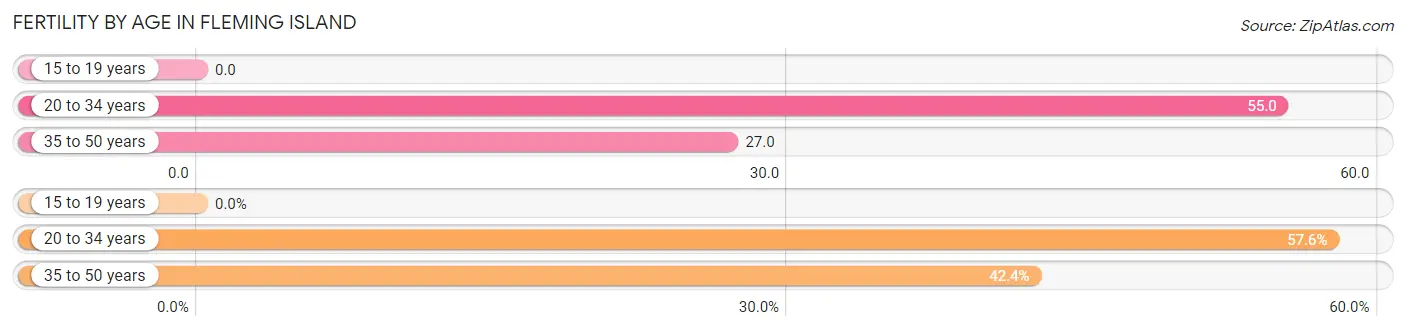
| Age Bracket | Women with Births | Births / 1,000 Women |
| 15 to 19 years | 0 (0.0%) | 0.0 |
| 20 to 34 years | 114 (57.6%) | 55.0 |
| 35 to 50 years | 84 (42.4%) | 27.0 |
| Total | 198 (100.0%) | 31.0 |
Fertility by Age by Marriage Status in Fleming Island
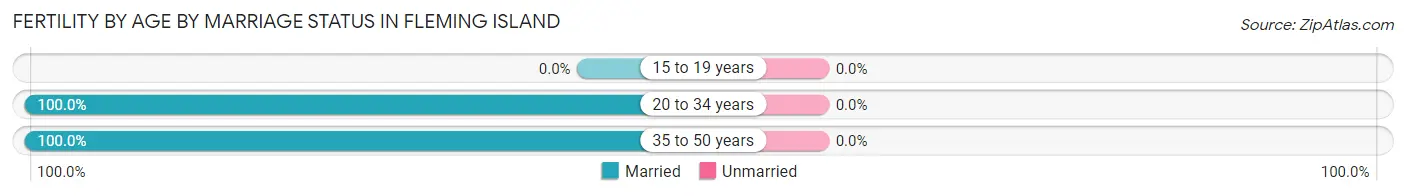
| Age Bracket | Married | Unmarried |
| 15 to 19 years | 0 (0.0%) | 0 (0.0%) |
| 20 to 34 years | 114 (100.0%) | 0 (0.0%) |
| 35 to 50 years | 84 (100.0%) | 0 (0.0%) |
| Total | 198 (100.0%) | 0 (0.0%) |
Fertility by Education in Fleming Island
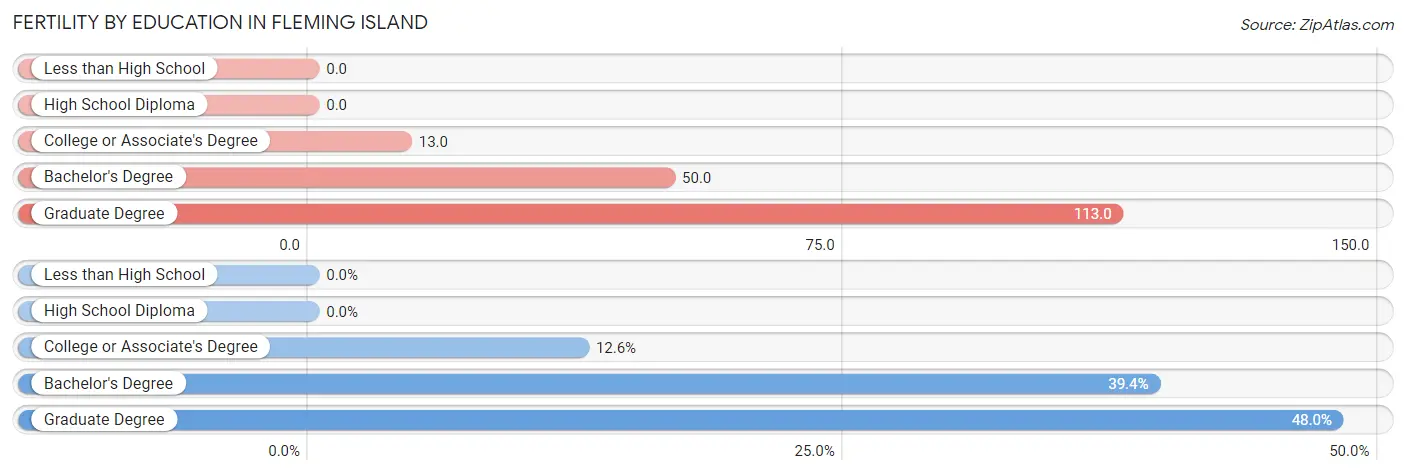
| Educational Attainment | Women with Births | Births / 1,000 Women |
| Less than High School | 0 (0.0%) | 0.0 |
| High School Diploma | 0 (0.0%) | 0.0 |
| College or Associate's Degree | 25 (12.6%) | 13.0 |
| Bachelor's Degree | 78 (39.4%) | 50.0 |
| Graduate Degree | 95 (48.0%) | 113.0 |
| Total | 198 (100.0%) | 31.0 |
Fertility by Education by Marriage Status in Fleming Island
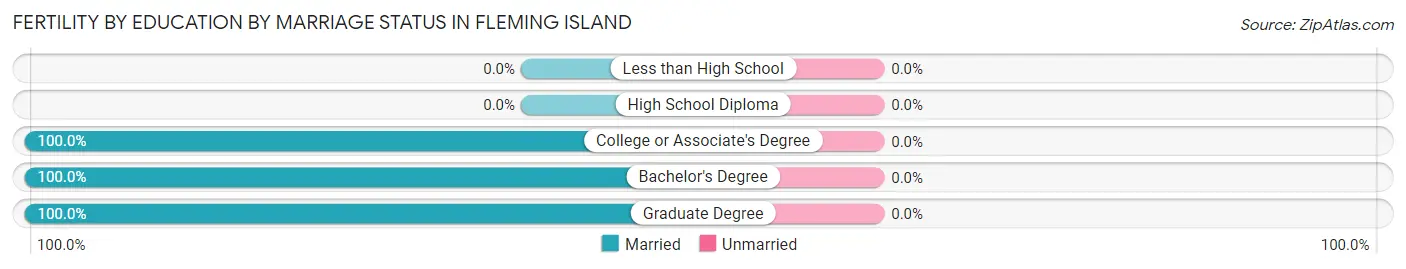
| Educational Attainment | Married | Unmarried |
| Less than High School | 0 (0.0%) | 0 (0.0%) |
| High School Diploma | 0 (0.0%) | 0 (0.0%) |
| College or Associate's Degree | 25 (100.0%) | 0 (0.0%) |
| Bachelor's Degree | 78 (100.0%) | 0 (0.0%) |
| Graduate Degree | 95 (100.0%) | 0 (0.0%) |
| Total | 198 (100.0%) | 0 (0.0%) |
Income in Fleming Island
Income Overview in Fleming Island
Per Capita Income in Fleming Island is $51,368, while median incomes of families and households are $133,957 and $117,414 respectively.
| Characteristic | Number | Measure |
| Per Capita Income | 29,810 | $51,368 |
| Median Family Income | 9,101 | $133,957 |
| Mean Family Income | 9,101 | $150,521 |
| Median Household Income | 11,291 | $117,414 |
| Mean Household Income | 11,291 | $137,139 |
| Income Deficit | 9,101 | $15,300 |
| Wage / Income Gap (%) | 29,810 | 40.74% |
| Wage / Income Gap ($) | 29,810 | 59.26¢ per $1 |
| Gini / Inequality Index | 29,810 | 0.38 |
Earnings by Sex in Fleming Island
Average Earnings in Fleming Island are $56,051, $70,047 for men and $41,507 for women, a difference of 40.7%.
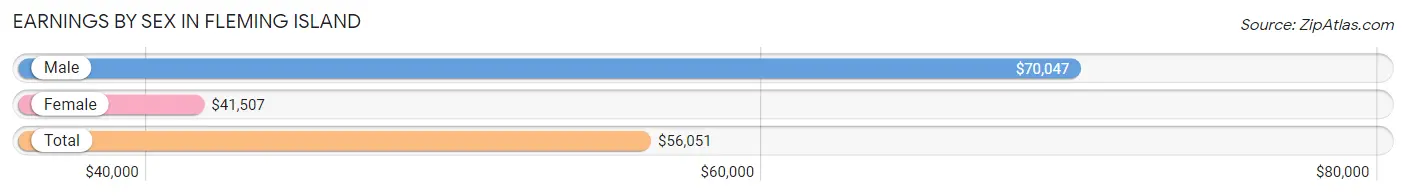
| Sex | Number | Average Earnings |
| Male | 8,146 (54.5%) | $70,047 |
| Female | 6,788 (45.5%) | $41,507 |
| Total | 14,934 (100.0%) | $56,051 |
Earnings by Sex by Income Bracket in Fleming Island
The most common earnings brackets in Fleming Island are $100,000+ for men (2,651 | 32.5%) and $100,000+ for women (889 | 13.1%).
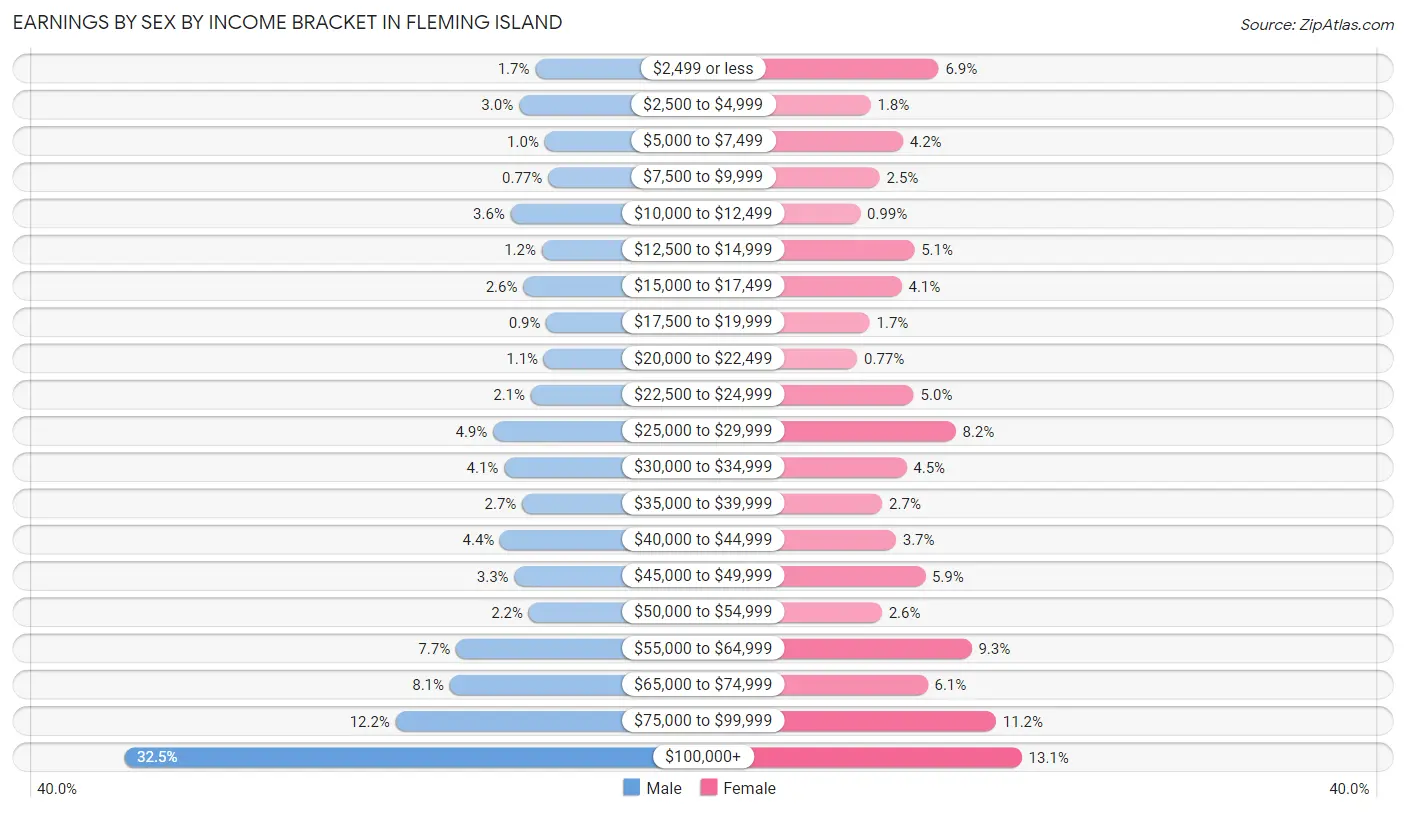
| Income | Male | Female |
| $2,499 or less | 141 (1.7%) | 466 (6.9%) |
| $2,500 to $4,999 | 240 (2.9%) | 121 (1.8%) |
| $5,000 to $7,499 | 83 (1.0%) | 285 (4.2%) |
| $7,500 to $9,999 | 63 (0.8%) | 167 (2.5%) |
| $10,000 to $12,499 | 291 (3.6%) | 67 (1.0%) |
| $12,500 to $14,999 | 101 (1.2%) | 343 (5.1%) |
| $15,000 to $17,499 | 214 (2.6%) | 278 (4.1%) |
| $17,500 to $19,999 | 73 (0.9%) | 116 (1.7%) |
| $20,000 to $22,499 | 88 (1.1%) | 52 (0.8%) |
| $22,500 to $24,999 | 168 (2.1%) | 340 (5.0%) |
| $25,000 to $29,999 | 398 (4.9%) | 553 (8.2%) |
| $30,000 to $34,999 | 331 (4.1%) | 303 (4.5%) |
| $35,000 to $39,999 | 221 (2.7%) | 180 (2.6%) |
| $40,000 to $44,999 | 355 (4.4%) | 249 (3.7%) |
| $45,000 to $49,999 | 268 (3.3%) | 398 (5.9%) |
| $50,000 to $54,999 | 180 (2.2%) | 178 (2.6%) |
| $55,000 to $64,999 | 625 (7.7%) | 634 (9.3%) |
| $65,000 to $74,999 | 662 (8.1%) | 411 (6.0%) |
| $75,000 to $99,999 | 993 (12.2%) | 758 (11.2%) |
| $100,000+ | 2,651 (32.5%) | 889 (13.1%) |
| Total | 8,146 (100.0%) | 6,788 (100.0%) |
Earnings by Sex by Educational Attainment in Fleming Island
Average earnings in Fleming Island are $75,890 for men and $49,215 for women, a difference of 35.1%. Men with an educational attainment of graduate degree enjoy the highest average annual earnings of $116,650, while those with less than high school education earn the least with $33,814. Women with an educational attainment of graduate degree earn the most with the average annual earnings of $65,594, while those with college or associate's degree education have the smallest earnings of $36,400.
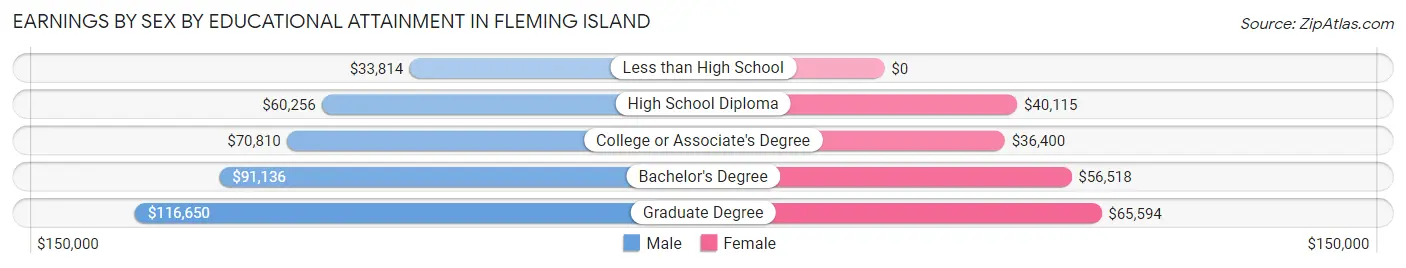
| Educational Attainment | Male Income | Female Income |
| Less than High School | $33,814 | $0 |
| High School Diploma | $60,256 | $40,115 |
| College or Associate's Degree | $70,810 | $36,400 |
| Bachelor's Degree | $91,136 | $56,518 |
| Graduate Degree | $116,650 | $65,594 |
| Total | $75,890 | $49,215 |
Family Income in Fleming Island
Family Income Brackets in Fleming Island
According to the Fleming Island family income data, there are 2,293 families falling into the $200,000+ income range, which is the most common income bracket and makes up 25.2% of all families.
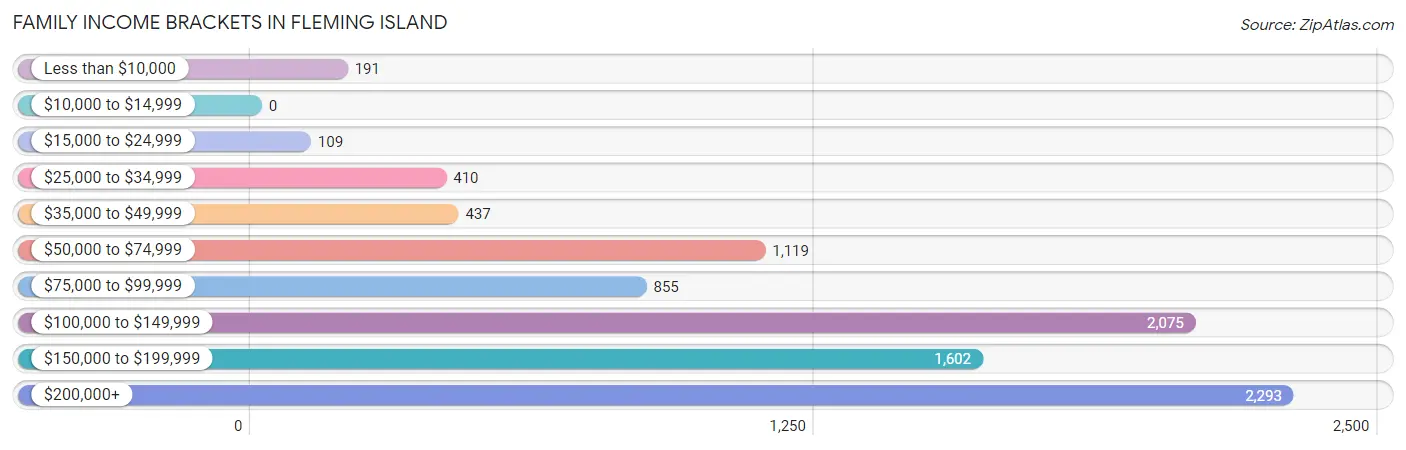
| Income Bracket | # Families | % Families |
| Less than $10,000 | 191 | 2.1% |
| $10,000 to $14,999 | 0 | 0.0% |
| $15,000 to $24,999 | 109 | 1.2% |
| $25,000 to $34,999 | 410 | 4.5% |
| $35,000 to $49,999 | 437 | 4.8% |
| $50,000 to $74,999 | 1,119 | 12.3% |
| $75,000 to $99,999 | 855 | 9.4% |
| $100,000 to $149,999 | 2,075 | 22.8% |
| $150,000 to $199,999 | 1,602 | 17.6% |
| $200,000+ | 2,293 | 25.2% |
Family Income by Famaliy Size in Fleming Island
7+ person families (65 | 0.7%) account for the highest median family income in Fleming Island with $178,073 per family, while 2-person families (4,593 | 50.5%) have the highest median income of $56,255 per family member.
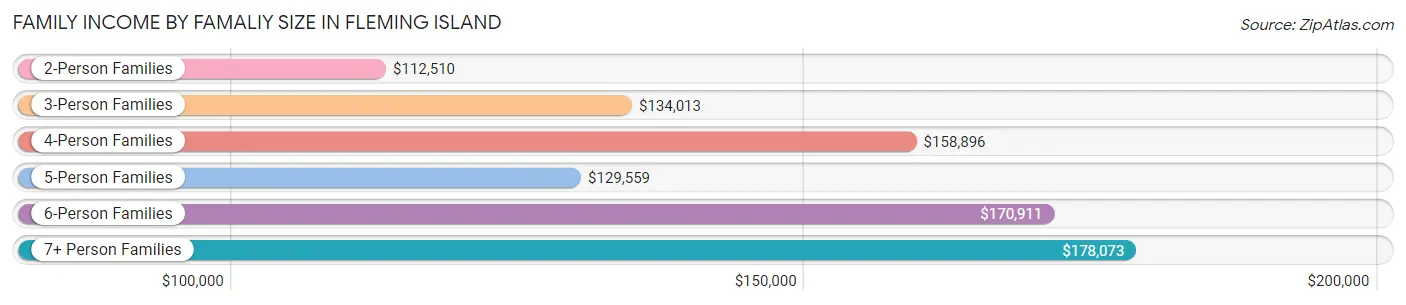
| Income Bracket | # Families | Median Income |
| 2-Person Families | 4,593 (50.5%) | $112,510 |
| 3-Person Families | 1,892 (20.8%) | $134,013 |
| 4-Person Families | 1,602 (17.6%) | $158,896 |
| 5-Person Families | 708 (7.8%) | $129,559 |
| 6-Person Families | 241 (2.6%) | $170,911 |
| 7+ Person Families | 65 (0.7%) | $178,073 |
| Total | 9,101 (100.0%) | $133,957 |
Family Income by Number of Earners in Fleming Island
The median family income in Fleming Island is $133,957, with families comprising 3+ earners (1,039) having the highest median family income of $171,841, while families with no earners (2,040) have the lowest median family income of $68,755, accounting for 11.4% and 22.4% of families, respectively.
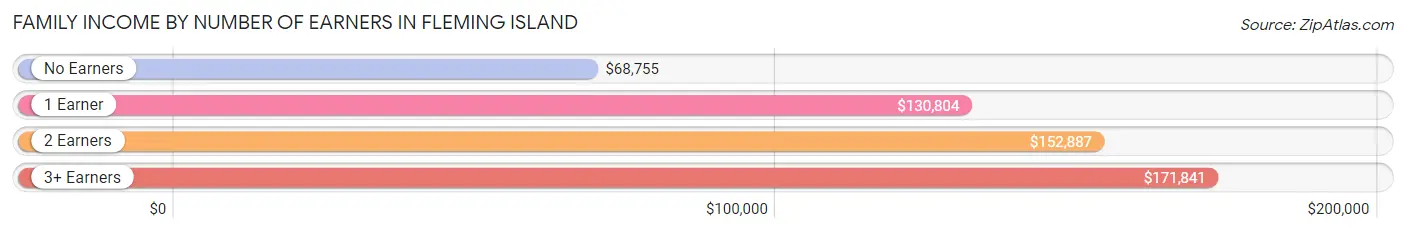
| Number of Earners | # Families | Median Income |
| No Earners | 2,040 (22.4%) | $68,755 |
| 1 Earner | 2,513 (27.6%) | $130,804 |
| 2 Earners | 3,509 (38.6%) | $152,887 |
| 3+ Earners | 1,039 (11.4%) | $171,841 |
| Total | 9,101 (100.0%) | $133,957 |
Household Income in Fleming Island
Household Income Brackets in Fleming Island
With 2,586 households falling in the category, the $100,000 to $149,999 income range is the most frequent in Fleming Island, accounting for 22.9% of all households. In contrast, only 45 households (0.4%) fall into the $10,000 to $14,999 income bracket, making it the least populous group.
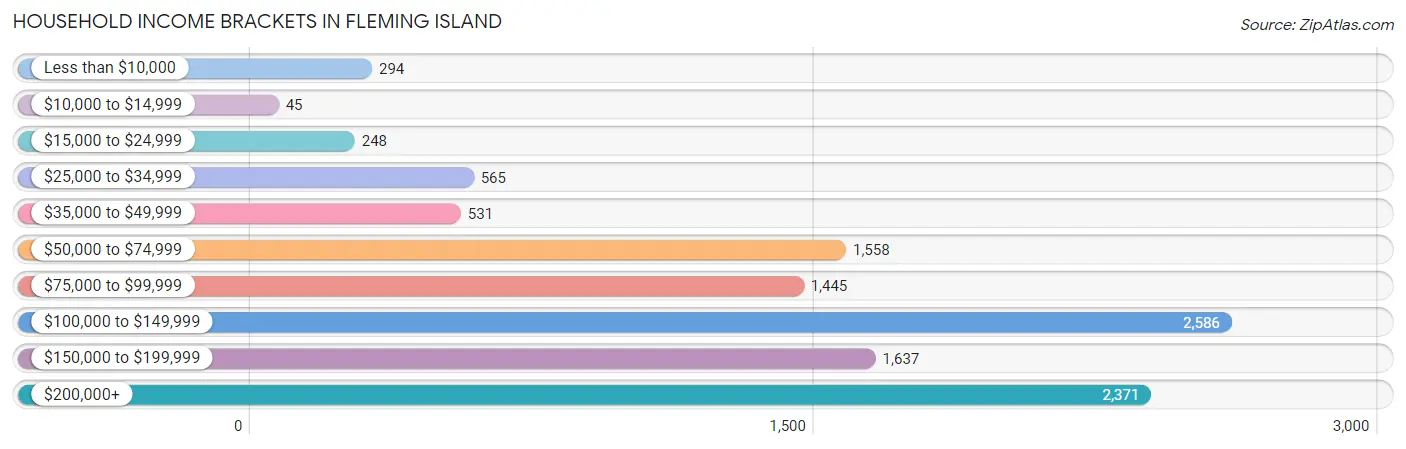
| Income Bracket | # Households | % Households |
| Less than $10,000 | 294 | 2.6% |
| $10,000 to $14,999 | 45 | 0.4% |
| $15,000 to $24,999 | 248 | 2.2% |
| $25,000 to $34,999 | 565 | 5.0% |
| $35,000 to $49,999 | 531 | 4.7% |
| $50,000 to $74,999 | 1,558 | 13.8% |
| $75,000 to $99,999 | 1,445 | 12.8% |
| $100,000 to $149,999 | 2,586 | 22.9% |
| $150,000 to $199,999 | 1,637 | 14.5% |
| $200,000+ | 2,371 | 21.0% |
Household Income by Householder Age in Fleming Island
The median household income in Fleming Island is $117,414, with the highest median household income of $149,705 found in the 45 to 64 years age bracket for the primary householder. A total of 4,723 households (41.8%) fall into this category. Meanwhile, the 15 to 24 years age bracket for the primary householder has the lowest median household income of $0, with 48 households (0.4%) in this group.
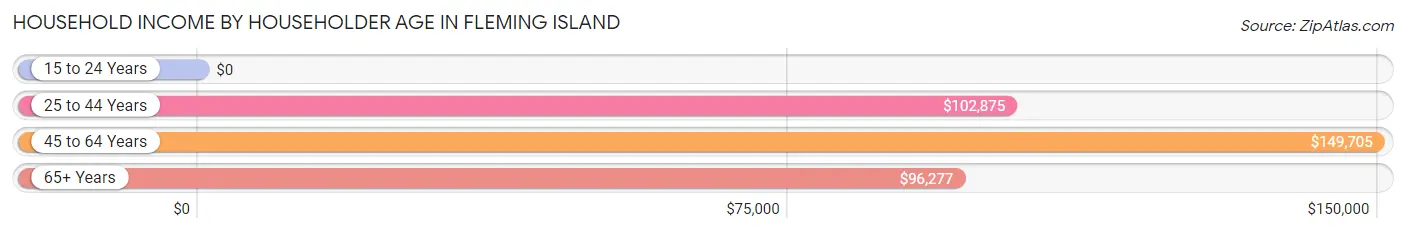
| Income Bracket | # Households | Median Income |
| 15 to 24 Years | 48 (0.4%) | $0 |
| 25 to 44 Years | 2,651 (23.5%) | $102,875 |
| 45 to 64 Years | 4,723 (41.8%) | $149,705 |
| 65+ Years | 3,869 (34.3%) | $96,277 |
| Total | 11,291 (100.0%) | $117,414 |
Poverty in Fleming Island
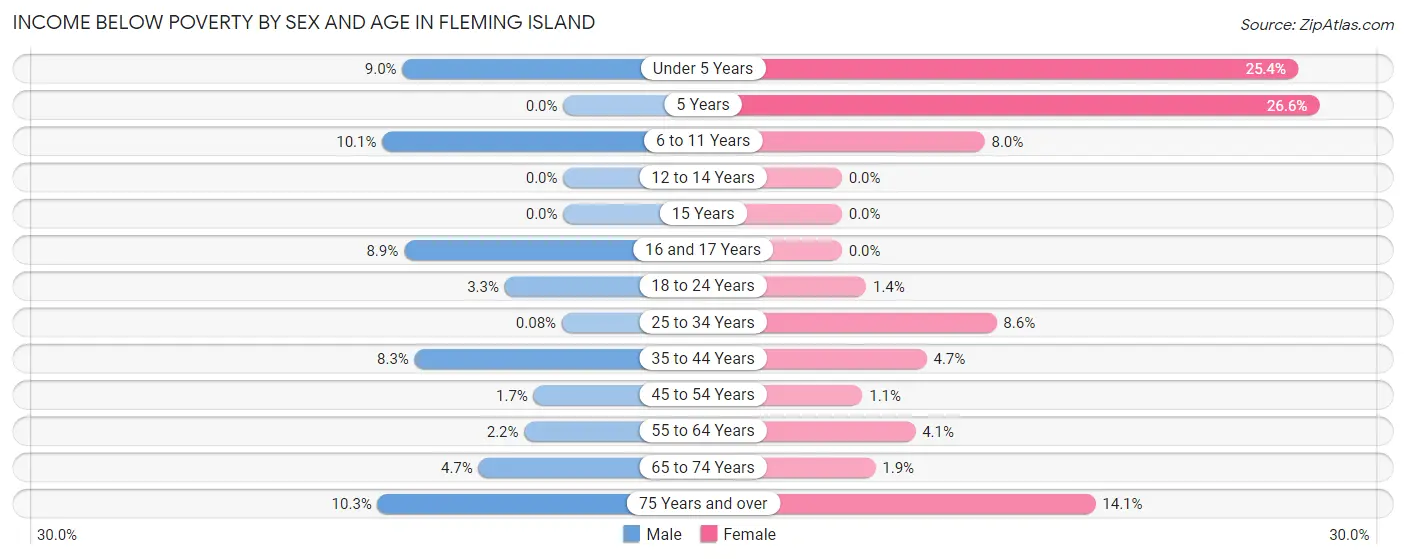
Income Below Poverty by Sex and Age in Fleming Island
With 4.6% poverty level for males and 5.4% for females among the residents of Fleming Island, 75 year old and over males and 5 year old females are the most vulnerable to poverty, with 132 males (10.3%) and 42 females (26.6%) in their respective age groups living below the poverty level.
| Age Bracket | Male | Female |
| Under 5 Years | 44 (9.0%) | 148 (25.4%) |
| 5 Years | 0 (0.0%) | 42 (26.6%) |
| 6 to 11 Years | 107 (10.1%) | 61 (8.0%) |
| 12 to 14 Years | 0 (0.0%) | 0 (0.0%) |
| 15 Years | 0 (0.0%) | 0 (0.0%) |
| 16 and 17 Years | 41 (8.9%) | 0 (0.0%) |
| 18 to 24 Years | 46 (3.3%) | 16 (1.3%) |
| 25 to 34 Years | 1 (0.1%) | 110 (8.6%) |
| 35 to 44 Years | 124 (8.3%) | 87 (4.7%) |
| 45 to 54 Years | 38 (1.7%) | 26 (1.1%) |
| 55 to 64 Years | 47 (2.2%) | 104 (4.1%) |
| 65 to 74 Years | 90 (4.7%) | 33 (1.9%) |
| 75 Years and over | 132 (10.3%) | 183 (14.1%) |
| Total | 670 (4.6%) | 810 (5.4%) |
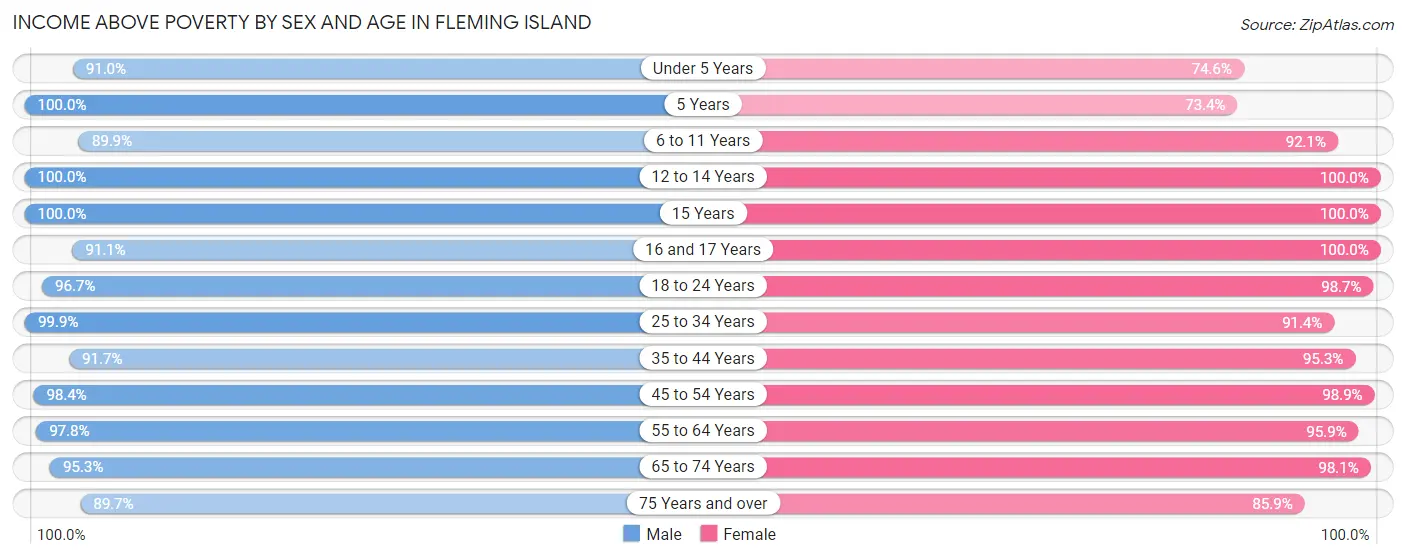
Income Above Poverty by Sex and Age in Fleming Island
According to the poverty statistics in Fleming Island, males aged 5 years and females aged 12 to 14 years are the age groups that are most secure financially, with 100.0% of males and 100.0% of females in these age groups living above the poverty line.
| Age Bracket | Male | Female |
| Under 5 Years | 447 (91.0%) | 435 (74.6%) |
| 5 Years | 74 (100.0%) | 116 (73.4%) |
| 6 to 11 Years | 955 (89.9%) | 706 (92.0%) |
| 12 to 14 Years | 379 (100.0%) | 652 (100.0%) |
| 15 Years | 194 (100.0%) | 265 (100.0%) |
| 16 and 17 Years | 421 (91.1%) | 485 (100.0%) |
| 18 to 24 Years | 1,365 (96.7%) | 1,166 (98.7%) |
| 25 to 34 Years | 1,292 (99.9%) | 1,168 (91.4%) |
| 35 to 44 Years | 1,373 (91.7%) | 1,756 (95.3%) |
| 45 to 54 Years | 2,263 (98.4%) | 2,261 (98.9%) |
| 55 to 64 Years | 2,114 (97.8%) | 2,439 (95.9%) |
| 65 to 74 Years | 1,816 (95.3%) | 1,732 (98.1%) |
| 75 Years and over | 1,145 (89.7%) | 1,113 (85.9%) |
| Total | 13,838 (95.4%) | 14,294 (94.6%) |
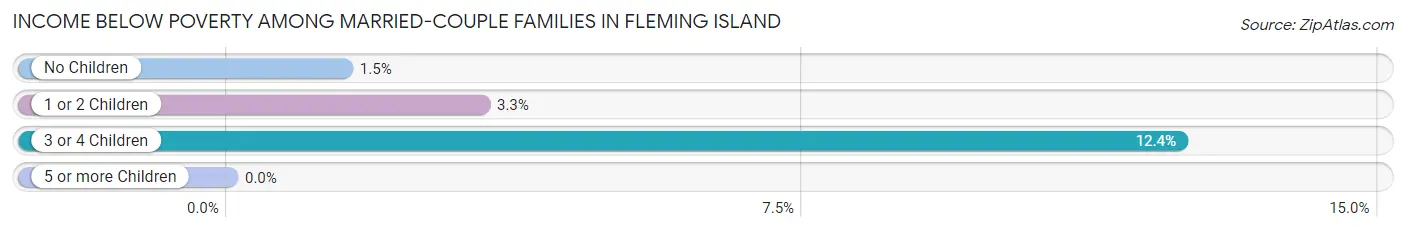
Income Below Poverty Among Married-Couple Families in Fleming Island
The poverty statistics for married-couple families in Fleming Island show that 2.7% or 218 of the total 8,076 families live below the poverty line. Families with 3 or 4 children have the highest poverty rate of 12.4%, comprising of 64 families. On the other hand, families with 5 or more children have the lowest poverty rate of 0.0%, which includes 0 families.
| Children | Above Poverty | Below Poverty |
| No Children | 5,189 (98.5%) | 79 (1.5%) |
| 1 or 2 Children | 2,207 (96.7%) | 75 (3.3%) |
| 3 or 4 Children | 452 (87.6%) | 64 (12.4%) |
| 5 or more Children | 10 (100.0%) | 0 (0.0%) |
| Total | 7,858 (97.3%) | 218 (2.7%) |
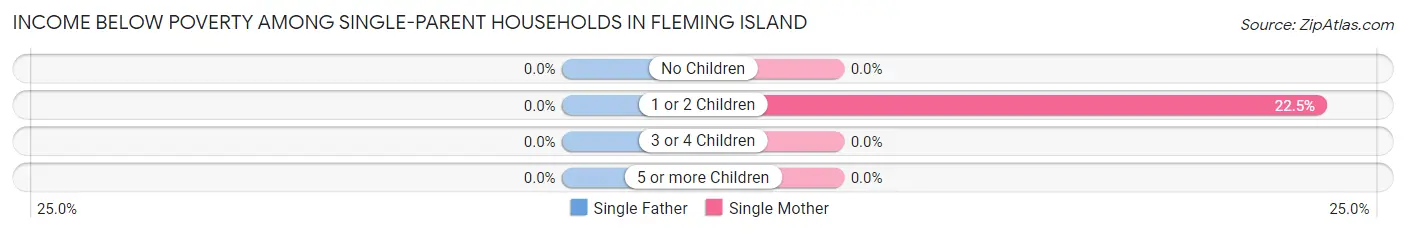
Income Below Poverty Among Single-Parent Households in Fleming Island
| Children | Single Father | Single Mother |
| No Children | 0 (0.0%) | 0 (0.0%) |
| 1 or 2 Children | 0 (0.0%) | 81 (22.5%) |
| 3 or 4 Children | 0 (0.0%) | 0 (0.0%) |
| 5 or more Children | 0 (0.0%) | 0 (0.0%) |
| Total | 0 (0.0%) | 81 (9.9%) |
Income Below Poverty Among Married-Couple vs Single-Parent Households in Fleming Island
The poverty data for Fleming Island shows that 218 of the married-couple family households (2.7%) and 81 of the single-parent households (7.9%) are living below the poverty level. Within the married-couple family households, those with 3 or 4 children have the highest poverty rate, with 64 households (12.4%) falling below the poverty line. Among the single-parent households, those with 1 or 2 children have the highest poverty rate, with 81 household (17.9%) living below poverty.
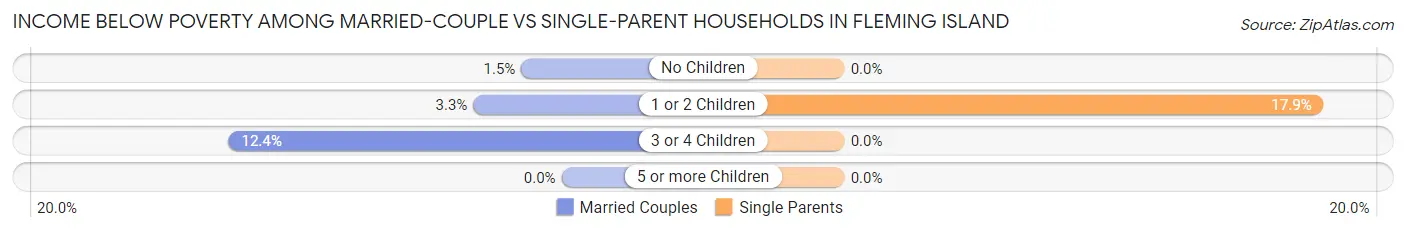
| Children | Married-Couple Families | Single-Parent Households |
| No Children | 79 (1.5%) | 0 (0.0%) |
| 1 or 2 Children | 75 (3.3%) | 81 (17.9%) |
| 3 or 4 Children | 64 (12.4%) | 0 (0.0%) |
| 5 or more Children | 0 (0.0%) | 0 (0.0%) |
| Total | 218 (2.7%) | 81 (7.9%) |
Employment Characteristics in Fleming Island
Employment by Class of Employer in Fleming Island
Among the 14,024 employed individuals in Fleming Island, private company employees (9,141 | 65.2%), not-for-profit organizations (1,160 | 8.3%), and federal government employees (1,145 | 8.2%) make up the most common classes of employment.
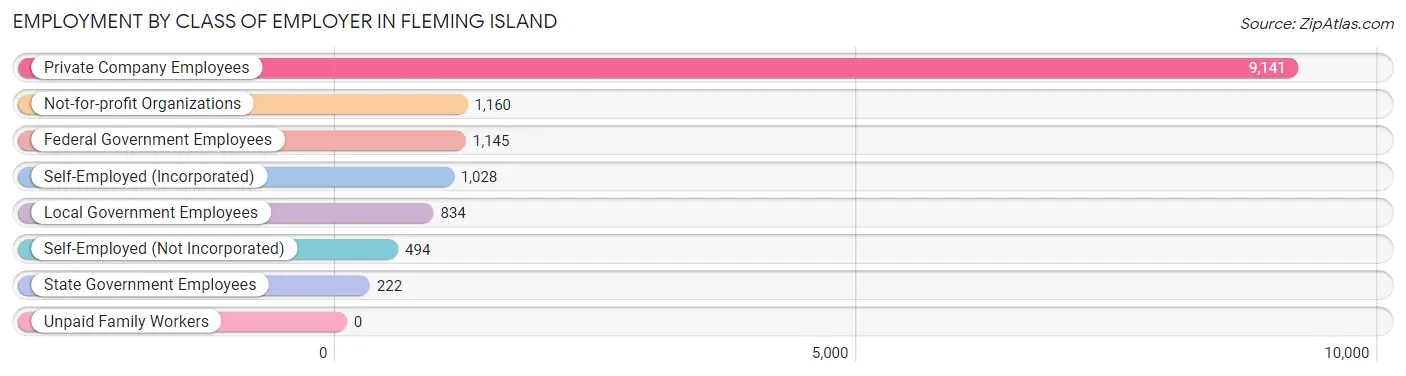
| Employer Class | # Employees | % Employees |
| Private Company Employees | 9,141 | 65.2% |
| Self-Employed (Incorporated) | 1,028 | 7.3% |
| Self-Employed (Not Incorporated) | 494 | 3.5% |
| Not-for-profit Organizations | 1,160 | 8.3% |
| Local Government Employees | 834 | 5.9% |
| State Government Employees | 222 | 1.6% |
| Federal Government Employees | 1,145 | 8.2% |
| Unpaid Family Workers | 0 | 0.0% |
| Total | 14,024 | 100.0% |
Employment Status by Age in Fleming Island
According to the labor force statistics for Fleming Island, out of the total population over 16 years of age (25,078), 58.8% or 14,746 individuals are in the labor force, with 4.3% or 634 of them unemployed. The age group with the highest labor force participation rate is 45 to 54 years, with 87.5% or 4,014 individuals in the labor force. Within the labor force, the 16 to 19 years age range has the highest percentage of unemployed individuals, with 35.2% or 168 of them being unemployed.
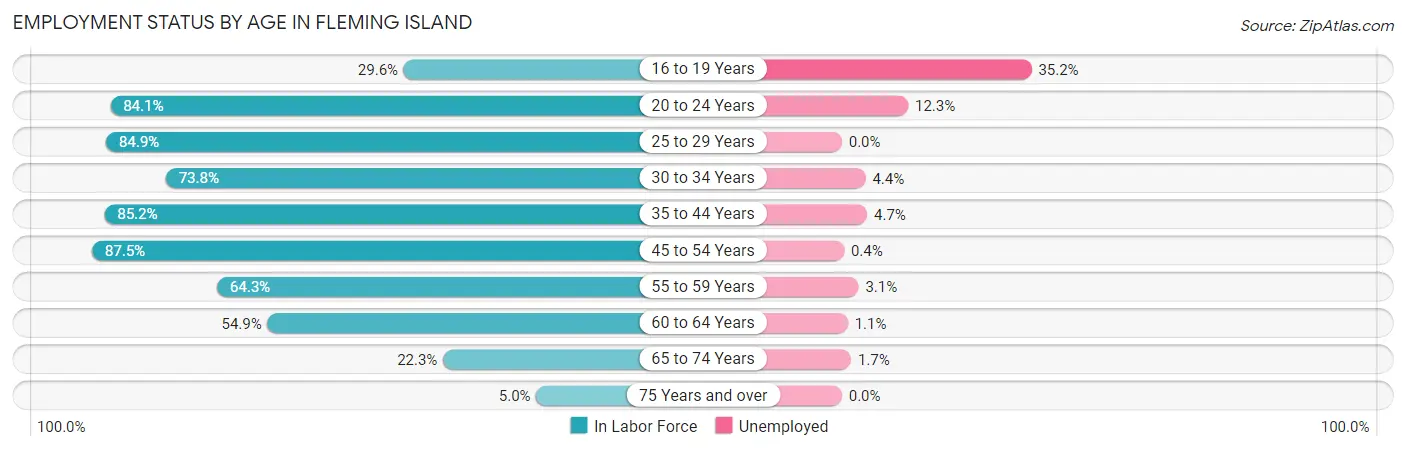
| Age Bracket | In Labor Force | Unemployed |
| 16 to 19 Years | 477 (29.6%) | 168 (35.2%) |
| 20 to 24 Years | 1,622 (84.1%) | 200 (12.3%) |
| 25 to 29 Years | 969 (84.9%) | 0 (0.0%) |
| 30 to 34 Years | 1,055 (73.8%) | 46 (4.4%) |
| 35 to 44 Years | 2,846 (85.2%) | 134 (4.7%) |
| 45 to 54 Years | 4,014 (87.5%) | 16 (0.4%) |
| 55 to 59 Years | 1,505 (64.3%) | 47 (3.1%) |
| 60 to 64 Years | 1,304 (54.9%) | 14 (1.1%) |
| 65 to 74 Years | 822 (22.3%) | 14 (1.7%) |
| 75 Years and over | 132 (5.0%) | 0 (0.0%) |
| Total | 14,746 (58.8%) | 634 (4.3%) |
Employment Status by Educational Attainment in Fleming Island
According to labor force statistics for Fleming Island, 76.9% of individuals (11,700) out of the total population between 25 and 64 years of age (15,215) are in the labor force, with 2.2% or 257 of them being unemployed. The group with the highest labor force participation rate are those with the educational attainment of bachelor's degree or higher, with 84.8% or 6,502 individuals in the labor force. Within the labor force, individuals with college / associate degree education have the highest percentage of unemployment, with 6.2% or 203 of them being unemployed.
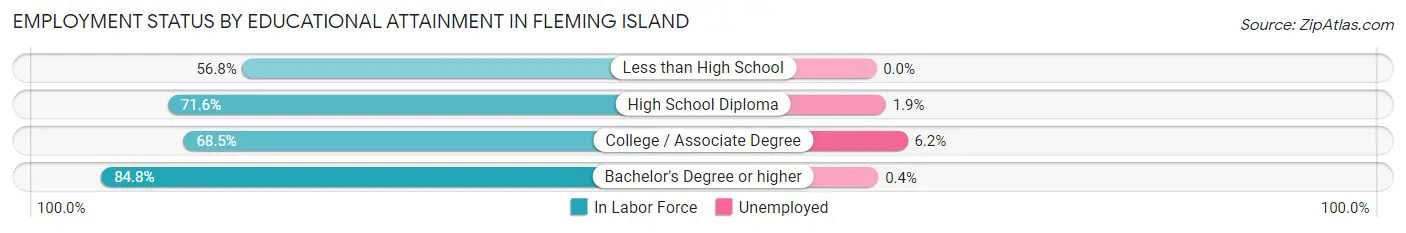
| Educational Attainment | In Labor Force | Unemployed |
| Less than High School | 254 (56.8%) | 0 (0.0%) |
| High School Diploma | 1,654 (71.6%) | 44 (1.9%) |
| College / Associate Degree | 3,281 (68.5%) | 297 (6.2%) |
| Bachelor's Degree or higher | 6,502 (84.8%) | 31 (0.4%) |
| Total | 11,700 (76.9%) | 335 (2.2%) |
Employment Occupations by Sex in Fleming Island
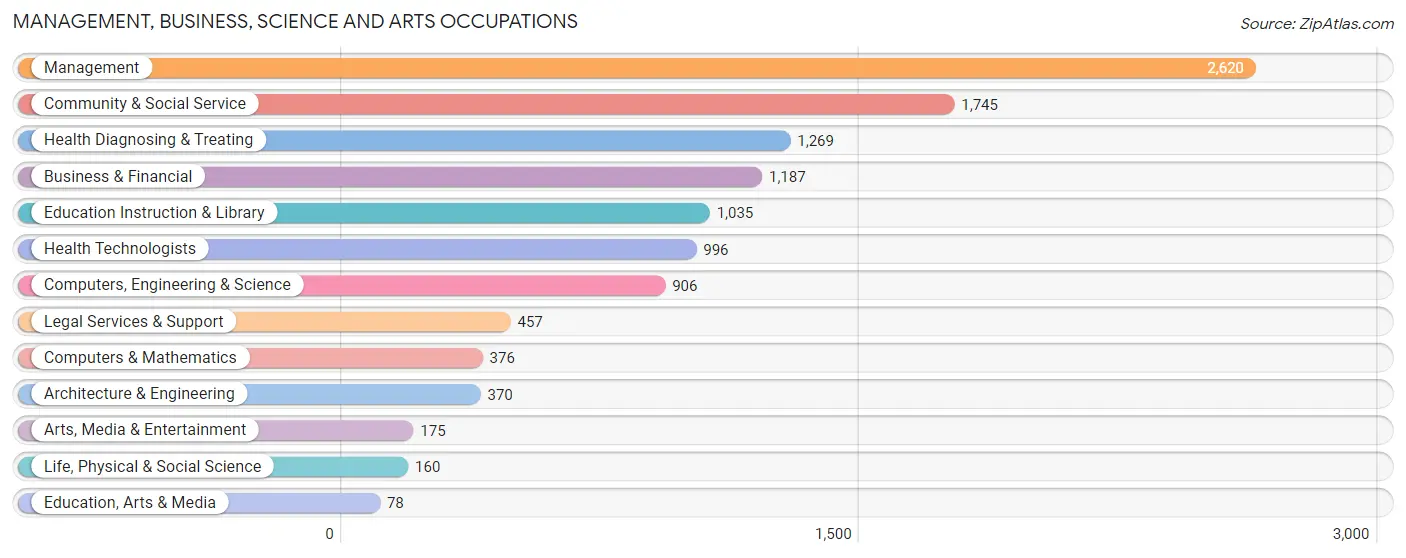
Management, Business, Science and Arts Occupations
The most common Management, Business, Science and Arts occupations in Fleming Island are Management (2,620 | 19.3%), Community & Social Service (1,745 | 12.8%), Health Diagnosing & Treating (1,269 | 9.3%), Business & Financial (1,187 | 8.7%), and Education Instruction & Library (1,035 | 7.6%).
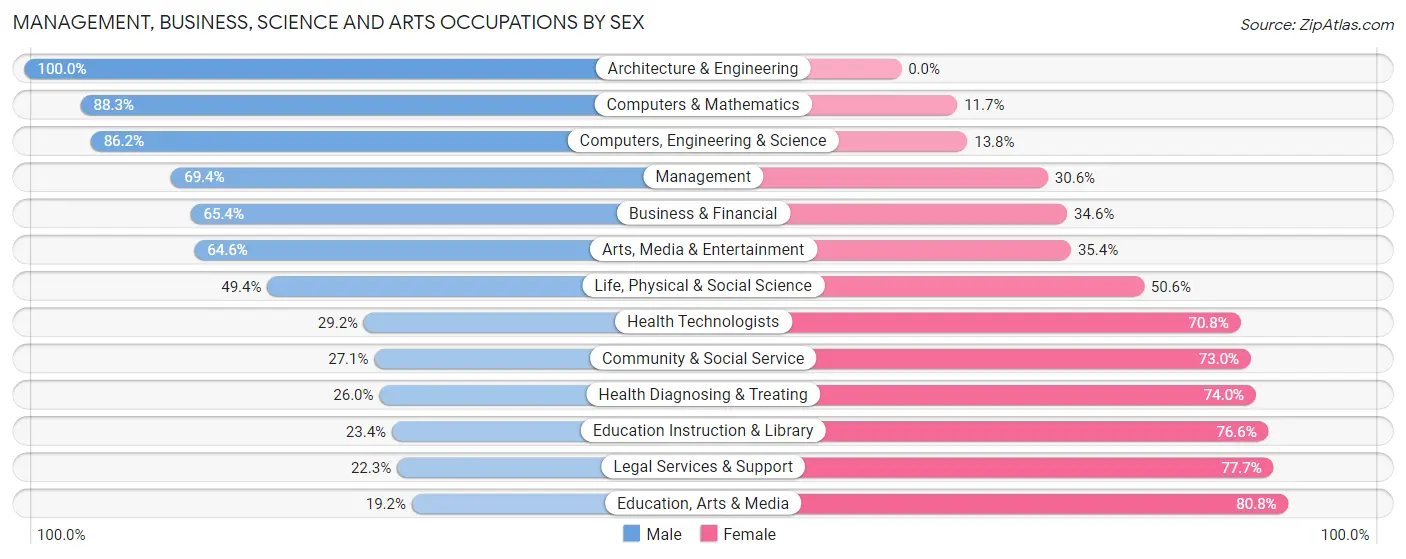
Management, Business, Science and Arts Occupations by Sex
Within the Management, Business, Science and Arts occupations in Fleming Island, the most male-oriented occupations are Architecture & Engineering (100.0%), Computers & Mathematics (88.3%), and Computers, Engineering & Science (86.2%), while the most female-oriented occupations are Education, Arts & Media (80.8%), Legal Services & Support (77.7%), and Education Instruction & Library (76.6%).
| Occupation | Male | Female |
| Management | 1,818 (69.4%) | 802 (30.6%) |
| Business & Financial | 776 (65.4%) | 411 (34.6%) |
| Computers, Engineering & Science | 781 (86.2%) | 125 (13.8%) |
| Computers & Mathematics | 332 (88.3%) | 44 (11.7%) |
| Architecture & Engineering | 370 (100.0%) | 0 (0.0%) |
| Life, Physical & Social Science | 79 (49.4%) | 81 (50.6%) |
| Community & Social Service | 472 (27.1%) | 1,273 (73.0%) |
| Education, Arts & Media | 15 (19.2%) | 63 (80.8%) |
| Legal Services & Support | 102 (22.3%) | 355 (77.7%) |
| Education Instruction & Library | 242 (23.4%) | 793 (76.6%) |
| Arts, Media & Entertainment | 113 (64.6%) | 62 (35.4%) |
| Health Diagnosing & Treating | 330 (26.0%) | 939 (74.0%) |
| Health Technologists | 291 (29.2%) | 705 (70.8%) |
| Total (Category) | 4,177 (54.1%) | 3,550 (45.9%) |
| Total (Overall) | 7,135 (52.5%) | 6,453 (47.5%) |
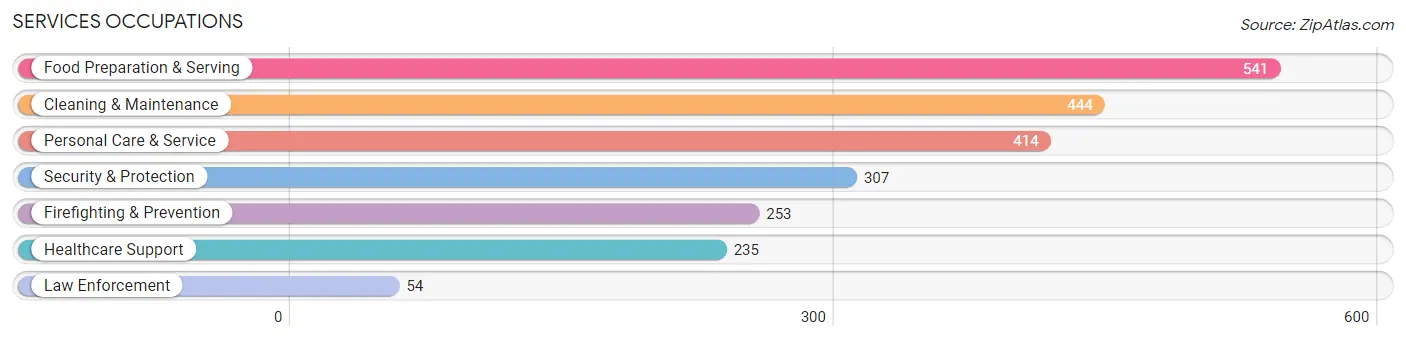
Services Occupations
The most common Services occupations in Fleming Island are Food Preparation & Serving (541 | 4.0%), Cleaning & Maintenance (444 | 3.3%), Personal Care & Service (414 | 3.0%), Security & Protection (307 | 2.3%), and Firefighting & Prevention (253 | 1.9%).
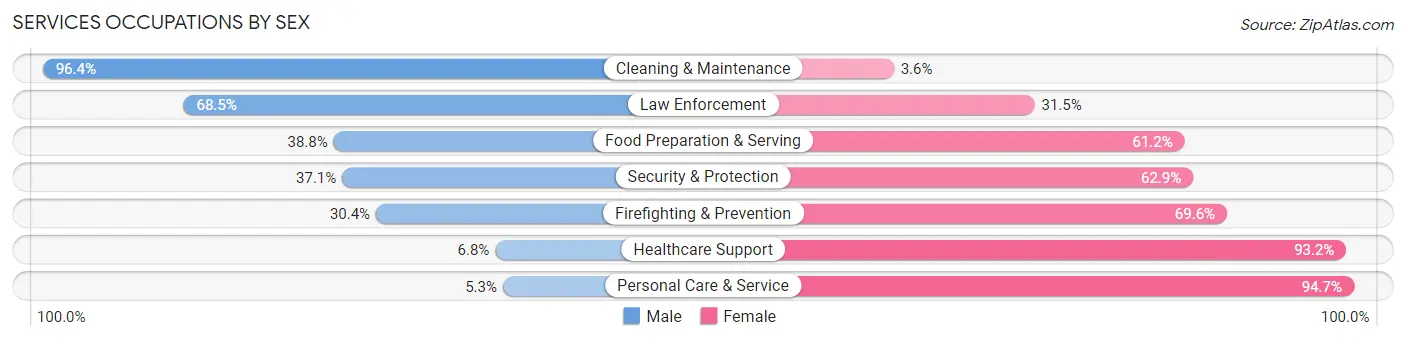
Services Occupations by Sex
Within the Services occupations in Fleming Island, the most male-oriented occupations are Cleaning & Maintenance (96.4%), Law Enforcement (68.5%), and Food Preparation & Serving (38.8%), while the most female-oriented occupations are Personal Care & Service (94.7%), Healthcare Support (93.2%), and Firefighting & Prevention (69.6%).
| Occupation | Male | Female |
| Healthcare Support | 16 (6.8%) | 219 (93.2%) |
| Security & Protection | 114 (37.1%) | 193 (62.9%) |
| Firefighting & Prevention | 77 (30.4%) | 176 (69.6%) |
| Law Enforcement | 37 (68.5%) | 17 (31.5%) |
| Food Preparation & Serving | 210 (38.8%) | 331 (61.2%) |
| Cleaning & Maintenance | 428 (96.4%) | 16 (3.6%) |
| Personal Care & Service | 22 (5.3%) | 392 (94.7%) |
| Total (Category) | 790 (40.7%) | 1,151 (59.3%) |
| Total (Overall) | 7,135 (52.5%) | 6,453 (47.5%) |
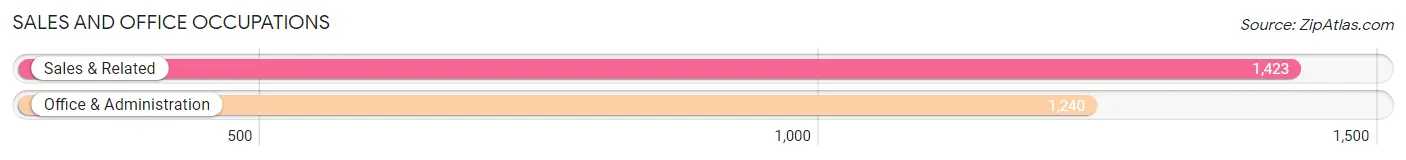
Sales and Office Occupations
The most common Sales and Office occupations in Fleming Island are Sales & Related (1,423 | 10.5%), and Office & Administration (1,240 | 9.1%).
Sales and Office Occupations by Sex
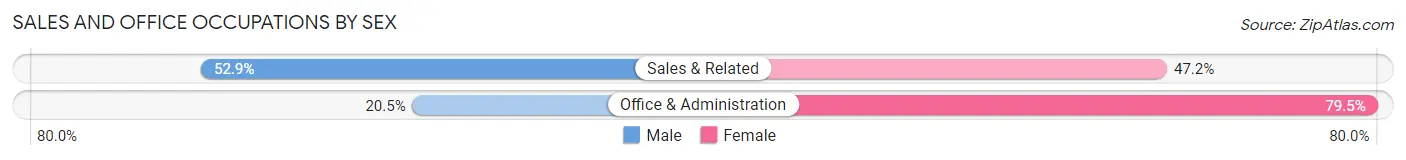
| Occupation | Male | Female |
| Sales & Related | 752 (52.8%) | 671 (47.1%) |
| Office & Administration | 254 (20.5%) | 986 (79.5%) |
| Total (Category) | 1,006 (37.8%) | 1,657 (62.2%) |
| Total (Overall) | 7,135 (52.5%) | 6,453 (47.5%) |
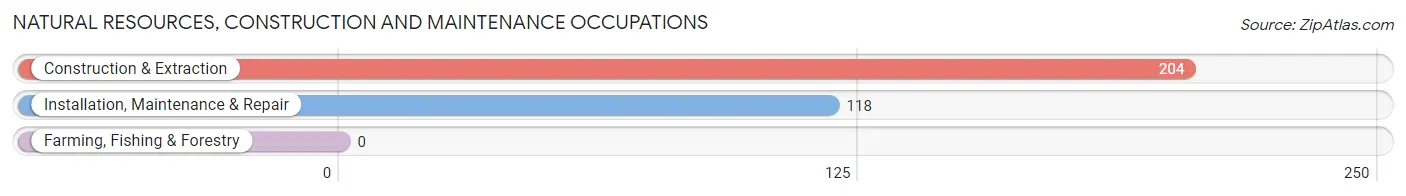
Natural Resources, Construction and Maintenance Occupations
The most common Natural Resources, Construction and Maintenance occupations in Fleming Island are Construction & Extraction (204 | 1.5%), and Installation, Maintenance & Repair (118 | 0.9%).
Natural Resources, Construction and Maintenance Occupations by Sex
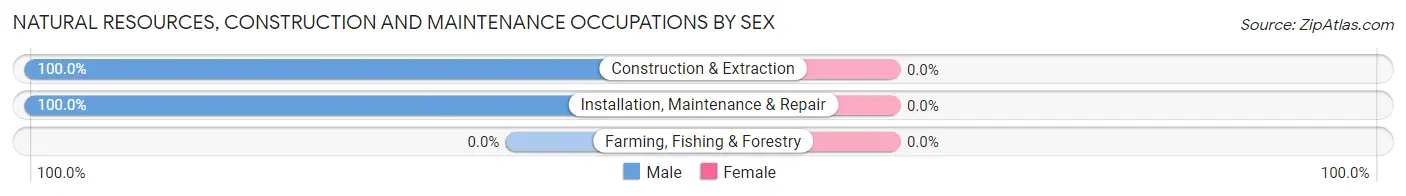
| Occupation | Male | Female |
| Farming, Fishing & Forestry | 0 (0.0%) | 0 (0.0%) |
| Construction & Extraction | 204 (100.0%) | 0 (0.0%) |
| Installation, Maintenance & Repair | 118 (100.0%) | 0 (0.0%) |
| Total (Category) | 322 (100.0%) | 0 (0.0%) |
| Total (Overall) | 7,135 (52.5%) | 6,453 (47.5%) |
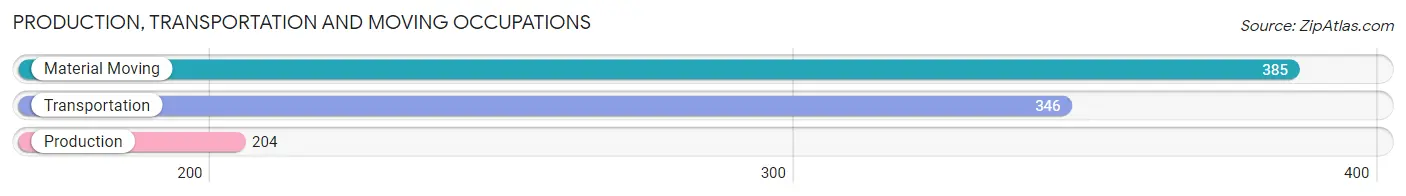
Production, Transportation and Moving Occupations
The most common Production, Transportation and Moving occupations in Fleming Island are Material Moving (385 | 2.8%), Transportation (346 | 2.5%), and Production (204 | 1.5%).
Production, Transportation and Moving Occupations by Sex
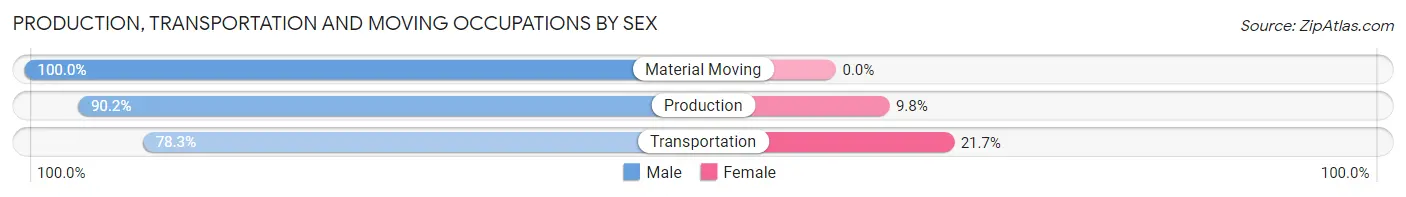
| Occupation | Male | Female |
| Production | 184 (90.2%) | 20 (9.8%) |
| Transportation | 271 (78.3%) | 75 (21.7%) |
| Material Moving | 385 (100.0%) | 0 (0.0%) |
| Total (Category) | 840 (89.8%) | 95 (10.2%) |
| Total (Overall) | 7,135 (52.5%) | 6,453 (47.5%) |
Employment Industries by Sex in Fleming Island
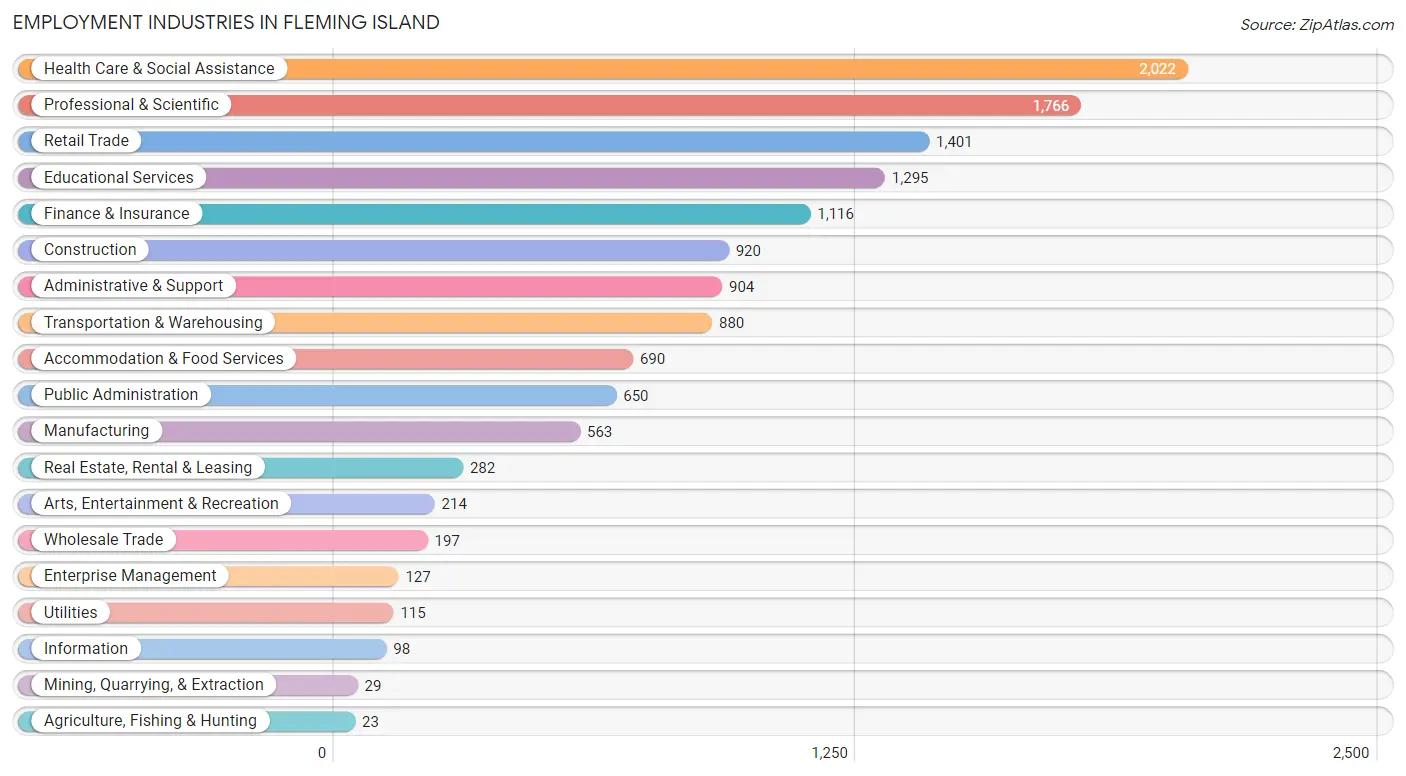
Employment Industries in Fleming Island
The major employment industries in Fleming Island include Health Care & Social Assistance (2,022 | 14.9%), Professional & Scientific (1,766 | 13.0%), Retail Trade (1,401 | 10.3%), Educational Services (1,295 | 9.5%), and Finance & Insurance (1,116 | 8.2%).
Employment Industries by Sex in Fleming Island
The Fleming Island industries that see more men than women are Agriculture, Fishing & Hunting (100.0%), Utilities (100.0%), and Enterprise Management (100.0%), whereas the industries that tend to have a higher number of women are Mining, Quarrying, & Extraction (100.0%), Educational Services (76.3%), and Health Care & Social Assistance (69.5%).
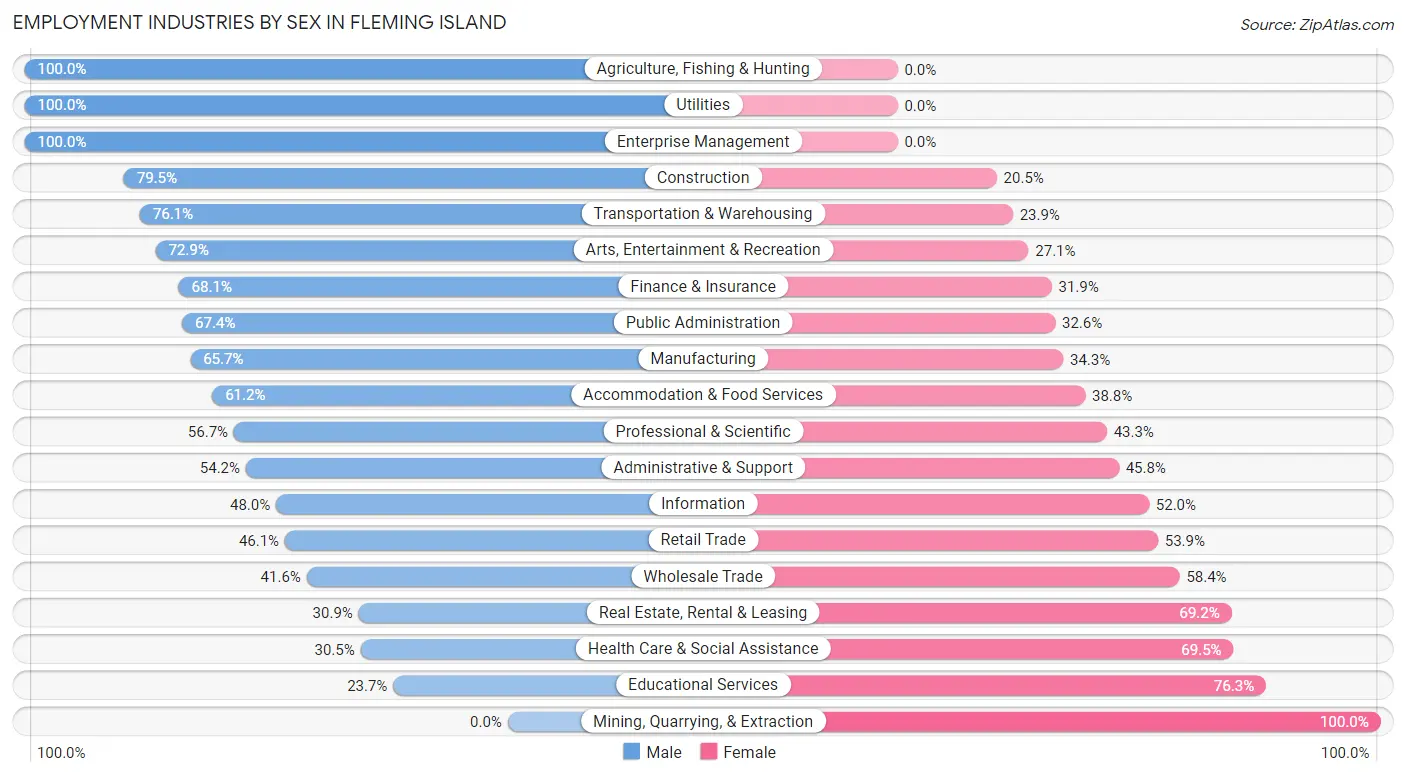
| Industry | Male | Female |
| Agriculture, Fishing & Hunting | 23 (100.0%) | 0 (0.0%) |
| Mining, Quarrying, & Extraction | 0 (0.0%) | 29 (100.0%) |
| Construction | 731 (79.5%) | 189 (20.5%) |
| Manufacturing | 370 (65.7%) | 193 (34.3%) |
| Wholesale Trade | 82 (41.6%) | 115 (58.4%) |
| Retail Trade | 646 (46.1%) | 755 (53.9%) |
| Transportation & Warehousing | 670 (76.1%) | 210 (23.9%) |
| Utilities | 115 (100.0%) | 0 (0.0%) |
| Information | 47 (48.0%) | 51 (52.0%) |
| Finance & Insurance | 760 (68.1%) | 356 (31.9%) |
| Real Estate, Rental & Leasing | 87 (30.8%) | 195 (69.2%) |
| Professional & Scientific | 1,001 (56.7%) | 765 (43.3%) |
| Enterprise Management | 127 (100.0%) | 0 (0.0%) |
| Administrative & Support | 490 (54.2%) | 414 (45.8%) |
| Educational Services | 307 (23.7%) | 988 (76.3%) |
| Health Care & Social Assistance | 616 (30.5%) | 1,406 (69.5%) |
| Arts, Entertainment & Recreation | 156 (72.9%) | 58 (27.1%) |
| Accommodation & Food Services | 422 (61.2%) | 268 (38.8%) |
| Public Administration | 438 (67.4%) | 212 (32.6%) |
| Total | 7,135 (52.5%) | 6,453 (47.5%) |
Education in Fleming Island
School Enrollment in Fleming Island
The most common levels of schooling among the 7,154 students in Fleming Island are high school (1,902 | 26.6%), college / undergraduate (1,734 | 24.2%), and elementary school (1,200 | 16.8%).
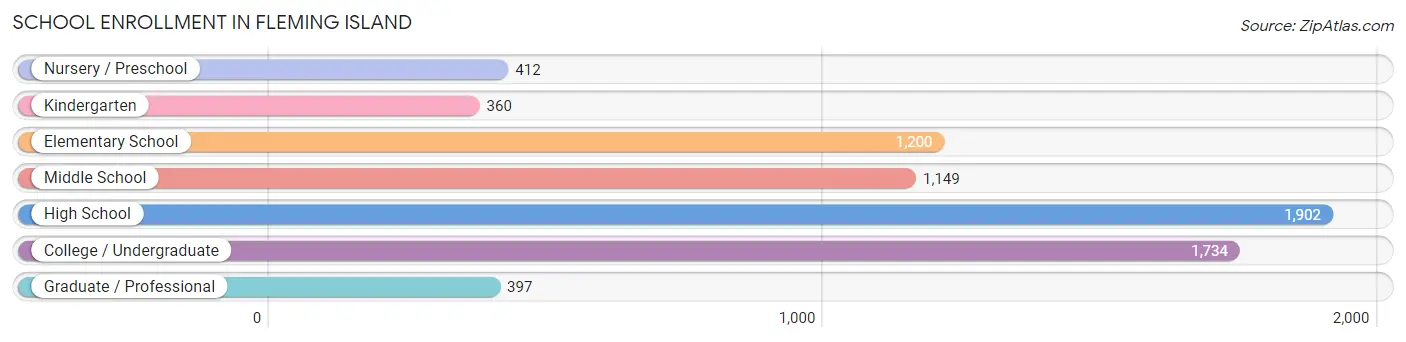
| School Level | # Students | % Students |
| Nursery / Preschool | 412 | 5.8% |
| Kindergarten | 360 | 5.0% |
| Elementary School | 1,200 | 16.8% |
| Middle School | 1,149 | 16.1% |
| High School | 1,902 | 26.6% |
| College / Undergraduate | 1,734 | 24.2% |
| Graduate / Professional | 397 | 5.6% |
| Total | 7,154 | 100.0% |
School Enrollment by Age by Funding Source in Fleming Island
Out of a total of 7,154 students who are enrolled in schools in Fleming Island, 1,195 (16.7%) attend a private institution, while the remaining 5,959 (83.3%) are enrolled in public schools. The age group of 3 to 4 year olds has the highest likelihood of being enrolled in private schools, with 285 (77.9% in the age bracket) enrolled. Conversely, the age group of 18 to 19 year olds has the lowest likelihood of being enrolled in a private school, with 532 (100.0% in the age bracket) attending a public institution.
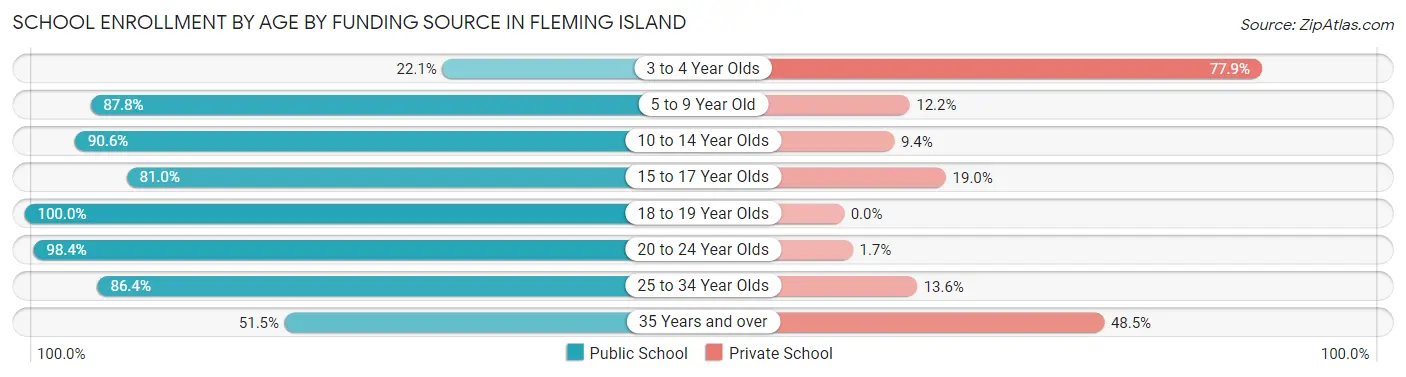
| Age Bracket | Public School | Private School |
| 3 to 4 Year Olds | 81 (22.1%) | 285 (77.9%) |
| 5 to 9 Year Old | 1,286 (87.8%) | 179 (12.2%) |
| 10 to 14 Year Olds | 1,421 (90.6%) | 147 (9.4%) |
| 15 to 17 Year Olds | 1,139 (81.0%) | 267 (19.0%) |
| 18 to 19 Year Olds | 532 (100.0%) | 0 (0.0%) |
| 20 to 24 Year Olds | 1,011 (98.4%) | 17 (1.7%) |
| 25 to 34 Year Olds | 197 (86.4%) | 31 (13.6%) |
| 35 Years and over | 289 (51.5%) | 272 (48.5%) |
| Total | 5,959 (83.3%) | 1,195 (16.7%) |
Educational Attainment by Field of Study in Fleming Island
Business (2,102 | 19.0%), education (2,078 | 18.8%), science & technology (1,222 | 11.0%), engineering (1,055 | 9.5%), and bio, nature & agricultural (867 | 7.8%) are the most common fields of study among 11,073 individuals in Fleming Island who have obtained a bachelor's degree or higher.
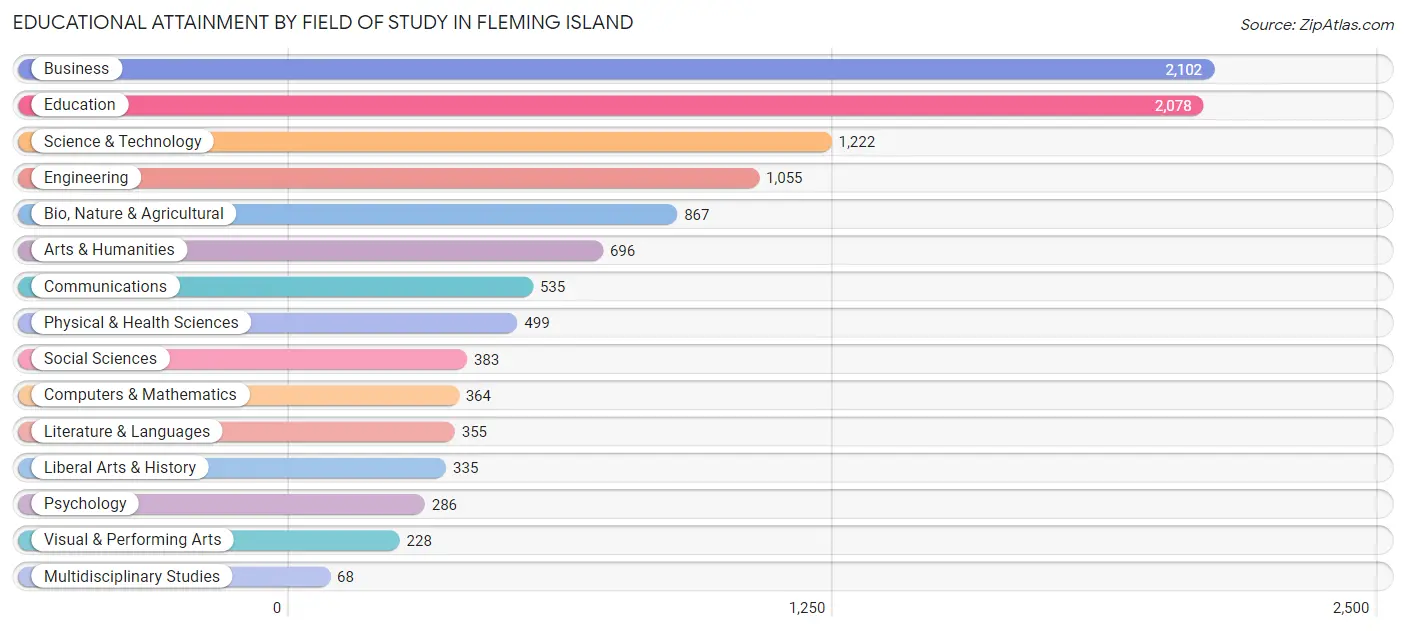
| Field of Study | # Graduates | % Graduates |
| Computers & Mathematics | 364 | 3.3% |
| Bio, Nature & Agricultural | 867 | 7.8% |
| Physical & Health Sciences | 499 | 4.5% |
| Psychology | 286 | 2.6% |
| Social Sciences | 383 | 3.5% |
| Engineering | 1,055 | 9.5% |
| Multidisciplinary Studies | 68 | 0.6% |
| Science & Technology | 1,222 | 11.0% |
| Business | 2,102 | 19.0% |
| Education | 2,078 | 18.8% |
| Literature & Languages | 355 | 3.2% |
| Liberal Arts & History | 335 | 3.0% |
| Visual & Performing Arts | 228 | 2.1% |
| Communications | 535 | 4.8% |
| Arts & Humanities | 696 | 6.3% |
| Total | 11,073 | 100.0% |
Transportation & Commute in Fleming Island
Vehicle Availability by Sex in Fleming Island
The most prevalent vehicle ownership categories in Fleming Island are males with 2 vehicles (3,623, accounting for 47.7%) and females with 2 vehicles (3,029, making up 56.3%).
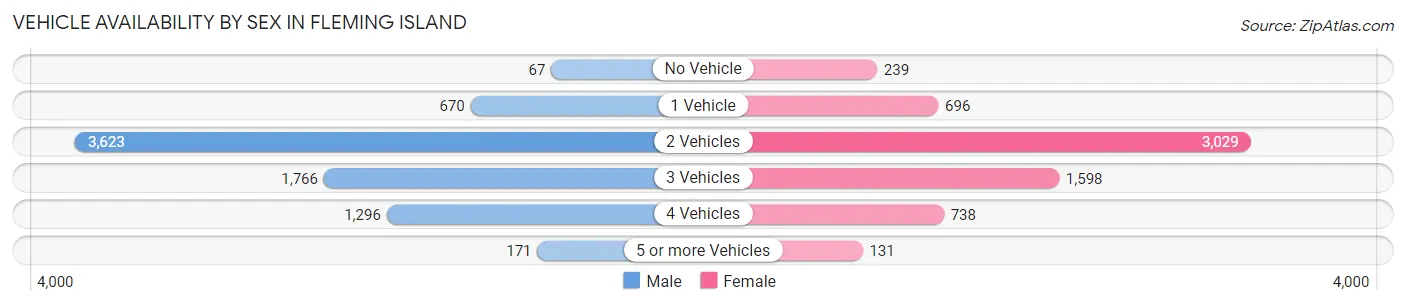
| Vehicles Available | Male | Female |
| No Vehicle | 67 (0.9%) | 239 (3.7%) |
| 1 Vehicle | 670 (8.8%) | 696 (10.8%) |
| 2 Vehicles | 3,623 (47.7%) | 3,029 (47.1%) |
| 3 Vehicles | 1,766 (23.3%) | 1,598 (24.8%) |
| 4 Vehicles | 1,296 (17.1%) | 738 (11.5%) |
| 5 or more Vehicles | 171 (2.2%) | 131 (2.0%) |
| Total | 7,593 (100.0%) | 6,431 (100.0%) |
Commute Time in Fleming Island
The most frequently occuring commute durations in Fleming Island are 15 to 19 minutes (1,639 commuters, 14.1%), 30 to 34 minutes (1,489 commuters, 12.8%), and 45 to 59 minutes (1,450 commuters, 12.4%).
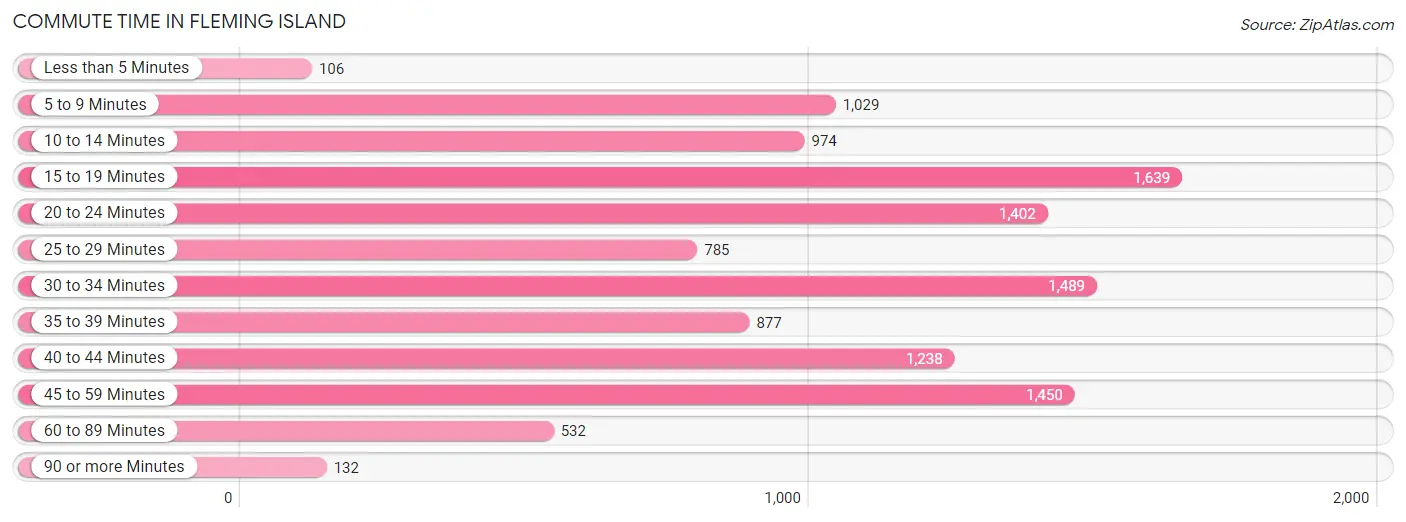
| Commute Time | # Commuters | % Commuters |
| Less than 5 Minutes | 106 | 0.9% |
| 5 to 9 Minutes | 1,029 | 8.8% |
| 10 to 14 Minutes | 974 | 8.4% |
| 15 to 19 Minutes | 1,639 | 14.1% |
| 20 to 24 Minutes | 1,402 | 12.0% |
| 25 to 29 Minutes | 785 | 6.7% |
| 30 to 34 Minutes | 1,489 | 12.8% |
| 35 to 39 Minutes | 877 | 7.5% |
| 40 to 44 Minutes | 1,238 | 10.6% |
| 45 to 59 Minutes | 1,450 | 12.4% |
| 60 to 89 Minutes | 532 | 4.6% |
| 90 or more Minutes | 132 | 1.1% |
Commute Time by Sex in Fleming Island
The most common commute times in Fleming Island are 30 to 34 minutes (1,053 commuters, 16.5%) for males and 15 to 19 minutes (944 commuters, 17.9%) for females.
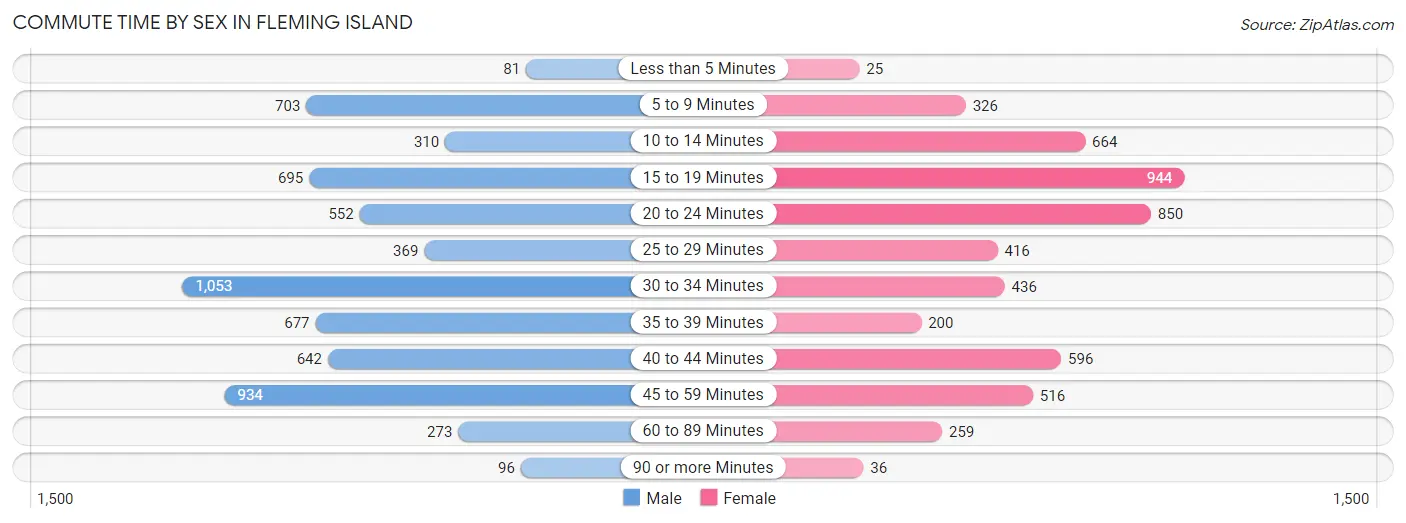
| Commute Time | Male | Female |
| Less than 5 Minutes | 81 (1.3%) | 25 (0.5%) |
| 5 to 9 Minutes | 703 (11.0%) | 326 (6.2%) |
| 10 to 14 Minutes | 310 (4.9%) | 664 (12.6%) |
| 15 to 19 Minutes | 695 (10.9%) | 944 (17.9%) |
| 20 to 24 Minutes | 552 (8.6%) | 850 (16.1%) |
| 25 to 29 Minutes | 369 (5.8%) | 416 (7.9%) |
| 30 to 34 Minutes | 1,053 (16.5%) | 436 (8.3%) |
| 35 to 39 Minutes | 677 (10.6%) | 200 (3.8%) |
| 40 to 44 Minutes | 642 (10.1%) | 596 (11.3%) |
| 45 to 59 Minutes | 934 (14.6%) | 516 (9.8%) |
| 60 to 89 Minutes | 273 (4.3%) | 259 (4.9%) |
| 90 or more Minutes | 96 (1.5%) | 36 (0.7%) |
Time of Departure to Work by Sex in Fleming Island
The most frequent times of departure to work in Fleming Island are 6:00 AM to 6:29 AM (1,057, 16.6%) for males and 8:00 AM to 8:29 AM (920, 17.5%) for females.
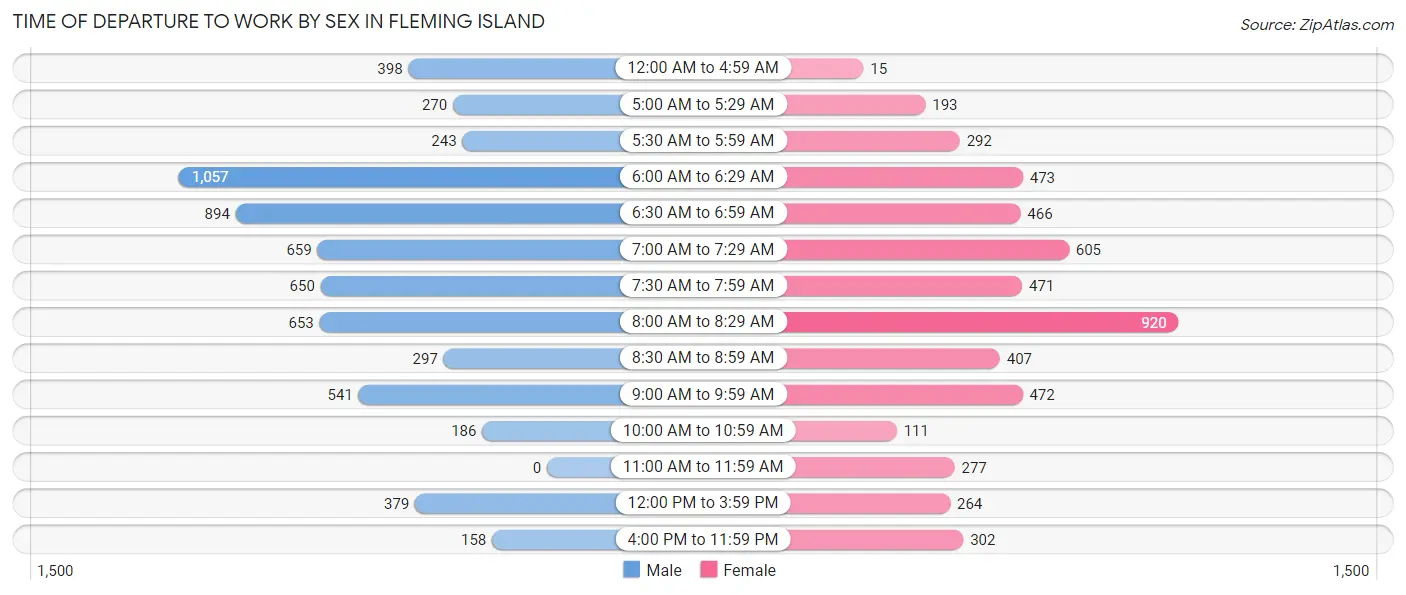
| Time of Departure | Male | Female |
| 12:00 AM to 4:59 AM | 398 (6.2%) | 15 (0.3%) |
| 5:00 AM to 5:29 AM | 270 (4.2%) | 193 (3.7%) |
| 5:30 AM to 5:59 AM | 243 (3.8%) | 292 (5.5%) |
| 6:00 AM to 6:29 AM | 1,057 (16.6%) | 473 (9.0%) |
| 6:30 AM to 6:59 AM | 894 (14.0%) | 466 (8.8%) |
| 7:00 AM to 7:29 AM | 659 (10.3%) | 605 (11.5%) |
| 7:30 AM to 7:59 AM | 650 (10.2%) | 471 (8.9%) |
| 8:00 AM to 8:29 AM | 653 (10.2%) | 920 (17.5%) |
| 8:30 AM to 8:59 AM | 297 (4.6%) | 407 (7.7%) |
| 9:00 AM to 9:59 AM | 541 (8.5%) | 472 (9.0%) |
| 10:00 AM to 10:59 AM | 186 (2.9%) | 111 (2.1%) |
| 11:00 AM to 11:59 AM | 0 (0.0%) | 277 (5.3%) |
| 12:00 PM to 3:59 PM | 379 (5.9%) | 264 (5.0%) |
| 4:00 PM to 11:59 PM | 158 (2.5%) | 302 (5.7%) |
| Total | 6,385 (100.0%) | 5,268 (100.0%) |
Housing Occupancy in Fleming Island
Occupancy by Ownership in Fleming Island
Of the total 11,291 dwellings in Fleming Island, owner-occupied units account for 9,616 (85.2%), while renter-occupied units make up 1,675 (14.8%).
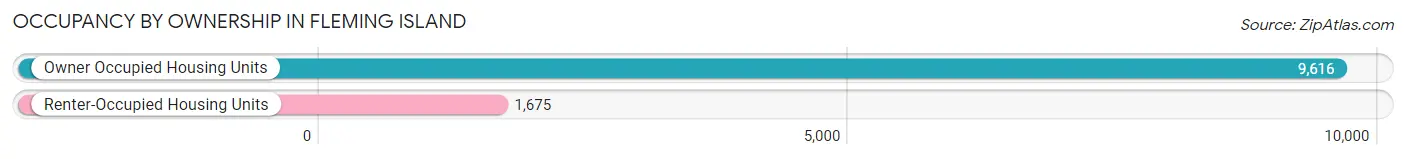
| Occupancy | # Housing Units | % Housing Units |
| Owner Occupied Housing Units | 9,616 | 85.2% |
| Renter-Occupied Housing Units | 1,675 | 14.8% |
| Total Occupied Housing Units | 11,291 | 100.0% |
Occupancy by Household Size in Fleming Island
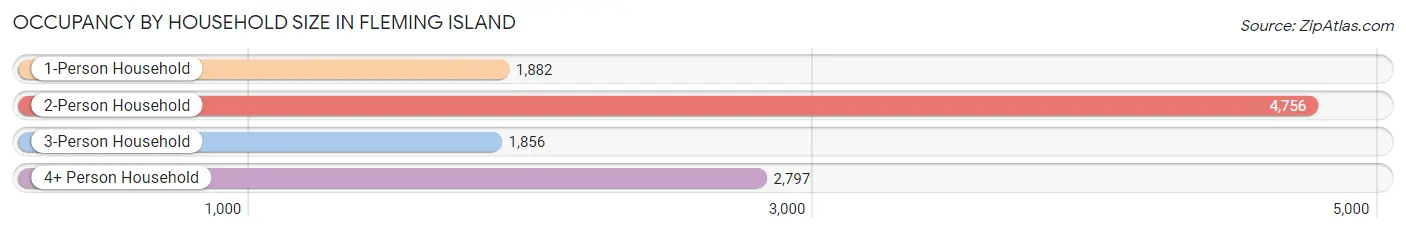
| Household Size | # Housing Units | % Housing Units |
| 1-Person Household | 1,882 | 16.7% |
| 2-Person Household | 4,756 | 42.1% |
| 3-Person Household | 1,856 | 16.4% |
| 4+ Person Household | 2,797 | 24.8% |
| Total Housing Units | 11,291 | 100.0% |
Occupancy by Ownership by Household Size in Fleming Island
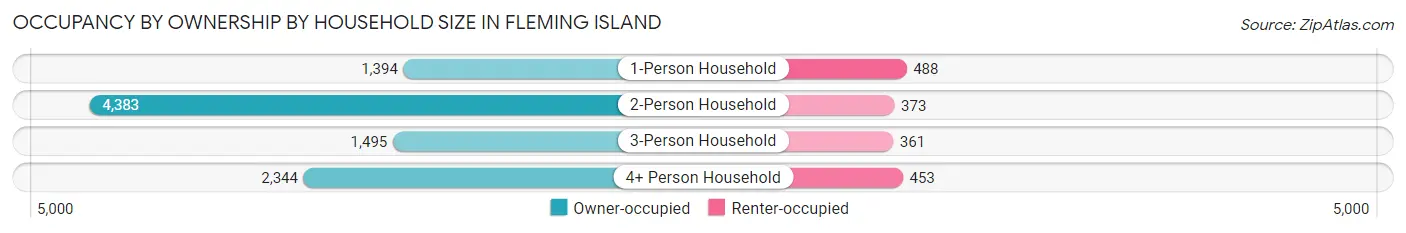
| Household Size | Owner-occupied | Renter-occupied |
| 1-Person Household | 1,394 (74.1%) | 488 (25.9%) |
| 2-Person Household | 4,383 (92.2%) | 373 (7.8%) |
| 3-Person Household | 1,495 (80.5%) | 361 (19.5%) |
| 4+ Person Household | 2,344 (83.8%) | 453 (16.2%) |
| Total Housing Units | 9,616 (85.2%) | 1,675 (14.8%) |
Occupancy by Educational Attainment in Fleming Island
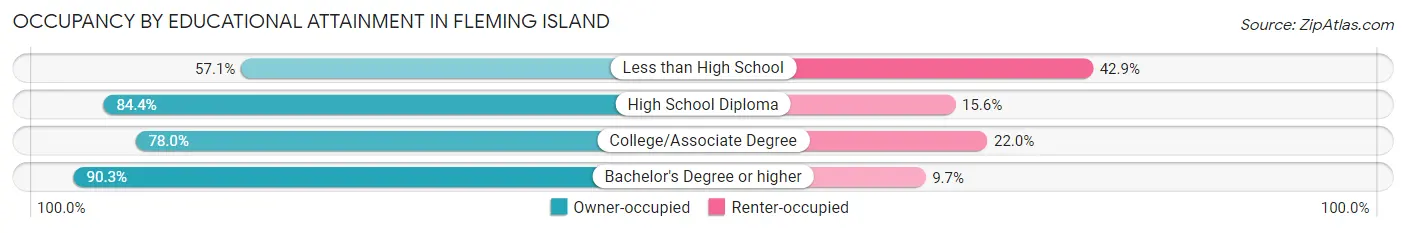
| Household Size | Owner-occupied | Renter-occupied |
| Less than High School | 101 (57.1%) | 76 (42.9%) |
| High School Diploma | 1,300 (84.4%) | 241 (15.6%) |
| College/Associate Degree | 2,714 (78.0%) | 765 (22.0%) |
| Bachelor's Degree or higher | 5,501 (90.3%) | 593 (9.7%) |
Occupancy by Age of Householder in Fleming Island
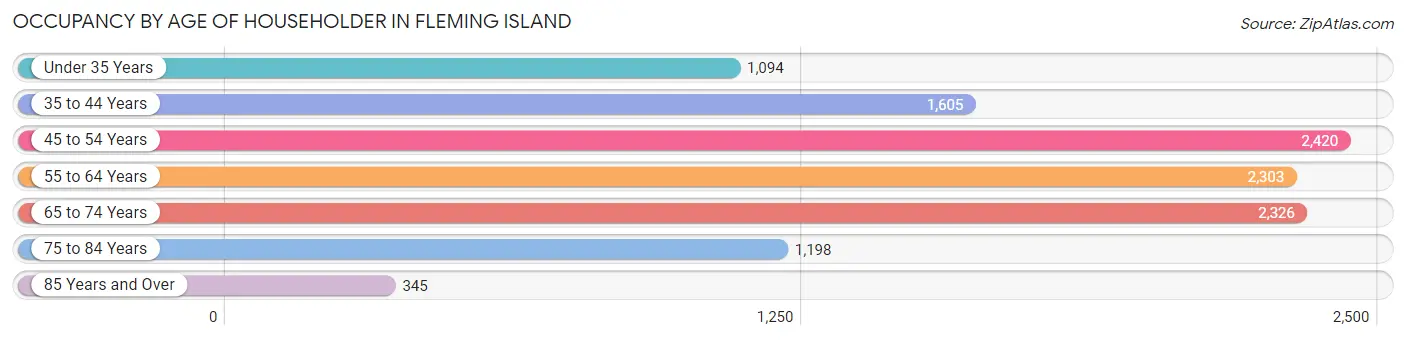
| Age Bracket | # Households | % Households |
| Under 35 Years | 1,094 | 9.7% |
| 35 to 44 Years | 1,605 | 14.2% |
| 45 to 54 Years | 2,420 | 21.4% |
| 55 to 64 Years | 2,303 | 20.4% |
| 65 to 74 Years | 2,326 | 20.6% |
| 75 to 84 Years | 1,198 | 10.6% |
| 85 Years and Over | 345 | 3.1% |
| Total | 11,291 | 100.0% |
Housing Finances in Fleming Island
Median Income by Occupancy in Fleming Island
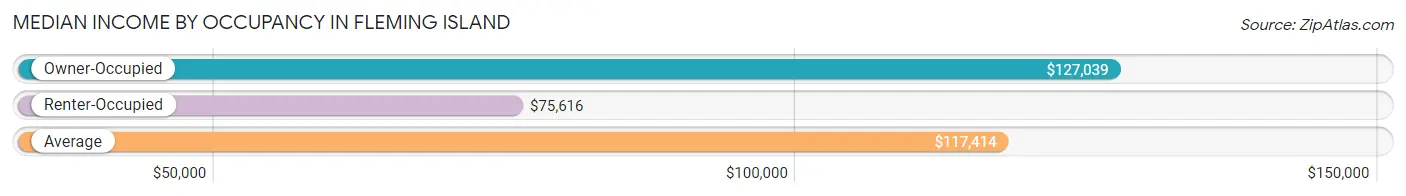
| Occupancy Type | # Households | Median Income |
| Owner-Occupied | 9,616 (85.2%) | $127,039 |
| Renter-Occupied | 1,675 (14.8%) | $75,616 |
| Average | 11,291 (100.0%) | $117,414 |
Occupancy by Householder Income Bracket in Fleming Island
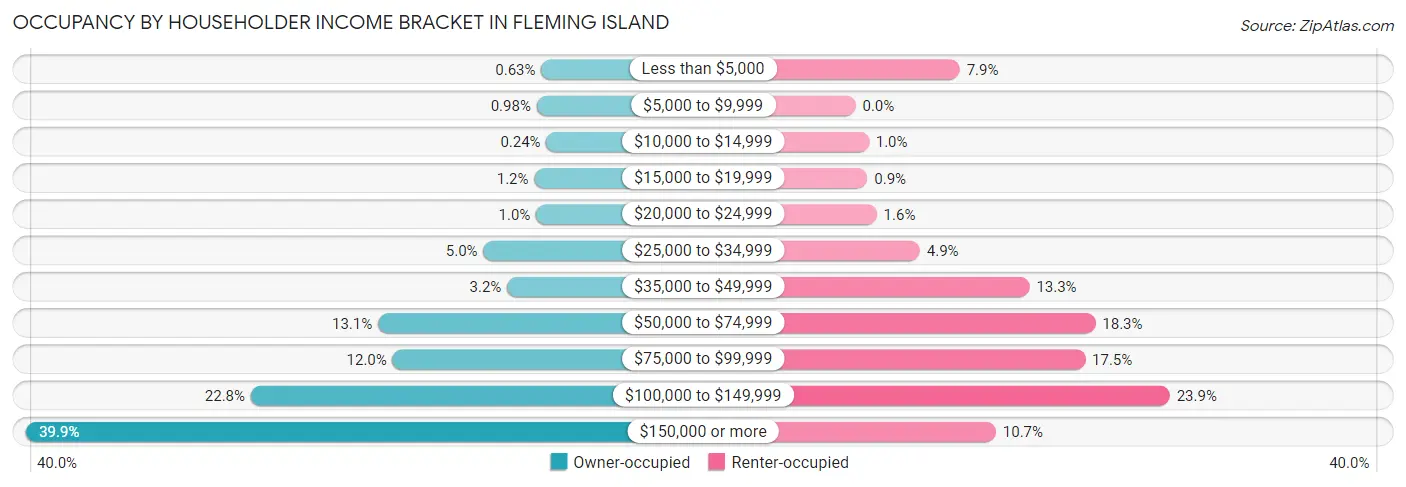
| Income Bracket | Owner-occupied | Renter-occupied |
| Less than $5,000 | 61 (0.6%) | 133 (7.9%) |
| $5,000 to $9,999 | 94 (1.0%) | 0 (0.0%) |
| $10,000 to $14,999 | 23 (0.2%) | 17 (1.0%) |
| $15,000 to $19,999 | 112 (1.2%) | 15 (0.9%) |
| $20,000 to $24,999 | 98 (1.0%) | 27 (1.6%) |
| $25,000 to $34,999 | 485 (5.0%) | 82 (4.9%) |
| $35,000 to $49,999 | 311 (3.2%) | 222 (13.3%) |
| $50,000 to $74,999 | 1,257 (13.1%) | 306 (18.3%) |
| $75,000 to $99,999 | 1,150 (12.0%) | 293 (17.5%) |
| $100,000 to $149,999 | 2,189 (22.8%) | 401 (23.9%) |
| $150,000 or more | 3,836 (39.9%) | 179 (10.7%) |
| Total | 9,616 (100.0%) | 1,675 (100.0%) |
Monthly Housing Cost Tiers in Fleming Island
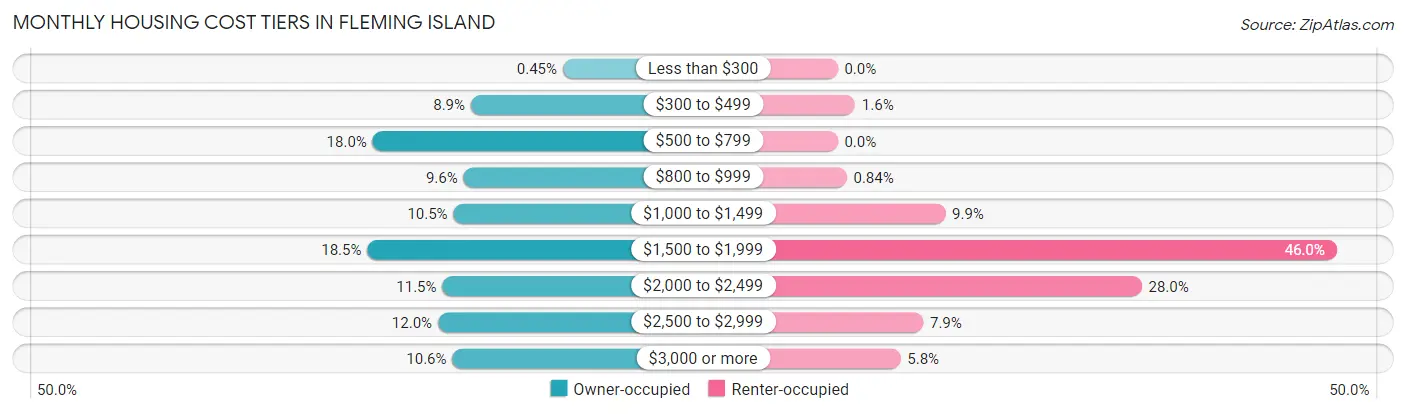
| Monthly Cost | Owner-occupied | Renter-occupied |
| Less than $300 | 43 (0.4%) | 0 (0.0%) |
| $300 to $499 | 858 (8.9%) | 27 (1.6%) |
| $500 to $799 | 1,727 (18.0%) | 0 (0.0%) |
| $800 to $999 | 922 (9.6%) | 14 (0.8%) |
| $1,000 to $1,499 | 1,012 (10.5%) | 166 (9.9%) |
| $1,500 to $1,999 | 1,774 (18.4%) | 770 (46.0%) |
| $2,000 to $2,499 | 1,110 (11.5%) | 469 (28.0%) |
| $2,500 to $2,999 | 1,149 (11.9%) | 132 (7.9%) |
| $3,000 or more | 1,021 (10.6%) | 97 (5.8%) |
| Total | 9,616 (100.0%) | 1,675 (100.0%) |
Physical Housing Characteristics in Fleming Island
Housing Structures in Fleming Island
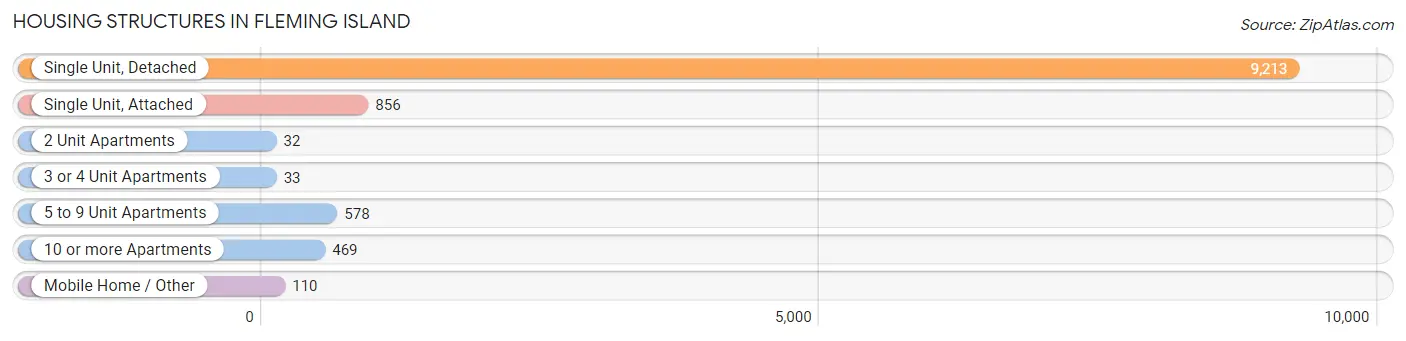
| Structure Type | # Housing Units | % Housing Units |
| Single Unit, Detached | 9,213 | 81.6% |
| Single Unit, Attached | 856 | 7.6% |
| 2 Unit Apartments | 32 | 0.3% |
| 3 or 4 Unit Apartments | 33 | 0.3% |
| 5 to 9 Unit Apartments | 578 | 5.1% |
| 10 or more Apartments | 469 | 4.2% |
| Mobile Home / Other | 110 | 1.0% |
| Total | 11,291 | 100.0% |
Housing Structures by Occupancy in Fleming Island
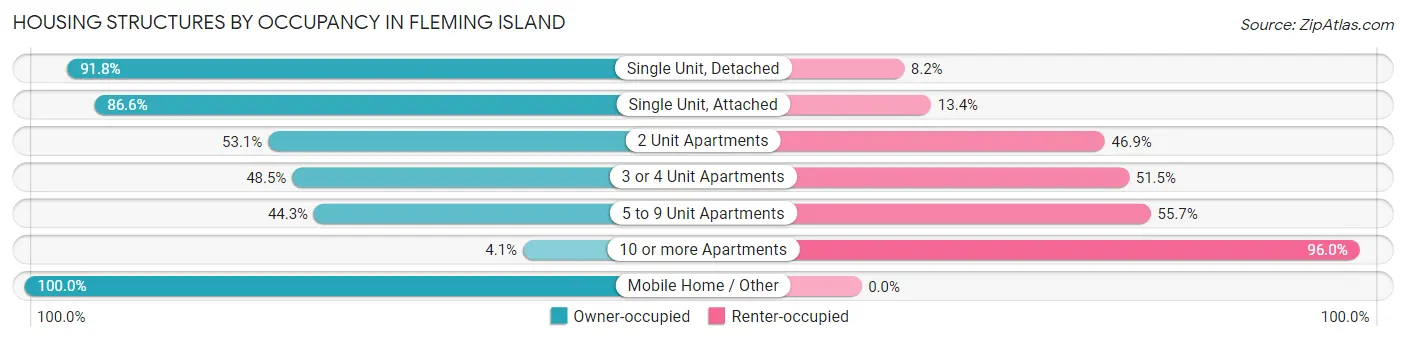
| Structure Type | Owner-occupied | Renter-occupied |
| Single Unit, Detached | 8,457 (91.8%) | 756 (8.2%) |
| Single Unit, Attached | 741 (86.6%) | 115 (13.4%) |
| 2 Unit Apartments | 17 (53.1%) | 15 (46.9%) |
| 3 or 4 Unit Apartments | 16 (48.5%) | 17 (51.5%) |
| 5 to 9 Unit Apartments | 256 (44.3%) | 322 (55.7%) |
| 10 or more Apartments | 19 (4.1%) | 450 (96.0%) |
| Mobile Home / Other | 110 (100.0%) | 0 (0.0%) |
| Total | 9,616 (85.2%) | 1,675 (14.8%) |
Housing Structures by Number of Rooms in Fleming Island
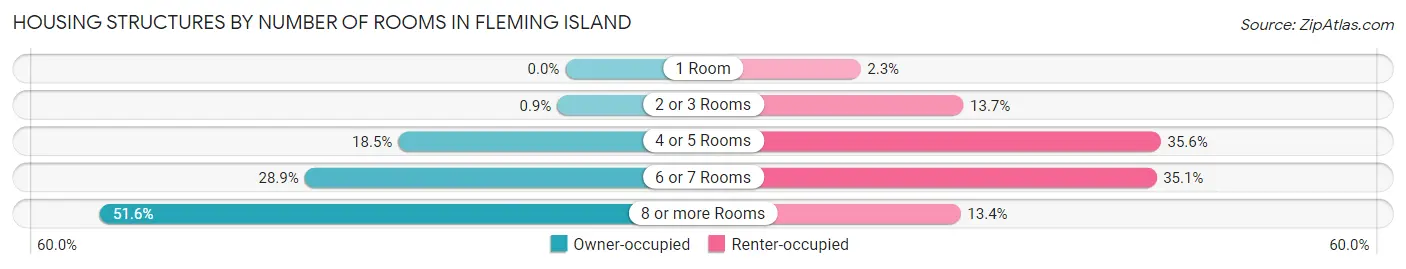
| Number of Rooms | Owner-occupied | Renter-occupied |
| 1 Room | 0 (0.0%) | 38 (2.3%) |
| 2 or 3 Rooms | 87 (0.9%) | 229 (13.7%) |
| 4 or 5 Rooms | 1,783 (18.5%) | 596 (35.6%) |
| 6 or 7 Rooms | 2,782 (28.9%) | 588 (35.1%) |
| 8 or more Rooms | 4,964 (51.6%) | 224 (13.4%) |
| Total | 9,616 (100.0%) | 1,675 (100.0%) |
Housing Structure by Heating Type in Fleming Island
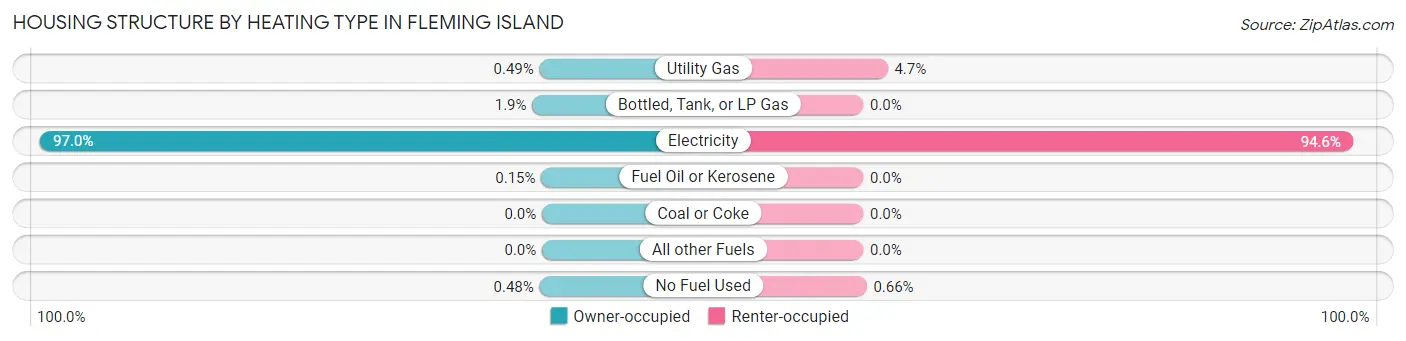
| Heating Type | Owner-occupied | Renter-occupied |
| Utility Gas | 47 (0.5%) | 79 (4.7%) |
| Bottled, Tank, or LP Gas | 181 (1.9%) | 0 (0.0%) |
| Electricity | 9,328 (97.0%) | 1,585 (94.6%) |
| Fuel Oil or Kerosene | 14 (0.2%) | 0 (0.0%) |
| Coal or Coke | 0 (0.0%) | 0 (0.0%) |
| All other Fuels | 0 (0.0%) | 0 (0.0%) |
| No Fuel Used | 46 (0.5%) | 11 (0.7%) |
| Total | 9,616 (100.0%) | 1,675 (100.0%) |
Household Vehicle Usage in Fleming Island
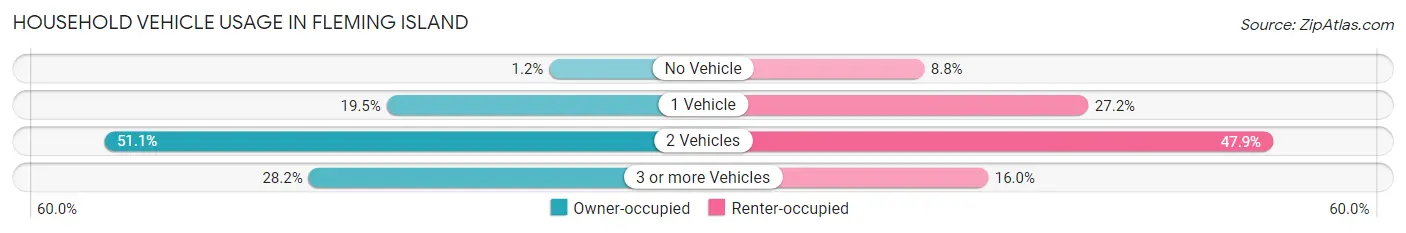
| Vehicles per Household | Owner-occupied | Renter-occupied |
| No Vehicle | 119 (1.2%) | 148 (8.8%) |
| 1 Vehicle | 1,870 (19.5%) | 456 (27.2%) |
| 2 Vehicles | 4,915 (51.1%) | 803 (47.9%) |
| 3 or more Vehicles | 2,712 (28.2%) | 268 (16.0%) |
| Total | 9,616 (100.0%) | 1,675 (100.0%) |
Real Estate & Mortgages in Fleming Island
Real Estate and Mortgage Overview in Fleming Island
| Characteristic | Without Mortgage | With Mortgage |
| Housing Units | 3,386 | 6,230 |
| Median Property Value | $333,200 | $364,000 |
| Median Household Income | $100,755 | $2,954 |
| Monthly Housing Costs | $652 | $1,021 |
| Real Estate Taxes | $3,120 | $85 |
Property Value by Mortgage Status in Fleming Island
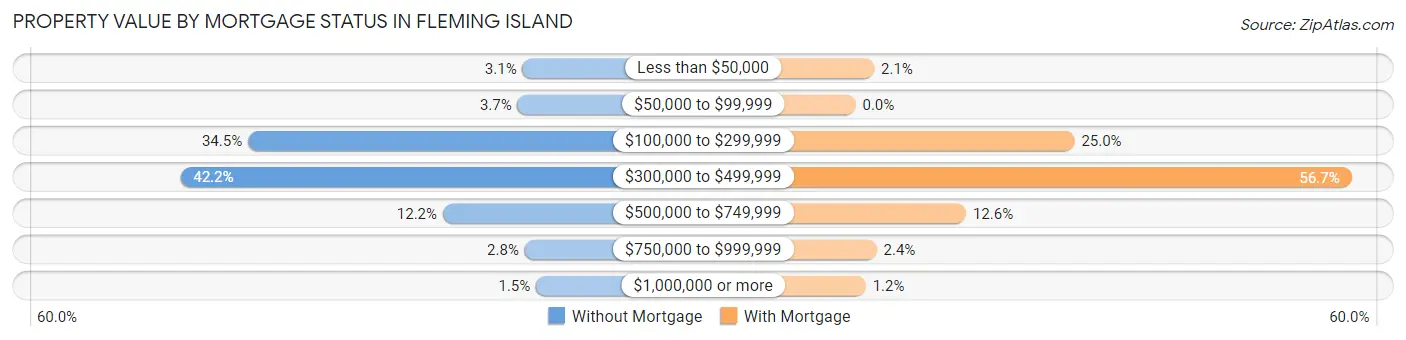
| Property Value | Without Mortgage | With Mortgage |
| Less than $50,000 | 105 (3.1%) | 132 (2.1%) |
| $50,000 to $99,999 | 124 (3.7%) | 0 (0.0%) |
| $100,000 to $299,999 | 1,167 (34.5%) | 1,559 (25.0%) |
| $300,000 to $499,999 | 1,429 (42.2%) | 3,531 (56.7%) |
| $500,000 to $749,999 | 413 (12.2%) | 786 (12.6%) |
| $750,000 to $999,999 | 96 (2.8%) | 150 (2.4%) |
| $1,000,000 or more | 52 (1.5%) | 72 (1.2%) |
| Total | 3,386 (100.0%) | 6,230 (100.0%) |
Household Income by Mortgage Status in Fleming Island
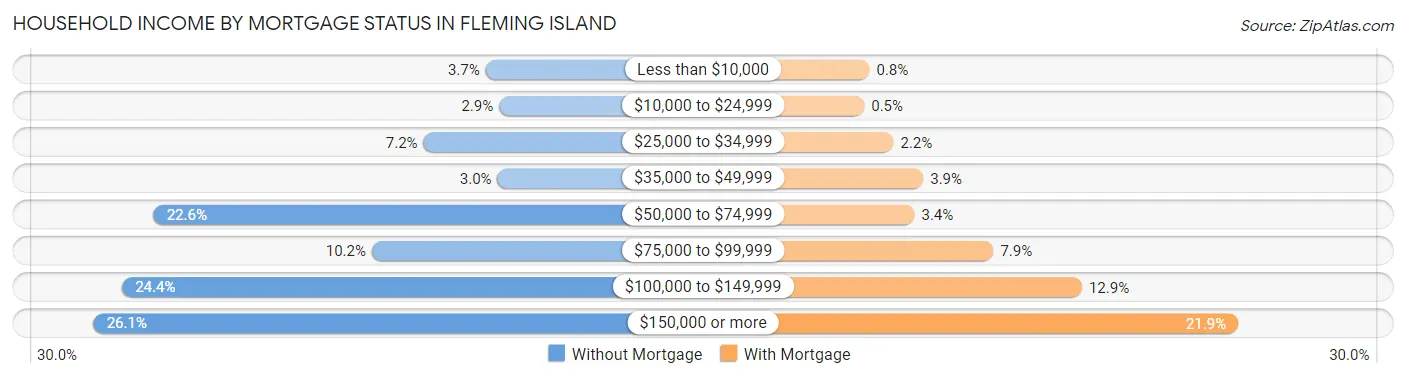
| Household Income | Without Mortgage | With Mortgage |
| Less than $10,000 | 124 (3.7%) | 50 (0.8%) |
| $10,000 to $24,999 | 98 (2.9%) | 31 (0.5%) |
| $25,000 to $34,999 | 244 (7.2%) | 135 (2.2%) |
| $35,000 to $49,999 | 101 (3.0%) | 241 (3.9%) |
| $50,000 to $74,999 | 766 (22.6%) | 210 (3.4%) |
| $75,000 to $99,999 | 344 (10.2%) | 491 (7.9%) |
| $100,000 to $149,999 | 827 (24.4%) | 806 (12.9%) |
| $150,000 or more | 882 (26.1%) | 1,362 (21.9%) |
| Total | 3,386 (100.0%) | 6,230 (100.0%) |
Property Value to Household Income Ratio in Fleming Island
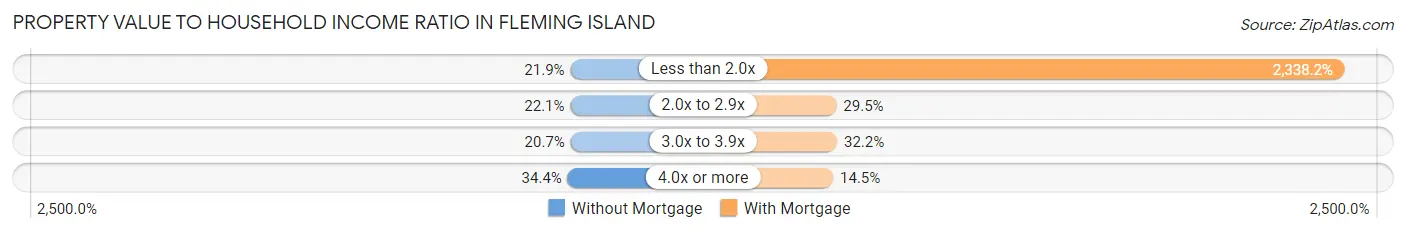
| Value-to-Income Ratio | Without Mortgage | With Mortgage |
| Less than 2.0x | 743 (21.9%) | 145,667 (2,338.1%) |
| 2.0x to 2.9x | 749 (22.1%) | 1,836 (29.5%) |
| 3.0x to 3.9x | 700 (20.7%) | 2,006 (32.2%) |
| 4.0x or more | 1,164 (34.4%) | 901 (14.5%) |
| Total | 3,386 (100.0%) | 6,230 (100.0%) |
Real Estate Taxes by Mortgage Status in Fleming Island
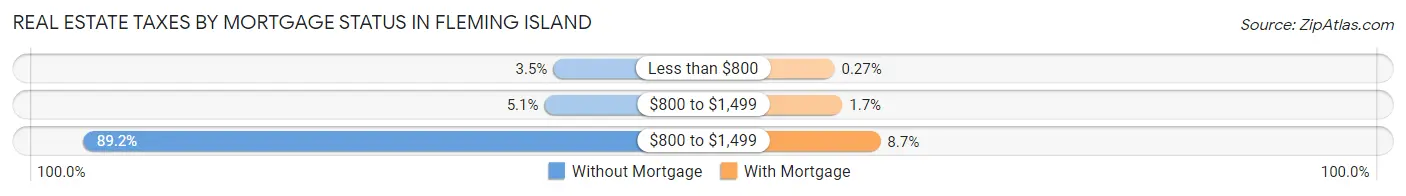
| Property Taxes | Without Mortgage | With Mortgage |
| Less than $800 | 117 (3.5%) | 17 (0.3%) |
| $800 to $1,499 | 172 (5.1%) | 106 (1.7%) |
| $800 to $1,499 | 3,019 (89.2%) | 539 (8.6%) |
| Total | 3,386 (100.0%) | 6,230 (100.0%) |
Health & Disability in Fleming Island
Health Insurance Coverage by Age in Fleming Island
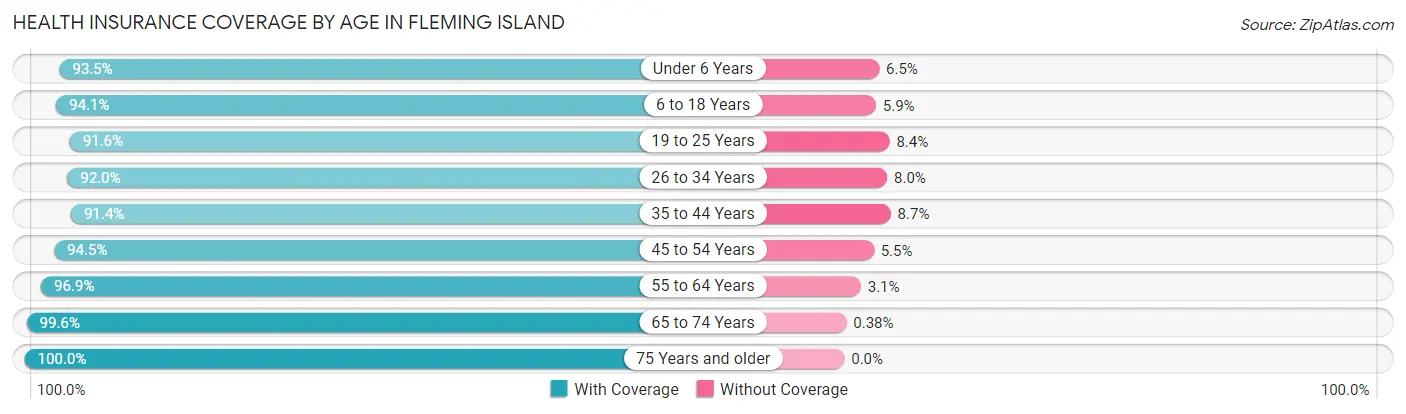
| Age Bracket | With Coverage | Without Coverage |
| Under 6 Years | 1,283 (93.5%) | 89 (6.5%) |
| 6 to 18 Years | 4,383 (94.1%) | 274 (5.9%) |
| 19 to 25 Years | 2,291 (91.6%) | 211 (8.4%) |
| 26 to 34 Years | 1,995 (92.0%) | 173 (8.0%) |
| 35 to 44 Years | 2,798 (91.3%) | 265 (8.6%) |
| 45 to 54 Years | 4,216 (94.5%) | 245 (5.5%) |
| 55 to 64 Years | 4,559 (96.9%) | 145 (3.1%) |
| 65 to 74 Years | 3,657 (99.6%) | 14 (0.4%) |
| 75 Years and older | 2,573 (100.0%) | 0 (0.0%) |
| Total | 27,755 (95.2%) | 1,416 (4.9%) |
Health Insurance Coverage by Citizenship Status in Fleming Island
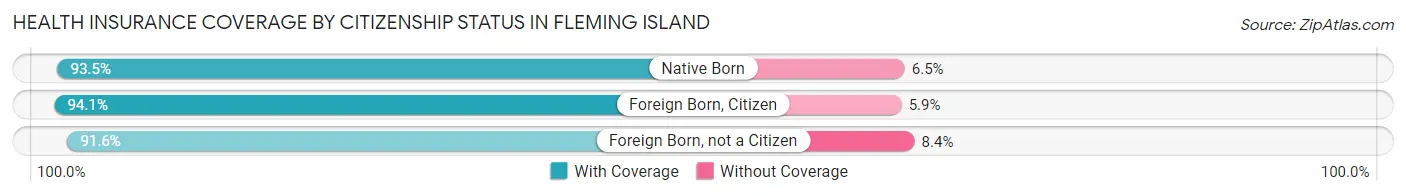
| Citizenship Status | With Coverage | Without Coverage |
| Native Born | 1,283 (93.5%) | 89 (6.5%) |
| Foreign Born, Citizen | 4,383 (94.1%) | 274 (5.9%) |
| Foreign Born, not a Citizen | 2,291 (91.6%) | 211 (8.4%) |
Health Insurance Coverage by Household Income in Fleming Island
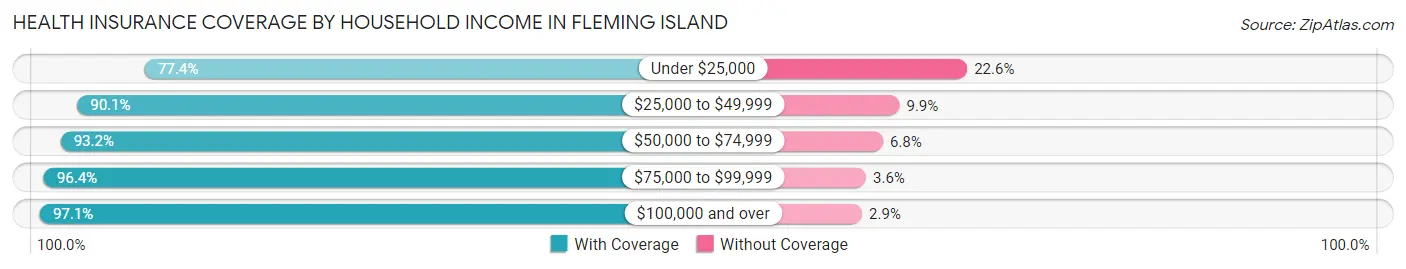
| Household Income | With Coverage | Without Coverage |
| Under $25,000 | 1,102 (77.4%) | 321 (22.6%) |
| $25,000 to $49,999 | 1,843 (90.1%) | 202 (9.9%) |
| $50,000 to $74,999 | 3,112 (93.2%) | 226 (6.8%) |
| $75,000 to $99,999 | 3,114 (96.4%) | 117 (3.6%) |
| $100,000 and over | 18,573 (97.1%) | 550 (2.9%) |
Public vs Private Health Insurance Coverage by Age in Fleming Island
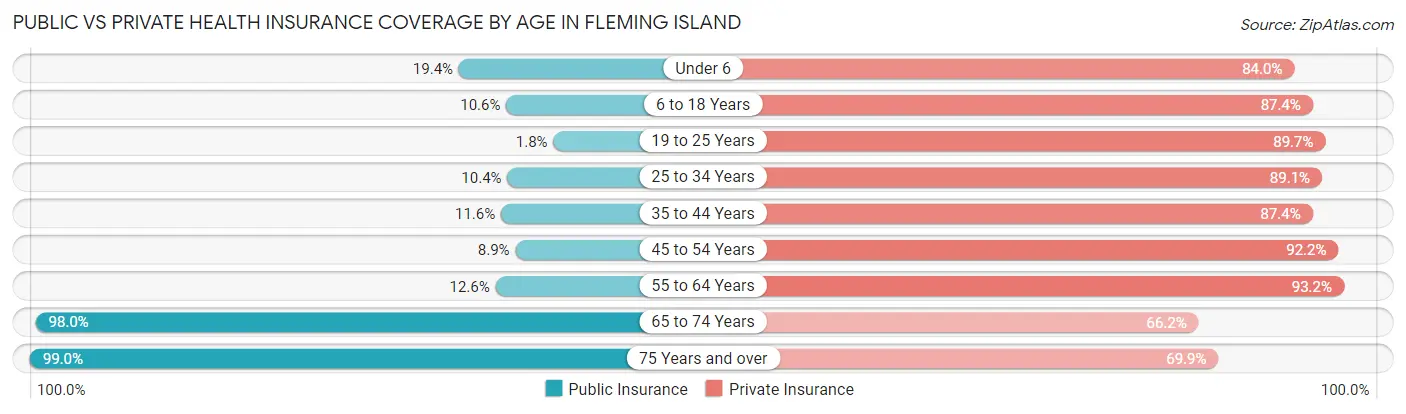
| Age Bracket | Public Insurance | Private Insurance |
| Under 6 | 266 (19.4%) | 1,152 (84.0%) |
| 6 to 18 Years | 493 (10.6%) | 4,070 (87.4%) |
| 19 to 25 Years | 46 (1.8%) | 2,245 (89.7%) |
| 25 to 34 Years | 225 (10.4%) | 1,932 (89.1%) |
| 35 to 44 Years | 354 (11.6%) | 2,676 (87.4%) |
| 45 to 54 Years | 397 (8.9%) | 4,111 (92.1%) |
| 55 to 64 Years | 592 (12.6%) | 4,383 (93.2%) |
| 65 to 74 Years | 3,597 (98.0%) | 2,431 (66.2%) |
| 75 Years and over | 2,548 (99.0%) | 1,798 (69.9%) |
| Total | 8,518 (29.2%) | 24,798 (85.0%) |
Disability Status by Sex by Age in Fleming Island
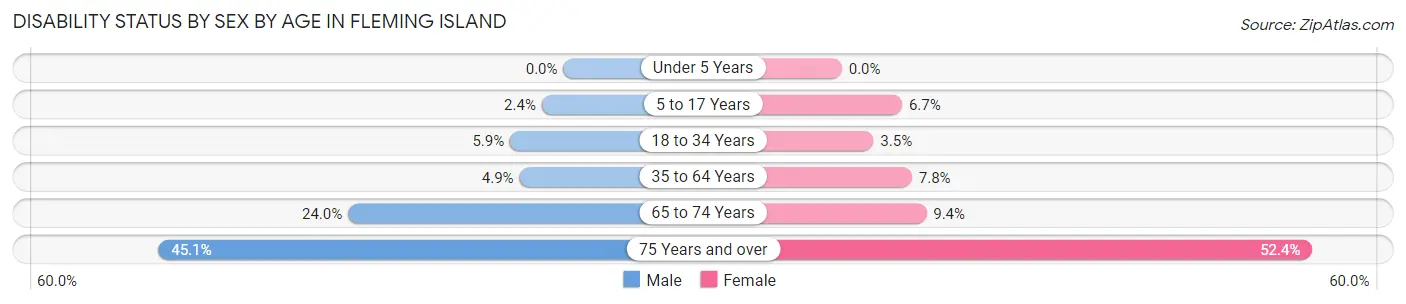
| Age Bracket | Male | Female |
| Under 5 Years | 0 (0.0%) | 0 (0.0%) |
| 5 to 17 Years | 53 (2.4%) | 157 (6.7%) |
| 18 to 34 Years | 153 (5.9%) | 86 (3.5%) |
| 35 to 64 Years | 273 (4.9%) | 518 (7.8%) |
| 65 to 74 Years | 457 (24.0%) | 166 (9.4%) |
| 75 Years and over | 576 (45.1%) | 679 (52.4%) |
Disability Class by Sex by Age in Fleming Island
Disability Class: Hearing Difficulty
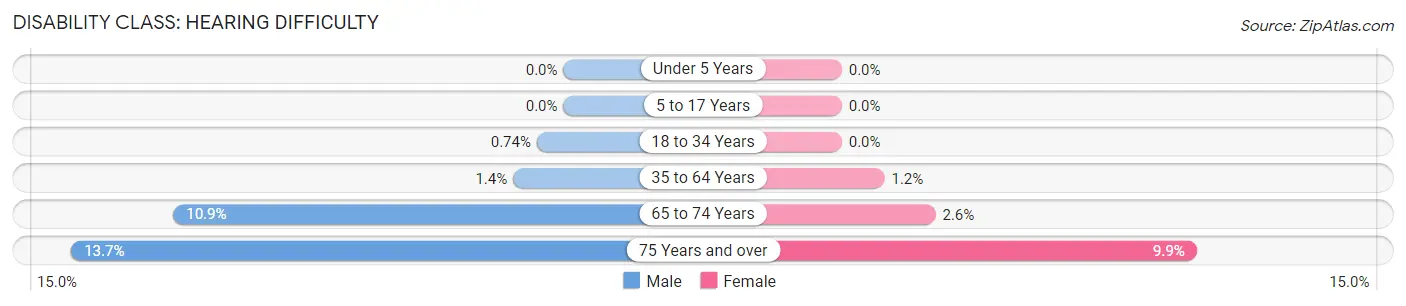
| Age Bracket | Male | Female |
| Under 5 Years | 0 (0.0%) | 0 (0.0%) |
| 5 to 17 Years | 0 (0.0%) | 0 (0.0%) |
| 18 to 34 Years | 19 (0.7%) | 0 (0.0%) |
| 35 to 64 Years | 78 (1.4%) | 79 (1.2%) |
| 65 to 74 Years | 207 (10.9%) | 46 (2.6%) |
| 75 Years and over | 175 (13.7%) | 128 (9.9%) |
Disability Class: Vision Difficulty

| Age Bracket | Male | Female |
| Under 5 Years | 0 (0.0%) | 0 (0.0%) |
| 5 to 17 Years | 0 (0.0%) | 13 (0.5%) |
| 18 to 34 Years | 0 (0.0%) | 24 (1.0%) |
| 35 to 64 Years | 159 (2.9%) | 134 (2.0%) |
| 65 to 74 Years | 87 (4.6%) | 10 (0.6%) |
| 75 Years and over | 88 (6.9%) | 40 (3.1%) |
Disability Class: Cognitive Difficulty
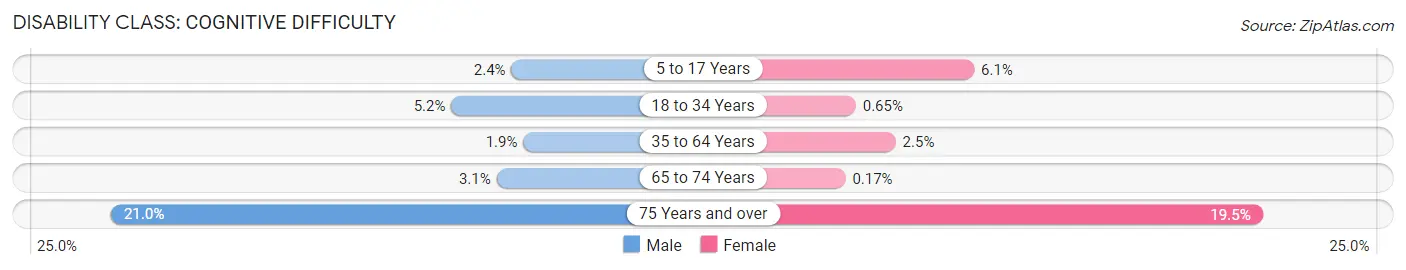
| Age Bracket | Male | Female |
| 5 to 17 Years | 53 (2.4%) | 144 (6.1%) |
| 18 to 34 Years | 134 (5.2%) | 16 (0.6%) |
| 35 to 64 Years | 104 (1.9%) | 166 (2.5%) |
| 65 to 74 Years | 59 (3.1%) | 3 (0.2%) |
| 75 Years and over | 268 (21.0%) | 253 (19.5%) |
Disability Class: Ambulatory Difficulty
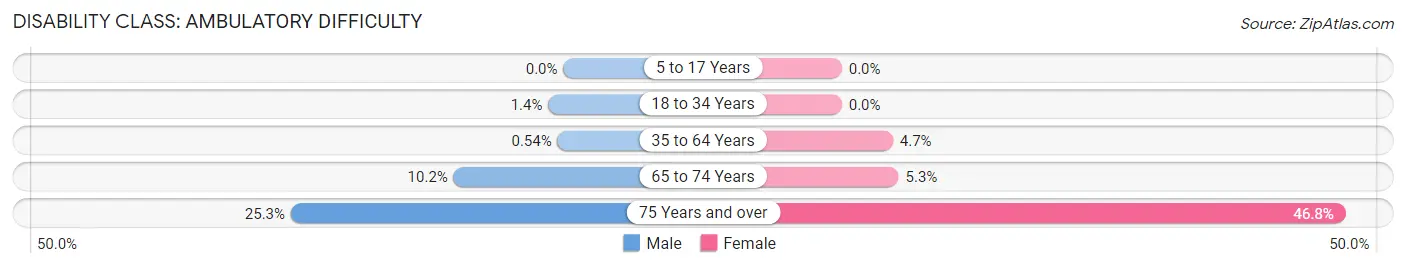
| Age Bracket | Male | Female |
| 5 to 17 Years | 0 (0.0%) | 0 (0.0%) |
| 18 to 34 Years | 36 (1.4%) | 0 (0.0%) |
| 35 to 64 Years | 30 (0.5%) | 315 (4.7%) |
| 65 to 74 Years | 194 (10.2%) | 93 (5.3%) |
| 75 Years and over | 323 (25.3%) | 606 (46.8%) |
Disability Class: Self-Care Difficulty
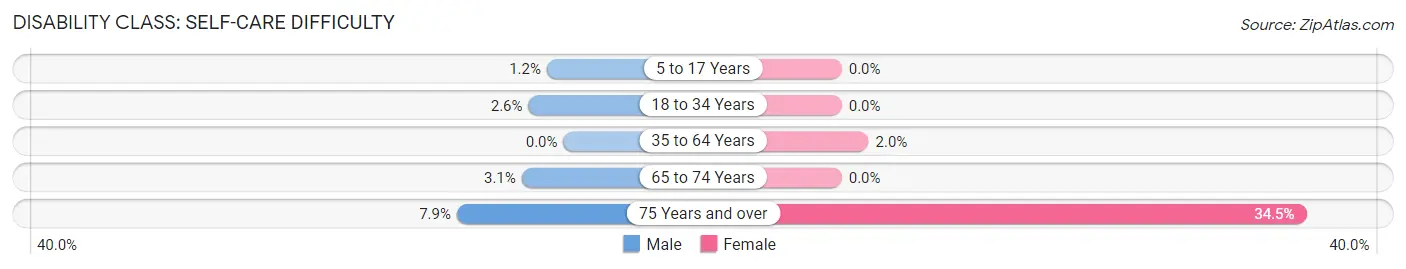
| Age Bracket | Male | Female |
| 5 to 17 Years | 27 (1.2%) | 0 (0.0%) |
| 18 to 34 Years | 67 (2.6%) | 0 (0.0%) |
| 35 to 64 Years | 0 (0.0%) | 132 (2.0%) |
| 65 to 74 Years | 59 (3.1%) | 0 (0.0%) |
| 75 Years and over | 101 (7.9%) | 447 (34.5%) |
Technology Access in Fleming Island
Computing Device Access in Fleming Island
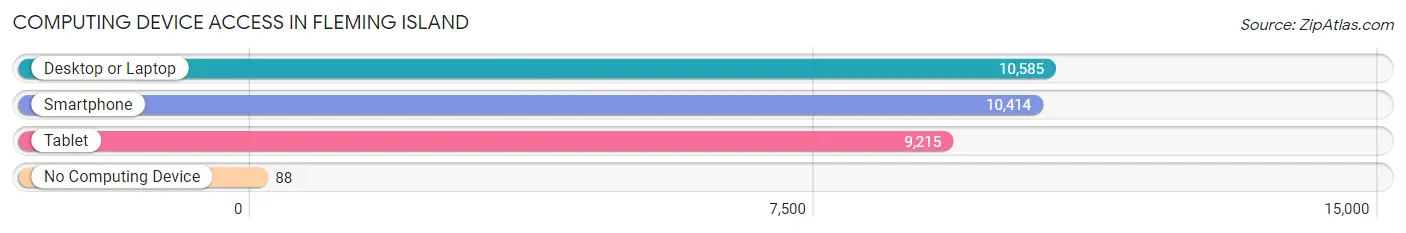
| Device Type | # Households | % Households |
| Desktop or Laptop | 10,585 | 93.8% |
| Smartphone | 10,414 | 92.2% |
| Tablet | 9,215 | 81.6% |
| No Computing Device | 88 | 0.8% |
| Total | 11,291 | 100.0% |
Internet Access in Fleming Island
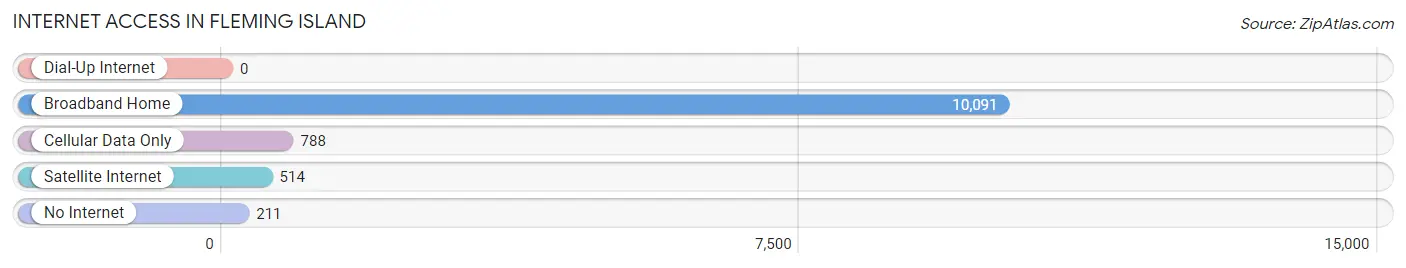
| Internet Type | # Households | % Households |
| Dial-Up Internet | 0 | 0.0% |
| Broadband Home | 10,091 | 89.4% |
| Cellular Data Only | 788 | 7.0% |
| Satellite Internet | 514 | 4.5% |
| No Internet | 211 | 1.9% |
| Total | 11,291 | 100.0% |
Fleming Island Summary
Fleming Island is an unincorporated community located in Clay County, Florida, United States. It is situated on the western side of the St. Johns River, just south of Jacksonville. The community is part of the Jacksonville metropolitan area and is located approximately 20 miles south of downtown Jacksonville.
History
The area that is now Fleming Island was originally inhabited by the Timucua Indians. The first European settlers arrived in the area in the late 1700s and early 1800s. The area was named after a prominent local family, the Flemings, who owned a large plantation in the area. The plantation was destroyed during the Civil War, but the family remained in the area and continued to be influential in the local community.
In the late 1800s, the area began to develop as a farming community. The area was known for its citrus groves and vegetable farms. In the early 1900s, the area began to develop as a residential community. The first subdivision was developed in the area in the 1920s.
Geography
Fleming Island is located in Clay County, Florida, on the western side of the St. Johns River. It is approximately 20 miles south of downtown Jacksonville. The community is bordered by the St. Johns River to the east, Doctors Lake to the south, and Black Creek to the west. The area is mostly flat and is covered with pine and oak forests.
Economy
The economy of Fleming Island is largely based on the service industry. The area is home to a variety of retail stores, restaurants, and other businesses. The area is also home to several large employers, including the Clay County School District, Orange Park Medical Center, and the Clay County Sheriff’s Office.
Demographics
As of the 2010 census, the population of Fleming Island was 27,126. The racial makeup of the community was 87.3% White, 8.2% African American, 0.7% Native American, 1.3% Asian, 0.1% Pacific Islander, and 2.4% from other races. The median household income was $68,945, and the median family income was $76,945.
Conclusion
Fleming Island is an unincorporated community located in Clay County, Florida, United States. It is situated on the western side of the St. Johns River, just south of Jacksonville. The area was originally inhabited by the Timucua Indians and was later developed as a farming community. The economy of Fleming Island is largely based on the service industry, and the population of the community was 27,126 as of the 2010 census.
Common Questions
What is the Total Population of Fleming Island?
Total Population of Fleming Island is 29,810.
What is the Total Male Population of Fleming Island?
Total Male Population of Fleming Island is 14,623.
What is the Total Female Population of Fleming Island?
Total Female Population of Fleming Island is 15,187.
What is the Ratio of Males per 100 Females in Fleming Island?
There are 96.29 Males per 100 Females in Fleming Island.
What is the Ratio of Females per 100 Males in Fleming Island?
There are 103.86 Females per 100 Males in Fleming Island.
What is the Median Population Age in Fleming Island?
Median Population Age in Fleming Island is 47.0 Years.
What is the Average Family Size in Fleming Island
Average Family Size in Fleming Island is 2.9 People.
What is the Average Household Size in Fleming Island
Average Household Size in Fleming Island is 2.6 People.
What is Per Capita Income in Fleming Island?
Per Capita income in Fleming Island is $51,368.
What is the Median Family Income in Fleming Island?
Median Family Income in Fleming Island is $133,957.
What is the Median Household income in Fleming Island?
Median Household Income in Fleming Island is $117,414.
What is Income or Wage Gap in Fleming Island?
Income or Wage Gap in Fleming Island is 40.7%.
Women in Fleming Island earn 59.3 cents for every dollar earned by a man.
What is Family Income Deficit in Fleming Island?
Family Income Deficit in Fleming Island is $15,300.
Families that are below poverty line in Fleming Island earn $15,300 less on average than the poverty threshold level.
What is Inequality or Gini Index in Fleming Island?
Inequality or Gini Index in Fleming Island is 0.38.
How Large is the Labor Force in Fleming Island?
There are 14,746 People in the Labor Forcein in Fleming Island.
What is the Percentage of People in the Labor Force in Fleming Island?
58.8% of People are in the Labor Force in Fleming Island.
What is the Unemployment Rate in Fleming Island?
Unemployment Rate in Fleming Island is 4.3%.