Flagler Beach, FL
Flagler Beach Map
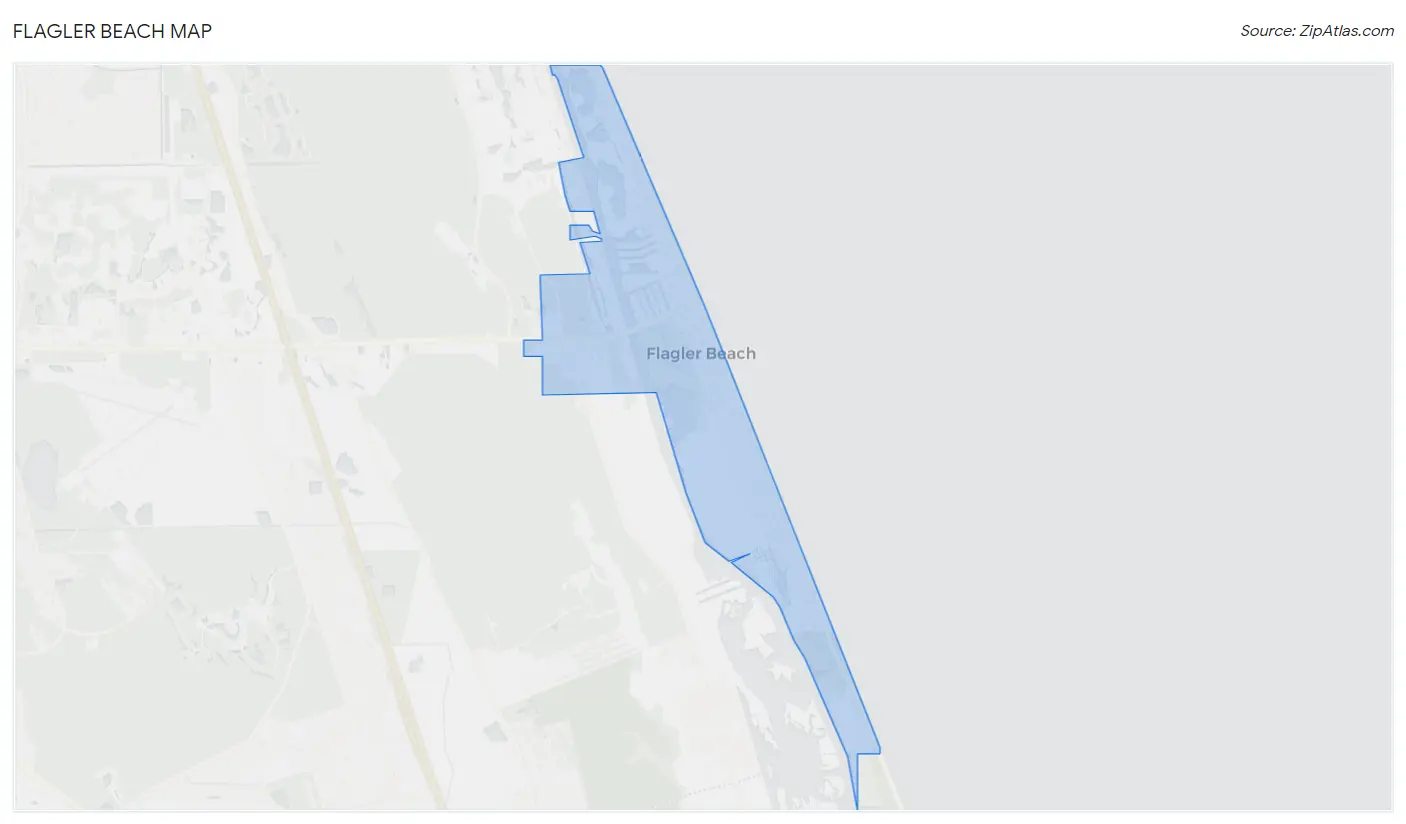
Flagler Beach Overview
5,100
TOTAL POPULATION
2,384
MALE POPULATION
2,716
FEMALE POPULATION
87.78
MALES / 100 FEMALES
113.93
FEMALES / 100 MALES
58.0
MEDIAN AGE
2.5
AVG FAMILY SIZE
2.1
AVG HOUSEHOLD SIZE
$50,733
PER CAPITA INCOME
$86,974
AVG FAMILY INCOME
$64,242
AVG HOUSEHOLD INCOME
29.9%
WAGE / INCOME GAP [ % ]
70.1¢/ $1
WAGE / INCOME GAP [ $ ]
0.50
INEQUALITY / GINI INDEX
1,870
LABOR FORCE [ PEOPLE ]
40.4%
PERCENT IN LABOR FORCE
2.3%
UNEMPLOYMENT RATE
Flagler Beach Zip Codes
Flagler Beach Area Codes
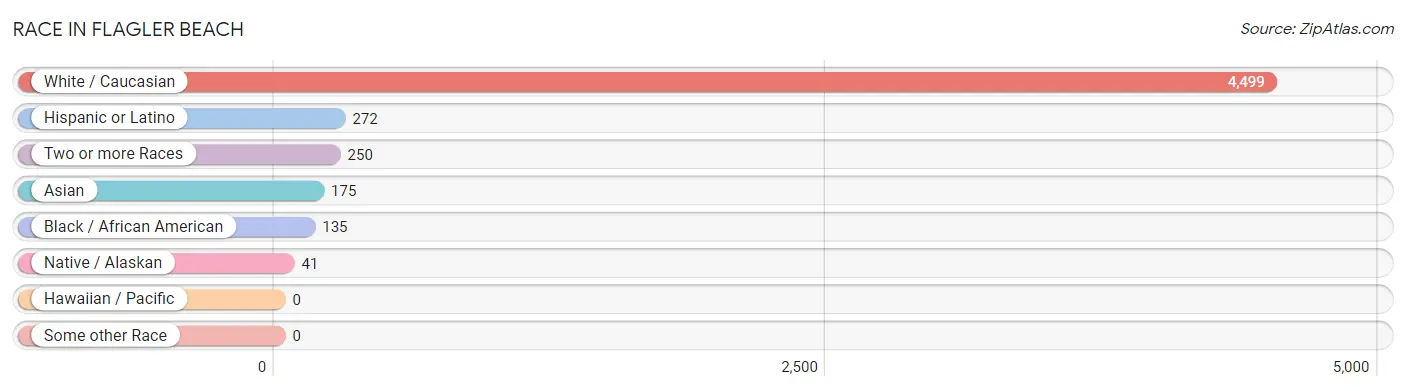
Race in Flagler Beach
The most populous races in Flagler Beach are White / Caucasian (4,499 | 88.2%), Hispanic or Latino (272 | 5.3%), and Two or more Races (250 | 4.9%).
| Race | # Population | % Population |
| Asian | 175 | 3.4% |
| Black / African American | 135 | 2.6% |
| Hawaiian / Pacific | 0 | 0.0% |
| Hispanic or Latino | 272 | 5.3% |
| Native / Alaskan | 41 | 0.8% |
| White / Caucasian | 4,499 | 88.2% |
| Two or more Races | 250 | 4.9% |
| Some other Race | 0 | 0.0% |
| Total | 5,100 | 100.0% |
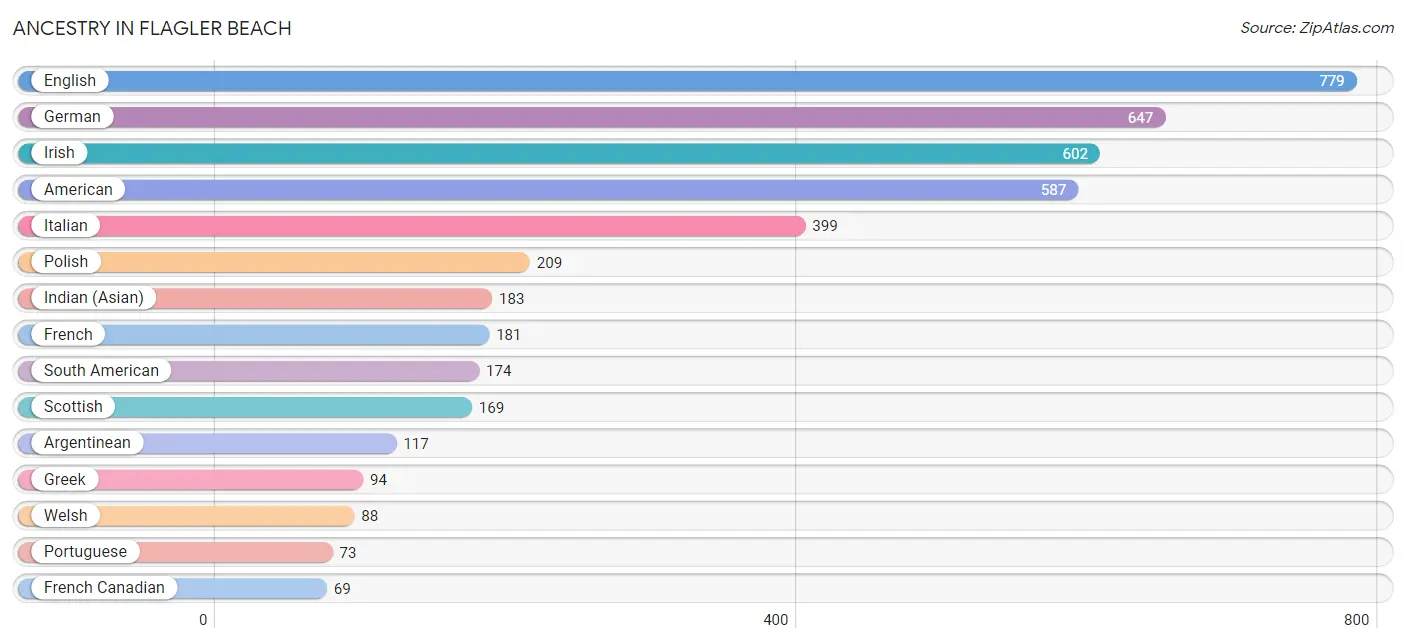
Ancestry in Flagler Beach
The most populous ancestries reported in Flagler Beach are English (779 | 15.3%), German (647 | 12.7%), Irish (602 | 11.8%), American (587 | 11.5%), and Italian (399 | 7.8%), together accounting for 59.1% of all Flagler Beach residents.
| Ancestry | # Population | % Population |
| American | 587 | 11.5% |
| Arab | 17 | 0.3% |
| Argentinean | 117 | 2.3% |
| Austrian | 26 | 0.5% |
| British | 53 | 1.0% |
| Canadian | 26 | 0.5% |
| Central American | 20 | 0.4% |
| Cherokee | 17 | 0.3% |
| Colombian | 45 | 0.9% |
| Cuban | 42 | 0.8% |
| Czech | 17 | 0.3% |
| Danish | 14 | 0.3% |
| Dutch | 27 | 0.5% |
| Eastern European | 24 | 0.5% |
| English | 779 | 15.3% |
| European | 61 | 1.2% |
| Finnish | 16 | 0.3% |
| French | 181 | 3.5% |
| French Canadian | 69 | 1.3% |
| German | 647 | 12.7% |
| Greek | 94 | 1.8% |
| Honduran | 20 | 0.4% |
| Hungarian | 55 | 1.1% |
| Indian (Asian) | 183 | 3.6% |
| Irish | 602 | 11.8% |
| Italian | 399 | 7.8% |
| Korean | 22 | 0.4% |
| Laotian | 8 | 0.2% |
| Latvian | 18 | 0.4% |
| Lithuanian | 7 | 0.1% |
| Luxembourger | 9 | 0.2% |
| Mexican | 21 | 0.4% |
| Northern European | 18 | 0.4% |
| Norwegian | 36 | 0.7% |
| Polish | 209 | 4.1% |
| Portuguese | 73 | 1.4% |
| Puerto Rican | 15 | 0.3% |
| Romanian | 3 | 0.1% |
| Russian | 14 | 0.3% |
| Scandinavian | 8 | 0.2% |
| Scotch-Irish | 52 | 1.0% |
| Scottish | 169 | 3.3% |
| Slovak | 15 | 0.3% |
| South American | 174 | 3.4% |
| Swedish | 44 | 0.9% |
| Ukrainian | 7 | 0.1% |
| Venezuelan | 12 | 0.2% |
| Welsh | 88 | 1.7% |
| Yugoslavian | 8 | 0.2% | View All 49 Rows |
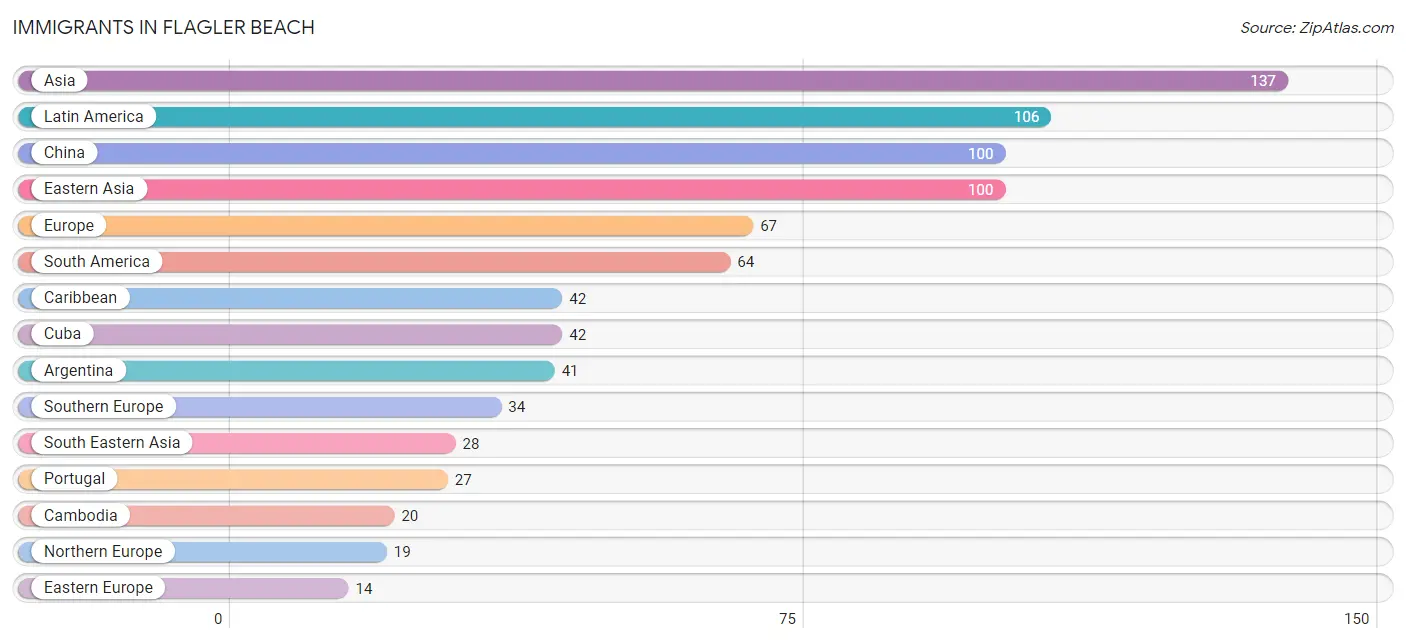
Immigrants in Flagler Beach
The most numerous immigrant groups reported in Flagler Beach came from Asia (137 | 2.7%), Latin America (106 | 2.1%), China (100 | 2.0%), Eastern Asia (100 | 2.0%), and Europe (67 | 1.3%), together accounting for 10.0% of all Flagler Beach residents.
| Immigration Origin | # Population | % Population |
| Argentina | 41 | 0.8% |
| Asia | 137 | 2.7% |
| Cambodia | 20 | 0.4% |
| Caribbean | 42 | 0.8% |
| China | 100 | 2.0% |
| Colombia | 11 | 0.2% |
| Cuba | 42 | 0.8% |
| Eastern Asia | 100 | 2.0% |
| Eastern Europe | 14 | 0.3% |
| England | 10 | 0.2% |
| Europe | 67 | 1.3% |
| Indonesia | 8 | 0.2% |
| Italy | 7 | 0.1% |
| Latin America | 106 | 2.1% |
| Northern Europe | 19 | 0.4% |
| Portugal | 27 | 0.5% |
| Russia | 7 | 0.1% |
| South America | 64 | 1.3% |
| South Central Asia | 9 | 0.2% |
| South Eastern Asia | 28 | 0.5% |
| Southern Europe | 34 | 0.7% |
| Ukraine | 7 | 0.1% |
| Uzbekistan | 9 | 0.2% |
| Venezuela | 12 | 0.2% | View All 24 Rows |
Sex and Age in Flagler Beach
Sex and Age in Flagler Beach
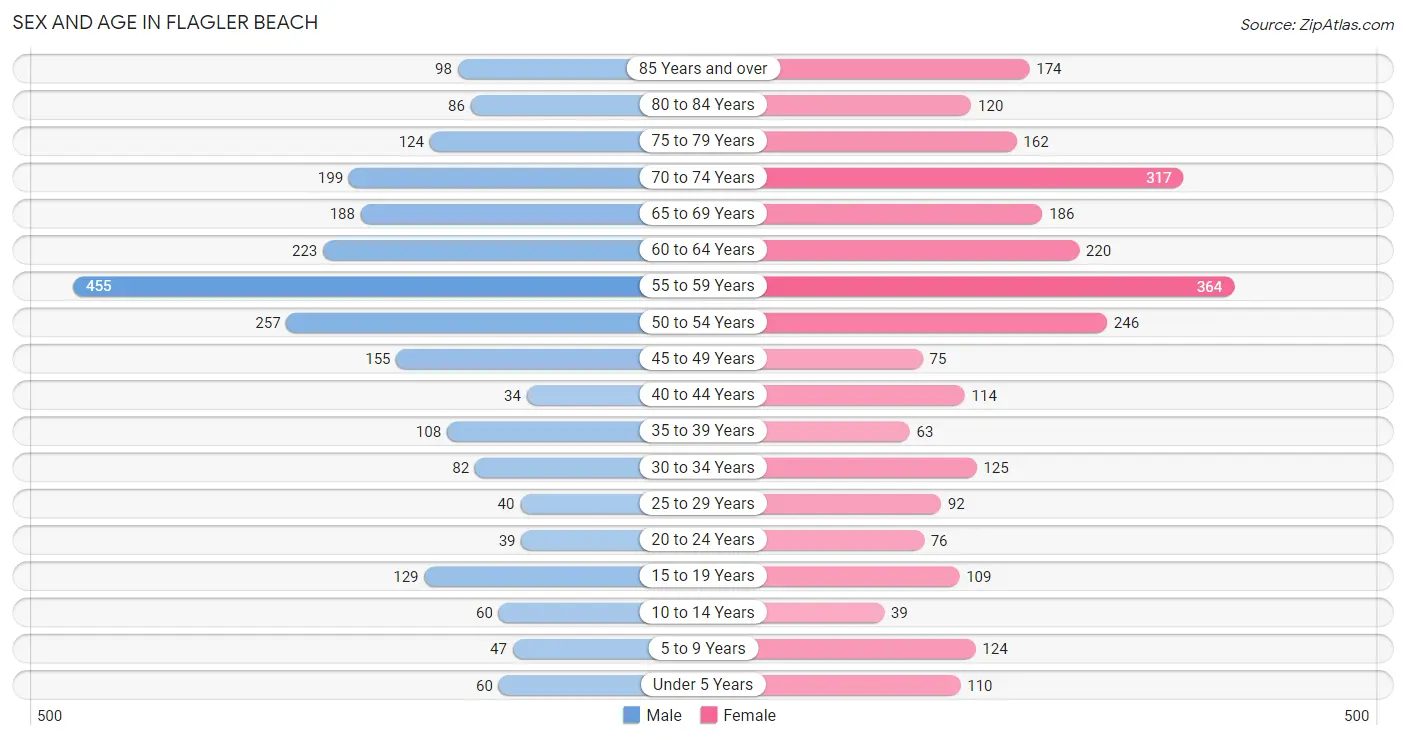
The most populous age groups in Flagler Beach are 55 to 59 Years (455 | 19.1%) for men and 55 to 59 Years (364 | 13.4%) for women.
| Age Bracket | Male | Female |
| Under 5 Years | 60 (2.5%) | 110 (4.1%) |
| 5 to 9 Years | 47 (2.0%) | 124 (4.6%) |
| 10 to 14 Years | 60 (2.5%) | 39 (1.4%) |
| 15 to 19 Years | 129 (5.4%) | 109 (4.0%) |
| 20 to 24 Years | 39 (1.6%) | 76 (2.8%) |
| 25 to 29 Years | 40 (1.7%) | 92 (3.4%) |
| 30 to 34 Years | 82 (3.4%) | 125 (4.6%) |
| 35 to 39 Years | 108 (4.5%) | 63 (2.3%) |
| 40 to 44 Years | 34 (1.4%) | 114 (4.2%) |
| 45 to 49 Years | 155 (6.5%) | 75 (2.8%) |
| 50 to 54 Years | 257 (10.8%) | 246 (9.1%) |
| 55 to 59 Years | 455 (19.1%) | 364 (13.4%) |
| 60 to 64 Years | 223 (9.3%) | 220 (8.1%) |
| 65 to 69 Years | 188 (7.9%) | 186 (6.9%) |
| 70 to 74 Years | 199 (8.4%) | 317 (11.7%) |
| 75 to 79 Years | 124 (5.2%) | 162 (6.0%) |
| 80 to 84 Years | 86 (3.6%) | 120 (4.4%) |
| 85 Years and over | 98 (4.1%) | 174 (6.4%) |
| Total | 2,384 (100.0%) | 2,716 (100.0%) |
Families and Households in Flagler Beach
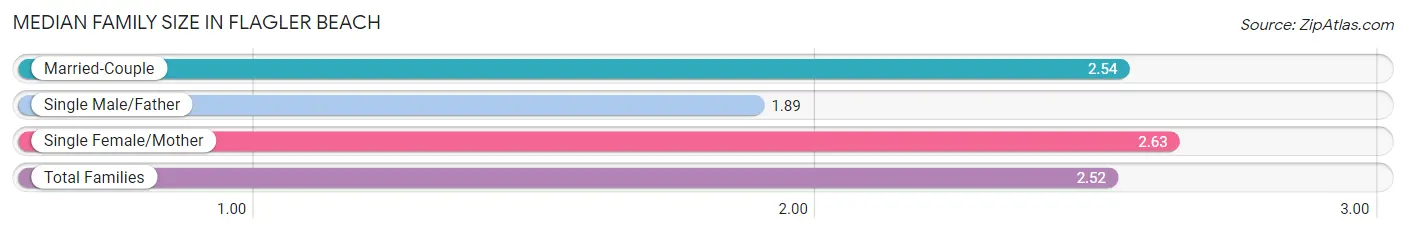
Median Family Size in Flagler Beach
The median family size in Flagler Beach is 2.52 persons per family, with single female/mother families (218 | 13.8%) accounting for the largest median family size of 2.63 persons per family. On the other hand, single male/father families (83 | 5.2%) represent the smallest median family size with 1.89 persons per family.
| Family Type | # Families | Family Size |
| Married-Couple | 1,281 (81.0%) | 2.54 |
| Single Male/Father | 83 (5.2%) | 1.89 |
| Single Female/Mother | 218 (13.8%) | 2.63 |
| Total Families | 1,582 (100.0%) | 2.52 |
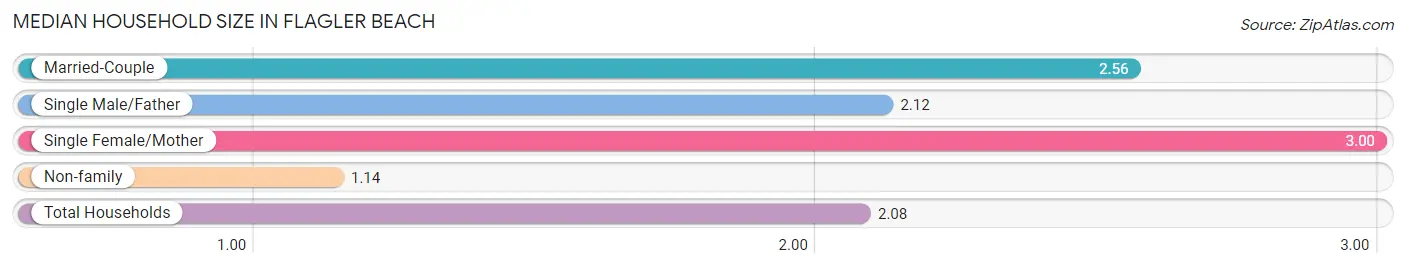
Median Household Size in Flagler Beach
The median household size in Flagler Beach is 2.08 persons per household, with single female/mother households (218 | 8.9%) accounting for the largest median household size of 3 persons per household. non-family households (872 | 35.5%) represent the smallest median household size with 1.14 persons per household.
| Household Type | # Households | Household Size |
| Married-Couple | 1,281 (52.2%) | 2.56 |
| Single Male/Father | 83 (3.4%) | 2.12 |
| Single Female/Mother | 218 (8.9%) | 3.00 |
| Non-family | 872 (35.5%) | 1.14 |
| Total Households | 2,454 (100.0%) | 2.08 |
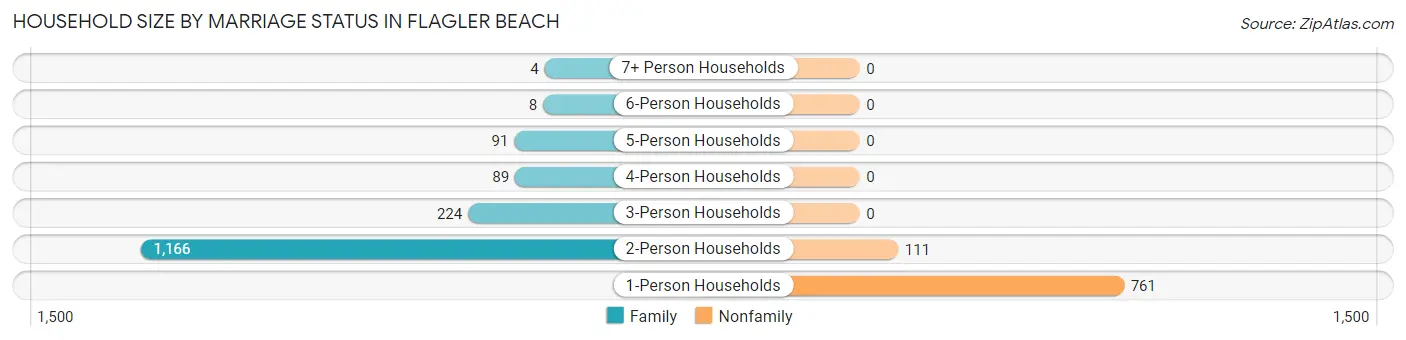
Household Size by Marriage Status in Flagler Beach
Out of a total of 2,454 households in Flagler Beach, 1,582 (64.5%) are family households, while 872 (35.5%) are nonfamily households. The most numerous type of family households are 2-person households, comprising 1,166, and the most common type of nonfamily households are 1-person households, comprising 761.
| Household Size | Family Households | Nonfamily Households |
| 1-Person Households | - | 761 (31.0%) |
| 2-Person Households | 1,166 (47.5%) | 111 (4.5%) |
| 3-Person Households | 224 (9.1%) | 0 (0.0%) |
| 4-Person Households | 89 (3.6%) | 0 (0.0%) |
| 5-Person Households | 91 (3.7%) | 0 (0.0%) |
| 6-Person Households | 8 (0.3%) | 0 (0.0%) |
| 7+ Person Households | 4 (0.2%) | 0 (0.0%) |
| Total | 1,582 (64.5%) | 872 (35.5%) |
Female Fertility in Flagler Beach
Fertility by Age in Flagler Beach
Average fertility rate in Flagler Beach is 37.0 births per 1,000 women. Women in the age bracket of 35 to 50 years have the highest fertility rate with 80.0 births per 1,000 women. Women in the age bracket of 35 to 50 years acount for 100.0% of all women with births.
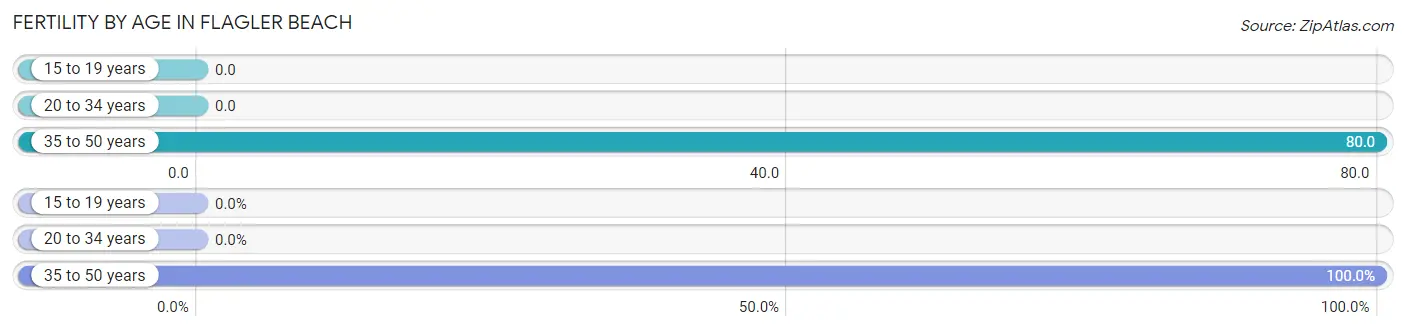
| Age Bracket | Women with Births | Births / 1,000 Women |
| 15 to 19 years | 0 (0.0%) | 0.0 |
| 20 to 34 years | 0 (0.0%) | 0.0 |
| 35 to 50 years | 28 (100.0%) | 80.0 |
| Total | 28 (100.0%) | 37.0 |
Fertility by Age by Marriage Status in Flagler Beach
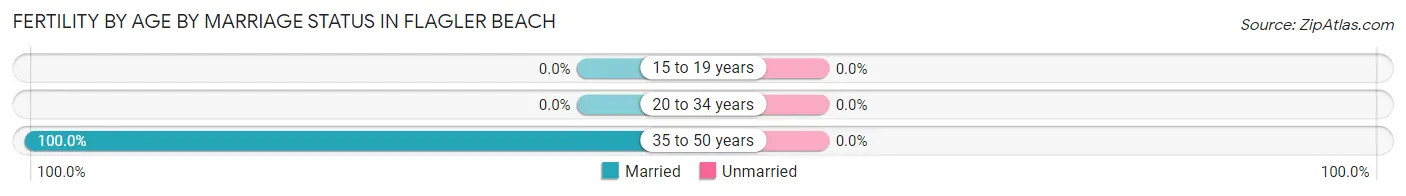
| Age Bracket | Married | Unmarried |
| 15 to 19 years | 0 (0.0%) | 0 (0.0%) |
| 20 to 34 years | 0 (0.0%) | 0 (0.0%) |
| 35 to 50 years | 28 (100.0%) | 0 (0.0%) |
| Total | 28 (100.0%) | 0 (0.0%) |
Fertility by Education in Flagler Beach
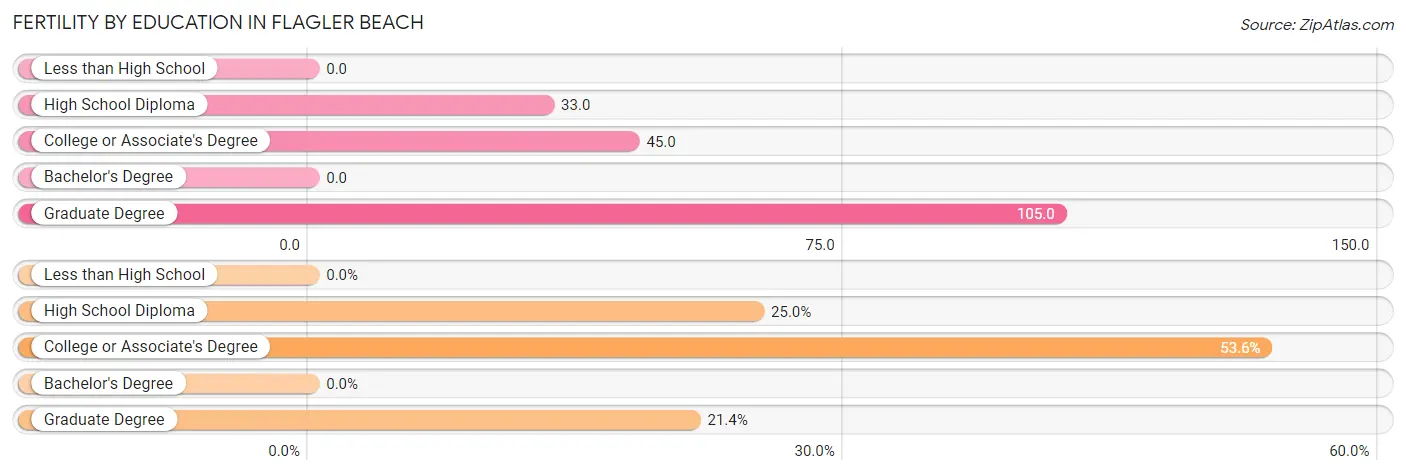
| Educational Attainment | Women with Births | Births / 1,000 Women |
| Less than High School | 0 (0.0%) | 0.0 |
| High School Diploma | 7 (25.0%) | 33.0 |
| College or Associate's Degree | 15 (53.6%) | 45.0 |
| Bachelor's Degree | 0 (0.0%) | 0.0 |
| Graduate Degree | 6 (21.4%) | 105.0 |
| Total | 28 (100.0%) | 37.0 |
Fertility by Education by Marriage Status in Flagler Beach
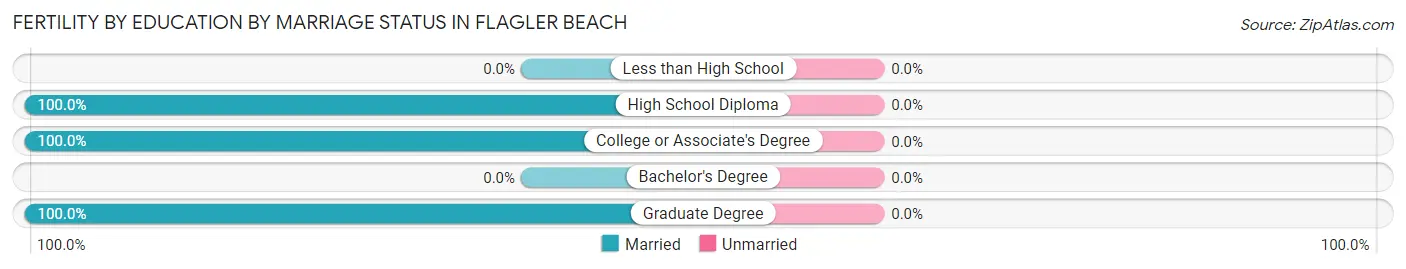
| Educational Attainment | Married | Unmarried |
| Less than High School | 0 (0.0%) | 0 (0.0%) |
| High School Diploma | 7 (100.0%) | 0 (0.0%) |
| College or Associate's Degree | 15 (100.0%) | 0 (0.0%) |
| Bachelor's Degree | 0 (0.0%) | 0 (0.0%) |
| Graduate Degree | 6 (100.0%) | 0 (0.0%) |
| Total | 28 (100.0%) | 0 (0.0%) |
Income in Flagler Beach
Income Overview in Flagler Beach
Per Capita Income in Flagler Beach is $50,733, while median incomes of families and households are $86,974 and $64,242 respectively.
| Characteristic | Number | Measure |
| Per Capita Income | 5,100 | $50,733 |
| Median Family Income | 1,582 | $86,974 |
| Mean Family Income | 1,582 | $116,276 |
| Median Household Income | 2,454 | $64,242 |
| Mean Household Income | 2,454 | $103,082 |
| Income Deficit | 1,582 | $0 |
| Wage / Income Gap (%) | 5,100 | 29.85% |
| Wage / Income Gap ($) | 5,100 | 70.15¢ per $1 |
| Gini / Inequality Index | 5,100 | 0.50 |
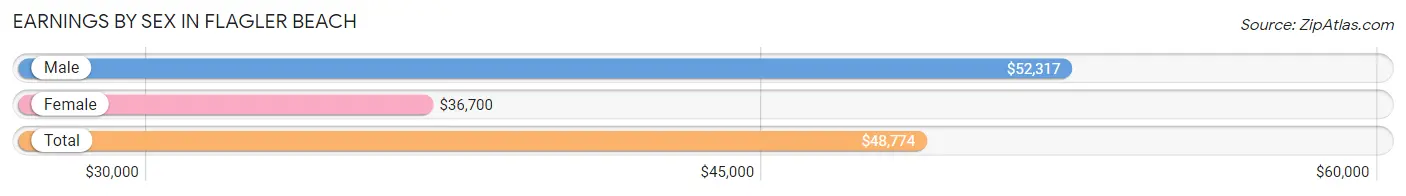
Earnings by Sex in Flagler Beach
Average Earnings in Flagler Beach are $48,774, $52,317 for men and $36,700 for women, a difference of 29.8%.
| Sex | Number | Average Earnings |
| Male | 1,036 (49.4%) | $52,317 |
| Female | 1,060 (50.6%) | $36,700 |
| Total | 2,096 (100.0%) | $48,774 |
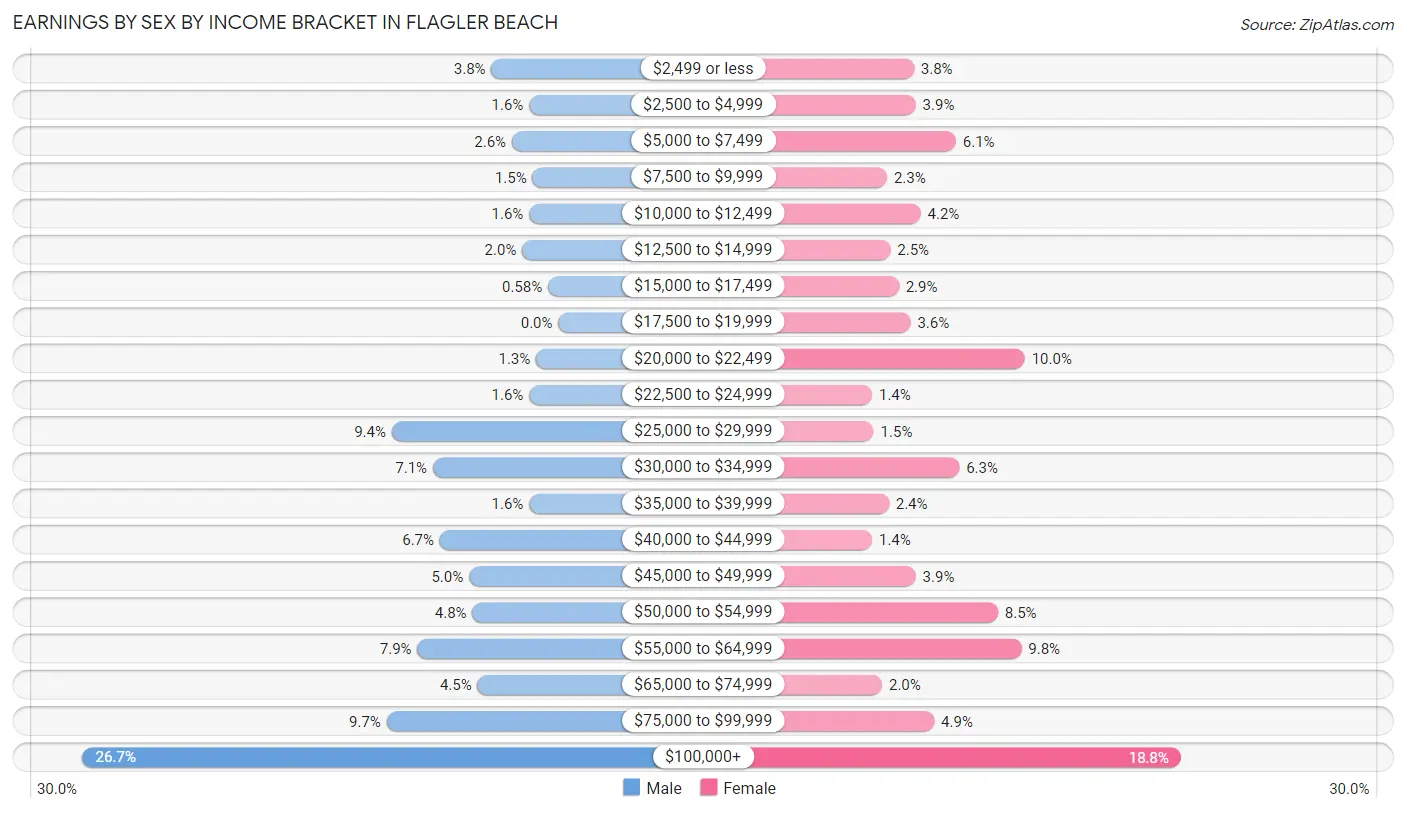
Earnings by Sex by Income Bracket in Flagler Beach
The most common earnings brackets in Flagler Beach are $100,000+ for men (277 | 26.7%) and $100,000+ for women (199 | 18.8%).
| Income | Male | Female |
| $2,499 or less | 39 (3.8%) | 40 (3.8%) |
| $2,500 to $4,999 | 17 (1.6%) | 41 (3.9%) |
| $5,000 to $7,499 | 27 (2.6%) | 65 (6.1%) |
| $7,500 to $9,999 | 15 (1.5%) | 24 (2.3%) |
| $10,000 to $12,499 | 17 (1.6%) | 44 (4.2%) |
| $12,500 to $14,999 | 21 (2.0%) | 26 (2.5%) |
| $15,000 to $17,499 | 6 (0.6%) | 31 (2.9%) |
| $17,500 to $19,999 | 0 (0.0%) | 38 (3.6%) |
| $20,000 to $22,499 | 13 (1.3%) | 106 (10.0%) |
| $22,500 to $24,999 | 17 (1.6%) | 15 (1.4%) |
| $25,000 to $29,999 | 97 (9.4%) | 16 (1.5%) |
| $30,000 to $34,999 | 73 (7.0%) | 67 (6.3%) |
| $35,000 to $39,999 | 17 (1.6%) | 25 (2.4%) |
| $40,000 to $44,999 | 69 (6.7%) | 15 (1.4%) |
| $45,000 to $49,999 | 52 (5.0%) | 41 (3.9%) |
| $50,000 to $54,999 | 50 (4.8%) | 90 (8.5%) |
| $55,000 to $64,999 | 82 (7.9%) | 104 (9.8%) |
| $65,000 to $74,999 | 47 (4.5%) | 21 (2.0%) |
| $75,000 to $99,999 | 100 (9.7%) | 52 (4.9%) |
| $100,000+ | 277 (26.7%) | 199 (18.8%) |
| Total | 1,036 (100.0%) | 1,060 (100.0%) |
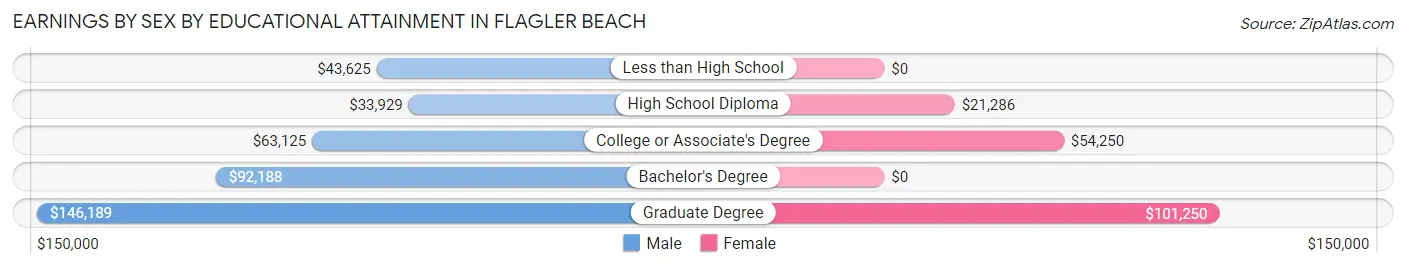
Earnings by Sex by Educational Attainment in Flagler Beach
Average earnings in Flagler Beach are $55,061 for men and $49,963 for women, a difference of 9.3%. Men with an educational attainment of graduate degree enjoy the highest average annual earnings of $146,189, while those with high school diploma education earn the least with $33,929. Women with an educational attainment of graduate degree earn the most with the average annual earnings of $101,250, while those with high school diploma education have the smallest earnings of $21,286.
| Educational Attainment | Male Income | Female Income |
| Less than High School | $43,625 | $0 |
| High School Diploma | $33,929 | $21,286 |
| College or Associate's Degree | $63,125 | $54,250 |
| Bachelor's Degree | $92,188 | $0 |
| Graduate Degree | $146,189 | $101,250 |
| Total | $55,061 | $49,963 |
Family Income in Flagler Beach
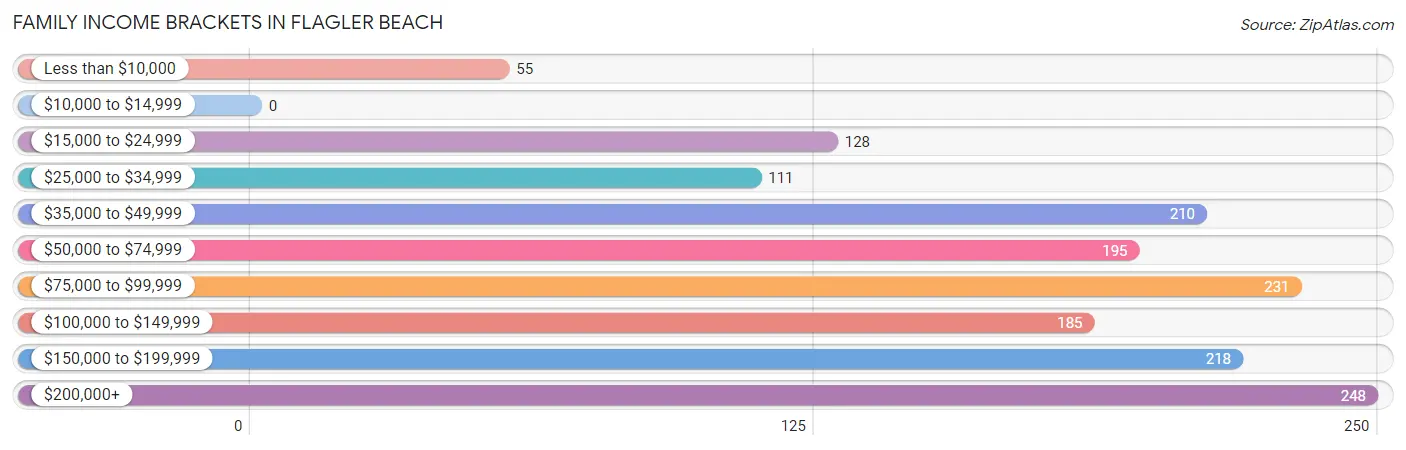
Family Income Brackets in Flagler Beach
According to the Flagler Beach family income data, there are 248 families falling into the $200,000+ income range, which is the most common income bracket and makes up 15.7% of all families.
| Income Bracket | # Families | % Families |
| Less than $10,000 | 55 | 3.5% |
| $10,000 to $14,999 | 0 | 0.0% |
| $15,000 to $24,999 | 128 | 8.1% |
| $25,000 to $34,999 | 111 | 7.0% |
| $35,000 to $49,999 | 210 | 13.3% |
| $50,000 to $74,999 | 195 | 12.3% |
| $75,000 to $99,999 | 231 | 14.6% |
| $100,000 to $149,999 | 185 | 11.7% |
| $150,000 to $199,999 | 218 | 13.8% |
| $200,000+ | 248 | 15.7% |
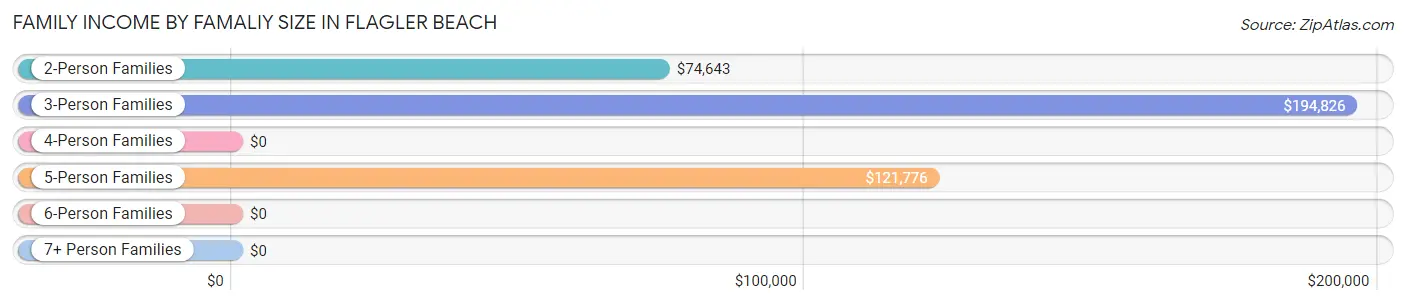
Family Income by Famaliy Size in Flagler Beach
3-person families (163 | 10.3%) account for the highest median family income in Flagler Beach with $194,826 per family, while 3-person families (163 | 10.3%) have the highest median income of $64,942 per family member.
| Income Bracket | # Families | Median Income |
| 2-Person Families | 1,236 (78.1%) | $74,643 |
| 3-Person Families | 163 (10.3%) | $194,826 |
| 4-Person Families | 102 (6.5%) | $0 |
| 5-Person Families | 69 (4.4%) | $121,776 |
| 6-Person Families | 8 (0.5%) | $0 |
| 7+ Person Families | 4 (0.3%) | $0 |
| Total | 1,582 (100.0%) | $86,974 |
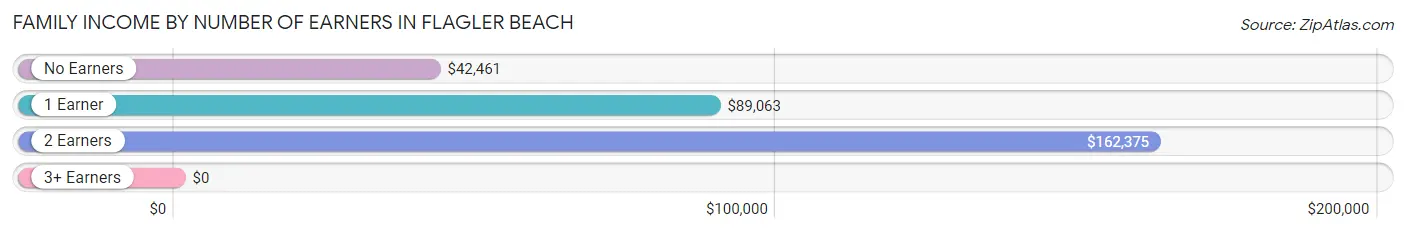
Family Income by Number of Earners in Flagler Beach
| Number of Earners | # Families | Median Income |
| No Earners | 630 (39.8%) | $42,461 |
| 1 Earner | 491 (31.0%) | $89,063 |
| 2 Earners | 395 (25.0%) | $162,375 |
| 3+ Earners | 66 (4.2%) | $0 |
| Total | 1,582 (100.0%) | $86,974 |
Household Income in Flagler Beach
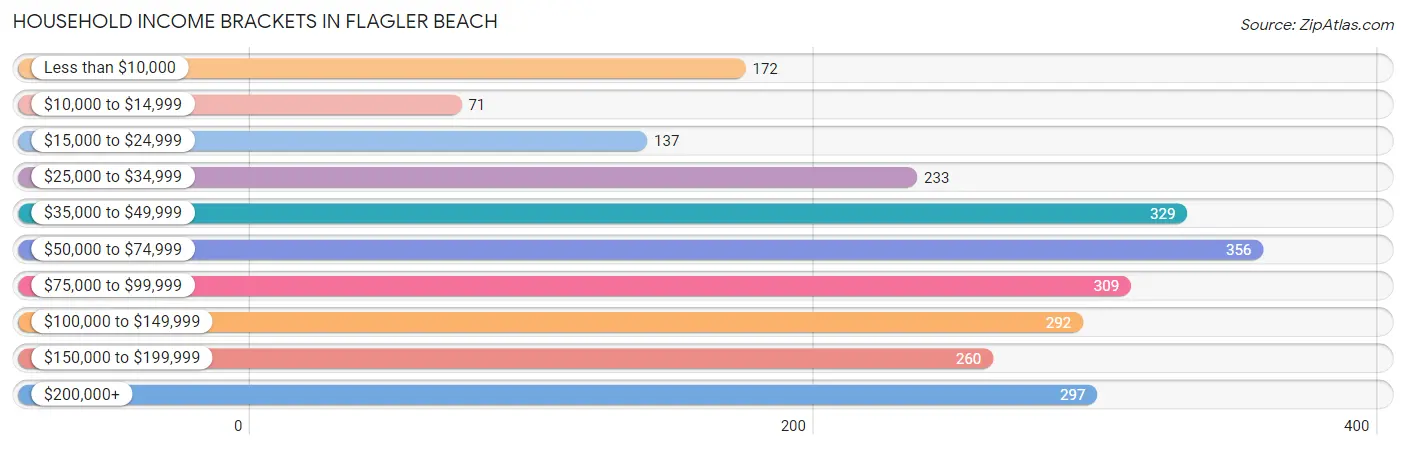
Household Income Brackets in Flagler Beach
With 356 households falling in the category, the $50,000 to $74,999 income range is the most frequent in Flagler Beach, accounting for 14.5% of all households. In contrast, only 71 households (2.9%) fall into the $10,000 to $14,999 income bracket, making it the least populous group.
| Income Bracket | # Households | % Households |
| Less than $10,000 | 172 | 7.0% |
| $10,000 to $14,999 | 71 | 2.9% |
| $15,000 to $24,999 | 137 | 5.6% |
| $25,000 to $34,999 | 233 | 9.5% |
| $35,000 to $49,999 | 329 | 13.4% |
| $50,000 to $74,999 | 356 | 14.5% |
| $75,000 to $99,999 | 309 | 12.6% |
| $100,000 to $149,999 | 292 | 11.9% |
| $150,000 to $199,999 | 260 | 10.6% |
| $200,000+ | 297 | 12.1% |
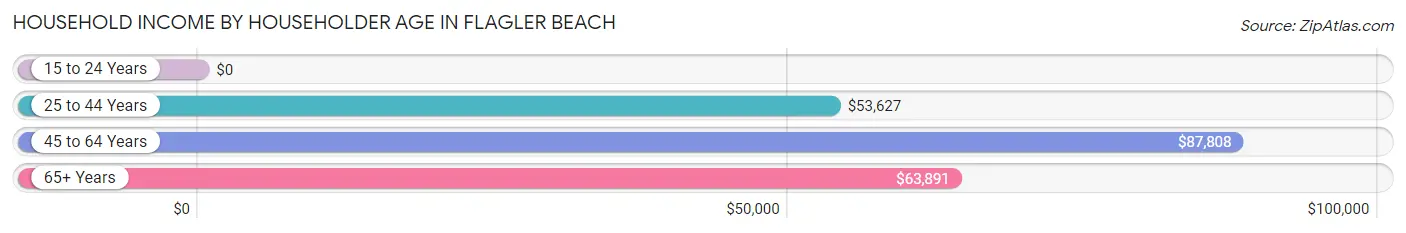
Household Income by Householder Age in Flagler Beach
The median household income in Flagler Beach is $64,242, with the highest median household income of $87,808 found in the 45 to 64 years age bracket for the primary householder. A total of 1,056 households (43.0%) fall into this category. Meanwhile, the 15 to 24 years age bracket for the primary householder has the lowest median household income of $0, with 23 households (0.9%) in this group.
| Income Bracket | # Households | Median Income |
| 15 to 24 Years | 23 (0.9%) | $0 |
| 25 to 44 Years | 312 (12.7%) | $53,627 |
| 45 to 64 Years | 1,056 (43.0%) | $87,808 |
| 65+ Years | 1,063 (43.3%) | $63,891 |
| Total | 2,454 (100.0%) | $64,242 |
Poverty in Flagler Beach
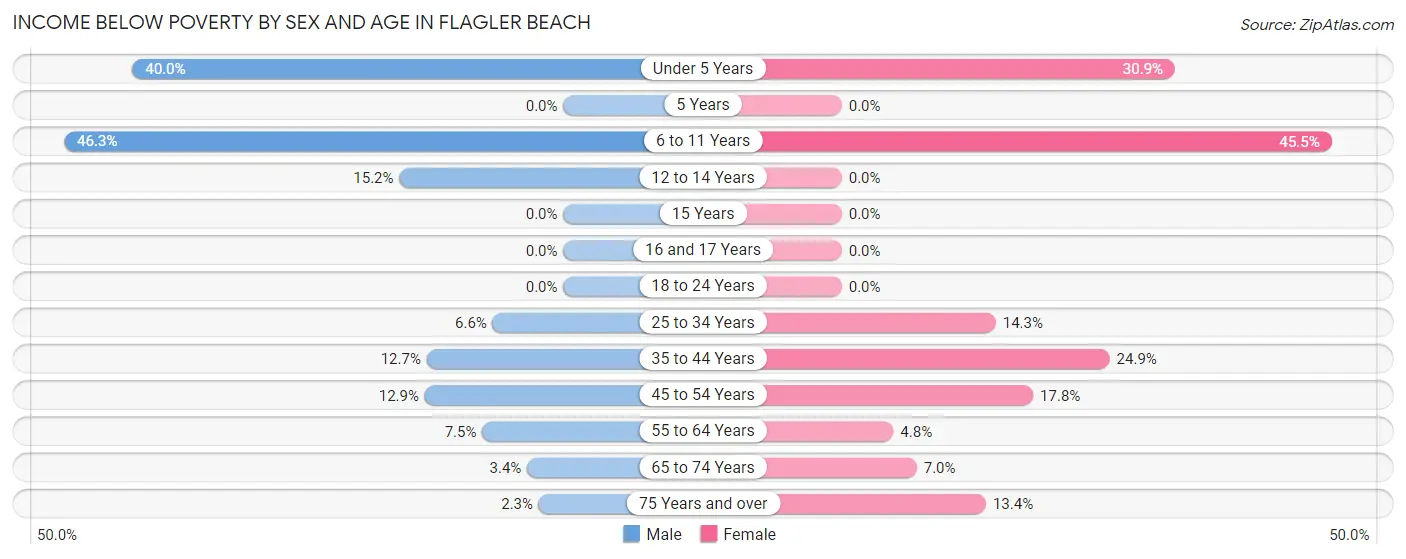
Income Below Poverty by Sex and Age in Flagler Beach
With 8.4% poverty level for males and 12.6% for females among the residents of Flagler Beach, 6 to 11 year old males and 6 to 11 year old females are the most vulnerable to poverty, with 19 males (46.3%) and 50 females (45.5%) in their respective age groups living below the poverty level.
| Age Bracket | Male | Female |
| Under 5 Years | 24 (40.0%) | 34 (30.9%) |
| 5 Years | 0 (0.0%) | 0 (0.0%) |
| 6 to 11 Years | 19 (46.3%) | 50 (45.5%) |
| 12 to 14 Years | 7 (15.2%) | 0 (0.0%) |
| 15 Years | 0 (0.0%) | 0 (0.0%) |
| 16 and 17 Years | 0 (0.0%) | 0 (0.0%) |
| 18 to 24 Years | 0 (0.0%) | 0 (0.0%) |
| 25 to 34 Years | 8 (6.6%) | 31 (14.3%) |
| 35 to 44 Years | 18 (12.7%) | 44 (24.9%) |
| 45 to 54 Years | 53 (12.9%) | 57 (17.8%) |
| 55 to 64 Years | 51 (7.5%) | 28 (4.8%) |
| 65 to 74 Years | 13 (3.4%) | 35 (7.0%) |
| 75 Years and over | 7 (2.3%) | 61 (13.4%) |
| Total | 200 (8.4%) | 340 (12.6%) |
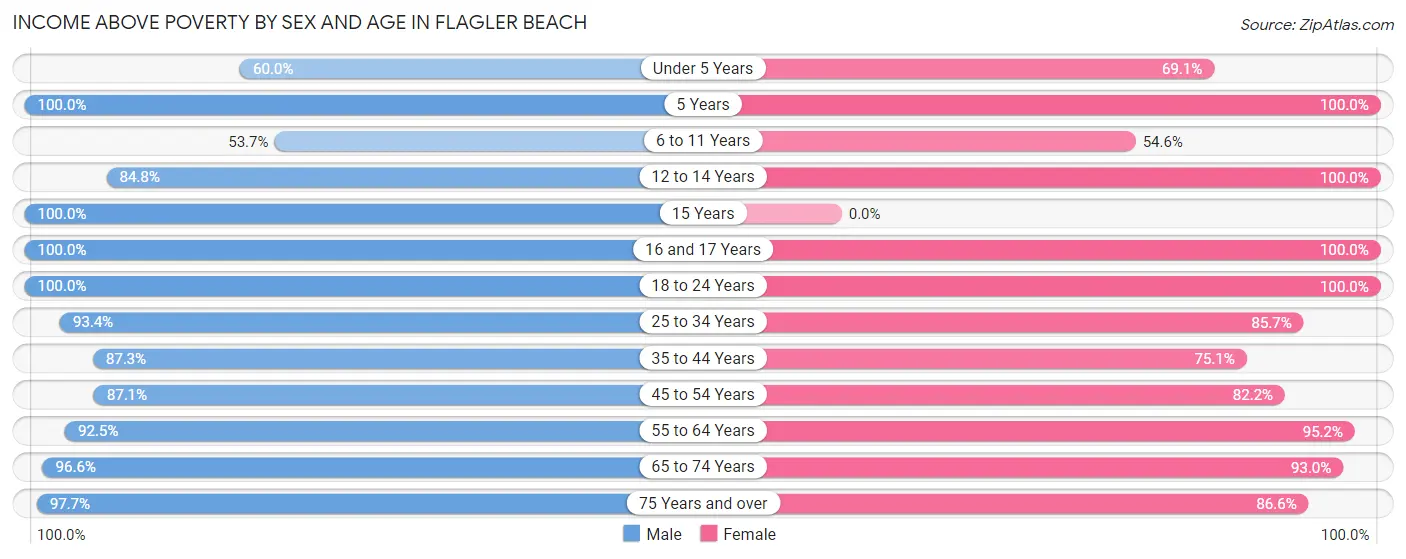
Income Above Poverty by Sex and Age in Flagler Beach
According to the poverty statistics in Flagler Beach, males aged 5 years and females aged 5 years are the age groups that are most secure financially, with 100.0% of males and 100.0% of females in these age groups living above the poverty line.
| Age Bracket | Male | Female |
| Under 5 Years | 36 (60.0%) | 76 (69.1%) |
| 5 Years | 20 (100.0%) | 29 (100.0%) |
| 6 to 11 Years | 22 (53.7%) | 60 (54.5%) |
| 12 to 14 Years | 39 (84.8%) | 14 (100.0%) |
| 15 Years | 31 (100.0%) | 0 (0.0%) |
| 16 and 17 Years | 42 (100.0%) | 50 (100.0%) |
| 18 to 24 Years | 95 (100.0%) | 135 (100.0%) |
| 25 to 34 Years | 114 (93.4%) | 186 (85.7%) |
| 35 to 44 Years | 124 (87.3%) | 133 (75.1%) |
| 45 to 54 Years | 359 (87.1%) | 264 (82.2%) |
| 55 to 64 Years | 627 (92.5%) | 556 (95.2%) |
| 65 to 74 Years | 374 (96.6%) | 468 (93.0%) |
| 75 Years and over | 301 (97.7%) | 395 (86.6%) |
| Total | 2,184 (91.6%) | 2,366 (87.4%) |
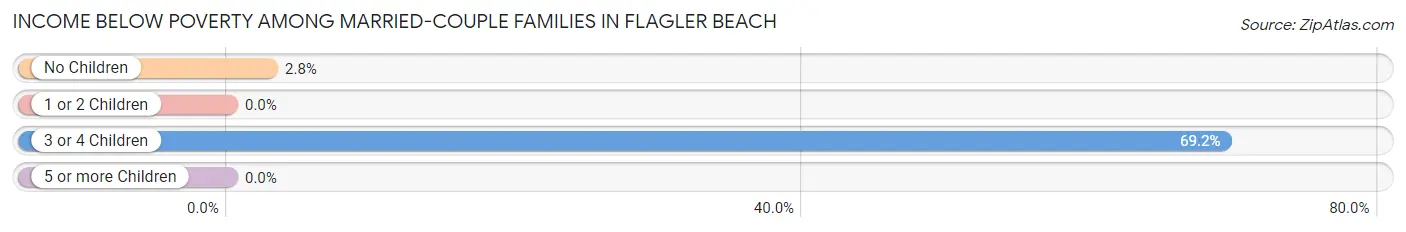
Income Below Poverty Among Married-Couple Families in Flagler Beach
The poverty statistics for married-couple families in Flagler Beach show that 3.1% or 40 of the total 1,281 families live below the poverty line. Families with 3 or 4 children have the highest poverty rate of 69.2%, comprising of 9 families. On the other hand, families with 1 or 2 children have the lowest poverty rate of 0.0%, which includes 0 families.
| Children | Above Poverty | Below Poverty |
| No Children | 1,079 (97.2%) | 31 (2.8%) |
| 1 or 2 Children | 158 (100.0%) | 0 (0.0%) |
| 3 or 4 Children | 4 (30.8%) | 9 (69.2%) |
| 5 or more Children | 0 (0.0%) | 0 (0.0%) |
| Total | 1,241 (96.9%) | 40 (3.1%) |
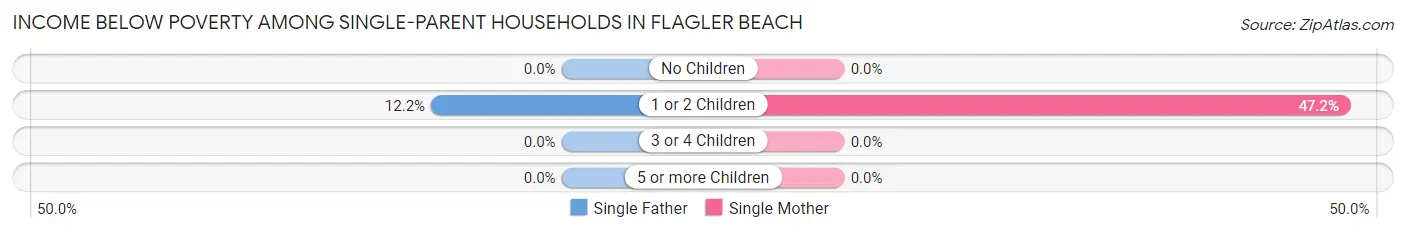
Income Below Poverty Among Single-Parent Households in Flagler Beach
According to the poverty data in Flagler Beach, 10.8% or 9 single-father households and 31.2% or 68 single-mother households are living below the poverty line. Among single-father households, those with 1 or 2 children have the highest poverty rate, with 9 households (12.2%) experiencing poverty. Likewise, among single-mother households, those with 1 or 2 children have the highest poverty rate, with 68 households (47.2%) falling below the poverty line.
| Children | Single Father | Single Mother |
| No Children | 0 (0.0%) | 0 (0.0%) |
| 1 or 2 Children | 9 (12.2%) | 68 (47.2%) |
| 3 or 4 Children | 0 (0.0%) | 0 (0.0%) |
| 5 or more Children | 0 (0.0%) | 0 (0.0%) |
| Total | 9 (10.8%) | 68 (31.2%) |
Income Below Poverty Among Married-Couple vs Single-Parent Households in Flagler Beach
The poverty data for Flagler Beach shows that 40 of the married-couple family households (3.1%) and 77 of the single-parent households (25.6%) are living below the poverty level. Within the married-couple family households, those with 3 or 4 children have the highest poverty rate, with 9 households (69.2%) falling below the poverty line. Among the single-parent households, those with 1 or 2 children have the highest poverty rate, with 77 household (35.3%) living below poverty.
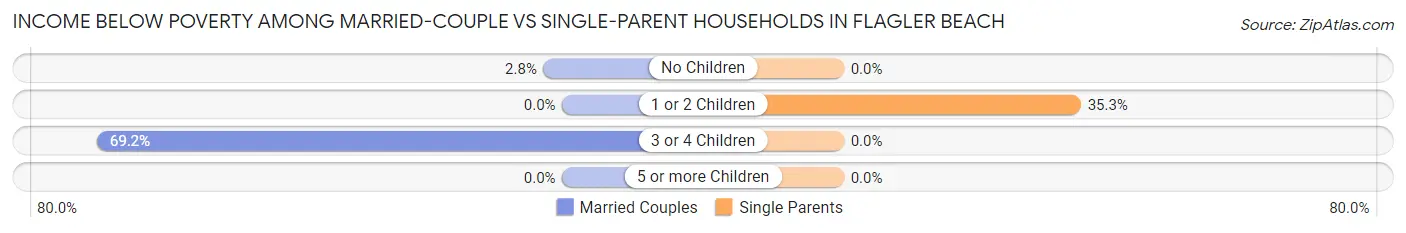
| Children | Married-Couple Families | Single-Parent Households |
| No Children | 31 (2.8%) | 0 (0.0%) |
| 1 or 2 Children | 0 (0.0%) | 77 (35.3%) |
| 3 or 4 Children | 9 (69.2%) | 0 (0.0%) |
| 5 or more Children | 0 (0.0%) | 0 (0.0%) |
| Total | 40 (3.1%) | 77 (25.6%) |
Employment Characteristics in Flagler Beach
Employment by Class of Employer in Flagler Beach
Among the 1,828 employed individuals in Flagler Beach, private company employees (992 | 54.3%), self-employed (incorporated) (229 | 12.5%), and local government employees (185 | 10.1%) make up the most common classes of employment.
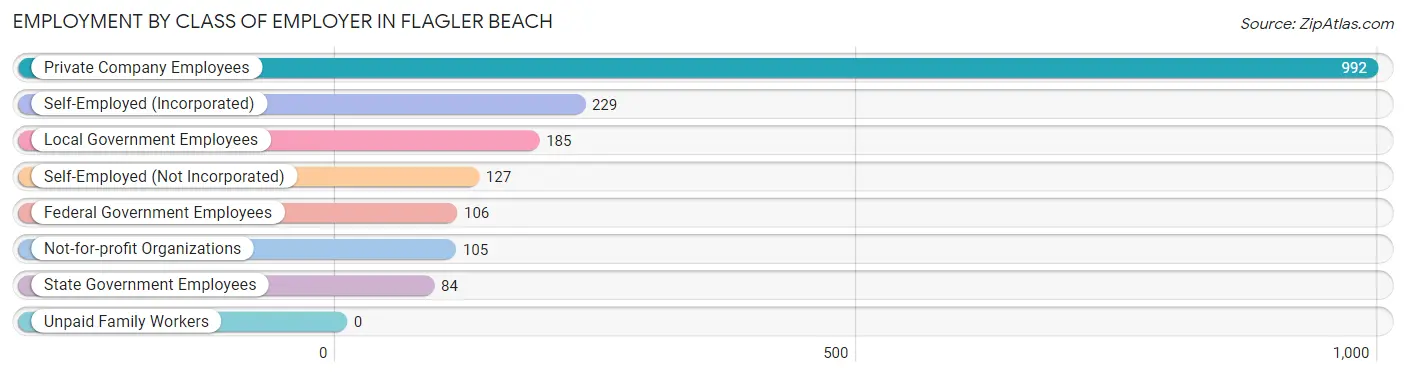
| Employer Class | # Employees | % Employees |
| Private Company Employees | 992 | 54.3% |
| Self-Employed (Incorporated) | 229 | 12.5% |
| Self-Employed (Not Incorporated) | 127 | 7.0% |
| Not-for-profit Organizations | 105 | 5.7% |
| Local Government Employees | 185 | 10.1% |
| State Government Employees | 84 | 4.6% |
| Federal Government Employees | 106 | 5.8% |
| Unpaid Family Workers | 0 | 0.0% |
| Total | 1,828 | 100.0% |
Employment Status by Age in Flagler Beach
According to the labor force statistics for Flagler Beach, out of the total population over 16 years of age (4,629), 40.4% or 1,870 individuals are in the labor force, with 2.3% or 43 of them unemployed. The age group with the highest labor force participation rate is 25 to 29 years, with 90.9% or 120 individuals in the labor force. Within the labor force, the 20 to 24 years age range has the highest percentage of unemployed individuals, with 44.2% or 23 of them being unemployed.
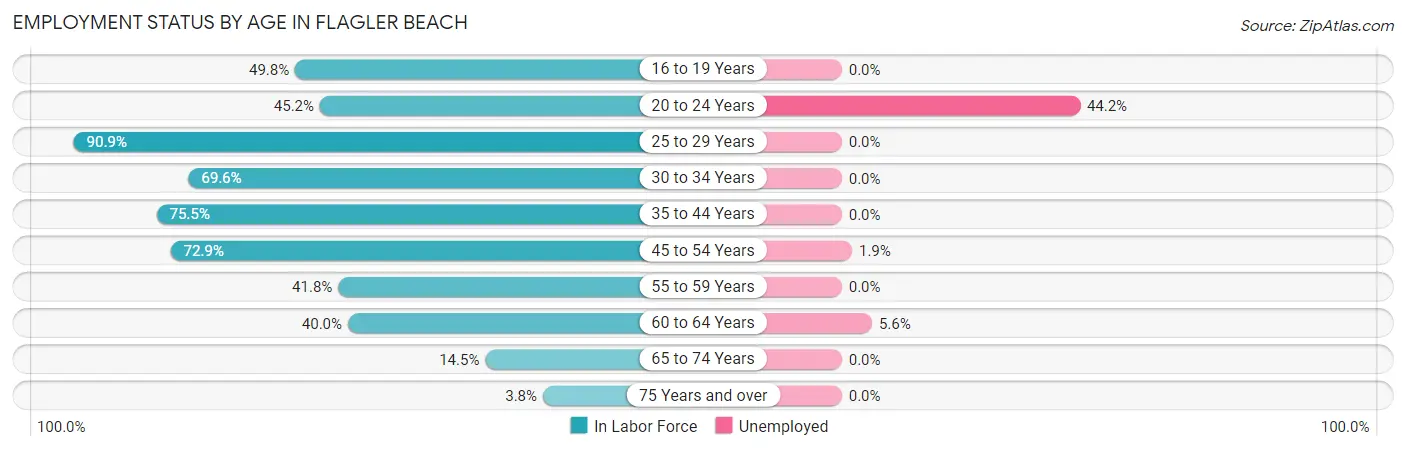
| Age Bracket | In Labor Force | Unemployed |
| 16 to 19 Years | 103 (49.8%) | 0 (0.0%) |
| 20 to 24 Years | 52 (45.2%) | 23 (44.2%) |
| 25 to 29 Years | 120 (90.9%) | 0 (0.0%) |
| 30 to 34 Years | 144 (69.6%) | 0 (0.0%) |
| 35 to 44 Years | 241 (75.5%) | 0 (0.0%) |
| 45 to 54 Years | 534 (72.9%) | 10 (1.9%) |
| 55 to 59 Years | 342 (41.8%) | 0 (0.0%) |
| 60 to 64 Years | 177 (40.0%) | 10 (5.6%) |
| 65 to 74 Years | 129 (14.5%) | 0 (0.0%) |
| 75 Years and over | 29 (3.8%) | 0 (0.0%) |
| Total | 1,870 (40.4%) | 43 (2.3%) |
Employment Status by Educational Attainment in Flagler Beach
According to labor force statistics for Flagler Beach, 58.7% of individuals (1,557) out of the total population between 25 and 64 years of age (2,653) are in the labor force, with 1.3% or 20 of them being unemployed. The group with the highest labor force participation rate are those with the educational attainment of less than high school, with 91.8% or 101 individuals in the labor force. Within the labor force, individuals with college / associate degree education have the highest percentage of unemployment, with 4.9% or 20 of them being unemployed.
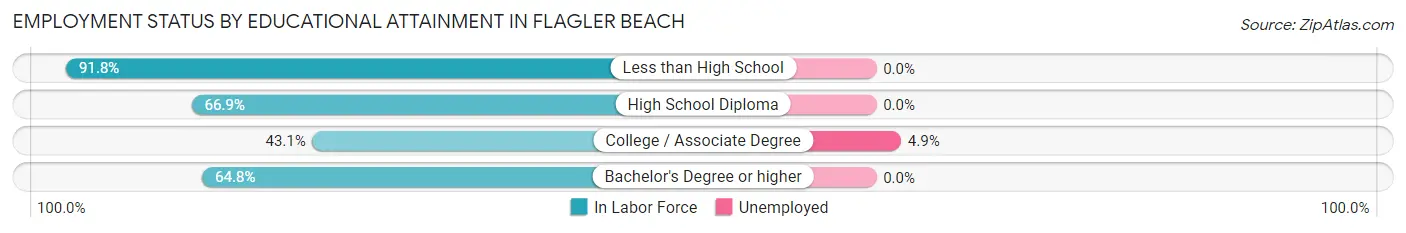
| Educational Attainment | In Labor Force | Unemployed |
| Less than High School | 101 (91.8%) | 0 (0.0%) |
| High School Diploma | 501 (66.9%) | 0 (0.0%) |
| College / Associate Degree | 410 (43.1%) | 47 (4.9%) |
| Bachelor's Degree or higher | 546 (64.8%) | 0 (0.0%) |
| Total | 1,557 (58.7%) | 34 (1.3%) |
Employment Occupations by Sex in Flagler Beach
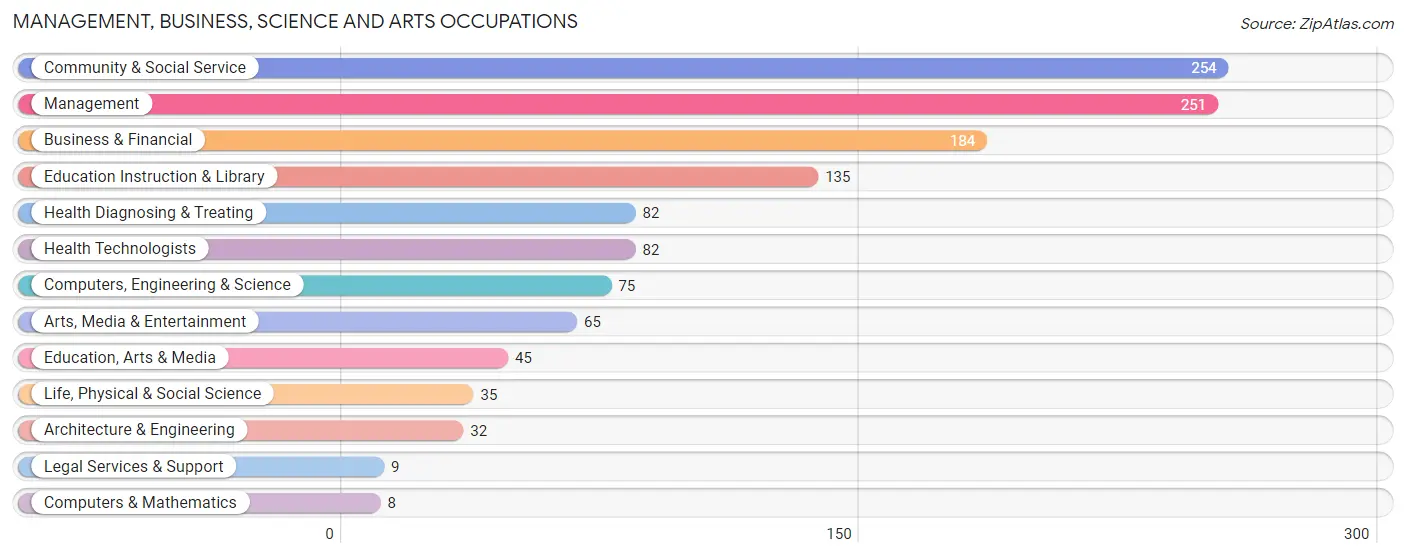
Management, Business, Science and Arts Occupations
The most common Management, Business, Science and Arts occupations in Flagler Beach are Community & Social Service (254 | 13.9%), Management (251 | 13.7%), Business & Financial (184 | 10.1%), Education Instruction & Library (135 | 7.4%), and Health Diagnosing & Treating (82 | 4.5%).
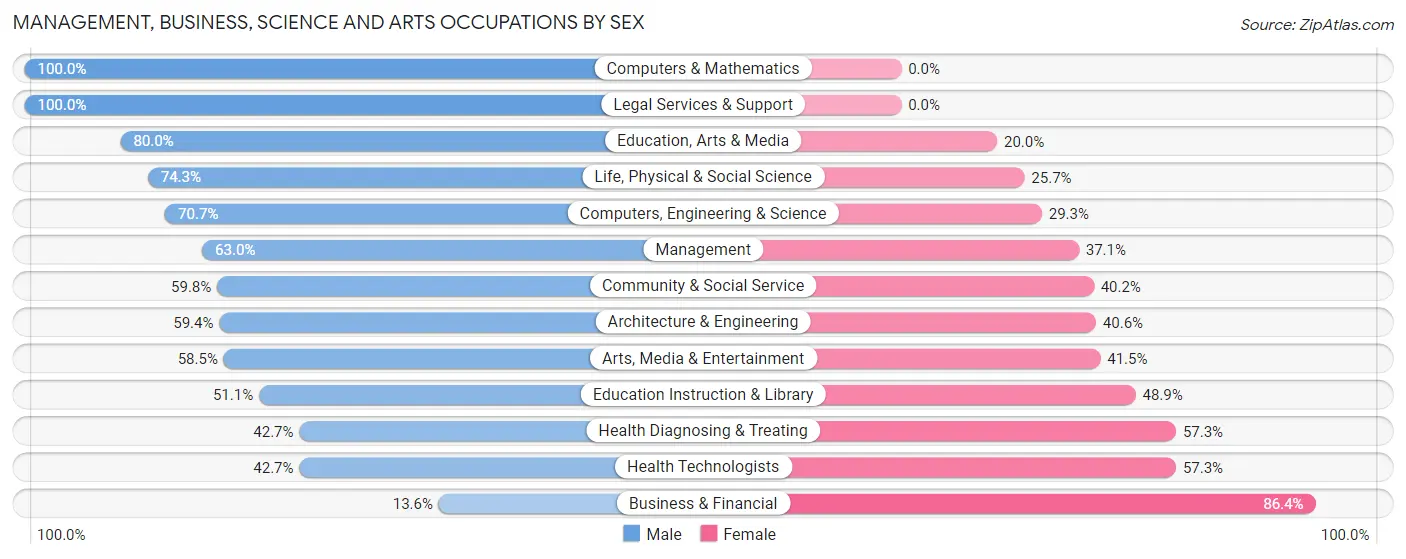
Management, Business, Science and Arts Occupations by Sex
Within the Management, Business, Science and Arts occupations in Flagler Beach, the most male-oriented occupations are Computers & Mathematics (100.0%), Legal Services & Support (100.0%), and Education, Arts & Media (80.0%), while the most female-oriented occupations are Business & Financial (86.4%), Health Diagnosing & Treating (57.3%), and Health Technologists (57.3%).
| Occupation | Male | Female |
| Management | 158 (62.9%) | 93 (37.0%) |
| Business & Financial | 25 (13.6%) | 159 (86.4%) |
| Computers, Engineering & Science | 53 (70.7%) | 22 (29.3%) |
| Computers & Mathematics | 8 (100.0%) | 0 (0.0%) |
| Architecture & Engineering | 19 (59.4%) | 13 (40.6%) |
| Life, Physical & Social Science | 26 (74.3%) | 9 (25.7%) |
| Community & Social Service | 152 (59.8%) | 102 (40.2%) |
| Education, Arts & Media | 36 (80.0%) | 9 (20.0%) |
| Legal Services & Support | 9 (100.0%) | 0 (0.0%) |
| Education Instruction & Library | 69 (51.1%) | 66 (48.9%) |
| Arts, Media & Entertainment | 38 (58.5%) | 27 (41.5%) |
| Health Diagnosing & Treating | 35 (42.7%) | 47 (57.3%) |
| Health Technologists | 35 (42.7%) | 47 (57.3%) |
| Total (Category) | 423 (50.0%) | 423 (50.0%) |
| Total (Overall) | 960 (52.5%) | 868 (47.5%) |
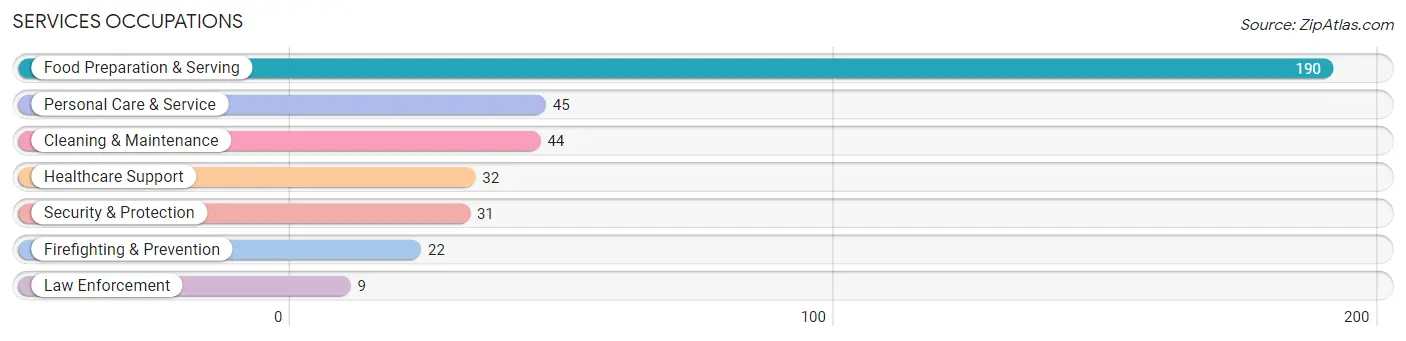
Services Occupations
The most common Services occupations in Flagler Beach are Food Preparation & Serving (190 | 10.4%), Personal Care & Service (45 | 2.5%), Cleaning & Maintenance (44 | 2.4%), Healthcare Support (32 | 1.8%), and Security & Protection (31 | 1.7%).
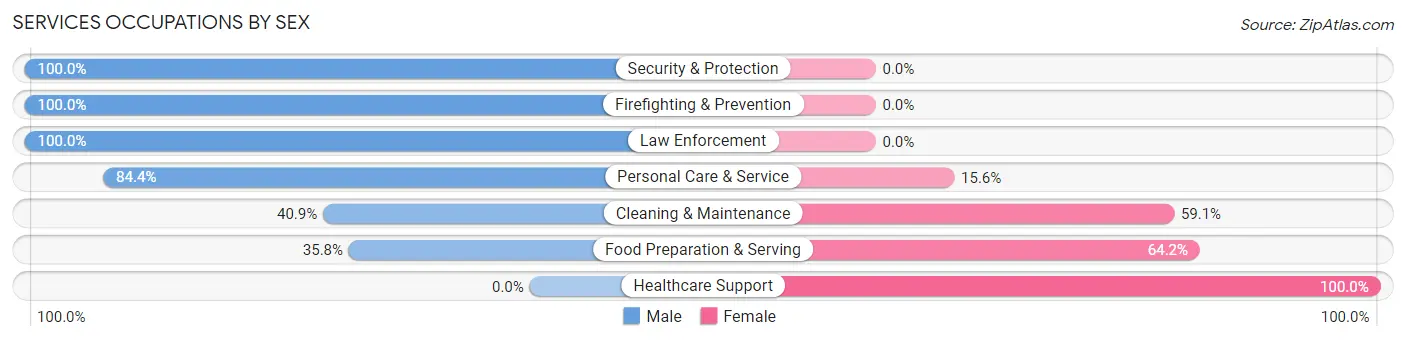
Services Occupations by Sex
Within the Services occupations in Flagler Beach, the most male-oriented occupations are Security & Protection (100.0%), Firefighting & Prevention (100.0%), and Law Enforcement (100.0%), while the most female-oriented occupations are Healthcare Support (100.0%), Food Preparation & Serving (64.2%), and Cleaning & Maintenance (59.1%).
| Occupation | Male | Female |
| Healthcare Support | 0 (0.0%) | 32 (100.0%) |
| Security & Protection | 31 (100.0%) | 0 (0.0%) |
| Firefighting & Prevention | 22 (100.0%) | 0 (0.0%) |
| Law Enforcement | 9 (100.0%) | 0 (0.0%) |
| Food Preparation & Serving | 68 (35.8%) | 122 (64.2%) |
| Cleaning & Maintenance | 18 (40.9%) | 26 (59.1%) |
| Personal Care & Service | 38 (84.4%) | 7 (15.6%) |
| Total (Category) | 155 (45.3%) | 187 (54.7%) |
| Total (Overall) | 960 (52.5%) | 868 (47.5%) |
Sales and Office Occupations
The most common Sales and Office occupations in Flagler Beach are Sales & Related (246 | 13.5%), and Office & Administration (69 | 3.8%).
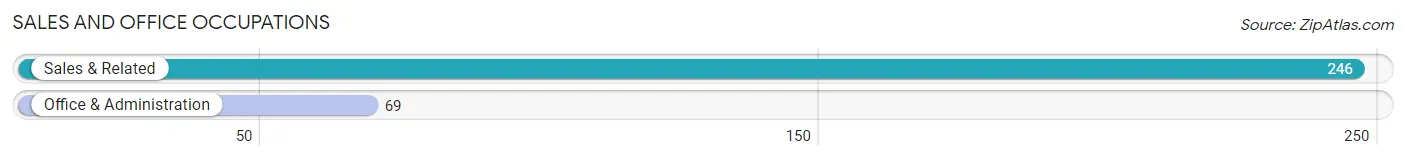
Sales and Office Occupations by Sex
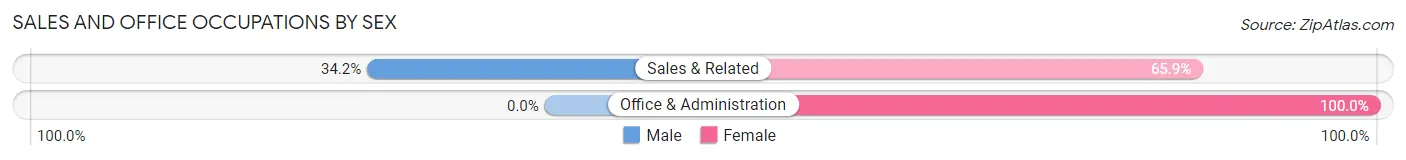
| Occupation | Male | Female |
| Sales & Related | 84 (34.2%) | 162 (65.8%) |
| Office & Administration | 0 (0.0%) | 69 (100.0%) |
| Total (Category) | 84 (26.7%) | 231 (73.3%) |
| Total (Overall) | 960 (52.5%) | 868 (47.5%) |
Natural Resources, Construction and Maintenance Occupations
The most common Natural Resources, Construction and Maintenance occupations in Flagler Beach are Construction & Extraction (101 | 5.5%), and Installation, Maintenance & Repair (36 | 2.0%).
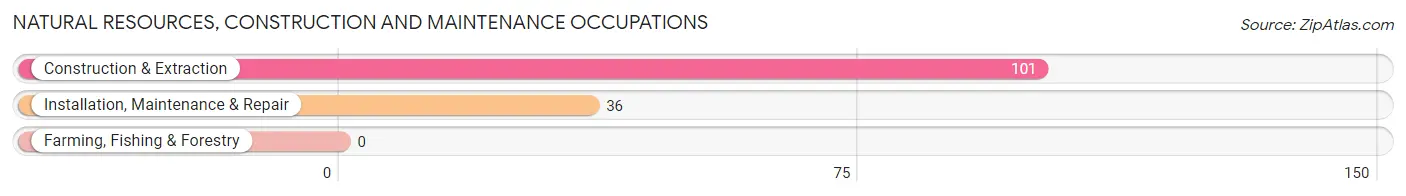
Natural Resources, Construction and Maintenance Occupations by Sex
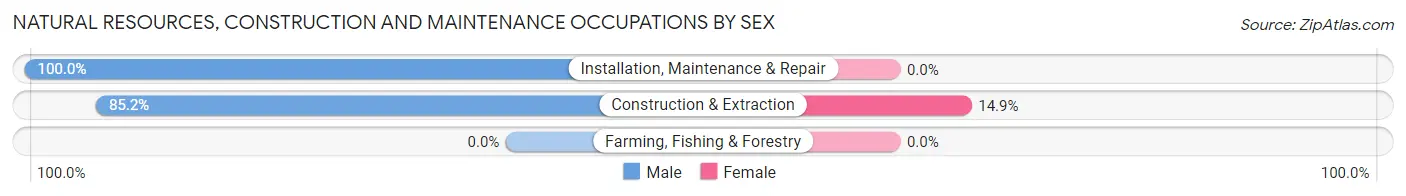
| Occupation | Male | Female |
| Farming, Fishing & Forestry | 0 (0.0%) | 0 (0.0%) |
| Construction & Extraction | 86 (85.2%) | 15 (14.8%) |
| Installation, Maintenance & Repair | 36 (100.0%) | 0 (0.0%) |
| Total (Category) | 122 (89.0%) | 15 (11.0%) |
| Total (Overall) | 960 (52.5%) | 868 (47.5%) |
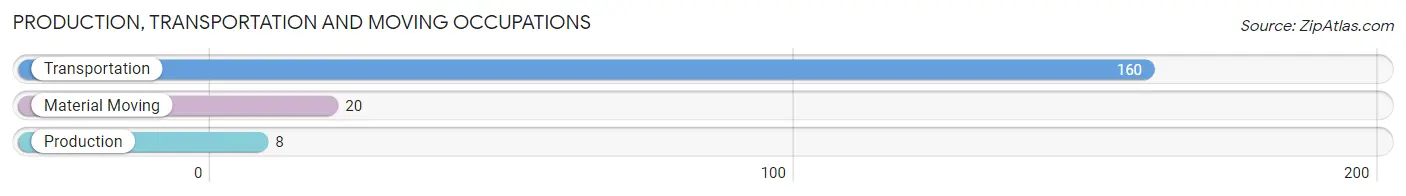
Production, Transportation and Moving Occupations
The most common Production, Transportation and Moving occupations in Flagler Beach are Transportation (160 | 8.7%), Material Moving (20 | 1.1%), and Production (8 | 0.4%).
Production, Transportation and Moving Occupations by Sex
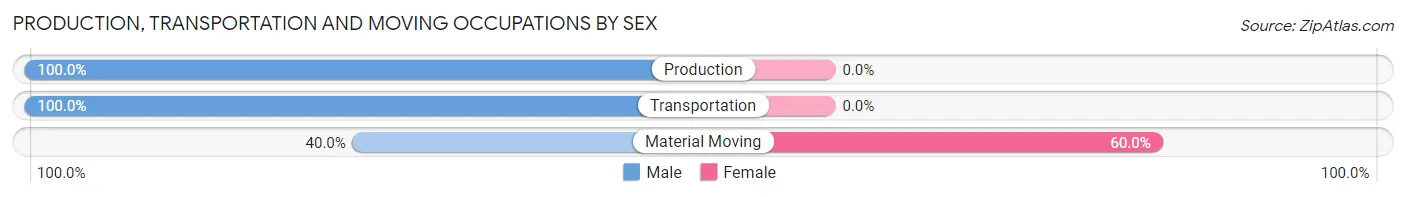
| Occupation | Male | Female |
| Production | 8 (100.0%) | 0 (0.0%) |
| Transportation | 160 (100.0%) | 0 (0.0%) |
| Material Moving | 8 (40.0%) | 12 (60.0%) |
| Total (Category) | 176 (93.6%) | 12 (6.4%) |
| Total (Overall) | 960 (52.5%) | 868 (47.5%) |
Employment Industries by Sex in Flagler Beach
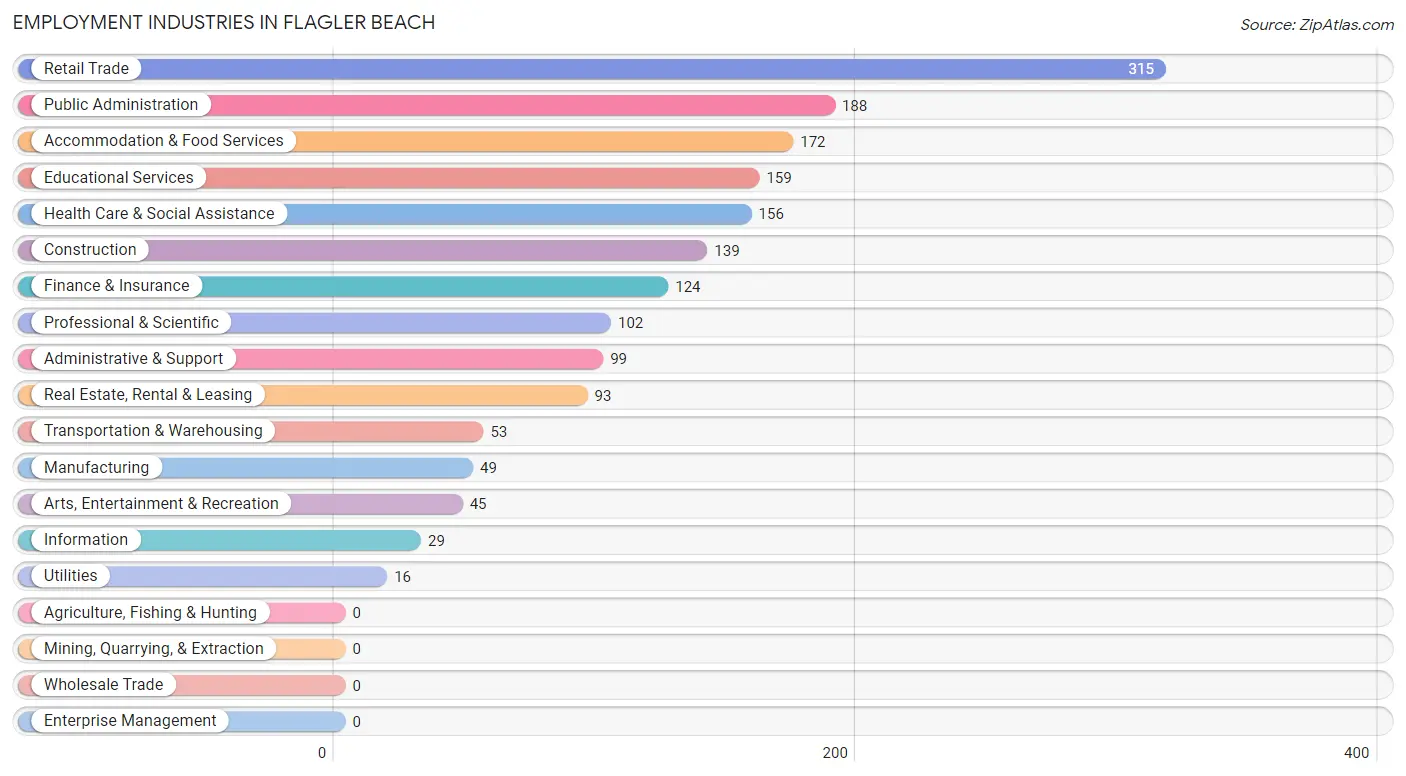
Employment Industries in Flagler Beach
The major employment industries in Flagler Beach include Retail Trade (315 | 17.2%), Public Administration (188 | 10.3%), Accommodation & Food Services (172 | 9.4%), Educational Services (159 | 8.7%), and Health Care & Social Assistance (156 | 8.5%).
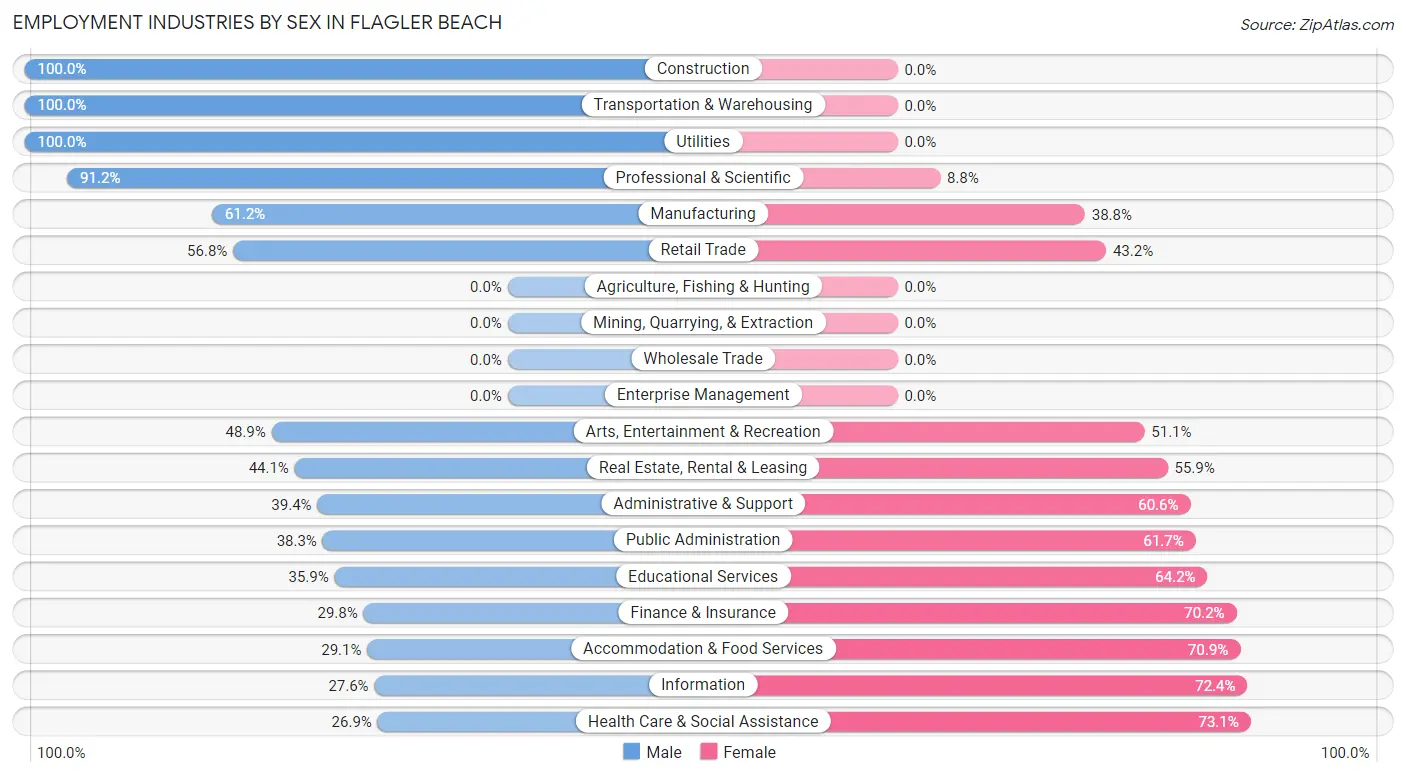
Employment Industries by Sex in Flagler Beach
The Flagler Beach industries that see more men than women are Construction (100.0%), Transportation & Warehousing (100.0%), and Utilities (100.0%), whereas the industries that tend to have a higher number of women are Health Care & Social Assistance (73.1%), Information (72.4%), and Accommodation & Food Services (70.9%).
| Industry | Male | Female |
| Agriculture, Fishing & Hunting | 0 (0.0%) | 0 (0.0%) |
| Mining, Quarrying, & Extraction | 0 (0.0%) | 0 (0.0%) |
| Construction | 139 (100.0%) | 0 (0.0%) |
| Manufacturing | 30 (61.2%) | 19 (38.8%) |
| Wholesale Trade | 0 (0.0%) | 0 (0.0%) |
| Retail Trade | 179 (56.8%) | 136 (43.2%) |
| Transportation & Warehousing | 53 (100.0%) | 0 (0.0%) |
| Utilities | 16 (100.0%) | 0 (0.0%) |
| Information | 8 (27.6%) | 21 (72.4%) |
| Finance & Insurance | 37 (29.8%) | 87 (70.2%) |
| Real Estate, Rental & Leasing | 41 (44.1%) | 52 (55.9%) |
| Professional & Scientific | 93 (91.2%) | 9 (8.8%) |
| Enterprise Management | 0 (0.0%) | 0 (0.0%) |
| Administrative & Support | 39 (39.4%) | 60 (60.6%) |
| Educational Services | 57 (35.8%) | 102 (64.1%) |
| Health Care & Social Assistance | 42 (26.9%) | 114 (73.1%) |
| Arts, Entertainment & Recreation | 22 (48.9%) | 23 (51.1%) |
| Accommodation & Food Services | 50 (29.1%) | 122 (70.9%) |
| Public Administration | 72 (38.3%) | 116 (61.7%) |
| Total | 960 (52.5%) | 868 (47.5%) |
Education in Flagler Beach
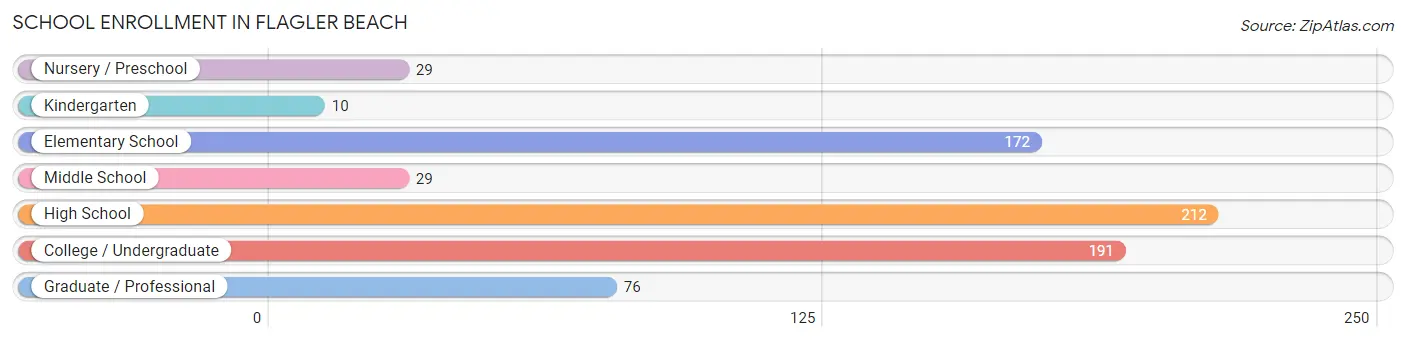
School Enrollment in Flagler Beach
The most common levels of schooling among the 719 students in Flagler Beach are high school (212 | 29.5%), college / undergraduate (191 | 26.6%), and elementary school (172 | 23.9%).
| School Level | # Students | % Students |
| Nursery / Preschool | 29 | 4.0% |
| Kindergarten | 10 | 1.4% |
| Elementary School | 172 | 23.9% |
| Middle School | 29 | 4.0% |
| High School | 212 | 29.5% |
| College / Undergraduate | 191 | 26.6% |
| Graduate / Professional | 76 | 10.6% |
| Total | 719 | 100.0% |
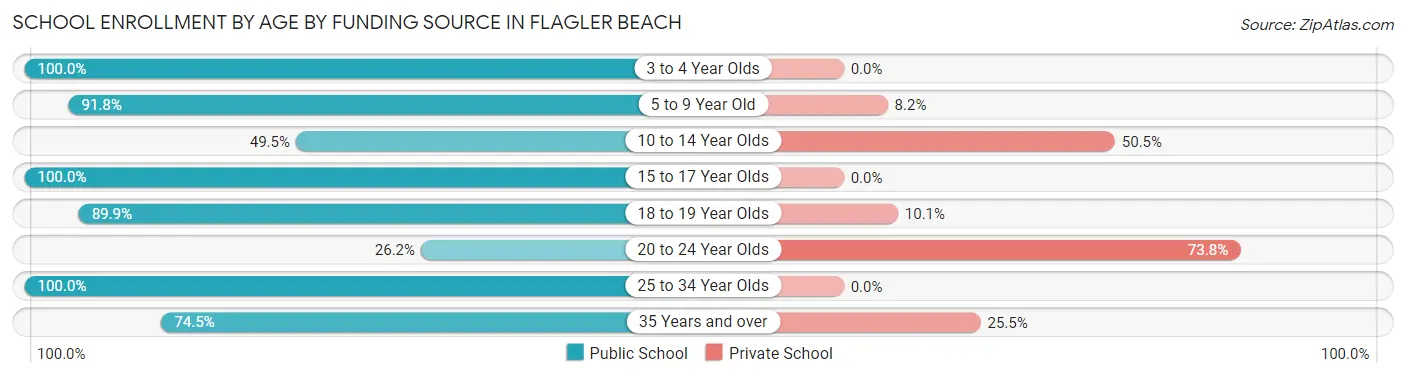
School Enrollment by Age by Funding Source in Flagler Beach
Out of a total of 719 students who are enrolled in schools in Flagler Beach, 132 (18.4%) attend a private institution, while the remaining 587 (81.6%) are enrolled in public schools. The age group of 20 to 24 year olds has the highest likelihood of being enrolled in private schools, with 31 (73.8% in the age bracket) enrolled. Conversely, the age group of 3 to 4 year olds has the lowest likelihood of being enrolled in a private school, with 9 (100.0% in the age bracket) attending a public institution.
| Age Bracket | Public School | Private School |
| 3 to 4 Year Olds | 9 (100.0%) | 0 (0.0%) |
| 5 to 9 Year Old | 157 (91.8%) | 14 (8.2%) |
| 10 to 14 Year Olds | 49 (49.5%) | 50 (50.5%) |
| 15 to 17 Year Olds | 123 (100.0%) | 0 (0.0%) |
| 18 to 19 Year Olds | 98 (89.9%) | 11 (10.1%) |
| 20 to 24 Year Olds | 11 (26.2%) | 31 (73.8%) |
| 25 to 34 Year Olds | 64 (100.0%) | 0 (0.0%) |
| 35 Years and over | 76 (74.5%) | 26 (25.5%) |
| Total | 587 (81.6%) | 132 (18.4%) |
Educational Attainment by Field of Study in Flagler Beach
Education (411 | 26.2%), business (261 | 16.6%), science & technology (189 | 12.0%), social sciences (103 | 6.6%), and bio, nature & agricultural (97 | 6.2%) are the most common fields of study among 1,571 individuals in Flagler Beach who have obtained a bachelor's degree or higher.
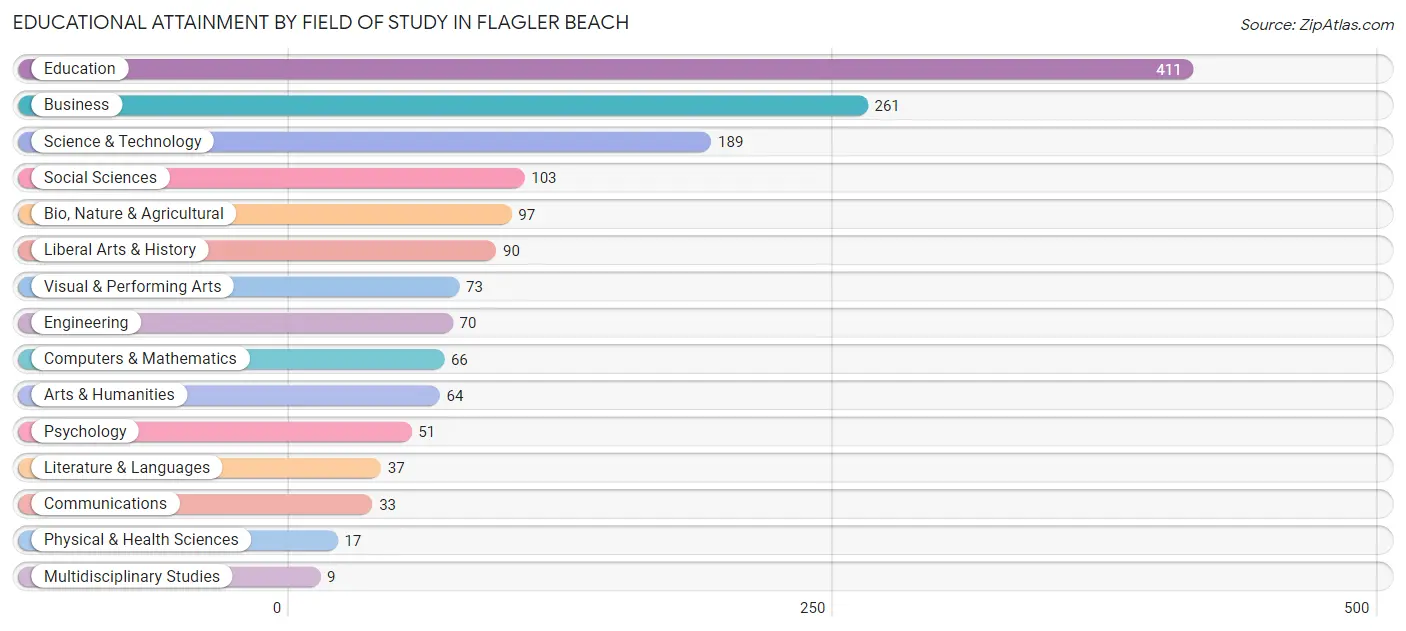
| Field of Study | # Graduates | % Graduates |
| Computers & Mathematics | 66 | 4.2% |
| Bio, Nature & Agricultural | 97 | 6.2% |
| Physical & Health Sciences | 17 | 1.1% |
| Psychology | 51 | 3.3% |
| Social Sciences | 103 | 6.6% |
| Engineering | 70 | 4.5% |
| Multidisciplinary Studies | 9 | 0.6% |
| Science & Technology | 189 | 12.0% |
| Business | 261 | 16.6% |
| Education | 411 | 26.2% |
| Literature & Languages | 37 | 2.4% |
| Liberal Arts & History | 90 | 5.7% |
| Visual & Performing Arts | 73 | 4.6% |
| Communications | 33 | 2.1% |
| Arts & Humanities | 64 | 4.1% |
| Total | 1,571 | 100.0% |
Transportation & Commute in Flagler Beach
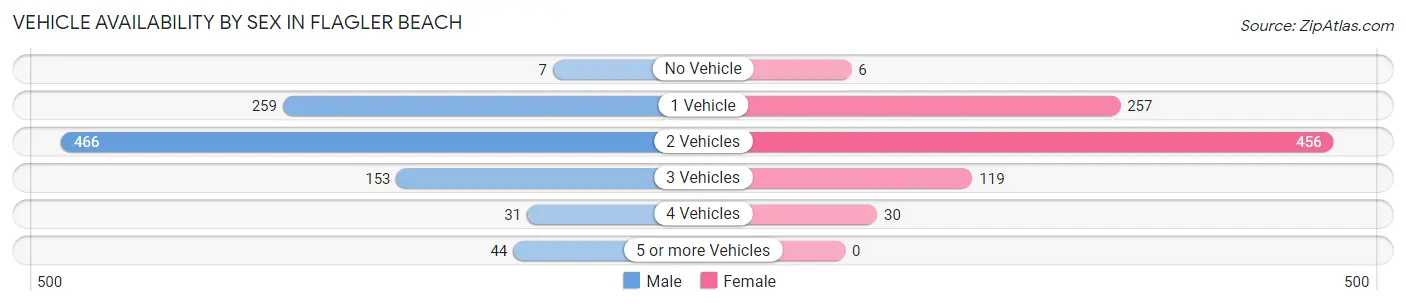
Vehicle Availability by Sex in Flagler Beach
The most prevalent vehicle ownership categories in Flagler Beach are males with 2 vehicles (466, accounting for 48.5%) and females with 2 vehicles (456, making up 53.7%).
| Vehicles Available | Male | Female |
| No Vehicle | 7 (0.7%) | 6 (0.7%) |
| 1 Vehicle | 259 (27.0%) | 257 (29.6%) |
| 2 Vehicles | 466 (48.5%) | 456 (52.5%) |
| 3 Vehicles | 153 (15.9%) | 119 (13.7%) |
| 4 Vehicles | 31 (3.2%) | 30 (3.5%) |
| 5 or more Vehicles | 44 (4.6%) | 0 (0.0%) |
| Total | 960 (100.0%) | 868 (100.0%) |
Commute Time in Flagler Beach
The most frequently occuring commute durations in Flagler Beach are 20 to 24 minutes (216 commuters, 16.7%), 15 to 19 minutes (199 commuters, 15.3%), and 45 to 59 minutes (187 commuters, 14.4%).
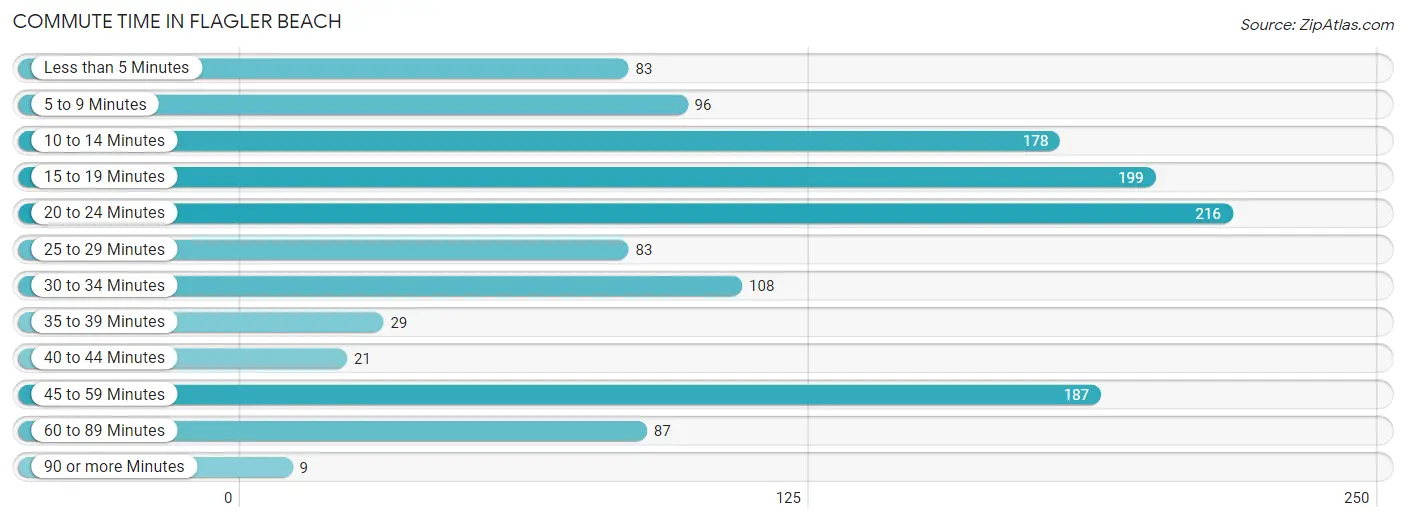
| Commute Time | # Commuters | % Commuters |
| Less than 5 Minutes | 83 | 6.4% |
| 5 to 9 Minutes | 96 | 7.4% |
| 10 to 14 Minutes | 178 | 13.7% |
| 15 to 19 Minutes | 199 | 15.3% |
| 20 to 24 Minutes | 216 | 16.7% |
| 25 to 29 Minutes | 83 | 6.4% |
| 30 to 34 Minutes | 108 | 8.3% |
| 35 to 39 Minutes | 29 | 2.2% |
| 40 to 44 Minutes | 21 | 1.6% |
| 45 to 59 Minutes | 187 | 14.4% |
| 60 to 89 Minutes | 87 | 6.7% |
| 90 or more Minutes | 9 | 0.7% |
Commute Time by Sex in Flagler Beach
The most common commute times in Flagler Beach are 15 to 19 minutes (160 commuters, 22.7%) for males and 20 to 24 minutes (115 commuters, 19.5%) for females.
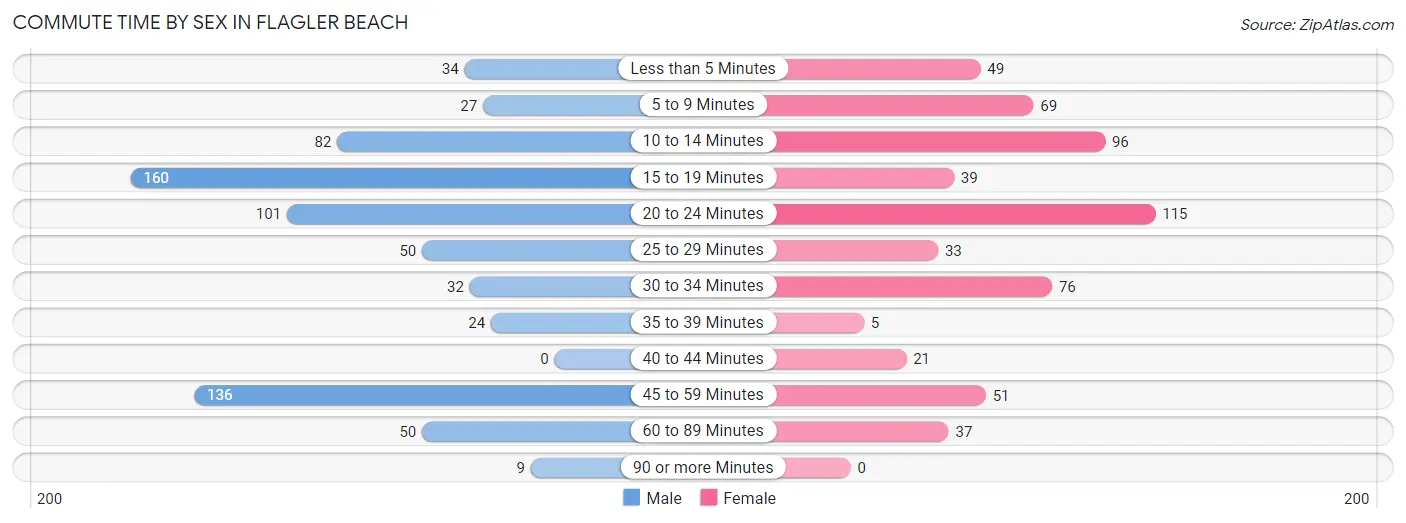
| Commute Time | Male | Female |
| Less than 5 Minutes | 34 (4.8%) | 49 (8.3%) |
| 5 to 9 Minutes | 27 (3.8%) | 69 (11.7%) |
| 10 to 14 Minutes | 82 (11.6%) | 96 (16.2%) |
| 15 to 19 Minutes | 160 (22.7%) | 39 (6.6%) |
| 20 to 24 Minutes | 101 (14.3%) | 115 (19.5%) |
| 25 to 29 Minutes | 50 (7.1%) | 33 (5.6%) |
| 30 to 34 Minutes | 32 (4.5%) | 76 (12.9%) |
| 35 to 39 Minutes | 24 (3.4%) | 5 (0.9%) |
| 40 to 44 Minutes | 0 (0.0%) | 21 (3.5%) |
| 45 to 59 Minutes | 136 (19.3%) | 51 (8.6%) |
| 60 to 89 Minutes | 50 (7.1%) | 37 (6.3%) |
| 90 or more Minutes | 9 (1.3%) | 0 (0.0%) |
Time of Departure to Work by Sex in Flagler Beach
The most frequent times of departure to work in Flagler Beach are 7:00 AM to 7:29 AM (266, 37.7%) for males and 7:00 AM to 7:29 AM (184, 31.1%) for females.
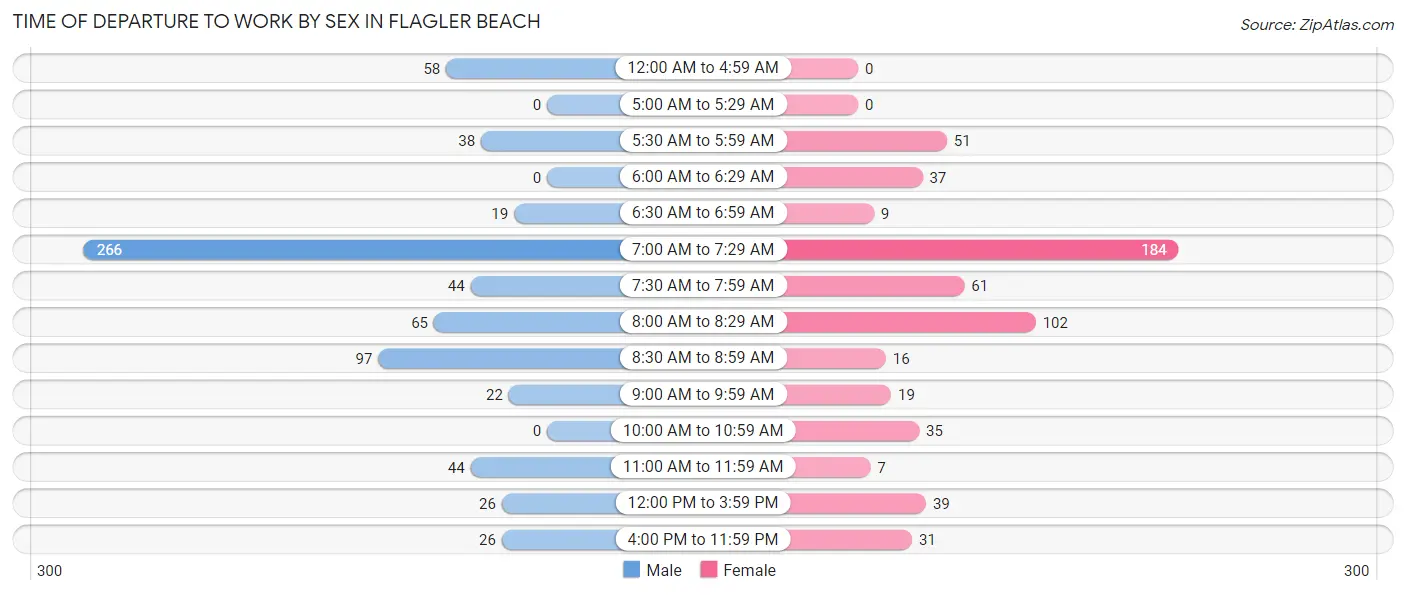
| Time of Departure | Male | Female |
| 12:00 AM to 4:59 AM | 58 (8.2%) | 0 (0.0%) |
| 5:00 AM to 5:29 AM | 0 (0.0%) | 0 (0.0%) |
| 5:30 AM to 5:59 AM | 38 (5.4%) | 51 (8.6%) |
| 6:00 AM to 6:29 AM | 0 (0.0%) | 37 (6.3%) |
| 6:30 AM to 6:59 AM | 19 (2.7%) | 9 (1.5%) |
| 7:00 AM to 7:29 AM | 266 (37.7%) | 184 (31.1%) |
| 7:30 AM to 7:59 AM | 44 (6.2%) | 61 (10.3%) |
| 8:00 AM to 8:29 AM | 65 (9.2%) | 102 (17.3%) |
| 8:30 AM to 8:59 AM | 97 (13.8%) | 16 (2.7%) |
| 9:00 AM to 9:59 AM | 22 (3.1%) | 19 (3.2%) |
| 10:00 AM to 10:59 AM | 0 (0.0%) | 35 (5.9%) |
| 11:00 AM to 11:59 AM | 44 (6.2%) | 7 (1.2%) |
| 12:00 PM to 3:59 PM | 26 (3.7%) | 39 (6.6%) |
| 4:00 PM to 11:59 PM | 26 (3.7%) | 31 (5.2%) |
| Total | 705 (100.0%) | 591 (100.0%) |
Housing Occupancy in Flagler Beach
Occupancy by Ownership in Flagler Beach
Of the total 2,454 dwellings in Flagler Beach, owner-occupied units account for 1,915 (78.0%), while renter-occupied units make up 539 (22.0%).
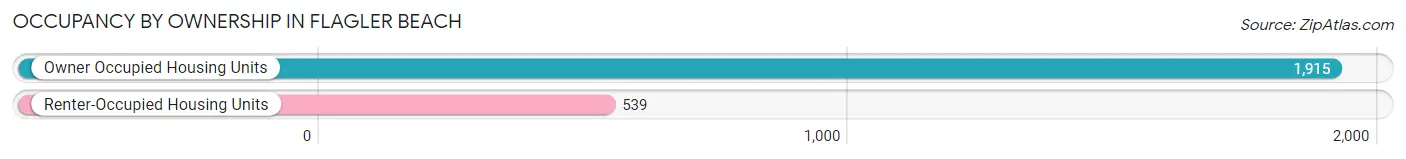
| Occupancy | # Housing Units | % Housing Units |
| Owner Occupied Housing Units | 1,915 | 78.0% |
| Renter-Occupied Housing Units | 539 | 22.0% |
| Total Occupied Housing Units | 2,454 | 100.0% |
Occupancy by Household Size in Flagler Beach
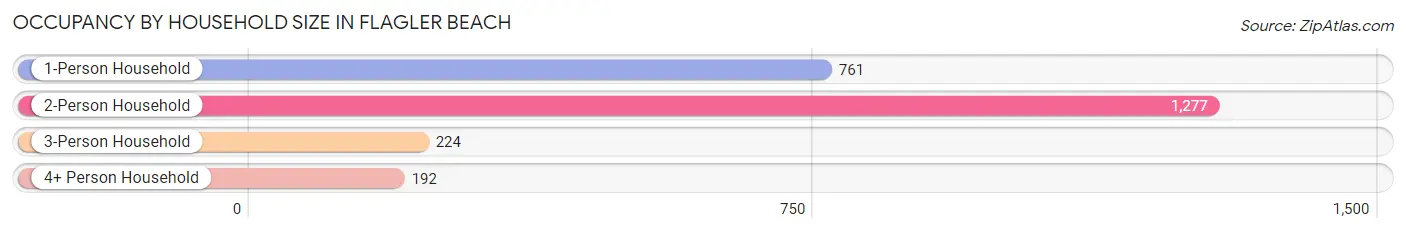
| Household Size | # Housing Units | % Housing Units |
| 1-Person Household | 761 | 31.0% |
| 2-Person Household | 1,277 | 52.0% |
| 3-Person Household | 224 | 9.1% |
| 4+ Person Household | 192 | 7.8% |
| Total Housing Units | 2,454 | 100.0% |
Occupancy by Ownership by Household Size in Flagler Beach
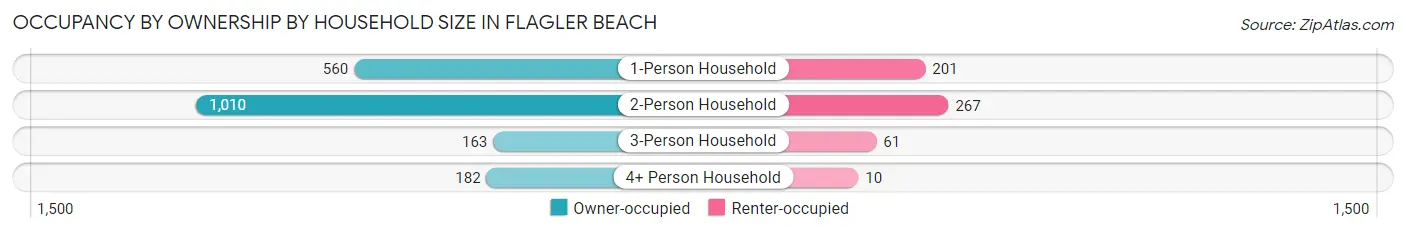
| Household Size | Owner-occupied | Renter-occupied |
| 1-Person Household | 560 (73.6%) | 201 (26.4%) |
| 2-Person Household | 1,010 (79.1%) | 267 (20.9%) |
| 3-Person Household | 163 (72.8%) | 61 (27.2%) |
| 4+ Person Household | 182 (94.8%) | 10 (5.2%) |
| Total Housing Units | 1,915 (78.0%) | 539 (22.0%) |
Occupancy by Educational Attainment in Flagler Beach
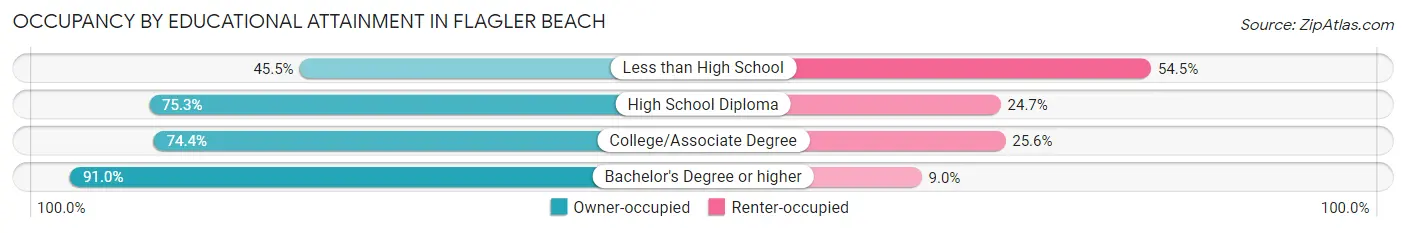
| Household Size | Owner-occupied | Renter-occupied |
| Less than High School | 76 (45.5%) | 91 (54.5%) |
| High School Diploma | 400 (75.3%) | 131 (24.7%) |
| College/Associate Degree | 712 (74.4%) | 245 (25.6%) |
| Bachelor's Degree or higher | 727 (91.0%) | 72 (9.0%) |
Occupancy by Age of Householder in Flagler Beach
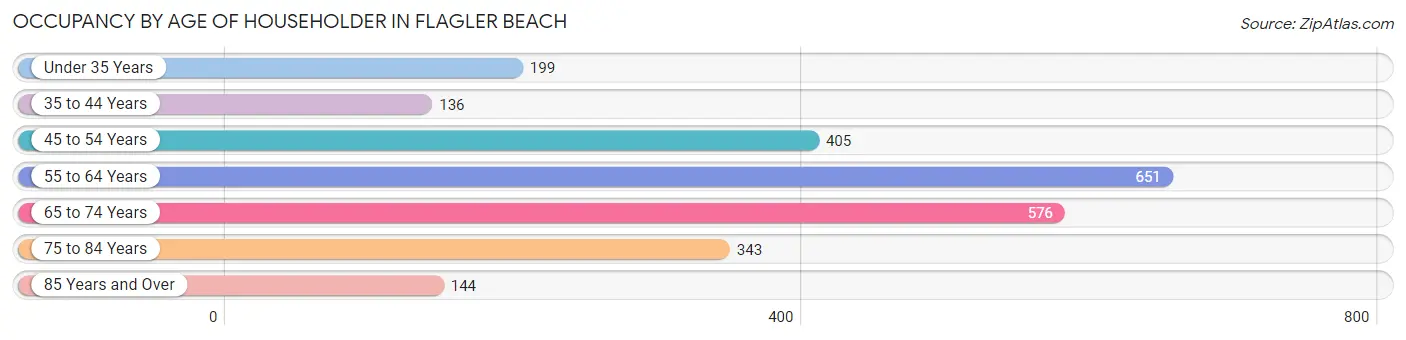
| Age Bracket | # Households | % Households |
| Under 35 Years | 199 | 8.1% |
| 35 to 44 Years | 136 | 5.5% |
| 45 to 54 Years | 405 | 16.5% |
| 55 to 64 Years | 651 | 26.5% |
| 65 to 74 Years | 576 | 23.5% |
| 75 to 84 Years | 343 | 14.0% |
| 85 Years and Over | 144 | 5.9% |
| Total | 2,454 | 100.0% |
Housing Finances in Flagler Beach
Median Income by Occupancy in Flagler Beach
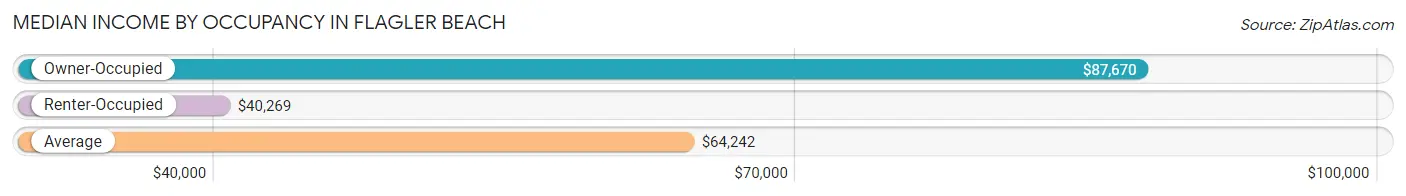
| Occupancy Type | # Households | Median Income |
| Owner-Occupied | 1,915 (78.0%) | $87,670 |
| Renter-Occupied | 539 (22.0%) | $40,269 |
| Average | 2,454 (100.0%) | $64,242 |
Occupancy by Householder Income Bracket in Flagler Beach
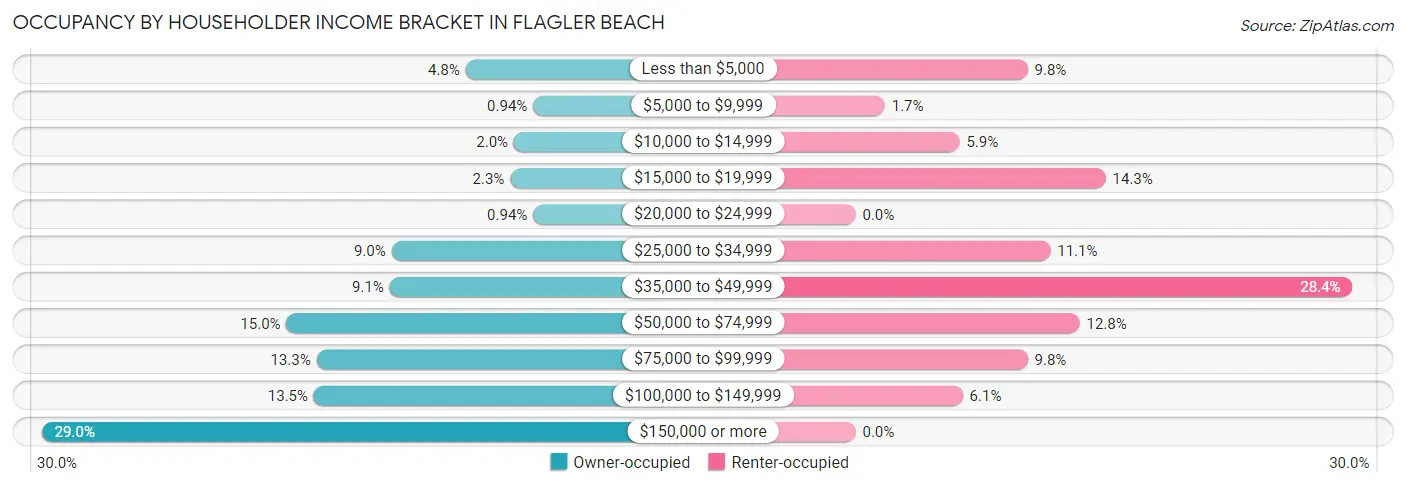
| Income Bracket | Owner-occupied | Renter-occupied |
| Less than $5,000 | 92 (4.8%) | 53 (9.8%) |
| $5,000 to $9,999 | 18 (0.9%) | 9 (1.7%) |
| $10,000 to $14,999 | 39 (2.0%) | 32 (5.9%) |
| $15,000 to $19,999 | 43 (2.2%) | 77 (14.3%) |
| $20,000 to $24,999 | 18 (0.9%) | 0 (0.0%) |
| $25,000 to $34,999 | 173 (9.0%) | 60 (11.1%) |
| $35,000 to $49,999 | 175 (9.1%) | 153 (28.4%) |
| $50,000 to $74,999 | 288 (15.0%) | 69 (12.8%) |
| $75,000 to $99,999 | 255 (13.3%) | 53 (9.8%) |
| $100,000 to $149,999 | 258 (13.5%) | 33 (6.1%) |
| $150,000 or more | 556 (29.0%) | 0 (0.0%) |
| Total | 1,915 (100.0%) | 539 (100.0%) |
Monthly Housing Cost Tiers in Flagler Beach
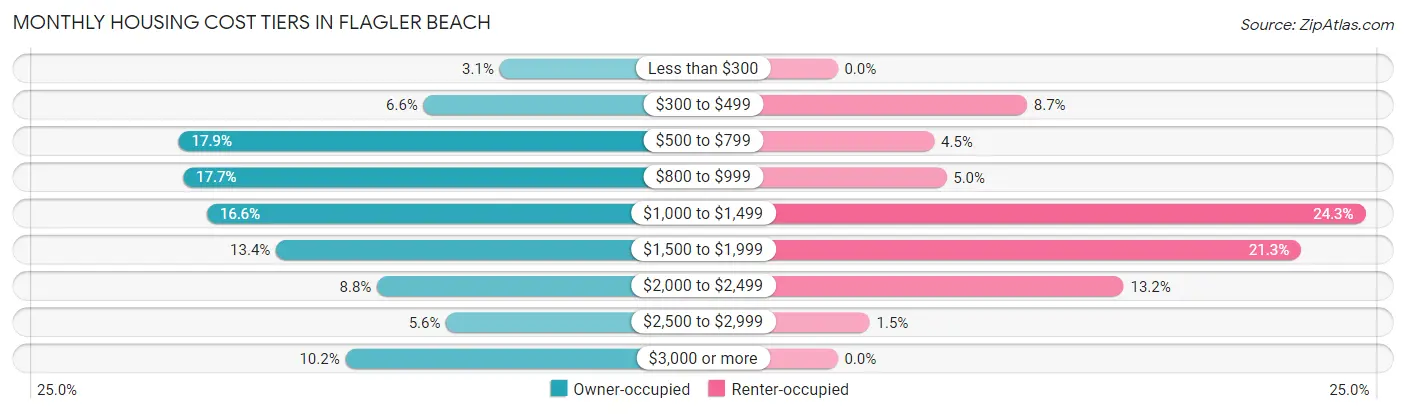
| Monthly Cost | Owner-occupied | Renter-occupied |
| Less than $300 | 60 (3.1%) | 0 (0.0%) |
| $300 to $499 | 127 (6.6%) | 47 (8.7%) |
| $500 to $799 | 343 (17.9%) | 24 (4.4%) |
| $800 to $999 | 339 (17.7%) | 27 (5.0%) |
| $1,000 to $1,499 | 318 (16.6%) | 131 (24.3%) |
| $1,500 to $1,999 | 257 (13.4%) | 115 (21.3%) |
| $2,000 to $2,499 | 168 (8.8%) | 71 (13.2%) |
| $2,500 to $2,999 | 107 (5.6%) | 8 (1.5%) |
| $3,000 or more | 196 (10.2%) | 0 (0.0%) |
| Total | 1,915 (100.0%) | 539 (100.0%) |
Physical Housing Characteristics in Flagler Beach
Housing Structures in Flagler Beach
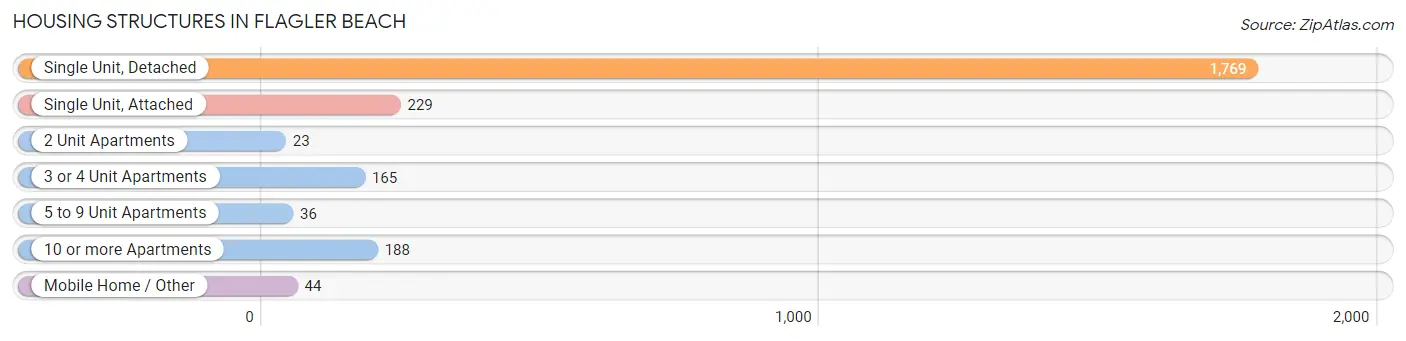
| Structure Type | # Housing Units | % Housing Units |
| Single Unit, Detached | 1,769 | 72.1% |
| Single Unit, Attached | 229 | 9.3% |
| 2 Unit Apartments | 23 | 0.9% |
| 3 or 4 Unit Apartments | 165 | 6.7% |
| 5 to 9 Unit Apartments | 36 | 1.5% |
| 10 or more Apartments | 188 | 7.7% |
| Mobile Home / Other | 44 | 1.8% |
| Total | 2,454 | 100.0% |
Housing Structures by Occupancy in Flagler Beach
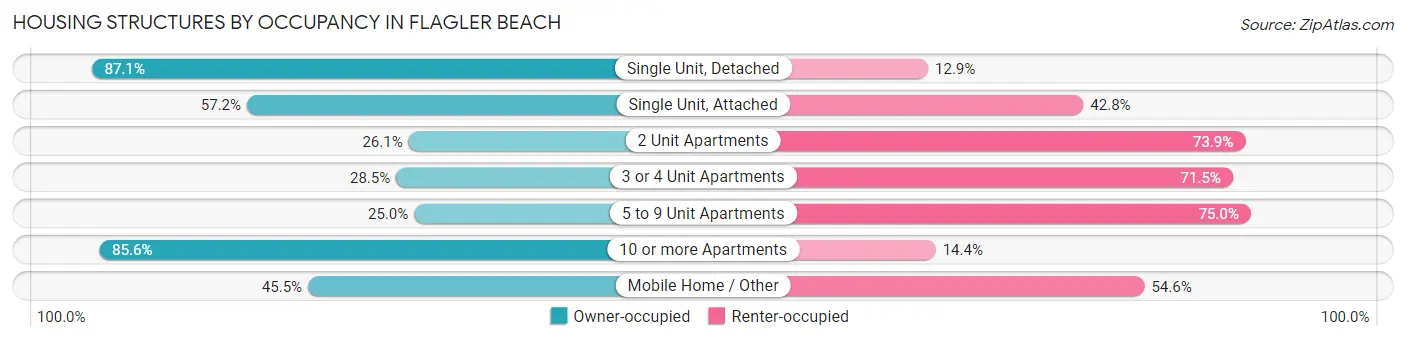
| Structure Type | Owner-occupied | Renter-occupied |
| Single Unit, Detached | 1,541 (87.1%) | 228 (12.9%) |
| Single Unit, Attached | 131 (57.2%) | 98 (42.8%) |
| 2 Unit Apartments | 6 (26.1%) | 17 (73.9%) |
| 3 or 4 Unit Apartments | 47 (28.5%) | 118 (71.5%) |
| 5 to 9 Unit Apartments | 9 (25.0%) | 27 (75.0%) |
| 10 or more Apartments | 161 (85.6%) | 27 (14.4%) |
| Mobile Home / Other | 20 (45.5%) | 24 (54.5%) |
| Total | 1,915 (78.0%) | 539 (22.0%) |
Housing Structures by Number of Rooms in Flagler Beach
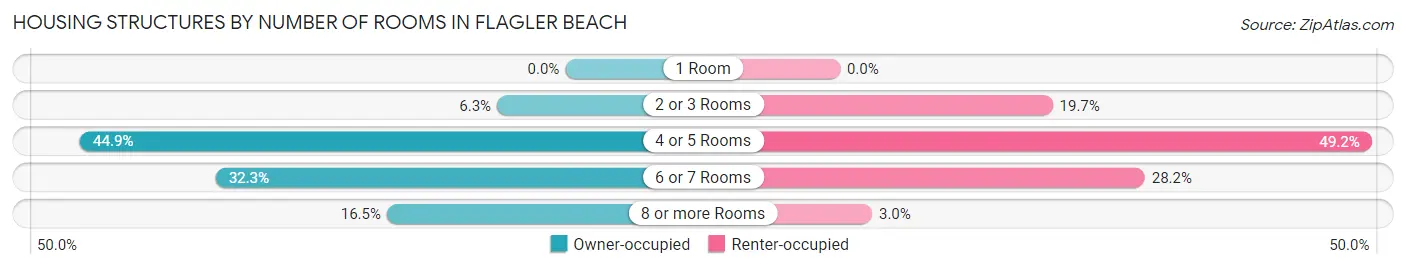
| Number of Rooms | Owner-occupied | Renter-occupied |
| 1 Room | 0 (0.0%) | 0 (0.0%) |
| 2 or 3 Rooms | 121 (6.3%) | 106 (19.7%) |
| 4 or 5 Rooms | 859 (44.9%) | 265 (49.2%) |
| 6 or 7 Rooms | 619 (32.3%) | 152 (28.2%) |
| 8 or more Rooms | 316 (16.5%) | 16 (3.0%) |
| Total | 1,915 (100.0%) | 539 (100.0%) |
Housing Structure by Heating Type in Flagler Beach
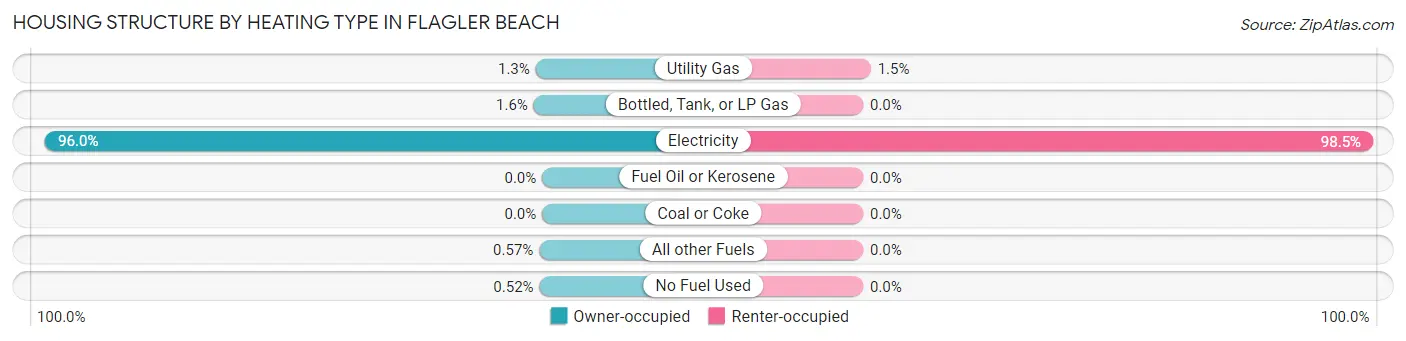
| Heating Type | Owner-occupied | Renter-occupied |
| Utility Gas | 24 (1.3%) | 8 (1.5%) |
| Bottled, Tank, or LP Gas | 31 (1.6%) | 0 (0.0%) |
| Electricity | 1,839 (96.0%) | 531 (98.5%) |
| Fuel Oil or Kerosene | 0 (0.0%) | 0 (0.0%) |
| Coal or Coke | 0 (0.0%) | 0 (0.0%) |
| All other Fuels | 11 (0.6%) | 0 (0.0%) |
| No Fuel Used | 10 (0.5%) | 0 (0.0%) |
| Total | 1,915 (100.0%) | 539 (100.0%) |
Household Vehicle Usage in Flagler Beach
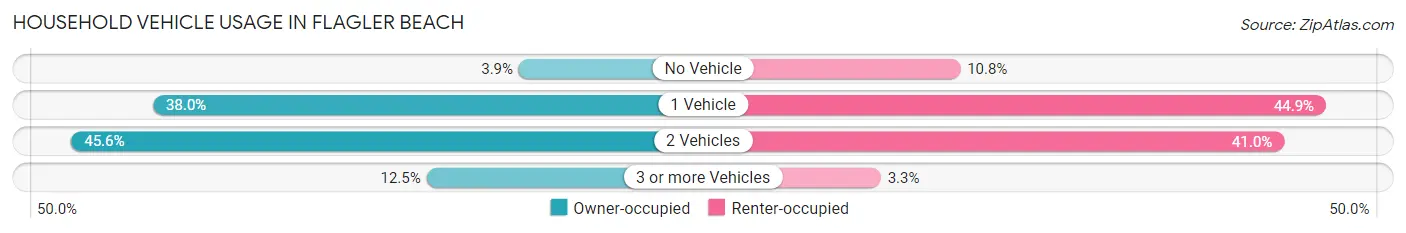
| Vehicles per Household | Owner-occupied | Renter-occupied |
| No Vehicle | 74 (3.9%) | 58 (10.8%) |
| 1 Vehicle | 728 (38.0%) | 242 (44.9%) |
| 2 Vehicles | 874 (45.6%) | 221 (41.0%) |
| 3 or more Vehicles | 239 (12.5%) | 18 (3.3%) |
| Total | 1,915 (100.0%) | 539 (100.0%) |
Real Estate & Mortgages in Flagler Beach
Real Estate and Mortgage Overview in Flagler Beach
| Characteristic | Without Mortgage | With Mortgage |
| Housing Units | 900 | 1,015 |
| Median Property Value | $410,500 | $483,200 |
| Median Household Income | $74,688 | $280 |
| Monthly Housing Costs | $753 | $196 |
| Real Estate Taxes | $3,375 | $10 |
Property Value by Mortgage Status in Flagler Beach
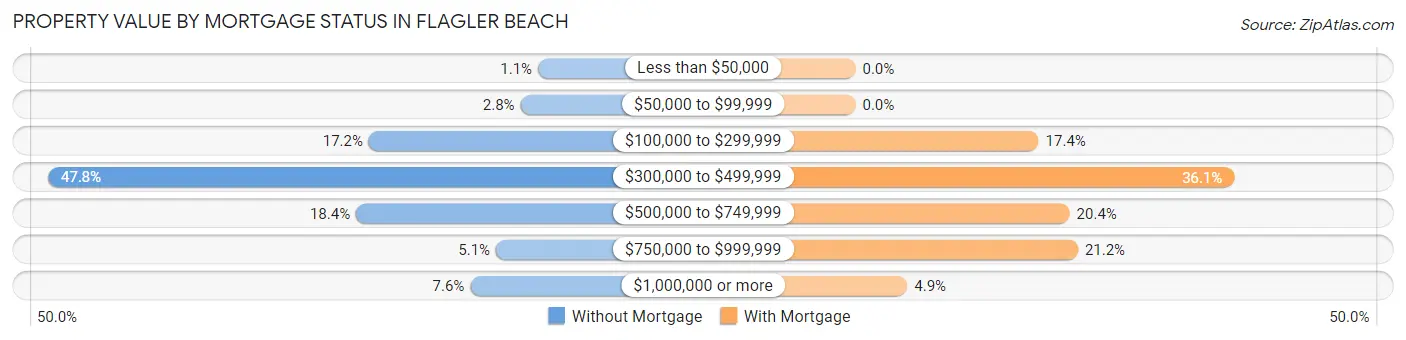
| Property Value | Without Mortgage | With Mortgage |
| Less than $50,000 | 10 (1.1%) | 0 (0.0%) |
| $50,000 to $99,999 | 25 (2.8%) | 0 (0.0%) |
| $100,000 to $299,999 | 155 (17.2%) | 177 (17.4%) |
| $300,000 to $499,999 | 430 (47.8%) | 366 (36.1%) |
| $500,000 to $749,999 | 166 (18.4%) | 207 (20.4%) |
| $750,000 to $999,999 | 46 (5.1%) | 215 (21.2%) |
| $1,000,000 or more | 68 (7.6%) | 50 (4.9%) |
| Total | 900 (100.0%) | 1,015 (100.0%) |
Household Income by Mortgage Status in Flagler Beach
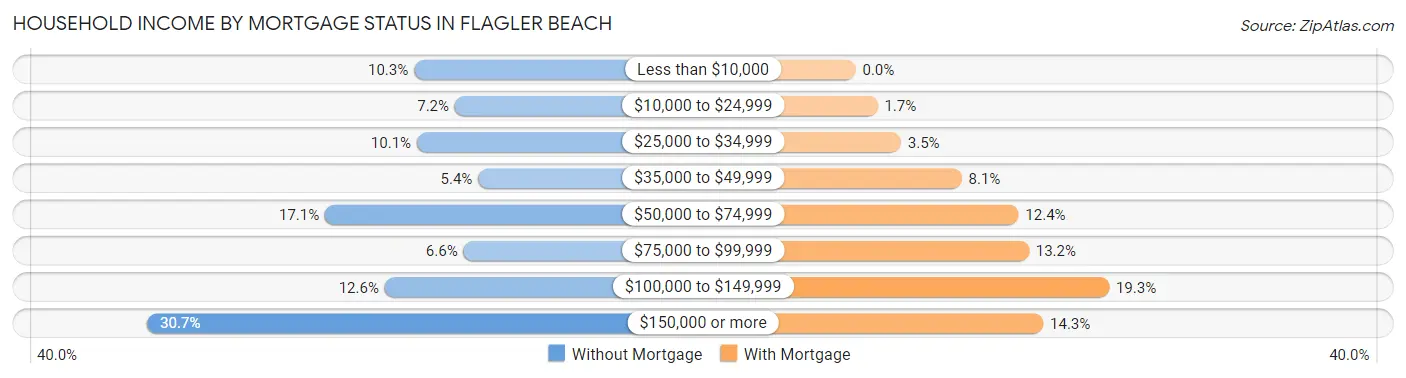
| Household Income | Without Mortgage | With Mortgage |
| Less than $10,000 | 93 (10.3%) | 0 (0.0%) |
| $10,000 to $24,999 | 65 (7.2%) | 17 (1.7%) |
| $25,000 to $34,999 | 91 (10.1%) | 35 (3.5%) |
| $35,000 to $49,999 | 49 (5.4%) | 82 (8.1%) |
| $50,000 to $74,999 | 154 (17.1%) | 126 (12.4%) |
| $75,000 to $99,999 | 59 (6.6%) | 134 (13.2%) |
| $100,000 to $149,999 | 113 (12.6%) | 196 (19.3%) |
| $150,000 or more | 276 (30.7%) | 145 (14.3%) |
| Total | 900 (100.0%) | 1,015 (100.0%) |
Property Value to Household Income Ratio in Flagler Beach
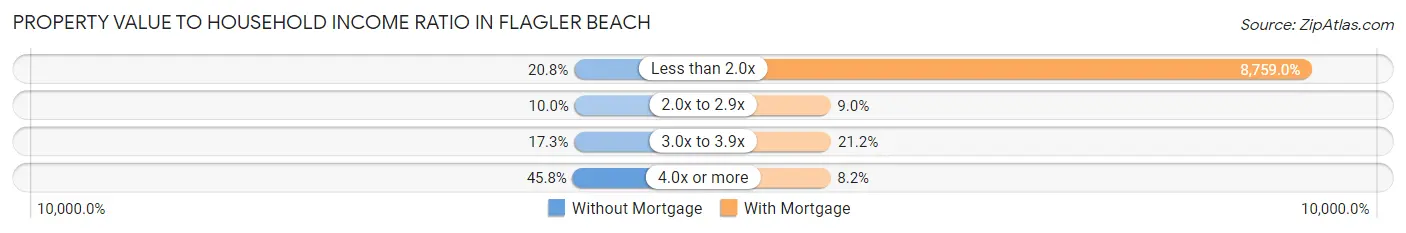
| Value-to-Income Ratio | Without Mortgage | With Mortgage |
| Less than 2.0x | 187 (20.8%) | 88,904 (8,759.0%) |
| 2.0x to 2.9x | 90 (10.0%) | 91 (9.0%) |
| 3.0x to 3.9x | 156 (17.3%) | 215 (21.2%) |
| 4.0x or more | 412 (45.8%) | 83 (8.2%) |
| Total | 900 (100.0%) | 1,015 (100.0%) |
Real Estate Taxes by Mortgage Status in Flagler Beach
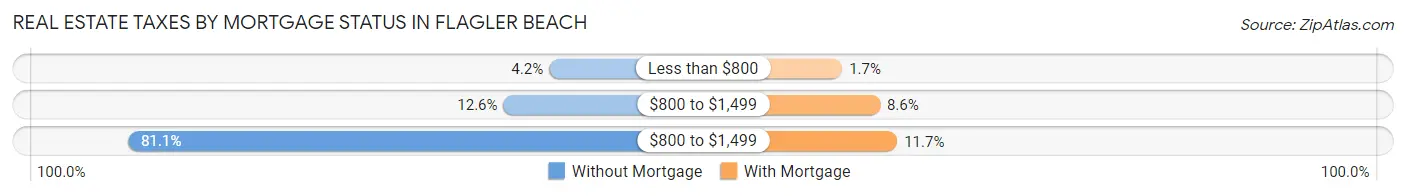
| Property Taxes | Without Mortgage | With Mortgage |
| Less than $800 | 38 (4.2%) | 17 (1.7%) |
| $800 to $1,499 | 113 (12.6%) | 87 (8.6%) |
| $800 to $1,499 | 730 (81.1%) | 119 (11.7%) |
| Total | 900 (100.0%) | 1,015 (100.0%) |
Health & Disability in Flagler Beach
Health Insurance Coverage by Age in Flagler Beach
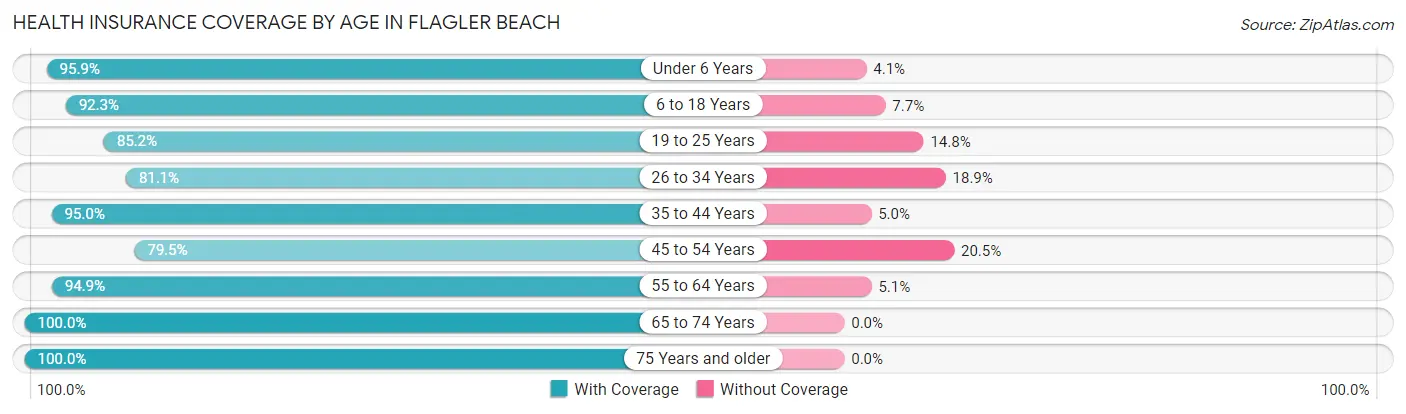
| Age Bracket | With Coverage | Without Coverage |
| Under 6 Years | 210 (95.9%) | 9 (4.1%) |
| 6 to 18 Years | 397 (92.3%) | 33 (7.7%) |
| 19 to 25 Years | 150 (85.2%) | 26 (14.8%) |
| 26 to 34 Years | 249 (81.1%) | 58 (18.9%) |
| 35 to 44 Years | 303 (95.0%) | 16 (5.0%) |
| 45 to 54 Years | 583 (79.5%) | 150 (20.5%) |
| 55 to 64 Years | 1,198 (94.9%) | 64 (5.1%) |
| 65 to 74 Years | 890 (100.0%) | 0 (0.0%) |
| 75 Years and older | 764 (100.0%) | 0 (0.0%) |
| Total | 4,744 (93.0%) | 356 (7.0%) |
Health Insurance Coverage by Citizenship Status in Flagler Beach
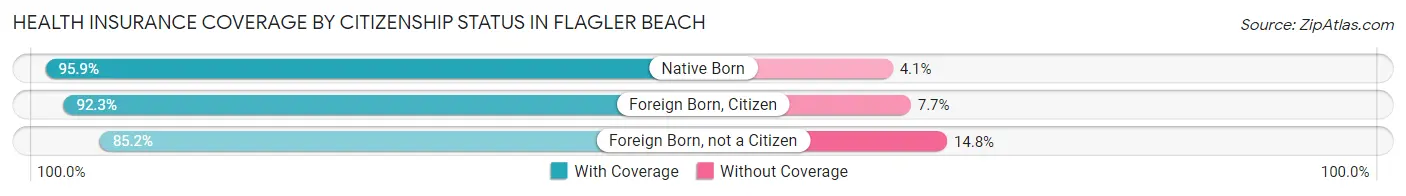
| Citizenship Status | With Coverage | Without Coverage |
| Native Born | 210 (95.9%) | 9 (4.1%) |
| Foreign Born, Citizen | 397 (92.3%) | 33 (7.7%) |
| Foreign Born, not a Citizen | 150 (85.2%) | 26 (14.8%) |
Health Insurance Coverage by Household Income in Flagler Beach
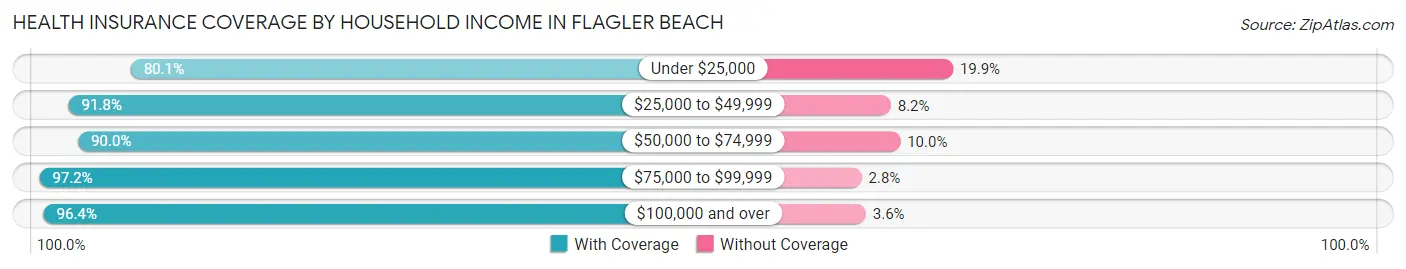
| Household Income | With Coverage | Without Coverage |
| Under $25,000 | 451 (80.1%) | 112 (19.9%) |
| $25,000 to $49,999 | 846 (91.8%) | 76 (8.2%) |
| $50,000 to $74,999 | 629 (90.0%) | 70 (10.0%) |
| $75,000 to $99,999 | 736 (97.2%) | 21 (2.8%) |
| $100,000 and over | 2,082 (96.4%) | 77 (3.6%) |
Public vs Private Health Insurance Coverage by Age in Flagler Beach
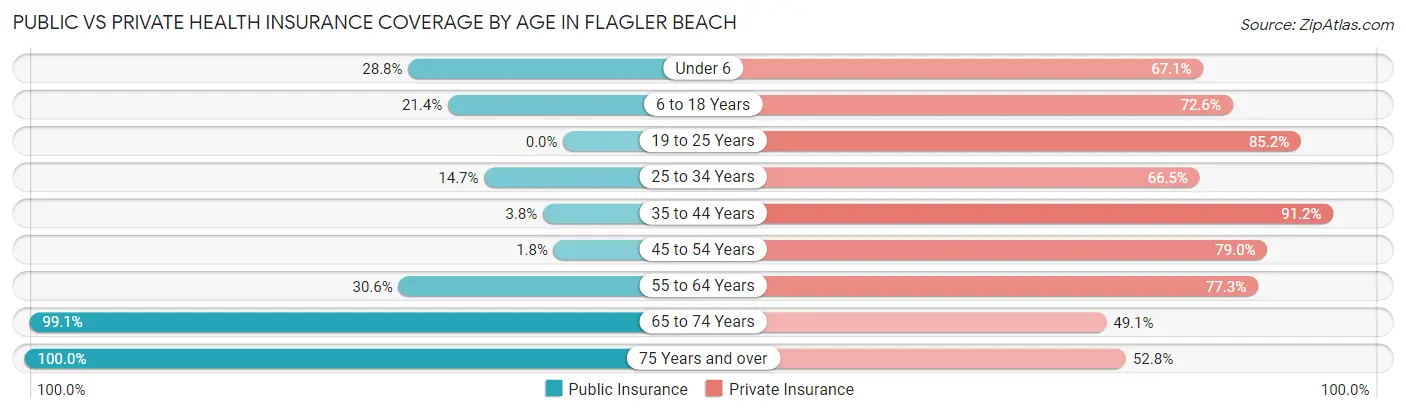
| Age Bracket | Public Insurance | Private Insurance |
| Under 6 | 63 (28.8%) | 147 (67.1%) |
| 6 to 18 Years | 92 (21.4%) | 312 (72.6%) |
| 19 to 25 Years | 0 (0.0%) | 150 (85.2%) |
| 25 to 34 Years | 45 (14.7%) | 204 (66.4%) |
| 35 to 44 Years | 12 (3.8%) | 291 (91.2%) |
| 45 to 54 Years | 13 (1.8%) | 579 (79.0%) |
| 55 to 64 Years | 386 (30.6%) | 975 (77.3%) |
| 65 to 74 Years | 882 (99.1%) | 437 (49.1%) |
| 75 Years and over | 764 (100.0%) | 403 (52.7%) |
| Total | 2,257 (44.3%) | 3,498 (68.6%) |
Disability Status by Sex by Age in Flagler Beach
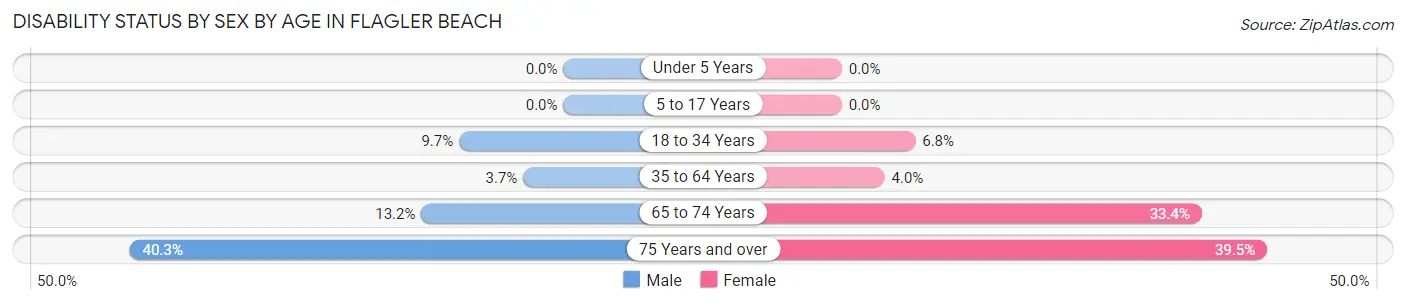
| Age Bracket | Male | Female |
| Under 5 Years | 0 (0.0%) | 0 (0.0%) |
| 5 to 17 Years | 0 (0.0%) | 0 (0.0%) |
| 18 to 34 Years | 21 (9.7%) | 24 (6.8%) |
| 35 to 64 Years | 46 (3.7%) | 43 (4.0%) |
| 65 to 74 Years | 51 (13.2%) | 168 (33.4%) |
| 75 Years and over | 124 (40.3%) | 180 (39.5%) |
Disability Class by Sex by Age in Flagler Beach
Disability Class: Hearing Difficulty
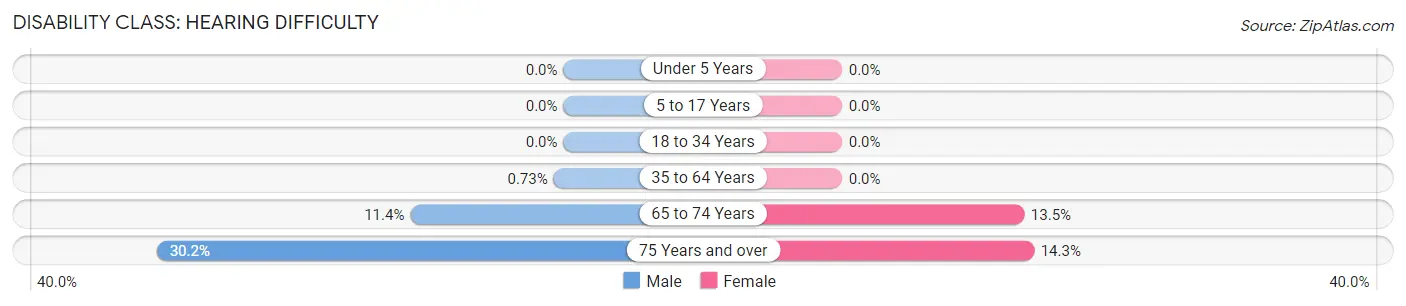
| Age Bracket | Male | Female |
| Under 5 Years | 0 (0.0%) | 0 (0.0%) |
| 5 to 17 Years | 0 (0.0%) | 0 (0.0%) |
| 18 to 34 Years | 0 (0.0%) | 0 (0.0%) |
| 35 to 64 Years | 9 (0.7%) | 0 (0.0%) |
| 65 to 74 Years | 44 (11.4%) | 68 (13.5%) |
| 75 Years and over | 93 (30.2%) | 65 (14.2%) |
Disability Class: Vision Difficulty
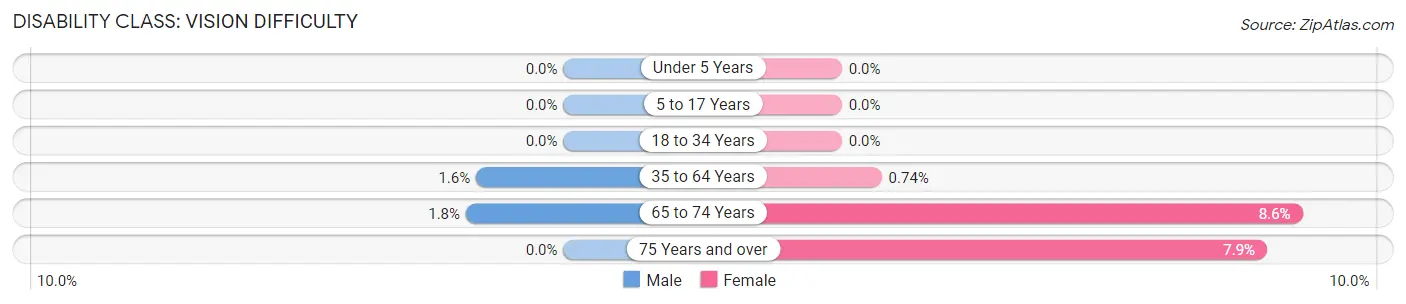
| Age Bracket | Male | Female |
| Under 5 Years | 0 (0.0%) | 0 (0.0%) |
| 5 to 17 Years | 0 (0.0%) | 0 (0.0%) |
| 18 to 34 Years | 0 (0.0%) | 0 (0.0%) |
| 35 to 64 Years | 20 (1.6%) | 8 (0.7%) |
| 65 to 74 Years | 7 (1.8%) | 43 (8.6%) |
| 75 Years and over | 0 (0.0%) | 36 (7.9%) |
Disability Class: Cognitive Difficulty
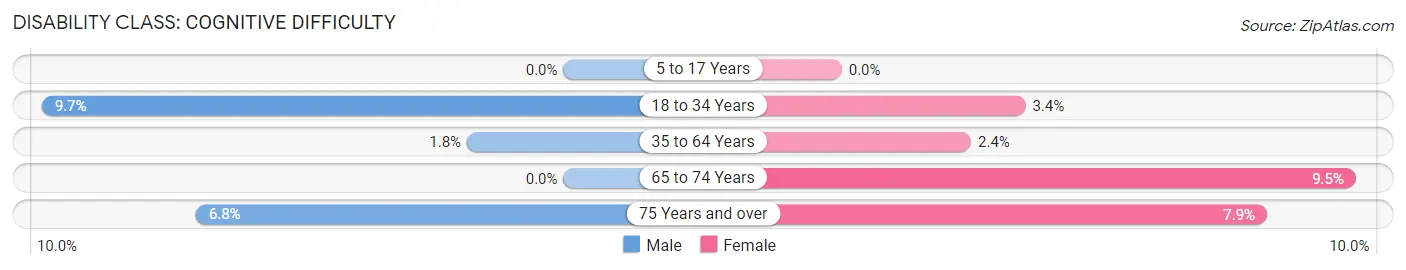
| Age Bracket | Male | Female |
| 5 to 17 Years | 0 (0.0%) | 0 (0.0%) |
| 18 to 34 Years | 21 (9.7%) | 12 (3.4%) |
| 35 to 64 Years | 22 (1.8%) | 26 (2.4%) |
| 65 to 74 Years | 0 (0.0%) | 48 (9.5%) |
| 75 Years and over | 21 (6.8%) | 36 (7.9%) |
Disability Class: Ambulatory Difficulty
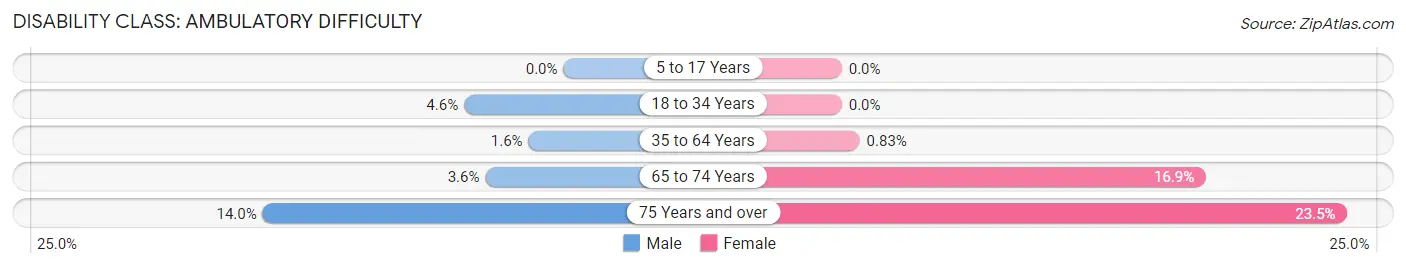
| Age Bracket | Male | Female |
| 5 to 17 Years | 0 (0.0%) | 0 (0.0%) |
| 18 to 34 Years | 10 (4.6%) | 0 (0.0%) |
| 35 to 64 Years | 20 (1.6%) | 9 (0.8%) |
| 65 to 74 Years | 14 (3.6%) | 85 (16.9%) |
| 75 Years and over | 43 (14.0%) | 107 (23.5%) |
Disability Class: Self-Care Difficulty
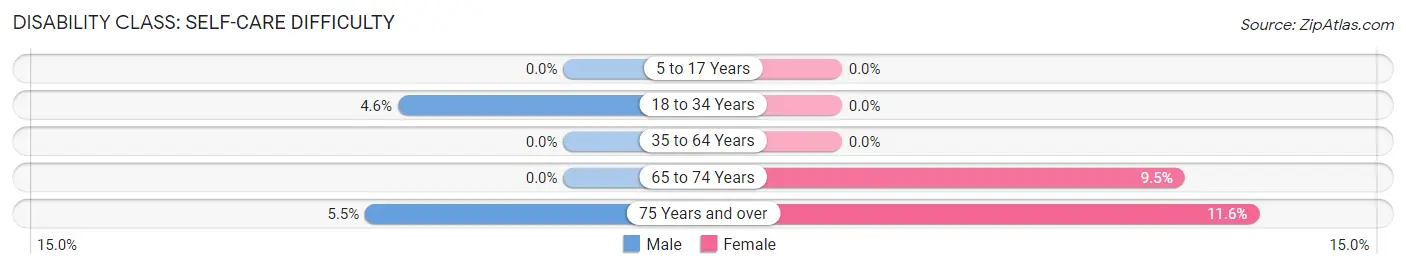
| Age Bracket | Male | Female |
| 5 to 17 Years | 0 (0.0%) | 0 (0.0%) |
| 18 to 34 Years | 10 (4.6%) | 0 (0.0%) |
| 35 to 64 Years | 0 (0.0%) | 0 (0.0%) |
| 65 to 74 Years | 0 (0.0%) | 48 (9.5%) |
| 75 Years and over | 17 (5.5%) | 53 (11.6%) |
Technology Access in Flagler Beach
Computing Device Access in Flagler Beach
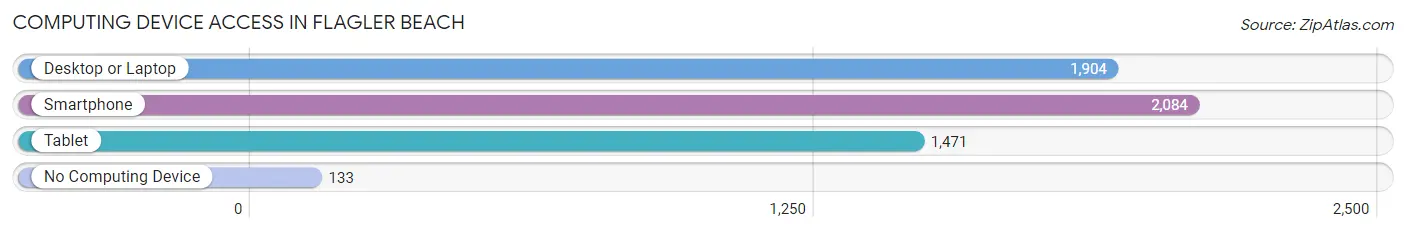
| Device Type | # Households | % Households |
| Desktop or Laptop | 1,904 | 77.6% |
| Smartphone | 2,084 | 84.9% |
| Tablet | 1,471 | 59.9% |
| No Computing Device | 133 | 5.4% |
| Total | 2,454 | 100.0% |
Internet Access in Flagler Beach
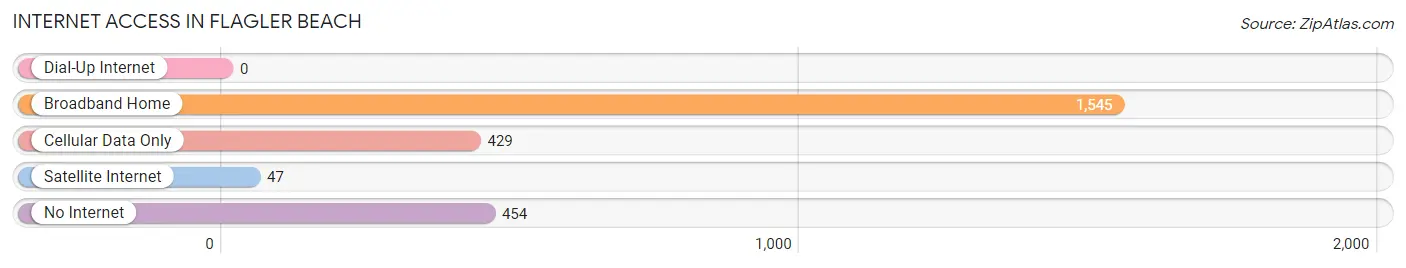
| Internet Type | # Households | % Households |
| Dial-Up Internet | 0 | 0.0% |
| Broadband Home | 1,545 | 63.0% |
| Cellular Data Only | 429 | 17.5% |
| Satellite Internet | 47 | 1.9% |
| No Internet | 454 | 18.5% |
| Total | 2,454 | 100.0% |
Flagler Beach Summary
Flagler Beach is a small city located in Flagler County, Florida, United States. It is situated on the Atlantic Ocean, just south of St. Augustine and north of Daytona Beach. The city has a population of 4,484 as of the 2010 census.
History
Flagler Beach was originally known as Ocean City, and was founded in 1925 by a group of investors from Ohio. The city was incorporated in 1949, and the name was changed to Flagler Beach in honor of Henry Flagler, a railroad magnate who had a major influence on the development of Florida.
Flagler Beach has a long history of tourism, and was a popular destination for beachgoers in the 1950s and 1960s. The city was also home to a number of popular restaurants and bars, including the famous Flagler Beach Pier.
Geography
Flagler Beach is located in the northeast corner of Flagler County, on the Atlantic Ocean. The city is bordered by the cities of Palm Coast to the north, Bunnell to the west, and Ormond Beach to the south. The city covers an area of 4.2 square miles, and has a population density of 1,072 people per square mile.
The city is located on a barrier island, and is surrounded by the Intracoastal Waterway to the west and the Atlantic Ocean to the east. The city is home to a number of beaches, including Flagler Beach, Beverly Beach, and Gamble Rogers State Park.
Economy
Flagler Beach is a popular tourist destination, and the city’s economy is largely based on tourism. The city is home to a number of hotels, restaurants, and other businesses that cater to tourists. The city is also home to a number of small businesses, including retail stores, professional services, and other businesses.
The city is also home to a number of manufacturing and industrial businesses, including a paper mill and a seafood processing plant. The city is also home to a number of government offices, including the Flagler County Courthouse and the Flagler Beach Police Department.
Demographics
As of the 2010 census, Flagler Beach had a population of 4,484. The racial makeup of the city was 94.3% White, 2.2% African American, 0.4% Native American, 0.7% Asian, 0.1% Pacific Islander, 0.9% from other races, and 1.4% from two or more races. Hispanic or Latino of any race were 4.2% of the population.
The median income for a household in the city was $41,944, and the median income for a family was $50,917. The per capita income for the city was $25,945. About 11.2% of families and 14.2% of the population were below the poverty line, including 22.2% of those under age 18 and 8.2% of those age 65 or over.
Flagler Beach is a small city with a rich history and a vibrant economy. The city is home to a number of businesses, and is a popular tourist destination. The city has a diverse population, and is a great place to live and work.
Common Questions
What is the Total Population of Flagler Beach?
Total Population of Flagler Beach is 5,100.
What is the Total Male Population of Flagler Beach?
Total Male Population of Flagler Beach is 2,384.
What is the Total Female Population of Flagler Beach?
Total Female Population of Flagler Beach is 2,716.
What is the Ratio of Males per 100 Females in Flagler Beach?
There are 87.78 Males per 100 Females in Flagler Beach.
What is the Ratio of Females per 100 Males in Flagler Beach?
There are 113.93 Females per 100 Males in Flagler Beach.
What is the Median Population Age in Flagler Beach?
Median Population Age in Flagler Beach is 58.0 Years.
What is the Average Family Size in Flagler Beach
Average Family Size in Flagler Beach is 2.5 People.
What is the Average Household Size in Flagler Beach
Average Household Size in Flagler Beach is 2.1 People.
What is Per Capita Income in Flagler Beach?
Per Capita income in Flagler Beach is $50,733.
What is the Median Family Income in Flagler Beach?
Median Family Income in Flagler Beach is $86,974.
What is the Median Household income in Flagler Beach?
Median Household Income in Flagler Beach is $64,242.
What is Income or Wage Gap in Flagler Beach?
Income or Wage Gap in Flagler Beach is 29.9%.
Women in Flagler Beach earn 70.1 cents for every dollar earned by a man.
What is Inequality or Gini Index in Flagler Beach?
Inequality or Gini Index in Flagler Beach is 0.50.
How Large is the Labor Force in Flagler Beach?
There are 1,870 People in the Labor Forcein in Flagler Beach.
What is the Percentage of People in the Labor Force in Flagler Beach?
40.4% of People are in the Labor Force in Flagler Beach.
What is the Unemployment Rate in Flagler Beach?
Unemployment Rate in Flagler Beach is 2.3%.