Elfers, FL
Elfers Map
Elfers Overview
13,296
TOTAL POPULATION
6,408
MALE POPULATION
6,888
FEMALE POPULATION
93.03
MALES / 100 FEMALES
107.49
FEMALES / 100 MALES
40.9
MEDIAN AGE
3.1
AVG FAMILY SIZE
2.4
AVG HOUSEHOLD SIZE
$25,618
PER CAPITA INCOME
$57,623
AVG FAMILY INCOME
$50,467
AVG HOUSEHOLD INCOME
25.1%
WAGE / INCOME GAP [ % ]
74.9¢/ $1
WAGE / INCOME GAP [ $ ]
$8,863
FAMILY INCOME DEFICIT
0.36
INEQUALITY / GINI INDEX
6,478
LABOR FORCE [ PEOPLE ]
58.9%
PERCENT IN LABOR FORCE
4.2%
UNEMPLOYMENT RATE
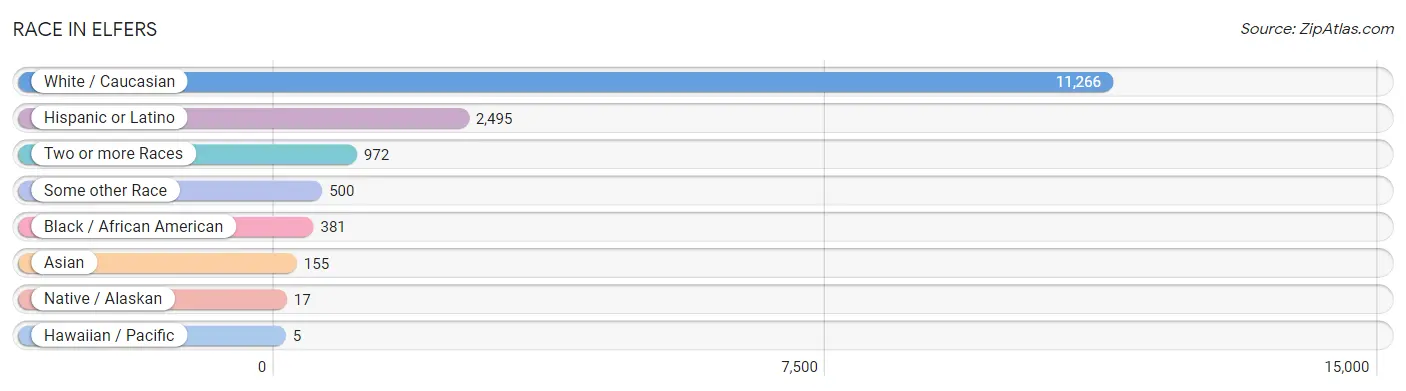
Race in Elfers
The most populous races in Elfers are White / Caucasian (11,266 | 84.7%), Hispanic or Latino (2,495 | 18.8%), and Two or more Races (972 | 7.3%).
| Race | # Population | % Population |
| Asian | 155 | 1.2% |
| Black / African American | 381 | 2.9% |
| Hawaiian / Pacific | 5 | 0.0% |
| Hispanic or Latino | 2,495 | 18.8% |
| Native / Alaskan | 17 | 0.1% |
| White / Caucasian | 11,266 | 84.7% |
| Two or more Races | 972 | 7.3% |
| Some other Race | 500 | 3.8% |
| Total | 13,296 | 100.0% |
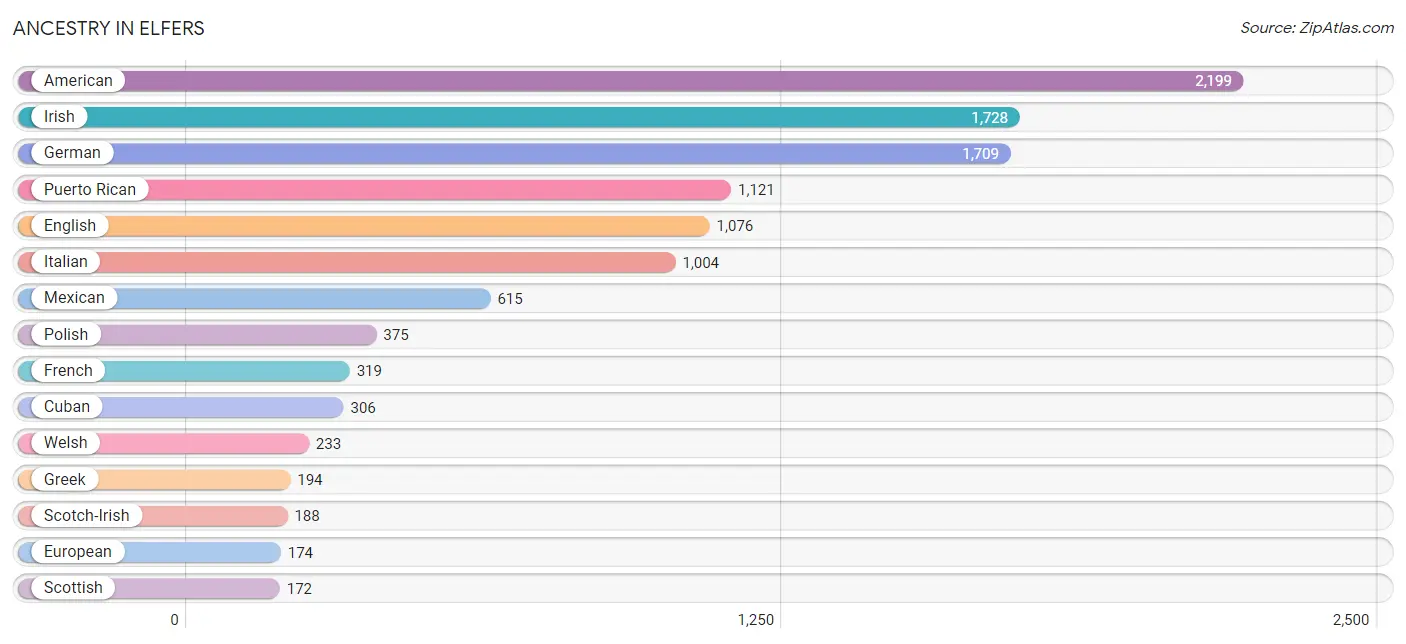
Ancestry in Elfers
The most populous ancestries reported in Elfers are American (2,199 | 16.5%), Irish (1,728 | 13.0%), German (1,709 | 12.9%), Puerto Rican (1,121 | 8.4%), and English (1,076 | 8.1%), together accounting for 58.9% of all Elfers residents.
| Ancestry | # Population | % Population |
| African | 102 | 0.8% |
| Alaska Native | 6 | 0.1% |
| Albanian | 67 | 0.5% |
| American | 2,199 | 16.5% |
| Arab | 19 | 0.1% |
| Austrian | 18 | 0.1% |
| Bhutanese | 4 | 0.0% |
| British | 36 | 0.3% |
| Burmese | 6 | 0.1% |
| Canadian | 53 | 0.4% |
| Central American | 95 | 0.7% |
| Colombian | 163 | 1.2% |
| Costa Rican | 35 | 0.3% |
| Creek | 5 | 0.0% |
| Croatian | 16 | 0.1% |
| Cuban | 306 | 2.3% |
| Czech | 18 | 0.1% |
| Danish | 34 | 0.3% |
| Dominican | 128 | 1.0% |
| Dutch | 60 | 0.4% |
| Eastern European | 53 | 0.4% |
| English | 1,076 | 8.1% |
| European | 174 | 1.3% |
| Finnish | 117 | 0.9% |
| French | 319 | 2.4% |
| French Canadian | 95 | 0.7% |
| German | 1,709 | 12.9% |
| Greek | 194 | 1.5% |
| Guamanian / Chamorro | 2 | 0.0% |
| Guatemalan | 30 | 0.2% |
| Haitian | 10 | 0.1% |
| Honduran | 28 | 0.2% |
| Hungarian | 36 | 0.3% |
| Indian (Asian) | 63 | 0.5% |
| Irish | 1,728 | 13.0% |
| Italian | 1,004 | 7.5% |
| Jamaican | 58 | 0.4% |
| Korean | 89 | 0.7% |
| Lebanese | 19 | 0.1% |
| Lithuanian | 11 | 0.1% |
| Macedonian | 8 | 0.1% |
| Mexican | 615 | 4.6% |
| Native Hawaiian | 5 | 0.0% |
| Nicaraguan | 2 | 0.0% |
| Norwegian | 36 | 0.3% |
| Pakistani | 41 | 0.3% |
| Polish | 375 | 2.8% |
| Portuguese | 102 | 0.8% |
| Puerto Rican | 1,121 | 8.4% |
| Romanian | 22 | 0.2% |
| Russian | 49 | 0.4% |
| Scandinavian | 11 | 0.1% |
| Scotch-Irish | 188 | 1.4% |
| Scottish | 172 | 1.3% |
| Seminole | 6 | 0.1% |
| Slavic | 4 | 0.0% |
| Slovak | 16 | 0.1% |
| South American | 172 | 1.3% |
| Spaniard | 19 | 0.1% |
| Subsaharan African | 102 | 0.8% |
| Swedish | 75 | 0.6% |
| Swiss | 14 | 0.1% |
| Ukrainian | 10 | 0.1% |
| Uruguayan | 9 | 0.1% |
| Welsh | 233 | 1.8% |
| Yugoslavian | 108 | 0.8% | View All 66 Rows |
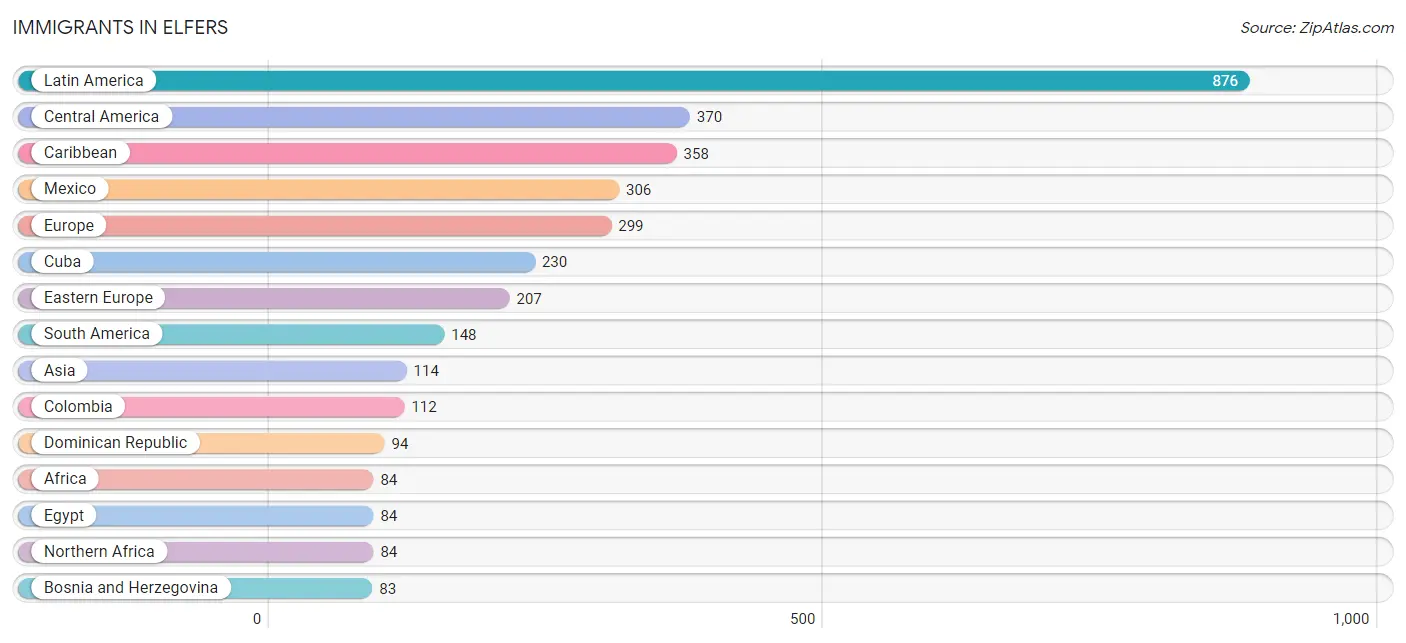
Immigrants in Elfers
The most numerous immigrant groups reported in Elfers came from Latin America (876 | 6.6%), Central America (370 | 2.8%), Caribbean (358 | 2.7%), Mexico (306 | 2.3%), and Europe (299 | 2.2%), together accounting for 16.6% of all Elfers residents.
| Immigration Origin | # Population | % Population |
| Africa | 84 | 0.6% |
| Albania | 12 | 0.1% |
| Argentina | 6 | 0.1% |
| Asia | 114 | 0.9% |
| Belarus | 36 | 0.3% |
| Bosnia and Herzegovina | 83 | 0.6% |
| Brazil | 11 | 0.1% |
| Canada | 64 | 0.5% |
| Caribbean | 358 | 2.7% |
| Central America | 370 | 2.8% |
| China | 63 | 0.5% |
| Colombia | 112 | 0.8% |
| Costa Rica | 32 | 0.2% |
| Croatia | 19 | 0.1% |
| Cuba | 230 | 1.7% |
| Dominican Republic | 94 | 0.7% |
| Eastern Asia | 69 | 0.5% |
| Eastern Europe | 207 | 1.6% |
| Egypt | 84 | 0.6% |
| Europe | 299 | 2.2% |
| Germany | 8 | 0.1% |
| Greece | 45 | 0.3% |
| Guatemala | 30 | 0.2% |
| Ireland | 24 | 0.2% |
| Jamaica | 34 | 0.3% |
| Korea | 6 | 0.1% |
| Latin America | 876 | 6.6% |
| Mexico | 306 | 2.3% |
| Nicaragua | 2 | 0.0% |
| Northern Africa | 84 | 0.6% |
| Northern Europe | 31 | 0.2% |
| Philippines | 25 | 0.2% |
| Poland | 8 | 0.1% |
| Portugal | 8 | 0.1% |
| Russia | 16 | 0.1% |
| South America | 148 | 1.1% |
| South Eastern Asia | 45 | 0.3% |
| Southern Europe | 53 | 0.4% |
| Thailand | 20 | 0.2% |
| Ukraine | 8 | 0.1% |
| Uruguay | 19 | 0.1% |
| Western Europe | 8 | 0.1% | View All 42 Rows |
Sex and Age in Elfers
Sex and Age in Elfers
The most populous age groups in Elfers are 35 to 39 Years (728 | 11.4%) for men and 35 to 39 Years (594 | 8.6%) for women.
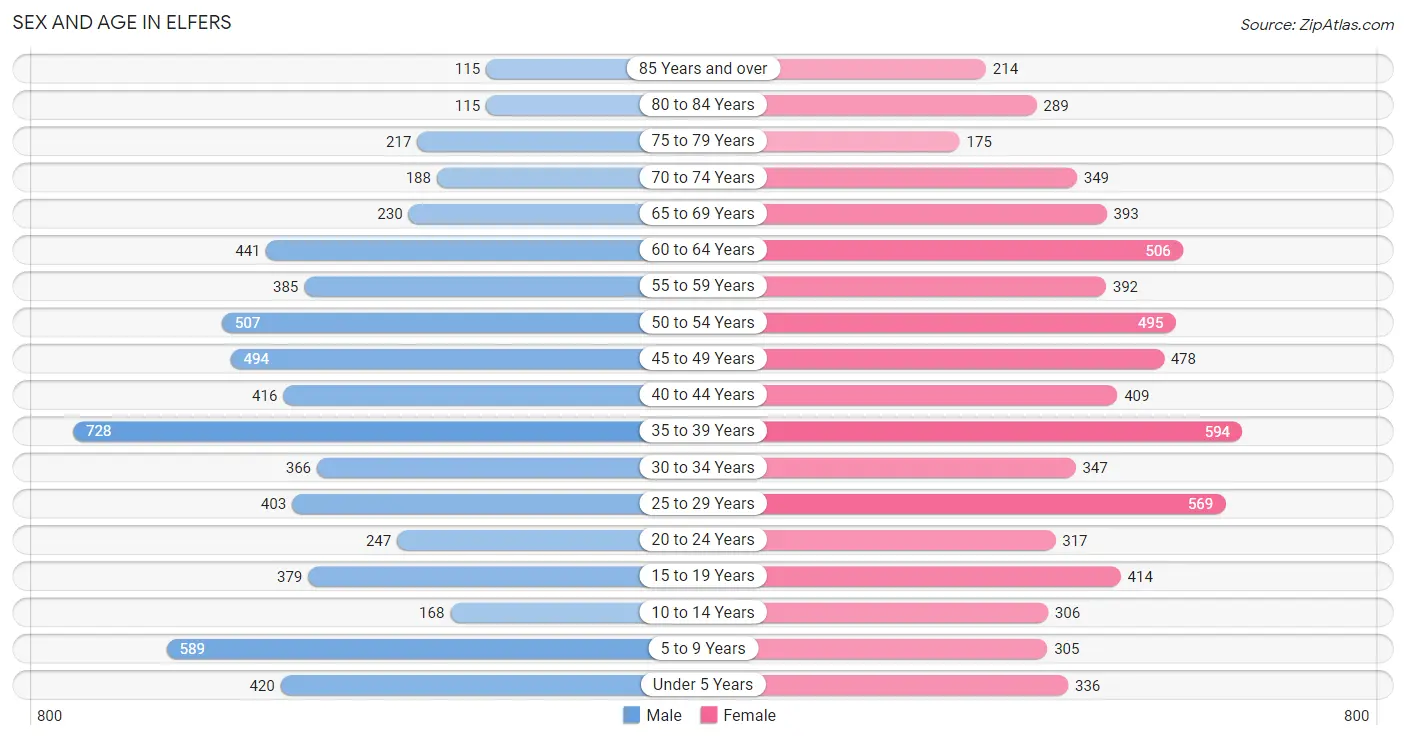
| Age Bracket | Male | Female |
| Under 5 Years | 420 (6.6%) | 336 (4.9%) |
| 5 to 9 Years | 589 (9.2%) | 305 (4.4%) |
| 10 to 14 Years | 168 (2.6%) | 306 (4.4%) |
| 15 to 19 Years | 379 (5.9%) | 414 (6.0%) |
| 20 to 24 Years | 247 (3.8%) | 317 (4.6%) |
| 25 to 29 Years | 403 (6.3%) | 569 (8.3%) |
| 30 to 34 Years | 366 (5.7%) | 347 (5.0%) |
| 35 to 39 Years | 728 (11.4%) | 594 (8.6%) |
| 40 to 44 Years | 416 (6.5%) | 409 (5.9%) |
| 45 to 49 Years | 494 (7.7%) | 478 (6.9%) |
| 50 to 54 Years | 507 (7.9%) | 495 (7.2%) |
| 55 to 59 Years | 385 (6.0%) | 392 (5.7%) |
| 60 to 64 Years | 441 (6.9%) | 506 (7.3%) |
| 65 to 69 Years | 230 (3.6%) | 393 (5.7%) |
| 70 to 74 Years | 188 (2.9%) | 349 (5.1%) |
| 75 to 79 Years | 217 (3.4%) | 175 (2.5%) |
| 80 to 84 Years | 115 (1.8%) | 289 (4.2%) |
| 85 Years and over | 115 (1.8%) | 214 (3.1%) |
| Total | 6,408 (100.0%) | 6,888 (100.0%) |
Families and Households in Elfers
Median Family Size in Elfers
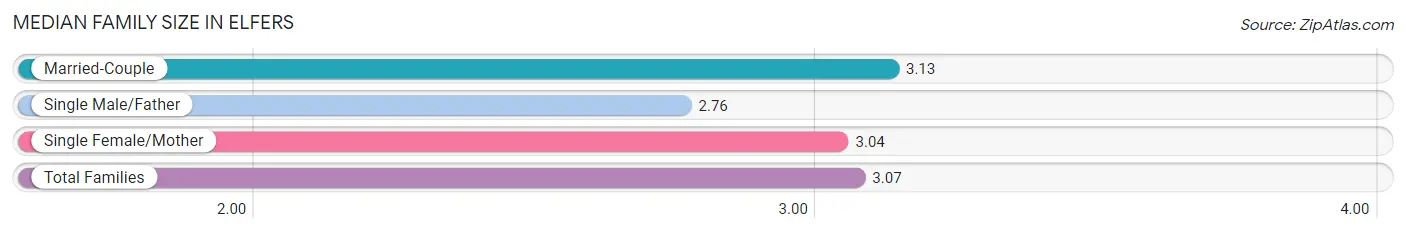
The median family size in Elfers is 3.07 persons per family, with married-couple families (2,055 | 62.9%) accounting for the largest median family size of 3.13 persons per family. On the other hand, single male/father families (271 | 8.3%) represent the smallest median family size with 2.76 persons per family.
| Family Type | # Families | Family Size |
| Married-Couple | 2,055 (62.9%) | 3.13 |
| Single Male/Father | 271 (8.3%) | 2.76 |
| Single Female/Mother | 943 (28.8%) | 3.04 |
| Total Families | 3,269 (100.0%) | 3.07 |
Median Household Size in Elfers
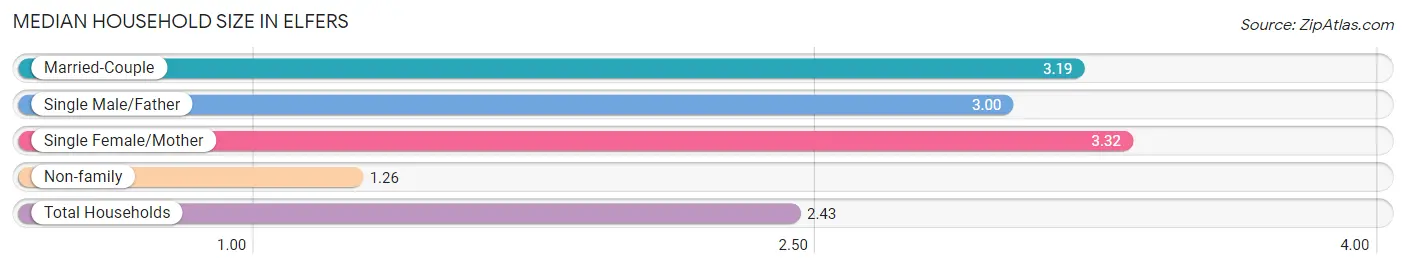
The median household size in Elfers is 2.43 persons per household, with single female/mother households (943 | 17.3%) accounting for the largest median household size of 3.32 persons per household. non-family households (2,183 | 40.0%) represent the smallest median household size with 1.26 persons per household.
| Household Type | # Households | Household Size |
| Married-Couple | 2,055 (37.7%) | 3.19 |
| Single Male/Father | 271 (5.0%) | 3.00 |
| Single Female/Mother | 943 (17.3%) | 3.32 |
| Non-family | 2,183 (40.0%) | 1.26 |
| Total Households | 5,452 (100.0%) | 2.43 |
Household Size by Marriage Status in Elfers
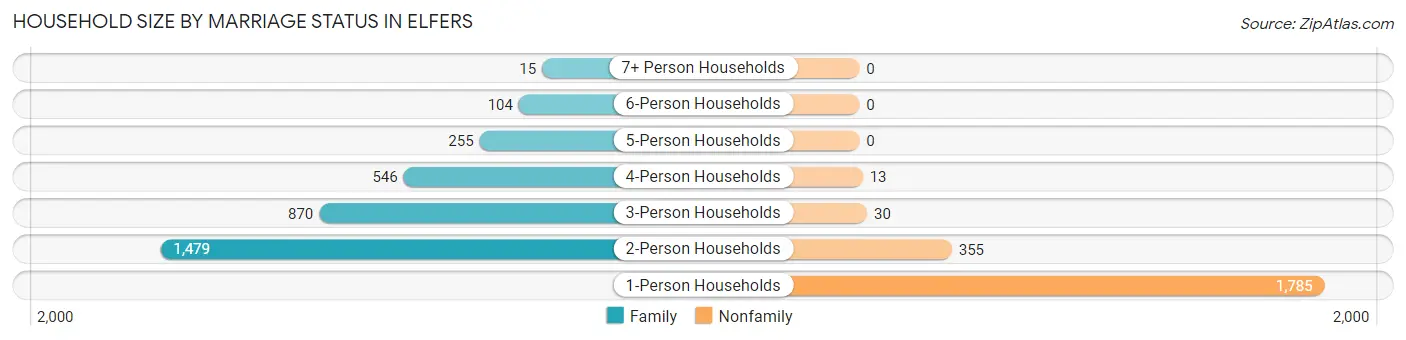
Out of a total of 5,452 households in Elfers, 3,269 (60.0%) are family households, while 2,183 (40.0%) are nonfamily households. The most numerous type of family households are 2-person households, comprising 1,479, and the most common type of nonfamily households are 1-person households, comprising 1,785.
| Household Size | Family Households | Nonfamily Households |
| 1-Person Households | - | 1,785 (32.7%) |
| 2-Person Households | 1,479 (27.1%) | 355 (6.5%) |
| 3-Person Households | 870 (16.0%) | 30 (0.5%) |
| 4-Person Households | 546 (10.0%) | 13 (0.2%) |
| 5-Person Households | 255 (4.7%) | 0 (0.0%) |
| 6-Person Households | 104 (1.9%) | 0 (0.0%) |
| 7+ Person Households | 15 (0.3%) | 0 (0.0%) |
| Total | 3,269 (60.0%) | 2,183 (40.0%) |
Female Fertility in Elfers
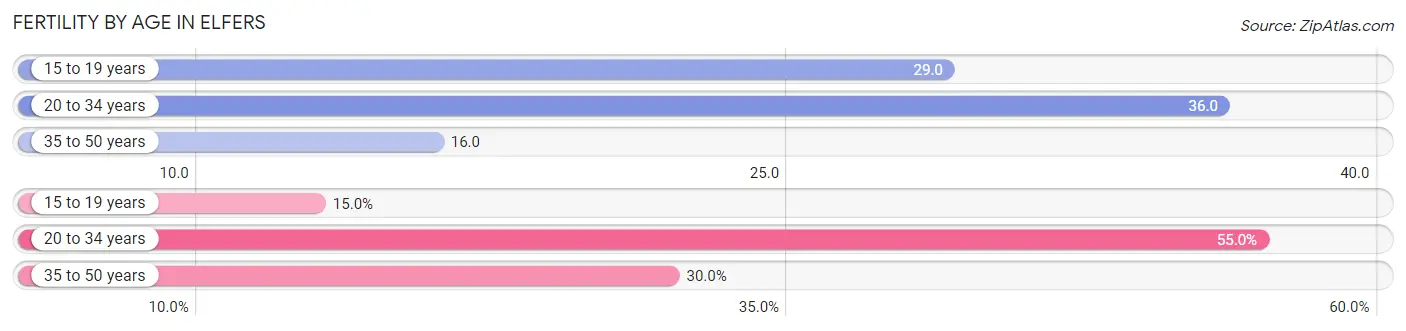
Fertility by Age in Elfers
Average fertility rate in Elfers is 25.0 births per 1,000 women. Women in the age bracket of 20 to 34 years have the highest fertility rate with 36.0 births per 1,000 women. Women in the age bracket of 20 to 34 years acount for 55.0% of all women with births.
| Age Bracket | Women with Births | Births / 1,000 Women |
| 15 to 19 years | 12 (15.0%) | 29.0 |
| 20 to 34 years | 44 (55.0%) | 36.0 |
| 35 to 50 years | 24 (30.0%) | 16.0 |
| Total | 80 (100.0%) | 25.0 |
Fertility by Age by Marriage Status in Elfers
40.0% of women with births (80) in Elfers are married. The highest percentage of unmarried women with births falls into 15 to 19 years age bracket with 100.0% of them unmarried at the time of birth, while the lowest percentage of unmarried women with births belong to 20 to 34 years age bracket with 27.3% of them unmarried.

| Age Bracket | Married | Unmarried |
| 15 to 19 years | 0 (0.0%) | 12 (100.0%) |
| 20 to 34 years | 32 (72.7%) | 12 (27.3%) |
| 35 to 50 years | 0 (0.0%) | 24 (100.0%) |
| Total | 32 (40.0%) | 48 (60.0%) |
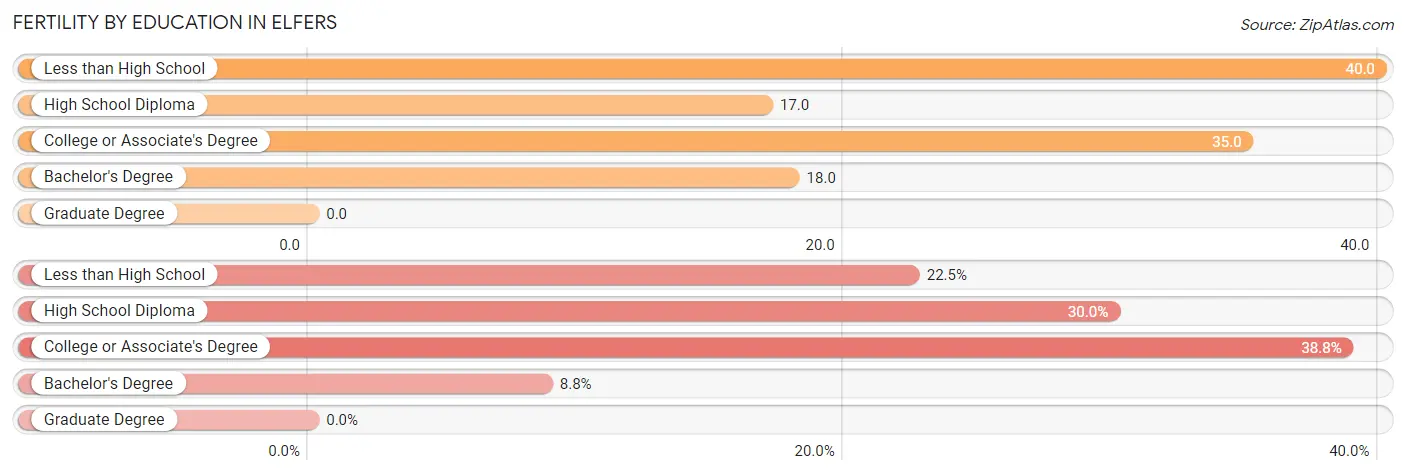
Fertility by Education in Elfers
| Educational Attainment | Women with Births | Births / 1,000 Women |
| Less than High School | 18 (22.5%) | 40.0 |
| High School Diploma | 24 (30.0%) | 17.0 |
| College or Associate's Degree | 31 (38.8%) | 35.0 |
| Bachelor's Degree | 7 (8.7%) | 18.0 |
| Graduate Degree | 0 (0.0%) | 0.0 |
| Total | 80 (100.0%) | 25.0 |
Fertility by Education by Marriage Status in Elfers
60.0% of women with births in Elfers are unmarried. Women with the educational attainment of bachelor's degree are most likely to be married with 100.0% of them married at childbirth, while women with the educational attainment of less than high school are least likely to be married with 100.0% of them unmarried at childbirth.
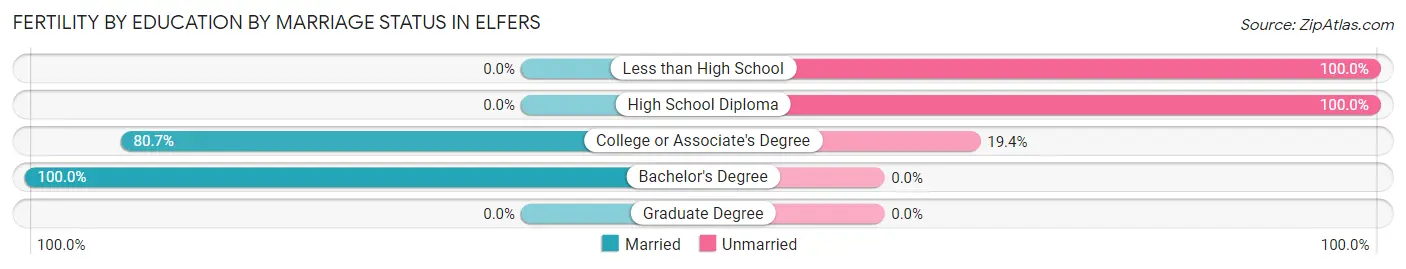
| Educational Attainment | Married | Unmarried |
| Less than High School | 0 (0.0%) | 18 (100.0%) |
| High School Diploma | 0 (0.0%) | 24 (100.0%) |
| College or Associate's Degree | 25 (80.6%) | 6 (19.4%) |
| Bachelor's Degree | 7 (100.0%) | 0 (0.0%) |
| Graduate Degree | 0 (0.0%) | 0 (0.0%) |
| Total | 32 (40.0%) | 48 (60.0%) |
Income in Elfers
Income Overview in Elfers
Per Capita Income in Elfers is $25,618, while median incomes of families and households are $57,623 and $50,467 respectively.
| Characteristic | Number | Measure |
| Per Capita Income | 13,296 | $25,618 |
| Median Family Income | 3,269 | $57,623 |
| Mean Family Income | 3,269 | $68,848 |
| Median Household Income | 5,452 | $50,467 |
| Mean Household Income | 5,452 | $59,215 |
| Income Deficit | 3,269 | $8,863 |
| Wage / Income Gap (%) | 13,296 | 25.09% |
| Wage / Income Gap ($) | 13,296 | 74.91¢ per $1 |
| Gini / Inequality Index | 13,296 | 0.36 |
Earnings by Sex in Elfers
Average Earnings in Elfers are $33,161, $37,705 for men and $28,243 for women, a difference of 25.1%.
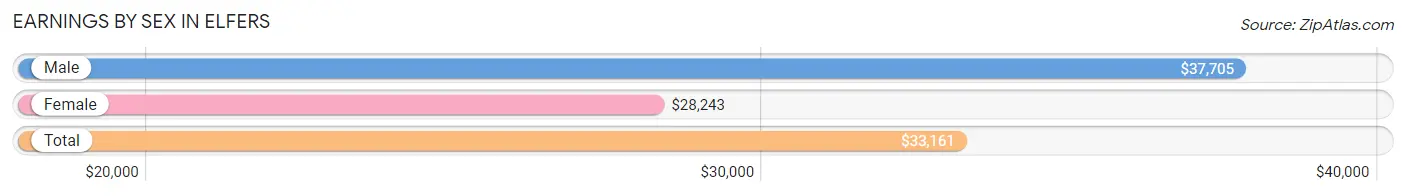
| Sex | Number | Average Earnings |
| Male | 3,487 (52.2%) | $37,705 |
| Female | 3,195 (47.8%) | $28,243 |
| Total | 6,682 (100.0%) | $33,161 |
Earnings by Sex by Income Bracket in Elfers
The most common earnings brackets in Elfers are $35,000 to $39,999 for men (402 | 11.5%) and $25,000 to $29,999 for women (425 | 13.3%).
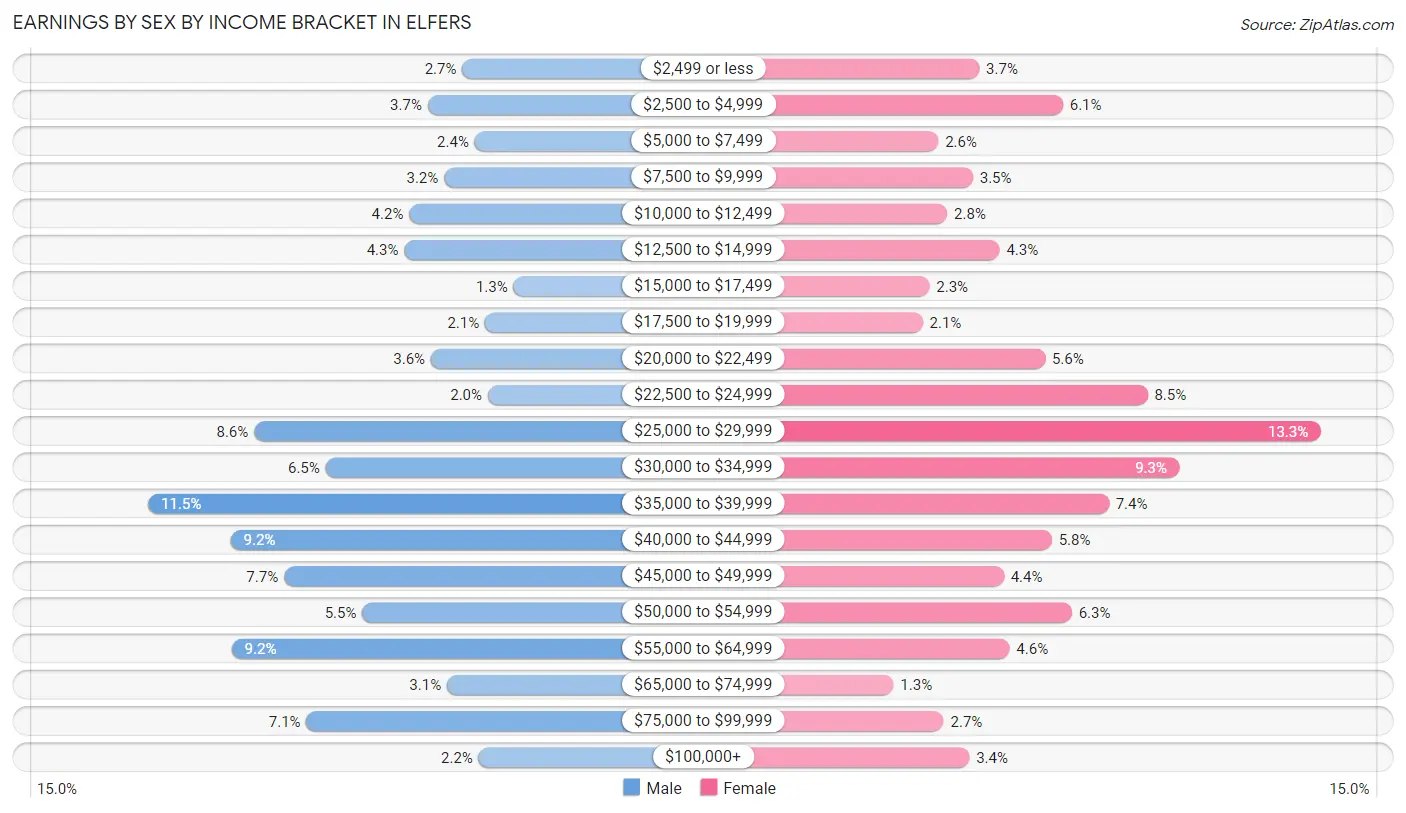
| Income | Male | Female |
| $2,499 or less | 94 (2.7%) | 119 (3.7%) |
| $2,500 to $4,999 | 128 (3.7%) | 194 (6.1%) |
| $5,000 to $7,499 | 82 (2.4%) | 82 (2.6%) |
| $7,500 to $9,999 | 112 (3.2%) | 113 (3.5%) |
| $10,000 to $12,499 | 146 (4.2%) | 90 (2.8%) |
| $12,500 to $14,999 | 151 (4.3%) | 137 (4.3%) |
| $15,000 to $17,499 | 44 (1.3%) | 74 (2.3%) |
| $17,500 to $19,999 | 72 (2.1%) | 68 (2.1%) |
| $20,000 to $22,499 | 125 (3.6%) | 178 (5.6%) |
| $22,500 to $24,999 | 69 (2.0%) | 270 (8.5%) |
| $25,000 to $29,999 | 298 (8.6%) | 425 (13.3%) |
| $30,000 to $34,999 | 228 (6.5%) | 298 (9.3%) |
| $35,000 to $39,999 | 402 (11.5%) | 235 (7.4%) |
| $40,000 to $44,999 | 321 (9.2%) | 184 (5.8%) |
| $45,000 to $49,999 | 269 (7.7%) | 141 (4.4%) |
| $50,000 to $54,999 | 192 (5.5%) | 202 (6.3%) |
| $55,000 to $64,999 | 320 (9.2%) | 146 (4.6%) |
| $65,000 to $74,999 | 109 (3.1%) | 42 (1.3%) |
| $75,000 to $99,999 | 247 (7.1%) | 87 (2.7%) |
| $100,000+ | 78 (2.2%) | 110 (3.4%) |
| Total | 3,487 (100.0%) | 3,195 (100.0%) |
Earnings by Sex by Educational Attainment in Elfers
Average earnings in Elfers are $39,398 for men and $30,640 for women, a difference of 22.2%. Men with an educational attainment of graduate degree enjoy the highest average annual earnings of $53,289, while those with less than high school education earn the least with $27,727. Women with an educational attainment of graduate degree earn the most with the average annual earnings of $44,167, while those with less than high school education have the smallest earnings of $14,663.
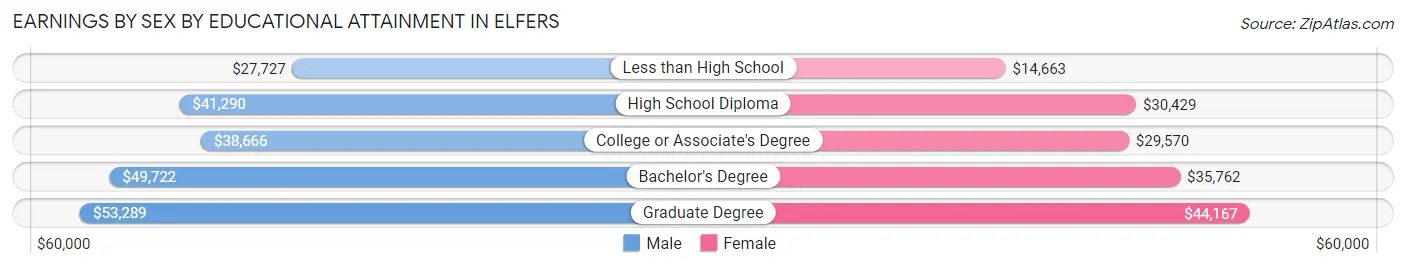
| Educational Attainment | Male Income | Female Income |
| Less than High School | $27,727 | $14,663 |
| High School Diploma | $41,290 | $30,429 |
| College or Associate's Degree | $38,666 | $29,570 |
| Bachelor's Degree | $49,722 | $35,762 |
| Graduate Degree | $53,289 | $44,167 |
| Total | $39,398 | $30,640 |
Family Income in Elfers
Family Income Brackets in Elfers
According to the Elfers family income data, there are 938 families falling into the $50,000 to $74,999 income range, which is the most common income bracket and makes up 28.7% of all families. Conversely, the $10,000 to $14,999 income bracket is the least frequent group with only 26 families (0.8%) belonging to this category.
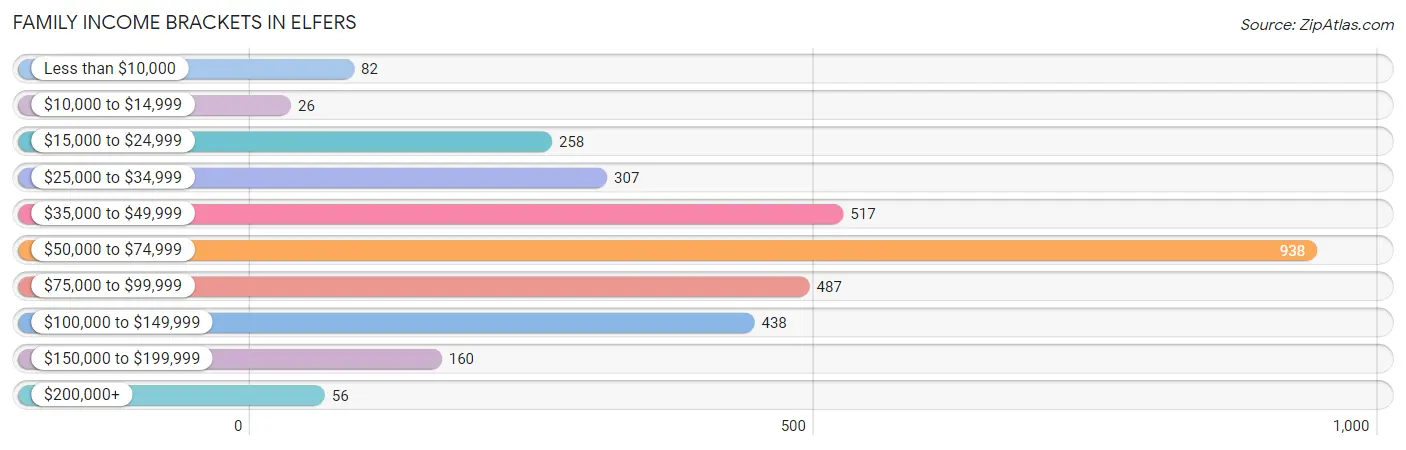
| Income Bracket | # Families | % Families |
| Less than $10,000 | 82 | 2.5% |
| $10,000 to $14,999 | 26 | 0.8% |
| $15,000 to $24,999 | 258 | 7.9% |
| $25,000 to $34,999 | 307 | 9.4% |
| $35,000 to $49,999 | 517 | 15.8% |
| $50,000 to $74,999 | 938 | 28.7% |
| $75,000 to $99,999 | 487 | 14.9% |
| $100,000 to $149,999 | 438 | 13.4% |
| $150,000 to $199,999 | 160 | 4.9% |
| $200,000+ | 56 | 1.7% |
Family Income by Famaliy Size in Elfers
6-person families (50 | 1.5%) account for the highest median family income in Elfers with $81,125 per family, while 2-person families (1,598 | 48.9%) have the highest median income of $28,006 per family member.
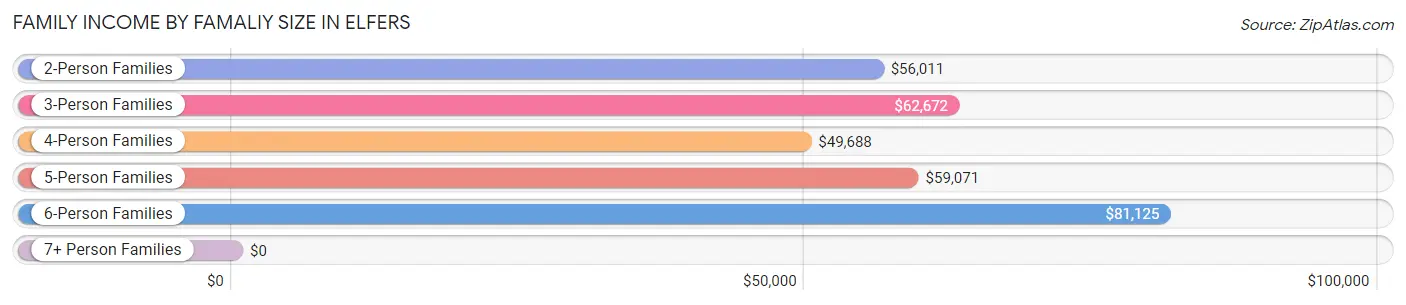
| Income Bracket | # Families | Median Income |
| 2-Person Families | 1,598 (48.9%) | $56,011 |
| 3-Person Families | 839 (25.7%) | $62,672 |
| 4-Person Families | 567 (17.3%) | $49,688 |
| 5-Person Families | 200 (6.1%) | $59,071 |
| 6-Person Families | 50 (1.5%) | $81,125 |
| 7+ Person Families | 15 (0.5%) | $0 |
| Total | 3,269 (100.0%) | $57,623 |
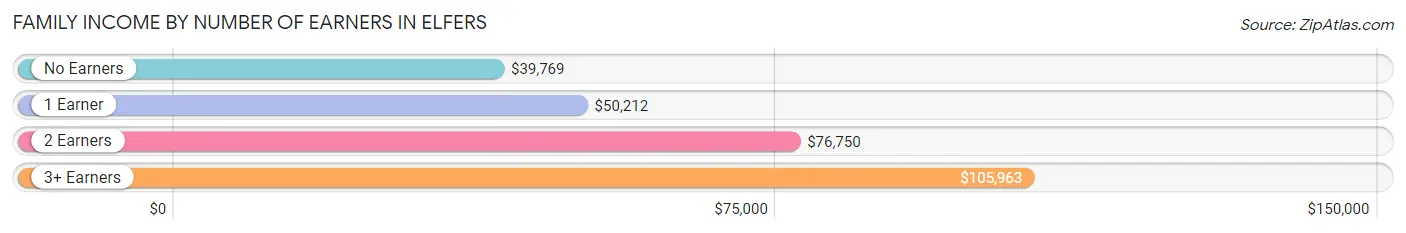
Family Income by Number of Earners in Elfers
The median family income in Elfers is $57,623, with families comprising 3+ earners (305) having the highest median family income of $105,963, while families with no earners (467) have the lowest median family income of $39,769, accounting for 9.3% and 14.3% of families, respectively.
| Number of Earners | # Families | Median Income |
| No Earners | 467 (14.3%) | $39,769 |
| 1 Earner | 1,416 (43.3%) | $50,212 |
| 2 Earners | 1,081 (33.1%) | $76,750 |
| 3+ Earners | 305 (9.3%) | $105,963 |
| Total | 3,269 (100.0%) | $57,623 |
Household Income in Elfers
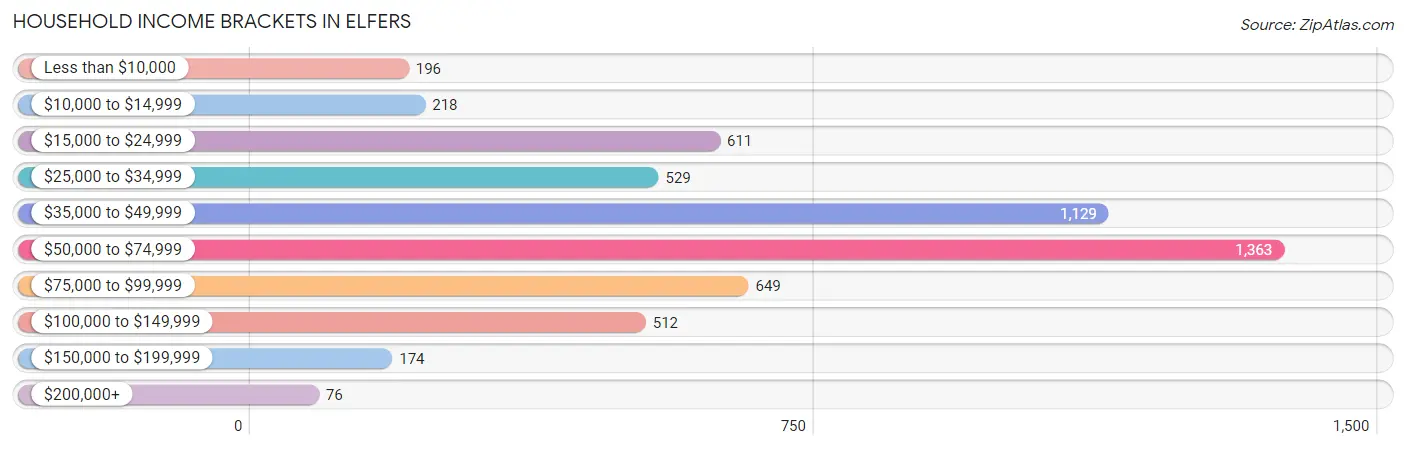
Household Income Brackets in Elfers
With 1,363 households falling in the category, the $50,000 to $74,999 income range is the most frequent in Elfers, accounting for 25.0% of all households. In contrast, only 76 households (1.4%) fall into the $200,000+ income bracket, making it the least populous group.
| Income Bracket | # Households | % Households |
| Less than $10,000 | 196 | 3.6% |
| $10,000 to $14,999 | 218 | 4.0% |
| $15,000 to $24,999 | 611 | 11.2% |
| $25,000 to $34,999 | 529 | 9.7% |
| $35,000 to $49,999 | 1,129 | 20.7% |
| $50,000 to $74,999 | 1,363 | 25.0% |
| $75,000 to $99,999 | 649 | 11.9% |
| $100,000 to $149,999 | 512 | 9.4% |
| $150,000 to $199,999 | 174 | 3.2% |
| $200,000+ | 76 | 1.4% |
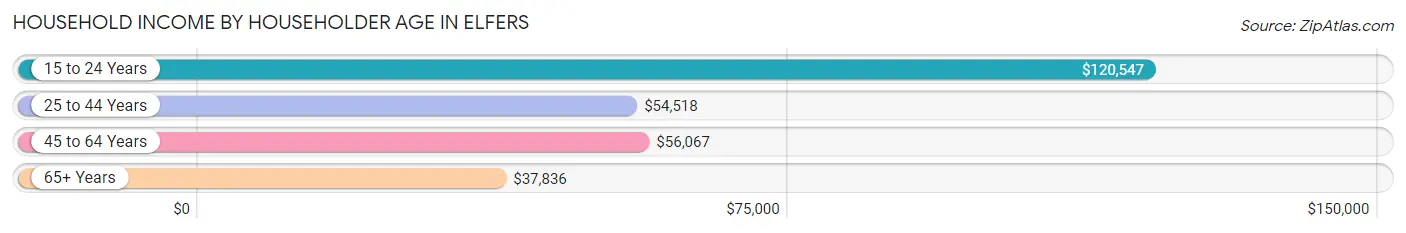
Household Income by Householder Age in Elfers
The median household income in Elfers is $50,467, with the highest median household income of $120,547 found in the 15 to 24 years age bracket for the primary householder. A total of 25 households (0.5%) fall into this category. Meanwhile, the 65+ years age bracket for the primary householder has the lowest median household income of $37,836, with 1,457 households (26.7%) in this group.
| Income Bracket | # Households | Median Income |
| 15 to 24 Years | 25 (0.5%) | $120,547 |
| 25 to 44 Years | 2,044 (37.5%) | $54,518 |
| 45 to 64 Years | 1,926 (35.3%) | $56,067 |
| 65+ Years | 1,457 (26.7%) | $37,836 |
| Total | 5,452 (100.0%) | $50,467 |
Poverty in Elfers
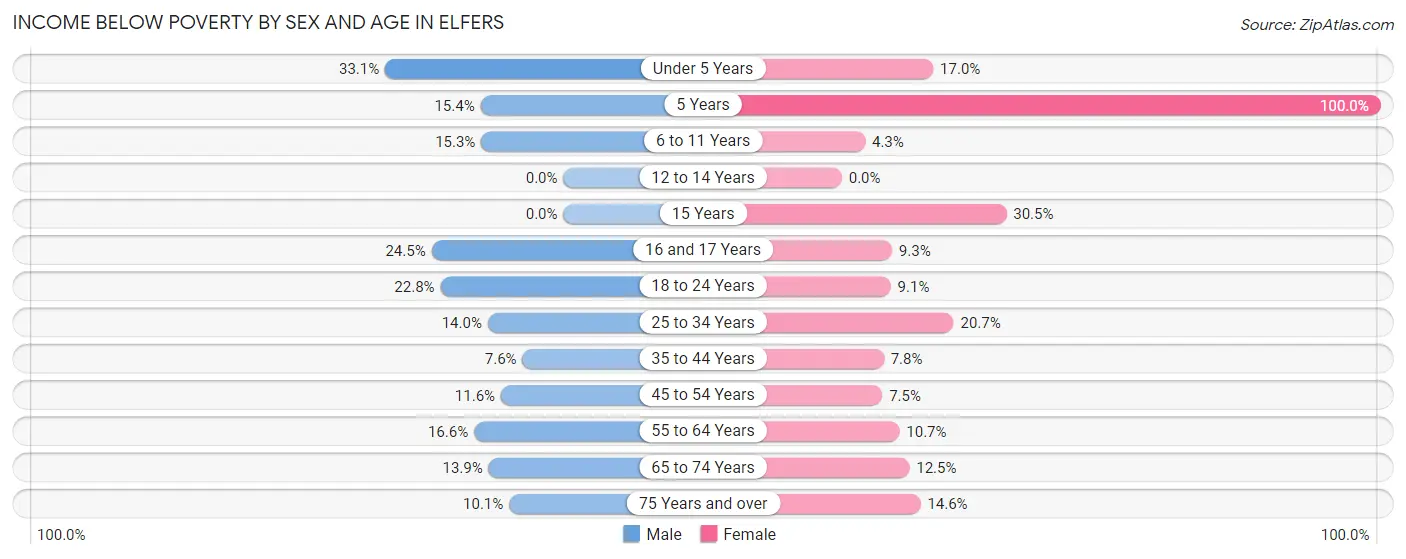
Income Below Poverty by Sex and Age in Elfers
With 14.4% poverty level for males and 12.4% for females among the residents of Elfers, under 5 year old males and 5 year old females are the most vulnerable to poverty, with 139 males (33.1%) and 64 females (100.0%) in their respective age groups living below the poverty level.
| Age Bracket | Male | Female |
| Under 5 Years | 139 (33.1%) | 57 (17.0%) |
| 5 Years | 16 (15.4%) | 64 (100.0%) |
| 6 to 11 Years | 84 (15.2%) | 15 (4.3%) |
| 12 to 14 Years | 0 (0.0%) | 0 (0.0%) |
| 15 Years | 0 (0.0%) | 29 (30.5%) |
| 16 and 17 Years | 47 (24.5%) | 12 (9.3%) |
| 18 to 24 Years | 81 (22.8%) | 46 (9.1%) |
| 25 to 34 Years | 108 (14.0%) | 190 (20.7%) |
| 35 to 44 Years | 87 (7.6%) | 78 (7.8%) |
| 45 to 54 Years | 116 (11.6%) | 73 (7.5%) |
| 55 to 64 Years | 137 (16.6%) | 96 (10.7%) |
| 65 to 74 Years | 58 (13.9%) | 93 (12.5%) |
| 75 Years and over | 45 (10.1%) | 99 (14.6%) |
| Total | 918 (14.4%) | 852 (12.4%) |
Income Above Poverty by Sex and Age in Elfers
According to the poverty statistics in Elfers, males aged 12 to 14 years and females aged 12 to 14 years are the age groups that are most secure financially, with 100.0% of males and 100.0% of females in these age groups living above the poverty line.
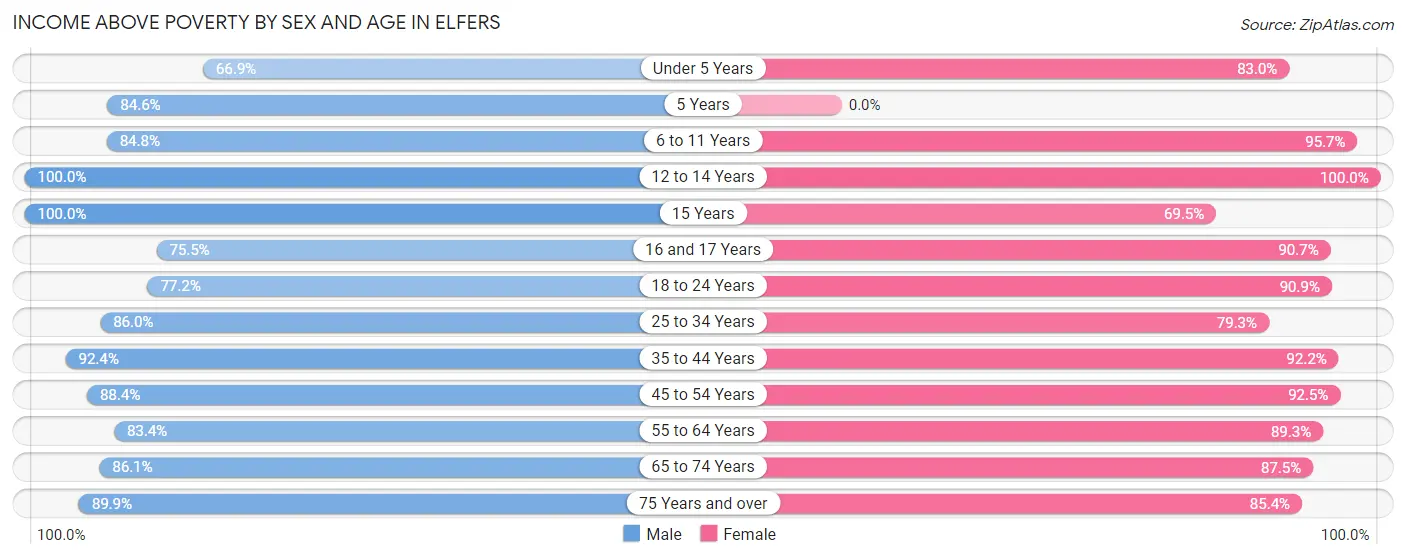
| Age Bracket | Male | Female |
| Under 5 Years | 281 (66.9%) | 279 (83.0%) |
| 5 Years | 88 (84.6%) | 0 (0.0%) |
| 6 to 11 Years | 467 (84.8%) | 333 (95.7%) |
| 12 to 14 Years | 88 (100.0%) | 166 (100.0%) |
| 15 Years | 79 (100.0%) | 66 (69.5%) |
| 16 and 17 Years | 145 (75.5%) | 117 (90.7%) |
| 18 to 24 Years | 274 (77.2%) | 461 (90.9%) |
| 25 to 34 Years | 661 (86.0%) | 726 (79.3%) |
| 35 to 44 Years | 1,057 (92.4%) | 925 (92.2%) |
| 45 to 54 Years | 885 (88.4%) | 900 (92.5%) |
| 55 to 64 Years | 689 (83.4%) | 802 (89.3%) |
| 65 to 74 Years | 360 (86.1%) | 649 (87.5%) |
| 75 Years and over | 402 (89.9%) | 579 (85.4%) |
| Total | 5,476 (85.6%) | 6,003 (87.6%) |
Income Below Poverty Among Married-Couple Families in Elfers
The poverty statistics for married-couple families in Elfers show that 5.5% or 113 of the total 2,055 families live below the poverty line. Families with 1 or 2 children have the highest poverty rate of 12.2%, comprising of 75 families. On the other hand, families with 3 or 4 children have the lowest poverty rate of 0.0%, which includes 0 families.
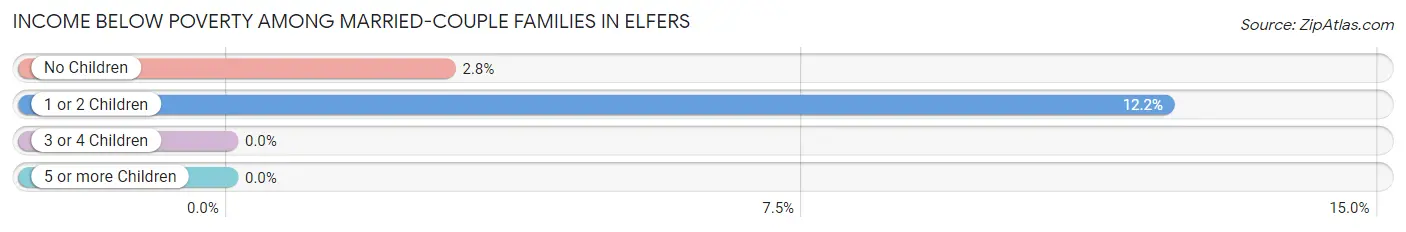
| Children | Above Poverty | Below Poverty |
| No Children | 1,298 (97.2%) | 38 (2.8%) |
| 1 or 2 Children | 538 (87.8%) | 75 (12.2%) |
| 3 or 4 Children | 106 (100.0%) | 0 (0.0%) |
| 5 or more Children | 0 (0.0%) | 0 (0.0%) |
| Total | 1,942 (94.5%) | 113 (5.5%) |
Income Below Poverty Among Single-Parent Households in Elfers
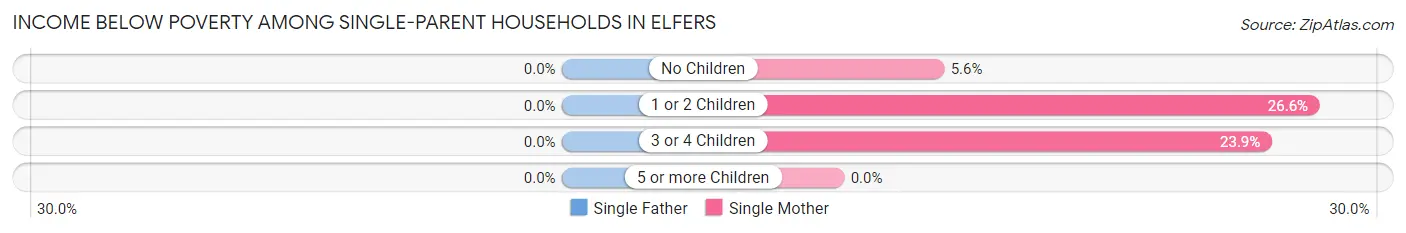
| Children | Single Father | Single Mother |
| No Children | 0 (0.0%) | 24 (5.6%) |
| 1 or 2 Children | 0 (0.0%) | 99 (26.6%) |
| 3 or 4 Children | 0 (0.0%) | 34 (23.9%) |
| 5 or more Children | 0 (0.0%) | 0 (0.0%) |
| Total | 0 (0.0%) | 157 (16.7%) |
Income Below Poverty Among Married-Couple vs Single-Parent Households in Elfers
The poverty data for Elfers shows that 113 of the married-couple family households (5.5%) and 157 of the single-parent households (12.9%) are living below the poverty level. Within the married-couple family households, those with 1 or 2 children have the highest poverty rate, with 75 households (12.2%) falling below the poverty line. Among the single-parent households, those with 3 or 4 children have the highest poverty rate, with 34 household (23.9%) living below poverty.
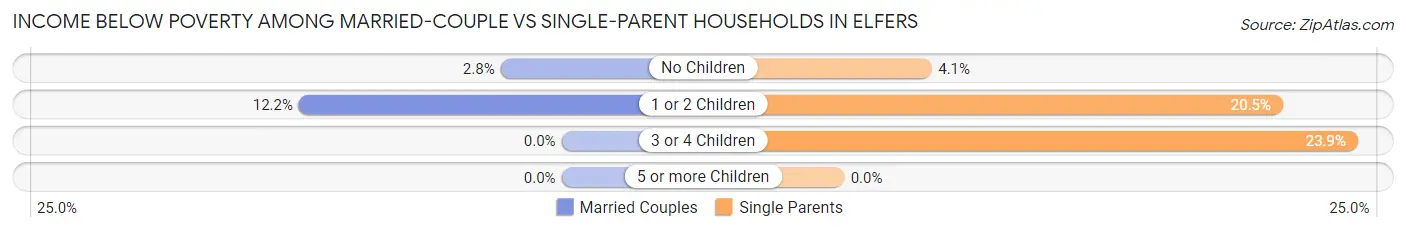
| Children | Married-Couple Families | Single-Parent Households |
| No Children | 38 (2.8%) | 24 (4.1%) |
| 1 or 2 Children | 75 (12.2%) | 99 (20.4%) |
| 3 or 4 Children | 0 (0.0%) | 34 (23.9%) |
| 5 or more Children | 0 (0.0%) | 0 (0.0%) |
| Total | 113 (5.5%) | 157 (12.9%) |
Employment Characteristics in Elfers
Employment by Class of Employer in Elfers
Among the 6,138 employed individuals in Elfers, private company employees (4,864 | 79.2%), local government employees (371 | 6.0%), and self-employed (not incorporated) (302 | 4.9%) make up the most common classes of employment.
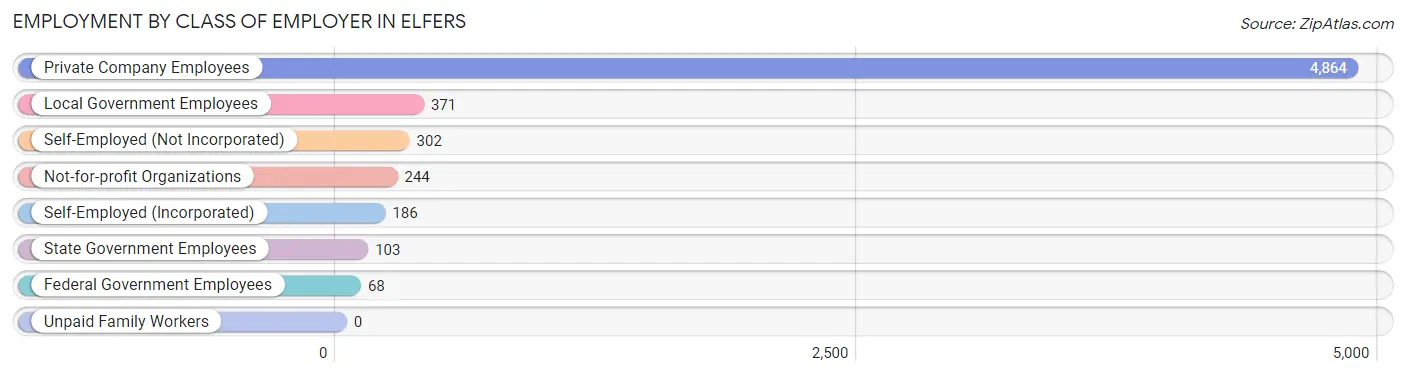
| Employer Class | # Employees | % Employees |
| Private Company Employees | 4,864 | 79.2% |
| Self-Employed (Incorporated) | 186 | 3.0% |
| Self-Employed (Not Incorporated) | 302 | 4.9% |
| Not-for-profit Organizations | 244 | 4.0% |
| Local Government Employees | 371 | 6.0% |
| State Government Employees | 103 | 1.7% |
| Federal Government Employees | 68 | 1.1% |
| Unpaid Family Workers | 0 | 0.0% |
| Total | 6,138 | 100.0% |
Employment Status by Age in Elfers
According to the labor force statistics for Elfers, out of the total population over 16 years of age (10,998), 58.9% or 6,478 individuals are in the labor force, with 4.2% or 272 of them unemployed. The age group with the highest labor force participation rate is 35 to 44 years, with 85.5% or 1,836 individuals in the labor force. Within the labor force, the 16 to 19 years age range has the highest percentage of unemployed individuals, with 11.8% or 26 of them being unemployed.
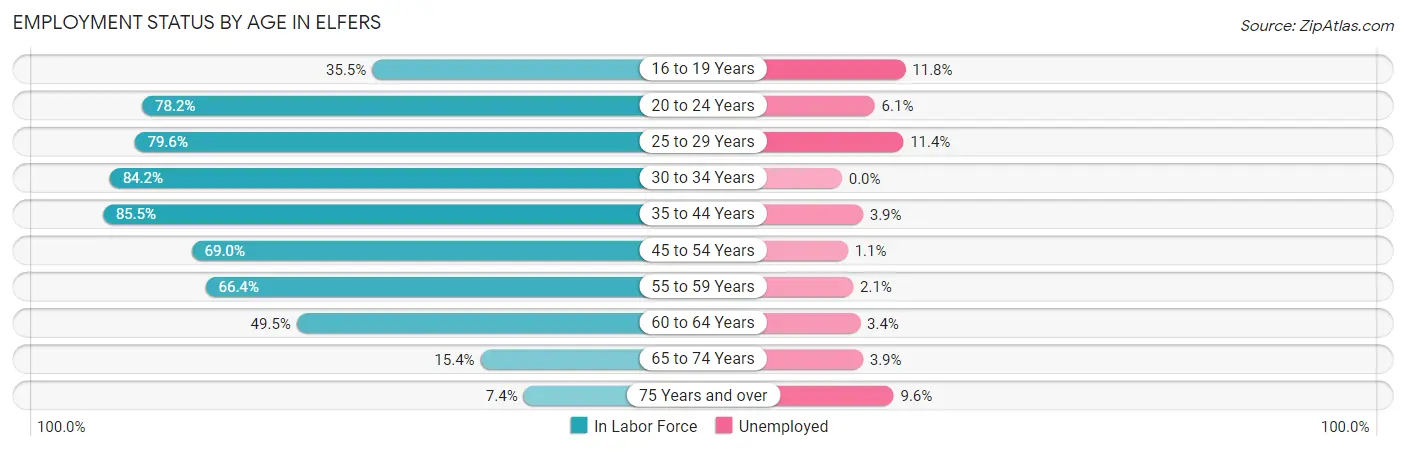
| Age Bracket | In Labor Force | Unemployed |
| 16 to 19 Years | 220 (35.5%) | 26 (11.8%) |
| 20 to 24 Years | 441 (78.2%) | 27 (6.1%) |
| 25 to 29 Years | 774 (79.6%) | 88 (11.4%) |
| 30 to 34 Years | 600 (84.2%) | 0 (0.0%) |
| 35 to 44 Years | 1,836 (85.5%) | 72 (3.9%) |
| 45 to 54 Years | 1,362 (69.0%) | 15 (1.1%) |
| 55 to 59 Years | 516 (66.4%) | 11 (2.1%) |
| 60 to 64 Years | 469 (49.5%) | 16 (3.4%) |
| 65 to 74 Years | 179 (15.4%) | 7 (3.9%) |
| 75 Years and over | 83 (7.4%) | 8 (9.6%) |
| Total | 6,478 (58.9%) | 272 (4.2%) |
Employment Status by Educational Attainment in Elfers
According to labor force statistics for Elfers, 73.8% of individuals (5,557) out of the total population between 25 and 64 years of age (7,530) are in the labor force, with 3.6% or 200 of them being unemployed. The group with the highest labor force participation rate are those with the educational attainment of bachelor's degree or higher, with 76.5% or 781 individuals in the labor force. Within the labor force, individuals with college / associate degree education have the highest percentage of unemployment, with 7.4% or 121 of them being unemployed.
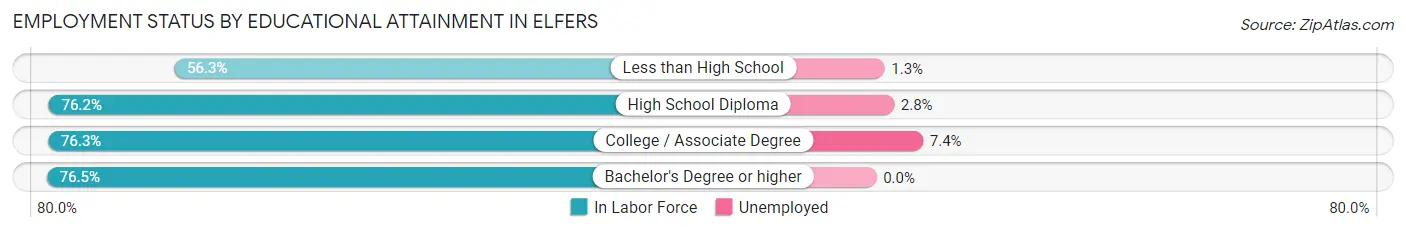
| Educational Attainment | In Labor Force | Unemployed |
| Less than High School | 523 (56.3%) | 12 (1.3%) |
| High School Diploma | 2,621 (76.2%) | 96 (2.8%) |
| College / Associate Degree | 1,634 (76.3%) | 158 (7.4%) |
| Bachelor's Degree or higher | 781 (76.5%) | 0 (0.0%) |
| Total | 5,557 (73.8%) | 271 (3.6%) |
Employment Occupations by Sex in Elfers
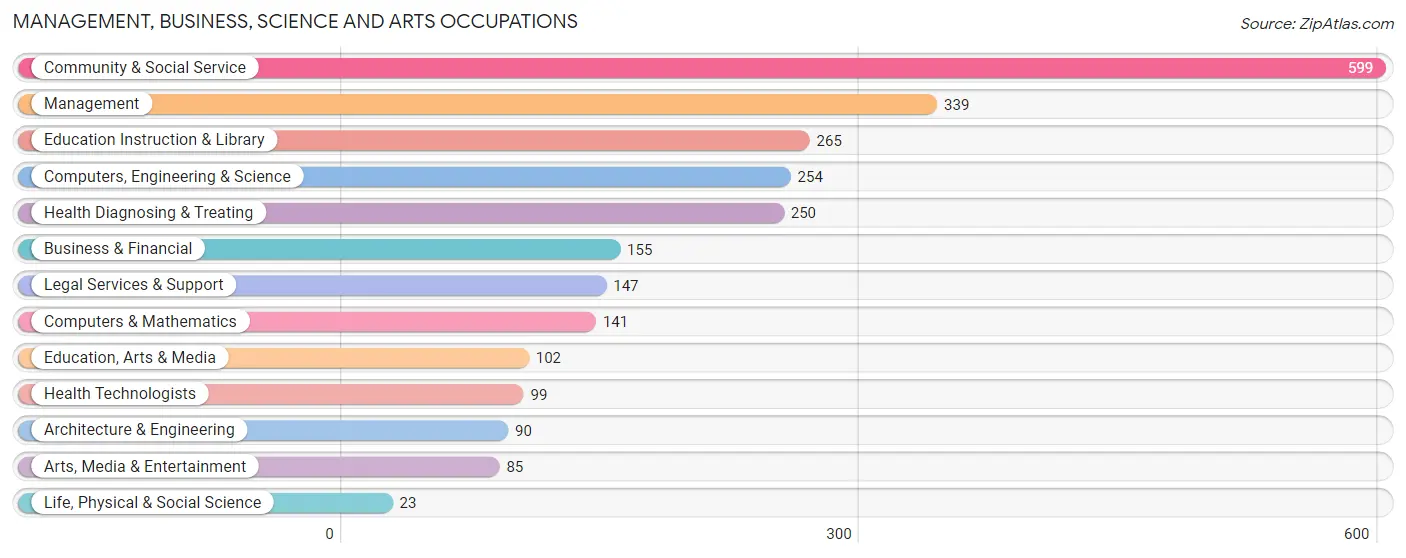
Management, Business, Science and Arts Occupations
The most common Management, Business, Science and Arts occupations in Elfers are Community & Social Service (599 | 9.7%), Management (339 | 5.5%), Education Instruction & Library (265 | 4.3%), Computers, Engineering & Science (254 | 4.1%), and Health Diagnosing & Treating (250 | 4.0%).
Management, Business, Science and Arts Occupations by Sex
Within the Management, Business, Science and Arts occupations in Elfers, the most male-oriented occupations are Architecture & Engineering (100.0%), Computers, Engineering & Science (66.5%), and Management (55.7%), while the most female-oriented occupations are Health Diagnosing & Treating (82.4%), Health Technologists (78.8%), and Education, Arts & Media (77.4%).
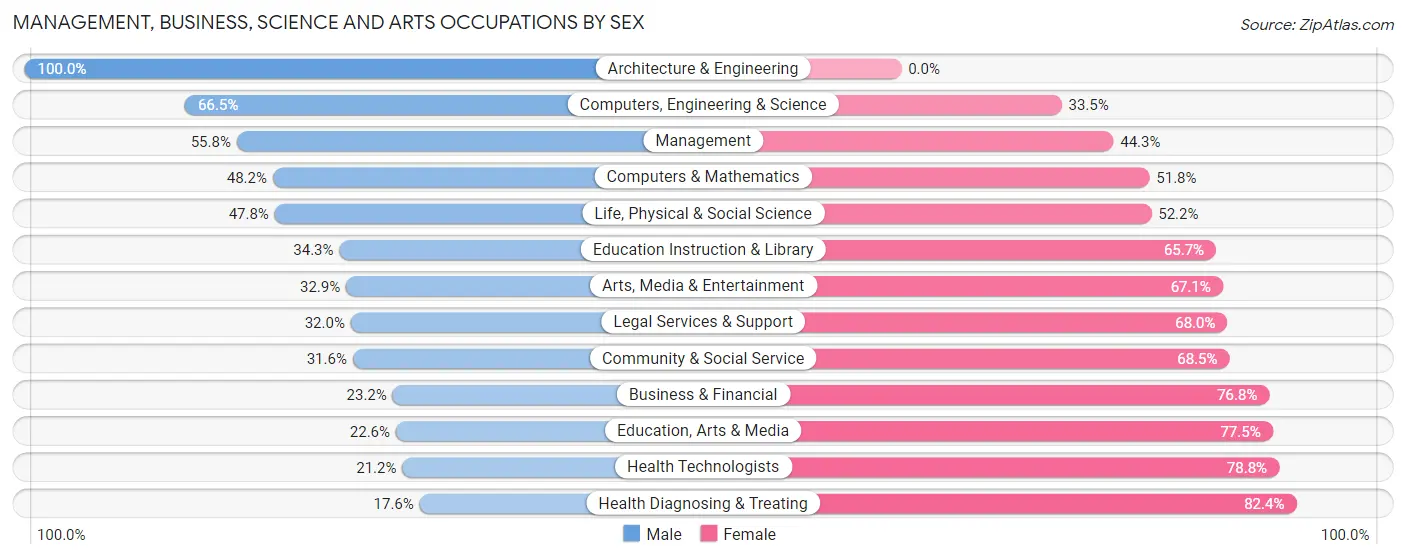
| Occupation | Male | Female |
| Management | 189 (55.7%) | 150 (44.3%) |
| Business & Financial | 36 (23.2%) | 119 (76.8%) |
| Computers, Engineering & Science | 169 (66.5%) | 85 (33.5%) |
| Computers & Mathematics | 68 (48.2%) | 73 (51.8%) |
| Architecture & Engineering | 90 (100.0%) | 0 (0.0%) |
| Life, Physical & Social Science | 11 (47.8%) | 12 (52.2%) |
| Community & Social Service | 189 (31.6%) | 410 (68.4%) |
| Education, Arts & Media | 23 (22.6%) | 79 (77.4%) |
| Legal Services & Support | 47 (32.0%) | 100 (68.0%) |
| Education Instruction & Library | 91 (34.3%) | 174 (65.7%) |
| Arts, Media & Entertainment | 28 (32.9%) | 57 (67.1%) |
| Health Diagnosing & Treating | 44 (17.6%) | 206 (82.4%) |
| Health Technologists | 21 (21.2%) | 78 (78.8%) |
| Total (Category) | 627 (39.3%) | 970 (60.7%) |
| Total (Overall) | 3,213 (51.7%) | 2,997 (48.3%) |
Services Occupations
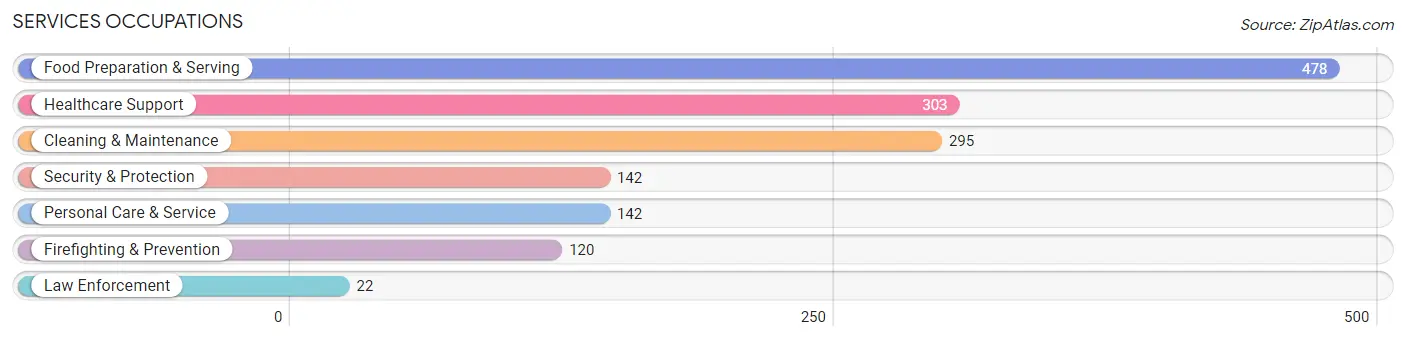
The most common Services occupations in Elfers are Food Preparation & Serving (478 | 7.7%), Healthcare Support (303 | 4.9%), Cleaning & Maintenance (295 | 4.8%), Security & Protection (142 | 2.3%), and Personal Care & Service (142 | 2.3%).
Services Occupations by Sex
Within the Services occupations in Elfers, the most male-oriented occupations are Law Enforcement (100.0%), Security & Protection (77.5%), and Firefighting & Prevention (73.3%), while the most female-oriented occupations are Personal Care & Service (84.5%), Healthcare Support (77.9%), and Food Preparation & Serving (60.5%).
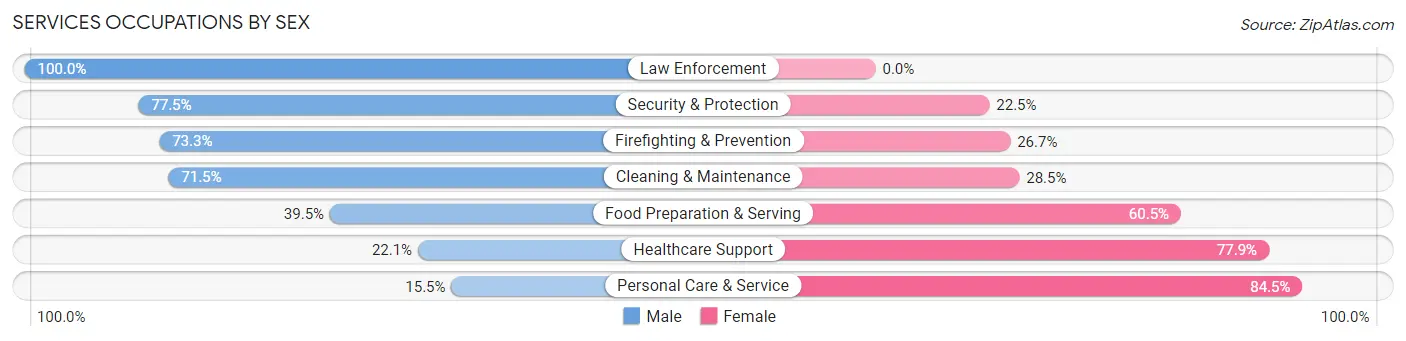
| Occupation | Male | Female |
| Healthcare Support | 67 (22.1%) | 236 (77.9%) |
| Security & Protection | 110 (77.5%) | 32 (22.5%) |
| Firefighting & Prevention | 88 (73.3%) | 32 (26.7%) |
| Law Enforcement | 22 (100.0%) | 0 (0.0%) |
| Food Preparation & Serving | 189 (39.5%) | 289 (60.5%) |
| Cleaning & Maintenance | 211 (71.5%) | 84 (28.5%) |
| Personal Care & Service | 22 (15.5%) | 120 (84.5%) |
| Total (Category) | 599 (44.0%) | 761 (56.0%) |
| Total (Overall) | 3,213 (51.7%) | 2,997 (48.3%) |
Sales and Office Occupations
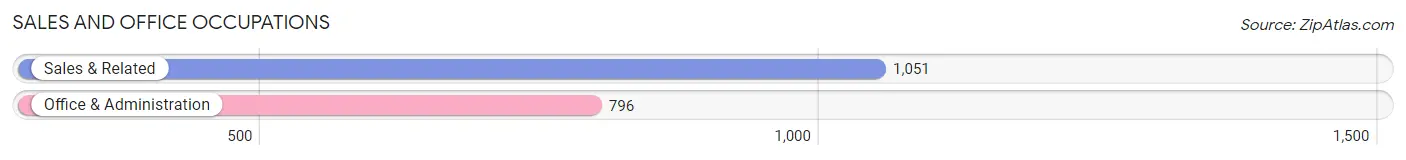
The most common Sales and Office occupations in Elfers are Sales & Related (1,051 | 16.9%), and Office & Administration (796 | 12.8%).
Sales and Office Occupations by Sex
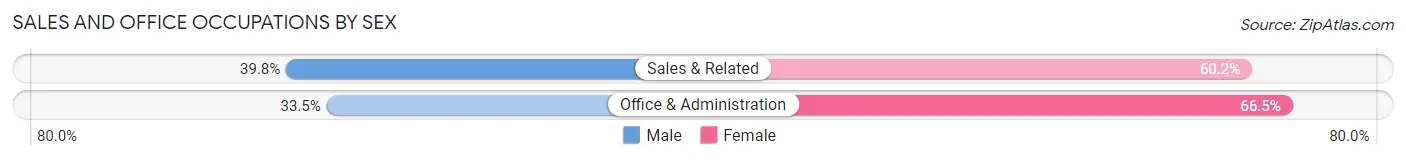
| Occupation | Male | Female |
| Sales & Related | 418 (39.8%) | 633 (60.2%) |
| Office & Administration | 267 (33.5%) | 529 (66.5%) |
| Total (Category) | 685 (37.1%) | 1,162 (62.9%) |
| Total (Overall) | 3,213 (51.7%) | 2,997 (48.3%) |
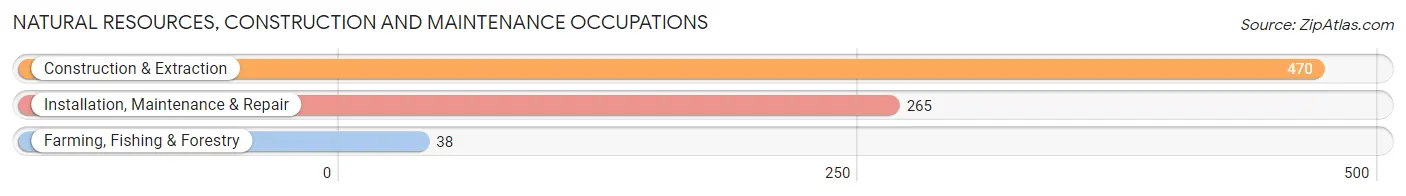
Natural Resources, Construction and Maintenance Occupations
The most common Natural Resources, Construction and Maintenance occupations in Elfers are Construction & Extraction (470 | 7.6%), Installation, Maintenance & Repair (265 | 4.3%), and Farming, Fishing & Forestry (38 | 0.6%).
Natural Resources, Construction and Maintenance Occupations by Sex
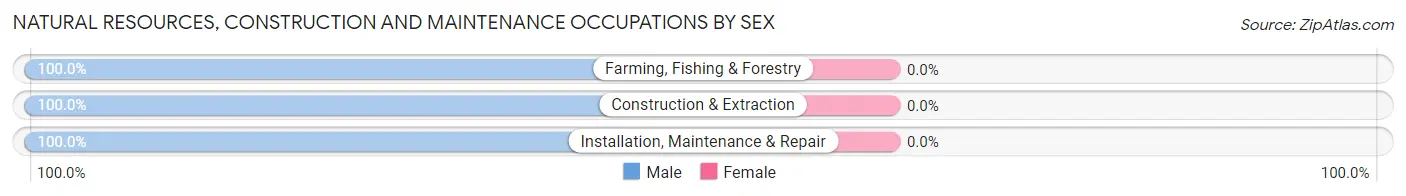
| Occupation | Male | Female |
| Farming, Fishing & Forestry | 38 (100.0%) | 0 (0.0%) |
| Construction & Extraction | 470 (100.0%) | 0 (0.0%) |
| Installation, Maintenance & Repair | 265 (100.0%) | 0 (0.0%) |
| Total (Category) | 773 (100.0%) | 0 (0.0%) |
| Total (Overall) | 3,213 (51.7%) | 2,997 (48.3%) |
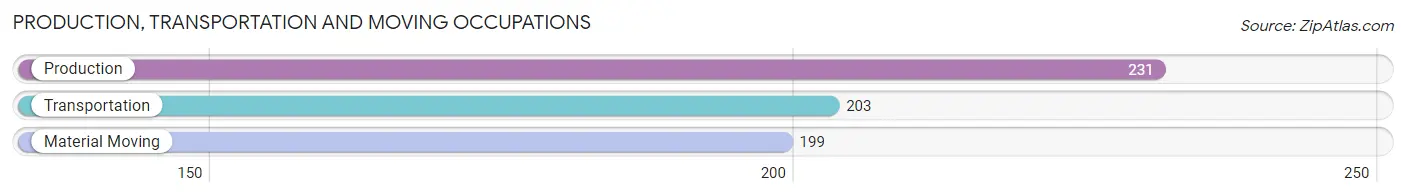
Production, Transportation and Moving Occupations
The most common Production, Transportation and Moving occupations in Elfers are Production (231 | 3.7%), Transportation (203 | 3.3%), and Material Moving (199 | 3.2%).
Production, Transportation and Moving Occupations by Sex
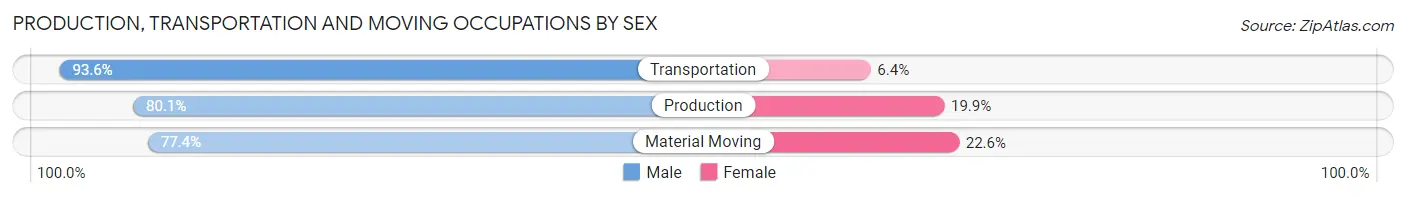
| Occupation | Male | Female |
| Production | 185 (80.1%) | 46 (19.9%) |
| Transportation | 190 (93.6%) | 13 (6.4%) |
| Material Moving | 154 (77.4%) | 45 (22.6%) |
| Total (Category) | 529 (83.6%) | 104 (16.4%) |
| Total (Overall) | 3,213 (51.7%) | 2,997 (48.3%) |
Employment Industries by Sex in Elfers
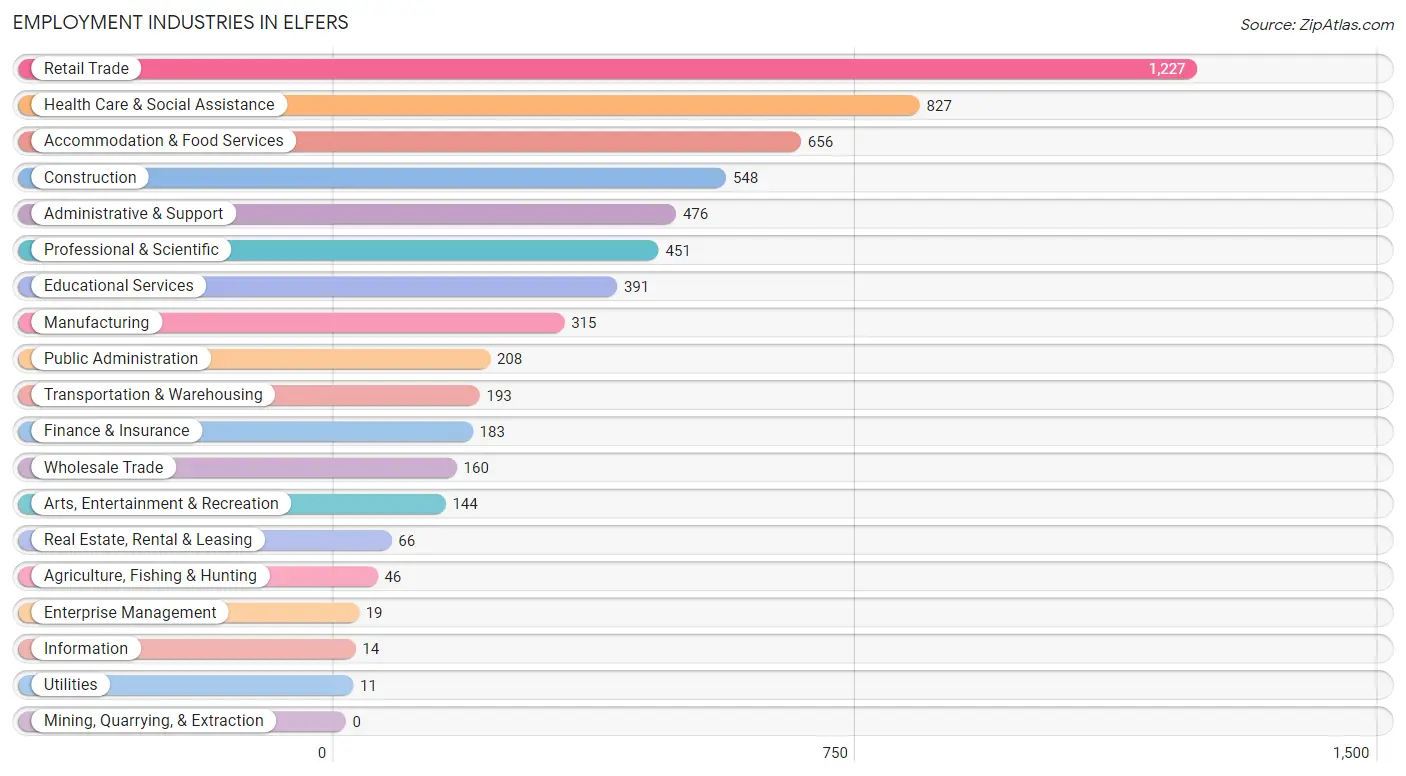
Employment Industries in Elfers
The major employment industries in Elfers include Retail Trade (1,227 | 19.8%), Health Care & Social Assistance (827 | 13.3%), Accommodation & Food Services (656 | 10.6%), Construction (548 | 8.8%), and Administrative & Support (476 | 7.7%).
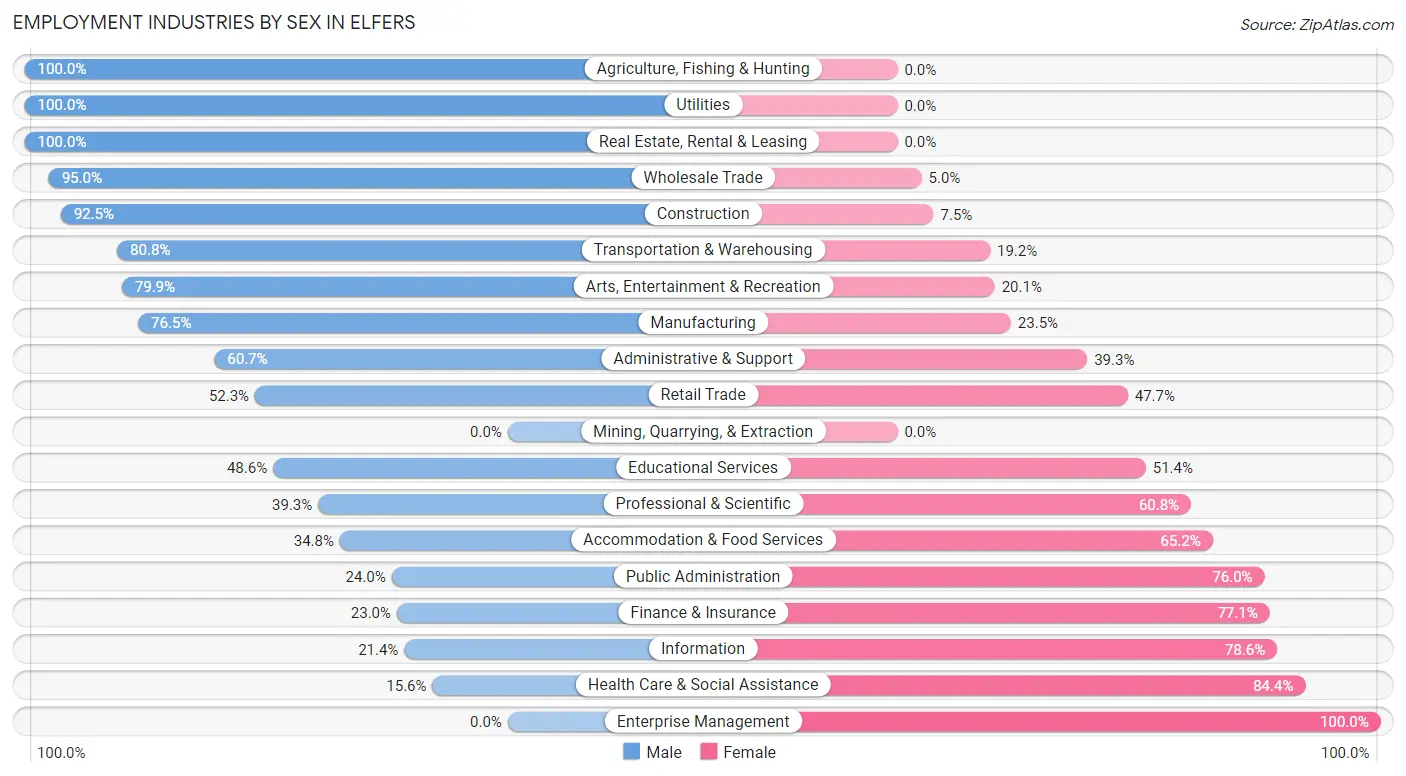
Employment Industries by Sex in Elfers
The Elfers industries that see more men than women are Agriculture, Fishing & Hunting (100.0%), Utilities (100.0%), and Real Estate, Rental & Leasing (100.0%), whereas the industries that tend to have a higher number of women are Enterprise Management (100.0%), Health Care & Social Assistance (84.4%), and Information (78.6%).
| Industry | Male | Female |
| Agriculture, Fishing & Hunting | 46 (100.0%) | 0 (0.0%) |
| Mining, Quarrying, & Extraction | 0 (0.0%) | 0 (0.0%) |
| Construction | 507 (92.5%) | 41 (7.5%) |
| Manufacturing | 241 (76.5%) | 74 (23.5%) |
| Wholesale Trade | 152 (95.0%) | 8 (5.0%) |
| Retail Trade | 642 (52.3%) | 585 (47.7%) |
| Transportation & Warehousing | 156 (80.8%) | 37 (19.2%) |
| Utilities | 11 (100.0%) | 0 (0.0%) |
| Information | 3 (21.4%) | 11 (78.6%) |
| Finance & Insurance | 42 (23.0%) | 141 (77.0%) |
| Real Estate, Rental & Leasing | 66 (100.0%) | 0 (0.0%) |
| Professional & Scientific | 177 (39.3%) | 274 (60.8%) |
| Enterprise Management | 0 (0.0%) | 19 (100.0%) |
| Administrative & Support | 289 (60.7%) | 187 (39.3%) |
| Educational Services | 190 (48.6%) | 201 (51.4%) |
| Health Care & Social Assistance | 129 (15.6%) | 698 (84.4%) |
| Arts, Entertainment & Recreation | 115 (79.9%) | 29 (20.1%) |
| Accommodation & Food Services | 228 (34.8%) | 428 (65.2%) |
| Public Administration | 50 (24.0%) | 158 (76.0%) |
| Total | 3,213 (51.7%) | 2,997 (48.3%) |
Education in Elfers
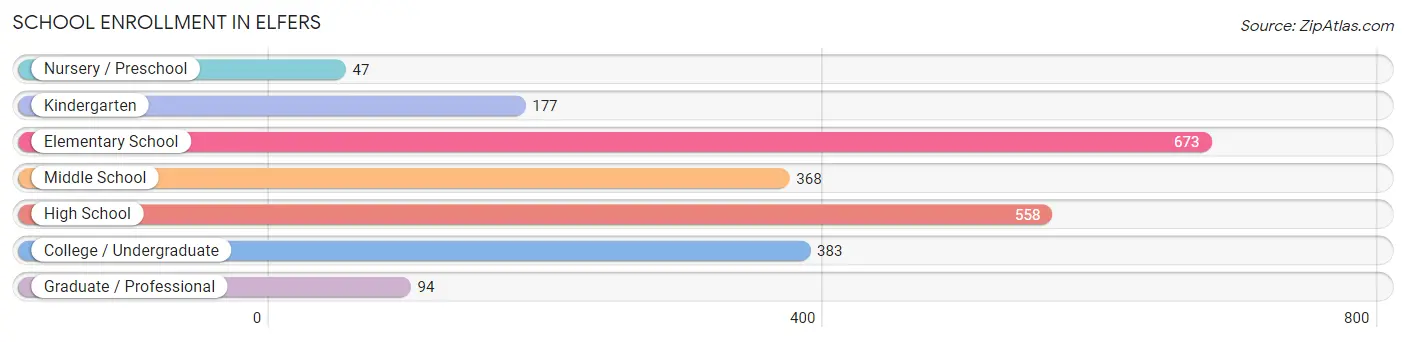
School Enrollment in Elfers
The most common levels of schooling among the 2,300 students in Elfers are elementary school (673 | 29.3%), high school (558 | 24.3%), and college / undergraduate (383 | 16.7%).
| School Level | # Students | % Students |
| Nursery / Preschool | 47 | 2.0% |
| Kindergarten | 177 | 7.7% |
| Elementary School | 673 | 29.3% |
| Middle School | 368 | 16.0% |
| High School | 558 | 24.3% |
| College / Undergraduate | 383 | 16.7% |
| Graduate / Professional | 94 | 4.1% |
| Total | 2,300 | 100.0% |
School Enrollment by Age by Funding Source in Elfers
Out of a total of 2,300 students who are enrolled in schools in Elfers, 225 (9.8%) attend a private institution, while the remaining 2,075 (90.2%) are enrolled in public schools. The age group of 15 to 17 year olds has the highest likelihood of being enrolled in private schools, with 92 (18.6% in the age bracket) enrolled. Conversely, the age group of 3 to 4 year olds has the lowest likelihood of being enrolled in a private school, with 38 (100.0% in the age bracket) attending a public institution.
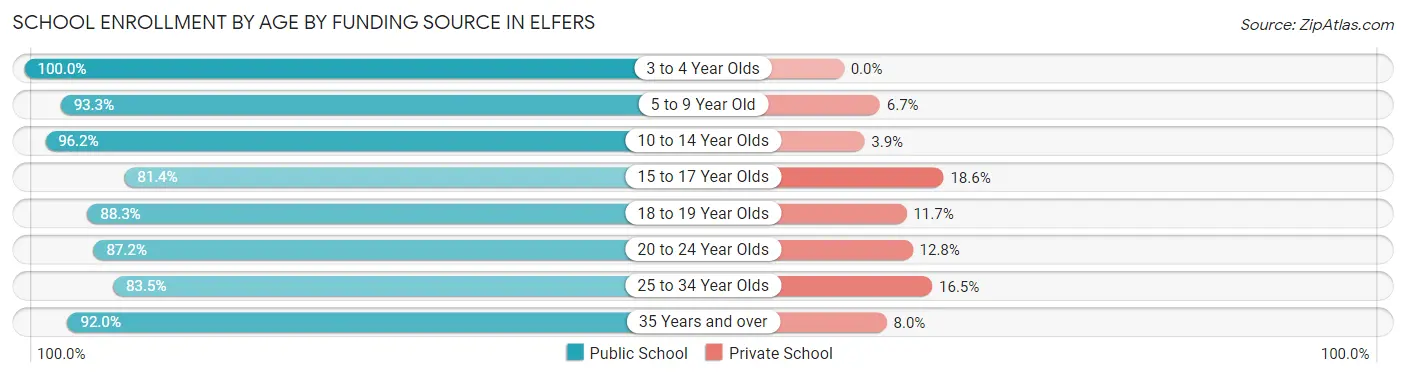
| Age Bracket | Public School | Private School |
| 3 to 4 Year Olds | 38 (100.0%) | 0 (0.0%) |
| 5 to 9 Year Old | 720 (93.3%) | 52 (6.7%) |
| 10 to 14 Year Olds | 424 (96.2%) | 17 (3.8%) |
| 15 to 17 Year Olds | 403 (81.4%) | 92 (18.6%) |
| 18 to 19 Year Olds | 151 (88.3%) | 20 (11.7%) |
| 20 to 24 Year Olds | 129 (87.2%) | 19 (12.8%) |
| 25 to 34 Year Olds | 71 (83.5%) | 14 (16.5%) |
| 35 Years and over | 138 (92.0%) | 12 (8.0%) |
| Total | 2,075 (90.2%) | 225 (9.8%) |
Educational Attainment by Field of Study in Elfers
Business (401 | 29.6%), education (185 | 13.6%), science & technology (153 | 11.3%), liberal arts & history (114 | 8.4%), and visual & performing arts (101 | 7.4%) are the most common fields of study among 1,356 individuals in Elfers who have obtained a bachelor's degree or higher.
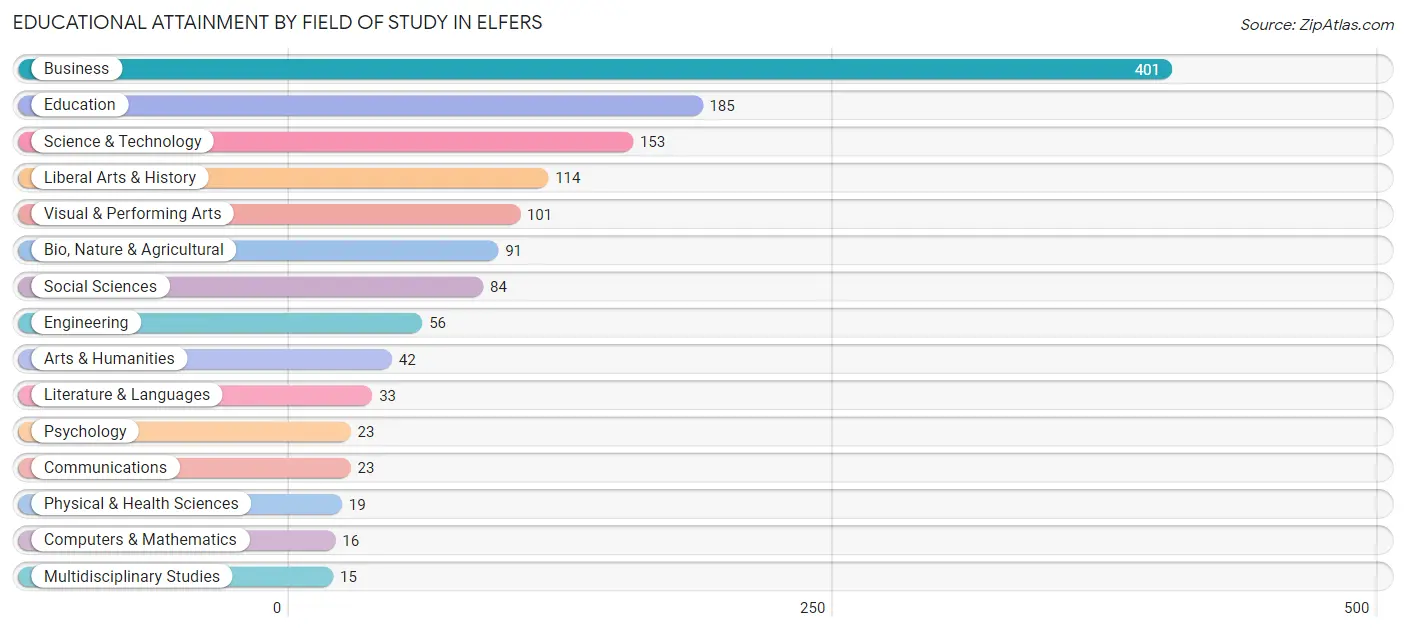
| Field of Study | # Graduates | % Graduates |
| Computers & Mathematics | 16 | 1.2% |
| Bio, Nature & Agricultural | 91 | 6.7% |
| Physical & Health Sciences | 19 | 1.4% |
| Psychology | 23 | 1.7% |
| Social Sciences | 84 | 6.2% |
| Engineering | 56 | 4.1% |
| Multidisciplinary Studies | 15 | 1.1% |
| Science & Technology | 153 | 11.3% |
| Business | 401 | 29.6% |
| Education | 185 | 13.6% |
| Literature & Languages | 33 | 2.4% |
| Liberal Arts & History | 114 | 8.4% |
| Visual & Performing Arts | 101 | 7.4% |
| Communications | 23 | 1.7% |
| Arts & Humanities | 42 | 3.1% |
| Total | 1,356 | 100.0% |
Transportation & Commute in Elfers
Vehicle Availability by Sex in Elfers
The most prevalent vehicle ownership categories in Elfers are males with 2 vehicles (1,599, accounting for 50.6%) and females with 2 vehicles (1,269, making up 53.7%).
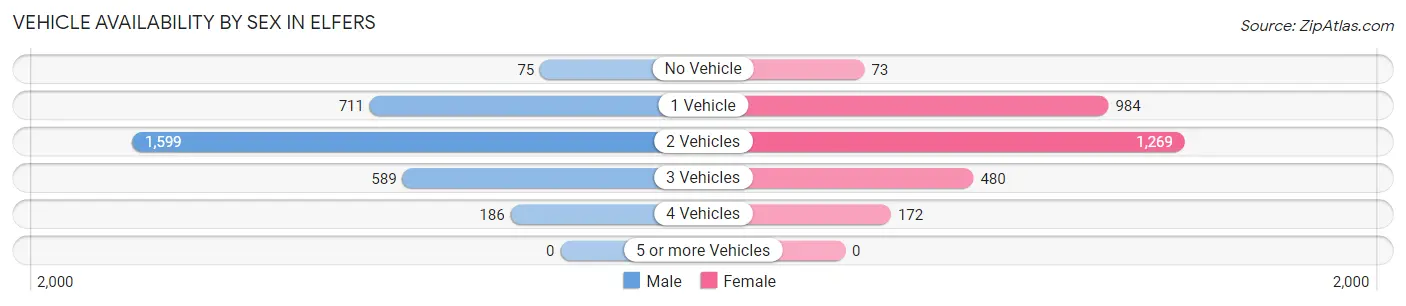
| Vehicles Available | Male | Female |
| No Vehicle | 75 (2.4%) | 73 (2.5%) |
| 1 Vehicle | 711 (22.5%) | 984 (33.0%) |
| 2 Vehicles | 1,599 (50.6%) | 1,269 (42.6%) |
| 3 Vehicles | 589 (18.6%) | 480 (16.1%) |
| 4 Vehicles | 186 (5.9%) | 172 (5.8%) |
| 5 or more Vehicles | 0 (0.0%) | 0 (0.0%) |
| Total | 3,160 (100.0%) | 2,978 (100.0%) |
Commute Time in Elfers
The most frequently occuring commute durations in Elfers are 20 to 24 minutes (1,059 commuters, 19.0%), 15 to 19 minutes (831 commuters, 14.9%), and 45 to 59 minutes (693 commuters, 12.5%).
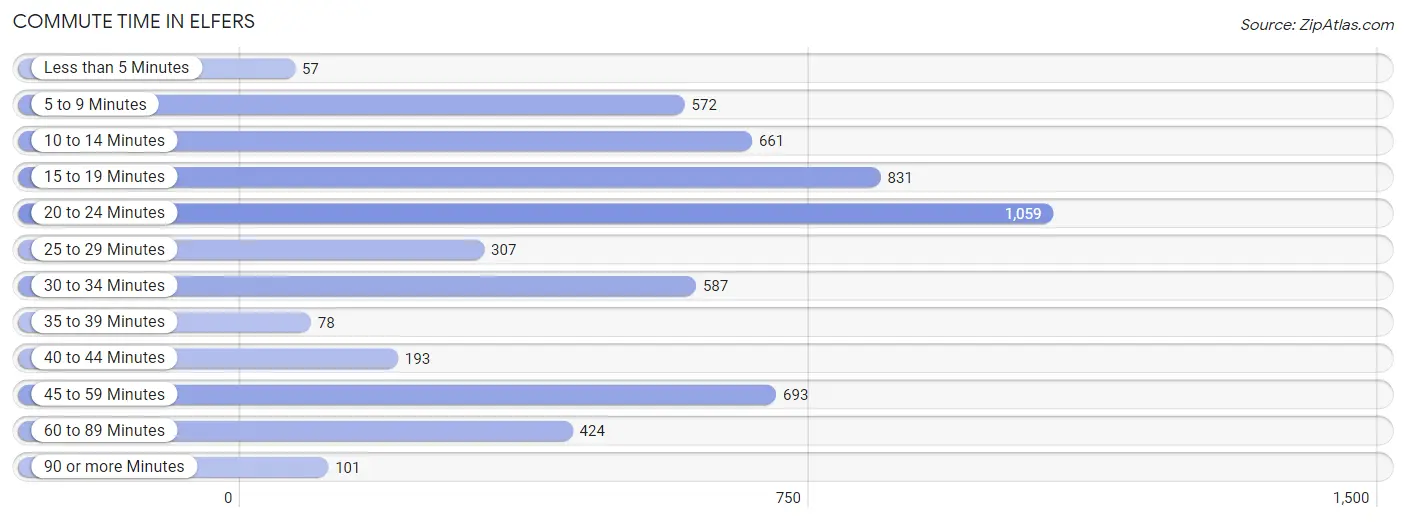
| Commute Time | # Commuters | % Commuters |
| Less than 5 Minutes | 57 | 1.0% |
| 5 to 9 Minutes | 572 | 10.3% |
| 10 to 14 Minutes | 661 | 11.9% |
| 15 to 19 Minutes | 831 | 14.9% |
| 20 to 24 Minutes | 1,059 | 19.0% |
| 25 to 29 Minutes | 307 | 5.5% |
| 30 to 34 Minutes | 587 | 10.5% |
| 35 to 39 Minutes | 78 | 1.4% |
| 40 to 44 Minutes | 193 | 3.5% |
| 45 to 59 Minutes | 693 | 12.5% |
| 60 to 89 Minutes | 424 | 7.6% |
| 90 or more Minutes | 101 | 1.8% |
Commute Time by Sex in Elfers
The most common commute times in Elfers are 15 to 19 minutes (511 commuters, 17.3%) for males and 20 to 24 minutes (642 commuters, 24.5%) for females.
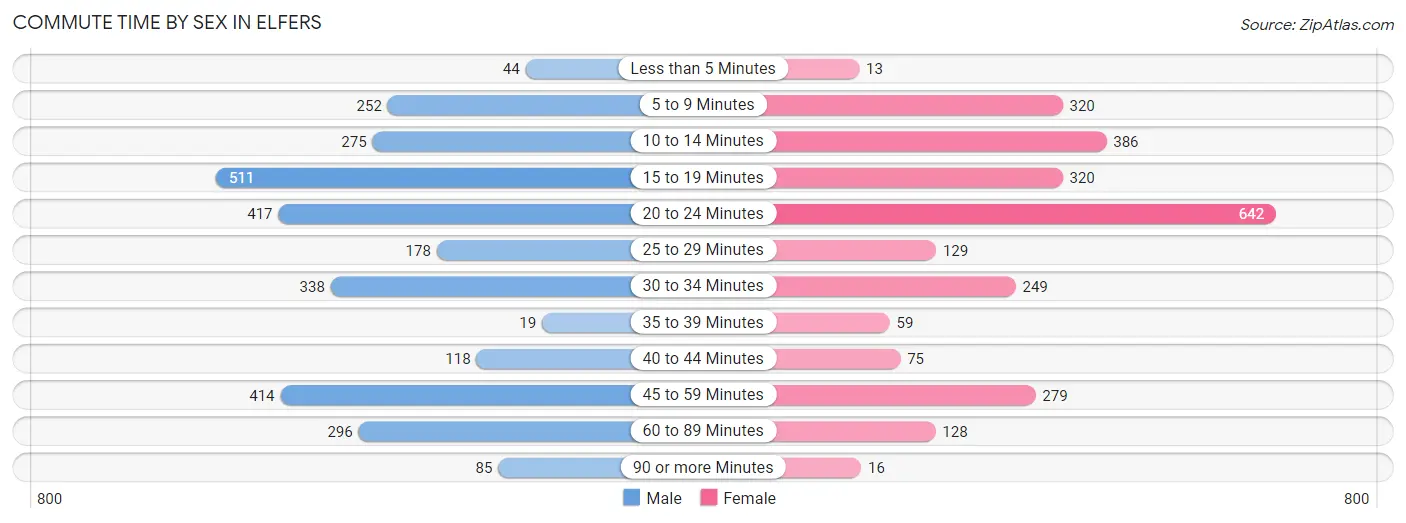
| Commute Time | Male | Female |
| Less than 5 Minutes | 44 (1.5%) | 13 (0.5%) |
| 5 to 9 Minutes | 252 (8.6%) | 320 (12.2%) |
| 10 to 14 Minutes | 275 (9.3%) | 386 (14.8%) |
| 15 to 19 Minutes | 511 (17.3%) | 320 (12.2%) |
| 20 to 24 Minutes | 417 (14.1%) | 642 (24.5%) |
| 25 to 29 Minutes | 178 (6.0%) | 129 (4.9%) |
| 30 to 34 Minutes | 338 (11.5%) | 249 (9.5%) |
| 35 to 39 Minutes | 19 (0.6%) | 59 (2.3%) |
| 40 to 44 Minutes | 118 (4.0%) | 75 (2.9%) |
| 45 to 59 Minutes | 414 (14.1%) | 279 (10.7%) |
| 60 to 89 Minutes | 296 (10.0%) | 128 (4.9%) |
| 90 or more Minutes | 85 (2.9%) | 16 (0.6%) |
Time of Departure to Work by Sex in Elfers
The most frequent times of departure to work in Elfers are 7:00 AM to 7:29 AM (430, 14.6%) for males and 8:00 AM to 8:29 AM (440, 16.8%) for females.
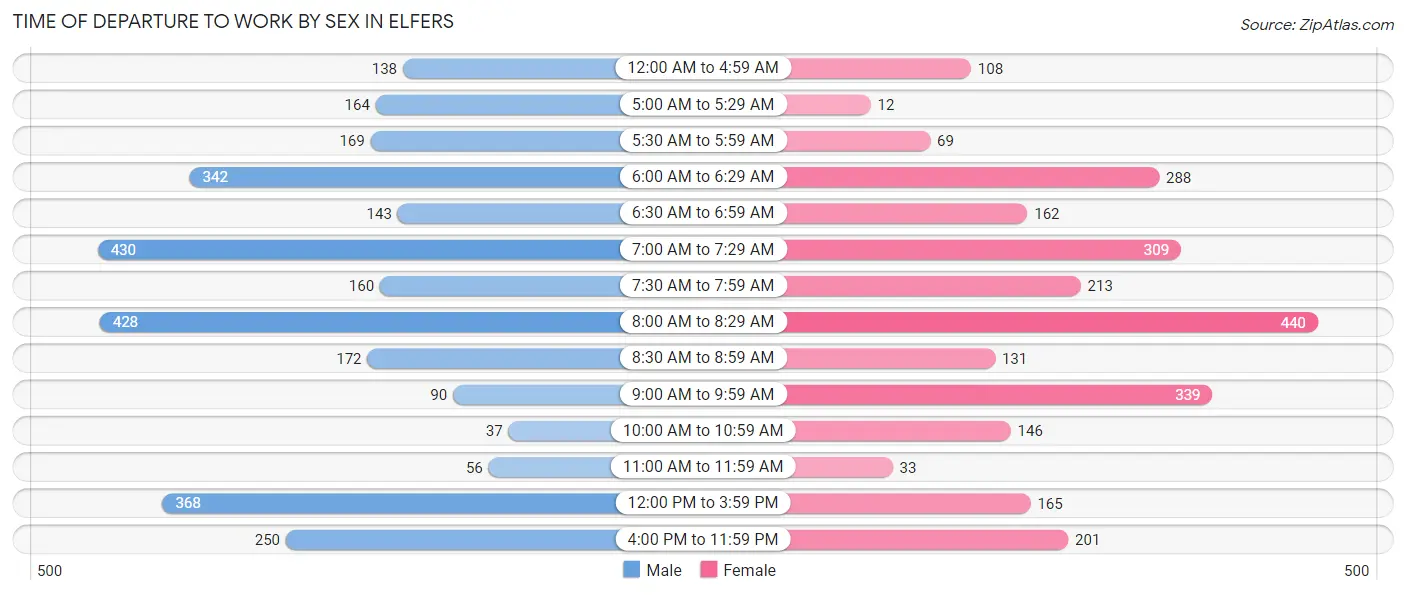
| Time of Departure | Male | Female |
| 12:00 AM to 4:59 AM | 138 (4.7%) | 108 (4.1%) |
| 5:00 AM to 5:29 AM | 164 (5.6%) | 12 (0.5%) |
| 5:30 AM to 5:59 AM | 169 (5.7%) | 69 (2.6%) |
| 6:00 AM to 6:29 AM | 342 (11.6%) | 288 (11.0%) |
| 6:30 AM to 6:59 AM | 143 (4.9%) | 162 (6.2%) |
| 7:00 AM to 7:29 AM | 430 (14.6%) | 309 (11.8%) |
| 7:30 AM to 7:59 AM | 160 (5.4%) | 213 (8.1%) |
| 8:00 AM to 8:29 AM | 428 (14.5%) | 440 (16.8%) |
| 8:30 AM to 8:59 AM | 172 (5.8%) | 131 (5.0%) |
| 9:00 AM to 9:59 AM | 90 (3.0%) | 339 (13.0%) |
| 10:00 AM to 10:59 AM | 37 (1.3%) | 146 (5.6%) |
| 11:00 AM to 11:59 AM | 56 (1.9%) | 33 (1.3%) |
| 12:00 PM to 3:59 PM | 368 (12.5%) | 165 (6.3%) |
| 4:00 PM to 11:59 PM | 250 (8.5%) | 201 (7.7%) |
| Total | 2,947 (100.0%) | 2,616 (100.0%) |
Housing Occupancy in Elfers
Occupancy by Ownership in Elfers
Of the total 5,452 dwellings in Elfers, owner-occupied units account for 3,292 (60.4%), while renter-occupied units make up 2,160 (39.6%).
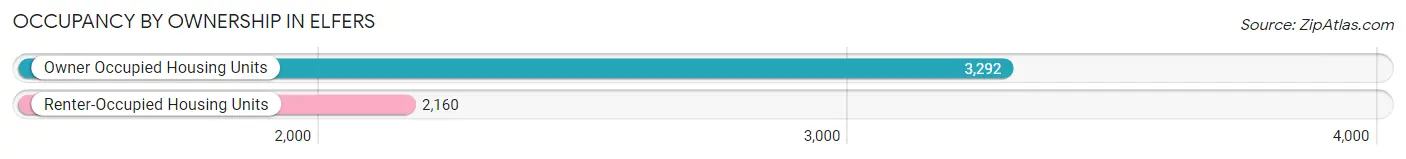
| Occupancy | # Housing Units | % Housing Units |
| Owner Occupied Housing Units | 3,292 | 60.4% |
| Renter-Occupied Housing Units | 2,160 | 39.6% |
| Total Occupied Housing Units | 5,452 | 100.0% |
Occupancy by Household Size in Elfers
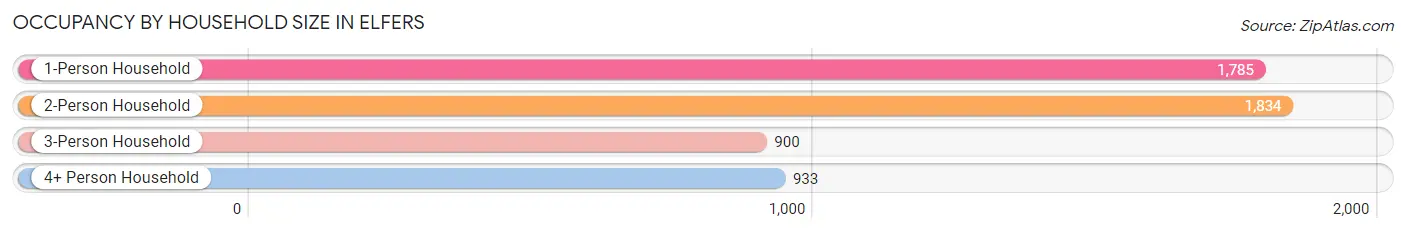
| Household Size | # Housing Units | % Housing Units |
| 1-Person Household | 1,785 | 32.7% |
| 2-Person Household | 1,834 | 33.6% |
| 3-Person Household | 900 | 16.5% |
| 4+ Person Household | 933 | 17.1% |
| Total Housing Units | 5,452 | 100.0% |
Occupancy by Ownership by Household Size in Elfers
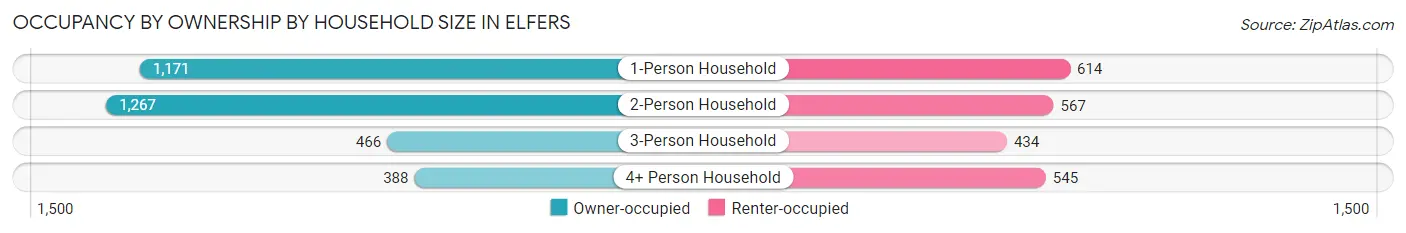
| Household Size | Owner-occupied | Renter-occupied |
| 1-Person Household | 1,171 (65.6%) | 614 (34.4%) |
| 2-Person Household | 1,267 (69.1%) | 567 (30.9%) |
| 3-Person Household | 466 (51.8%) | 434 (48.2%) |
| 4+ Person Household | 388 (41.6%) | 545 (58.4%) |
| Total Housing Units | 3,292 (60.4%) | 2,160 (39.6%) |
Occupancy by Educational Attainment in Elfers
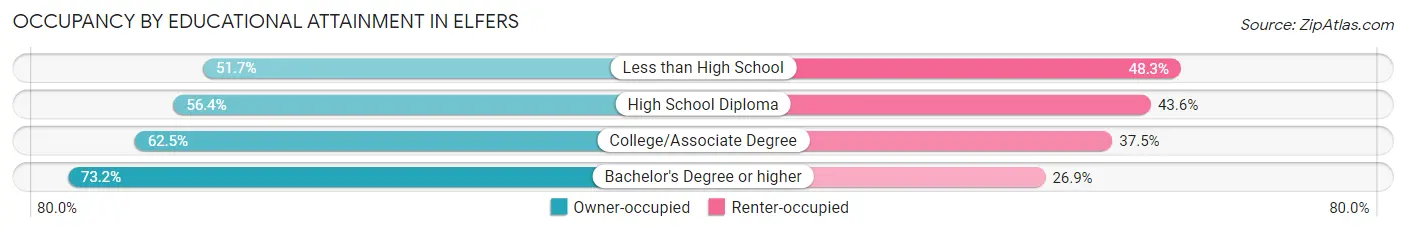
| Household Size | Owner-occupied | Renter-occupied |
| Less than High School | 261 (51.7%) | 244 (48.3%) |
| High School Diploma | 1,289 (56.4%) | 996 (43.6%) |
| College/Associate Degree | 1,208 (62.5%) | 724 (37.5%) |
| Bachelor's Degree or higher | 534 (73.2%) | 196 (26.9%) |
Occupancy by Age of Householder in Elfers
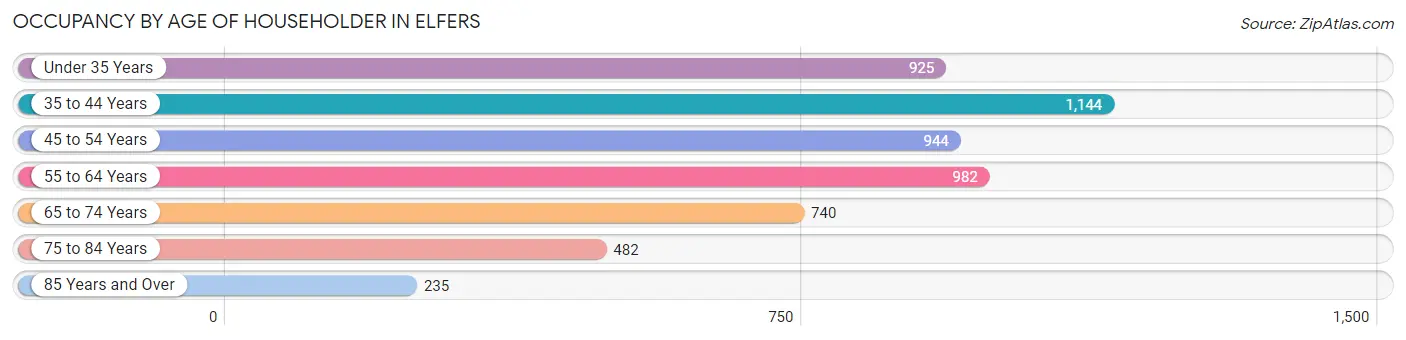
| Age Bracket | # Households | % Households |
| Under 35 Years | 925 | 17.0% |
| 35 to 44 Years | 1,144 | 21.0% |
| 45 to 54 Years | 944 | 17.3% |
| 55 to 64 Years | 982 | 18.0% |
| 65 to 74 Years | 740 | 13.6% |
| 75 to 84 Years | 482 | 8.8% |
| 85 Years and Over | 235 | 4.3% |
| Total | 5,452 | 100.0% |
Housing Finances in Elfers
Median Income by Occupancy in Elfers
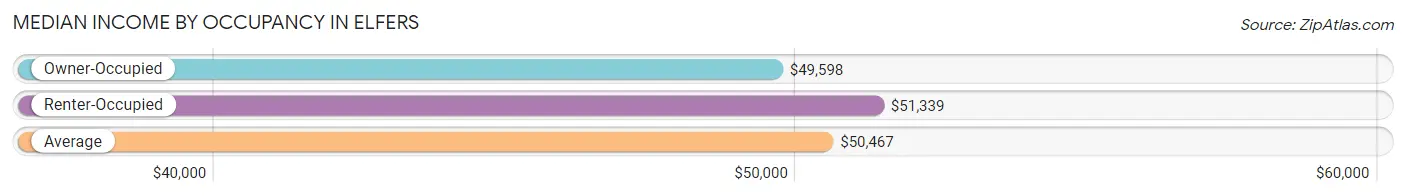
| Occupancy Type | # Households | Median Income |
| Owner-Occupied | 3,292 (60.4%) | $49,598 |
| Renter-Occupied | 2,160 (39.6%) | $51,339 |
| Average | 5,452 (100.0%) | $50,467 |
Occupancy by Householder Income Bracket in Elfers
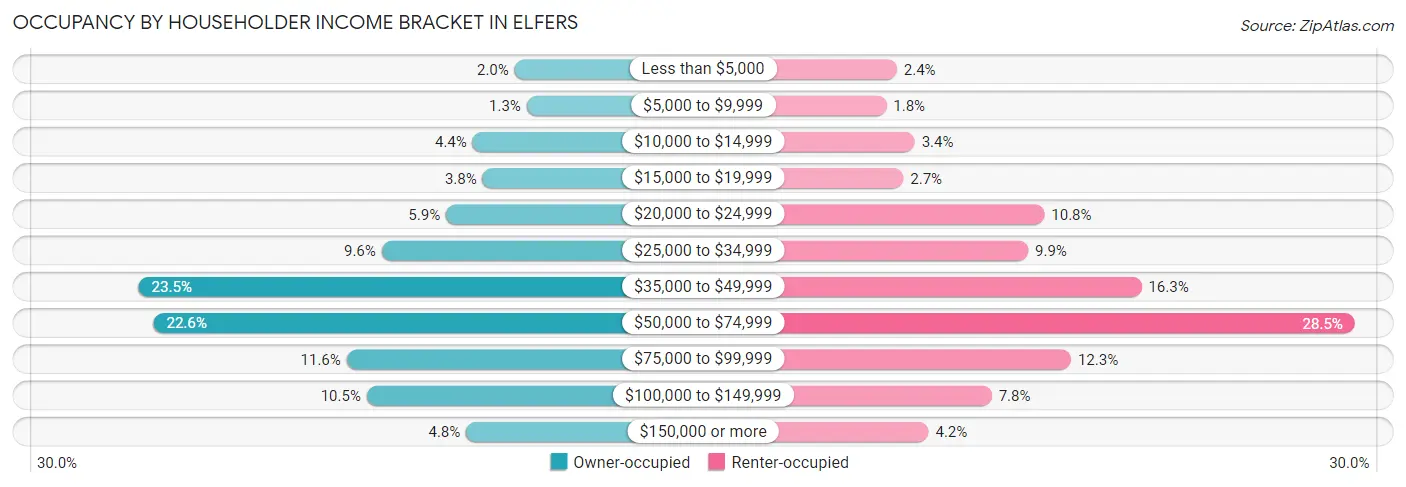
| Income Bracket | Owner-occupied | Renter-occupied |
| Less than $5,000 | 66 (2.0%) | 51 (2.4%) |
| $5,000 to $9,999 | 43 (1.3%) | 38 (1.8%) |
| $10,000 to $14,999 | 145 (4.4%) | 73 (3.4%) |
| $15,000 to $19,999 | 126 (3.8%) | 59 (2.7%) |
| $20,000 to $24,999 | 195 (5.9%) | 233 (10.8%) |
| $25,000 to $34,999 | 316 (9.6%) | 213 (9.9%) |
| $35,000 to $49,999 | 773 (23.5%) | 353 (16.3%) |
| $50,000 to $74,999 | 745 (22.6%) | 616 (28.5%) |
| $75,000 to $99,999 | 382 (11.6%) | 266 (12.3%) |
| $100,000 to $149,999 | 344 (10.4%) | 168 (7.8%) |
| $150,000 or more | 157 (4.8%) | 90 (4.2%) |
| Total | 3,292 (100.0%) | 2,160 (100.0%) |
Monthly Housing Cost Tiers in Elfers
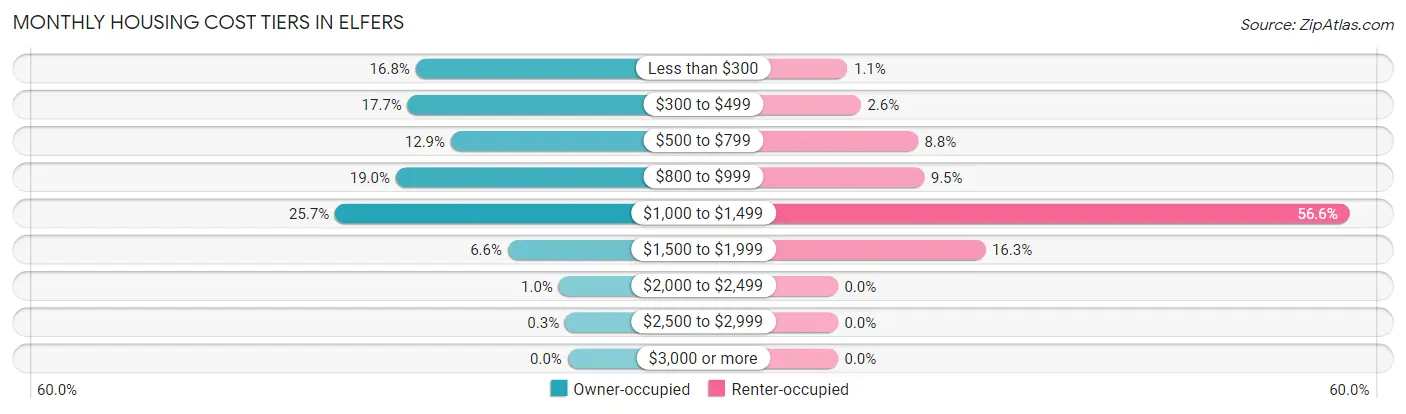
| Monthly Cost | Owner-occupied | Renter-occupied |
| Less than $300 | 553 (16.8%) | 23 (1.1%) |
| $300 to $499 | 582 (17.7%) | 55 (2.5%) |
| $500 to $799 | 425 (12.9%) | 191 (8.8%) |
| $800 to $999 | 625 (19.0%) | 206 (9.5%) |
| $1,000 to $1,499 | 846 (25.7%) | 1,222 (56.6%) |
| $1,500 to $1,999 | 218 (6.6%) | 352 (16.3%) |
| $2,000 to $2,499 | 33 (1.0%) | 0 (0.0%) |
| $2,500 to $2,999 | 10 (0.3%) | 0 (0.0%) |
| $3,000 or more | 0 (0.0%) | 0 (0.0%) |
| Total | 3,292 (100.0%) | 2,160 (100.0%) |
Physical Housing Characteristics in Elfers
Housing Structures in Elfers
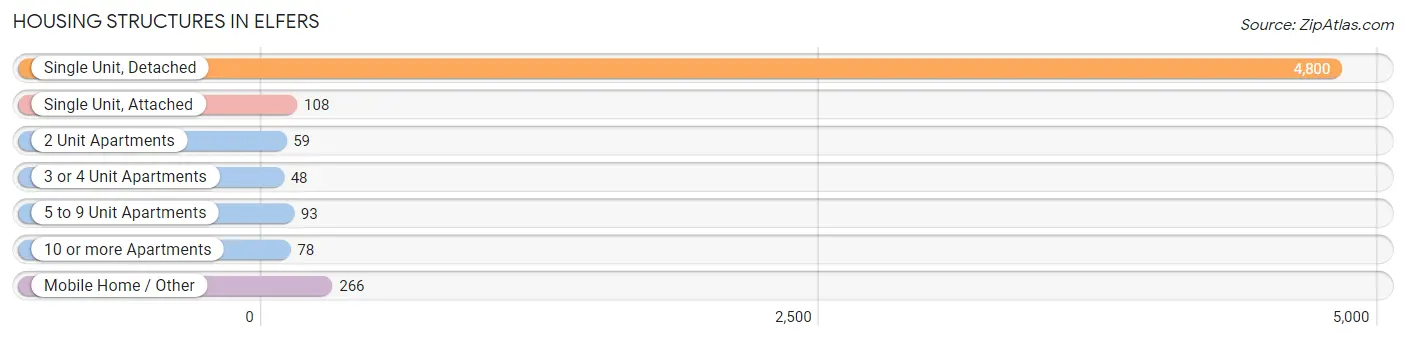
| Structure Type | # Housing Units | % Housing Units |
| Single Unit, Detached | 4,800 | 88.0% |
| Single Unit, Attached | 108 | 2.0% |
| 2 Unit Apartments | 59 | 1.1% |
| 3 or 4 Unit Apartments | 48 | 0.9% |
| 5 to 9 Unit Apartments | 93 | 1.7% |
| 10 or more Apartments | 78 | 1.4% |
| Mobile Home / Other | 266 | 4.9% |
| Total | 5,452 | 100.0% |
Housing Structures by Occupancy in Elfers
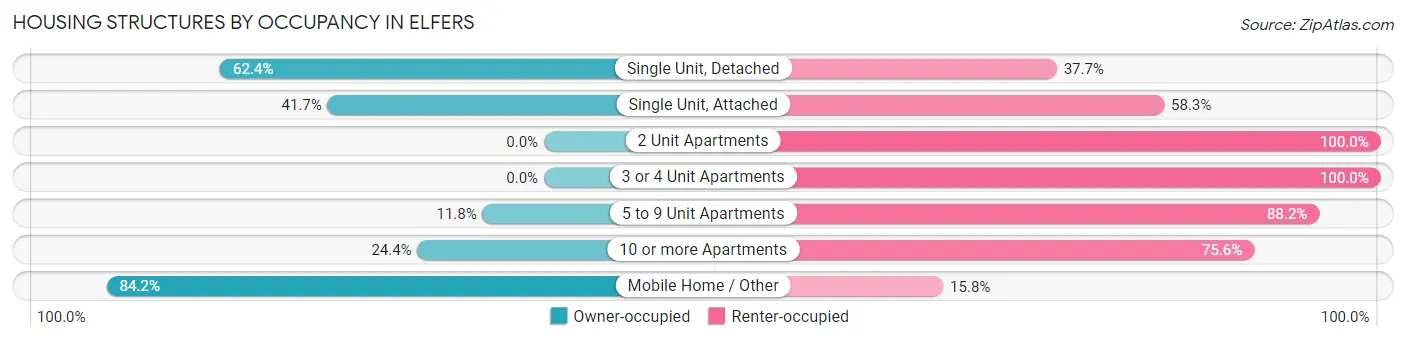
| Structure Type | Owner-occupied | Renter-occupied |
| Single Unit, Detached | 2,993 (62.4%) | 1,807 (37.7%) |
| Single Unit, Attached | 45 (41.7%) | 63 (58.3%) |
| 2 Unit Apartments | 0 (0.0%) | 59 (100.0%) |
| 3 or 4 Unit Apartments | 0 (0.0%) | 48 (100.0%) |
| 5 to 9 Unit Apartments | 11 (11.8%) | 82 (88.2%) |
| 10 or more Apartments | 19 (24.4%) | 59 (75.6%) |
| Mobile Home / Other | 224 (84.2%) | 42 (15.8%) |
| Total | 3,292 (60.4%) | 2,160 (39.6%) |
Housing Structures by Number of Rooms in Elfers
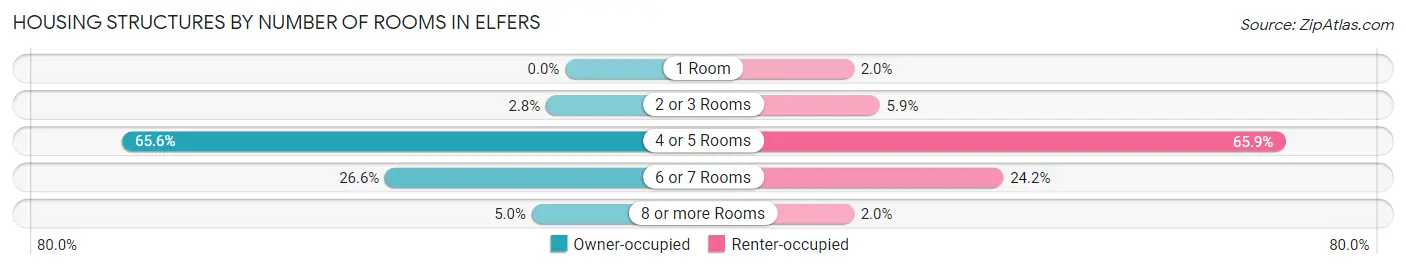
| Number of Rooms | Owner-occupied | Renter-occupied |
| 1 Room | 0 (0.0%) | 44 (2.0%) |
| 2 or 3 Rooms | 93 (2.8%) | 127 (5.9%) |
| 4 or 5 Rooms | 2,159 (65.6%) | 1,423 (65.9%) |
| 6 or 7 Rooms | 877 (26.6%) | 522 (24.2%) |
| 8 or more Rooms | 163 (5.0%) | 44 (2.0%) |
| Total | 3,292 (100.0%) | 2,160 (100.0%) |
Housing Structure by Heating Type in Elfers
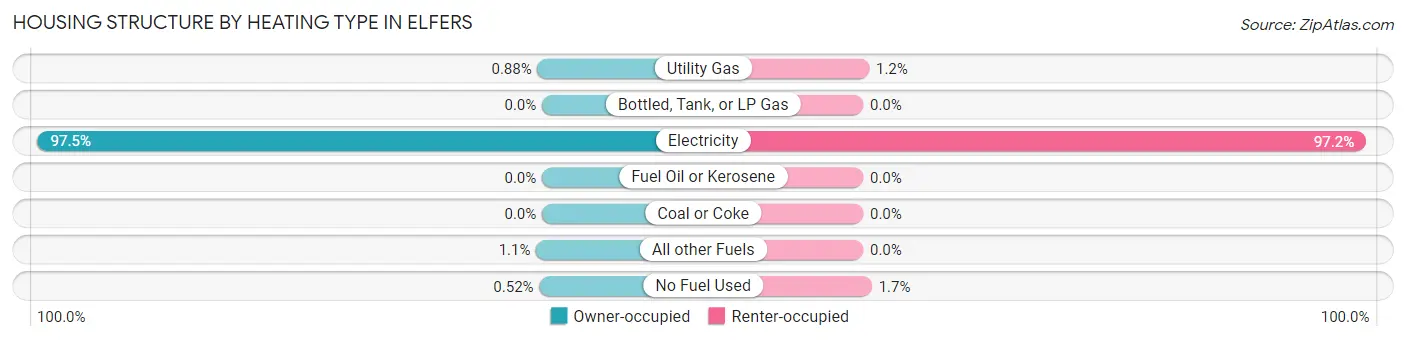
| Heating Type | Owner-occupied | Renter-occupied |
| Utility Gas | 29 (0.9%) | 25 (1.2%) |
| Bottled, Tank, or LP Gas | 0 (0.0%) | 0 (0.0%) |
| Electricity | 3,209 (97.5%) | 2,099 (97.2%) |
| Fuel Oil or Kerosene | 0 (0.0%) | 0 (0.0%) |
| Coal or Coke | 0 (0.0%) | 0 (0.0%) |
| All other Fuels | 37 (1.1%) | 0 (0.0%) |
| No Fuel Used | 17 (0.5%) | 36 (1.7%) |
| Total | 3,292 (100.0%) | 2,160 (100.0%) |
Household Vehicle Usage in Elfers
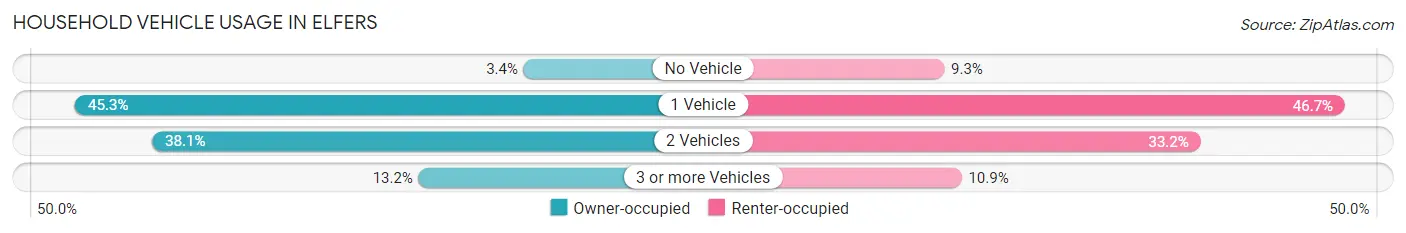
| Vehicles per Household | Owner-occupied | Renter-occupied |
| No Vehicle | 112 (3.4%) | 200 (9.3%) |
| 1 Vehicle | 1,491 (45.3%) | 1,008 (46.7%) |
| 2 Vehicles | 1,254 (38.1%) | 717 (33.2%) |
| 3 or more Vehicles | 435 (13.2%) | 235 (10.9%) |
| Total | 3,292 (100.0%) | 2,160 (100.0%) |
Real Estate & Mortgages in Elfers
Real Estate and Mortgage Overview in Elfers
| Characteristic | Without Mortgage | With Mortgage |
| Housing Units | 1,364 | 1,928 |
| Median Property Value | $129,900 | $145,200 |
| Median Household Income | $39,803 | $89 |
| Monthly Housing Costs | $330 | $0 |
| Real Estate Taxes | $760 | $34 |
Property Value by Mortgage Status in Elfers
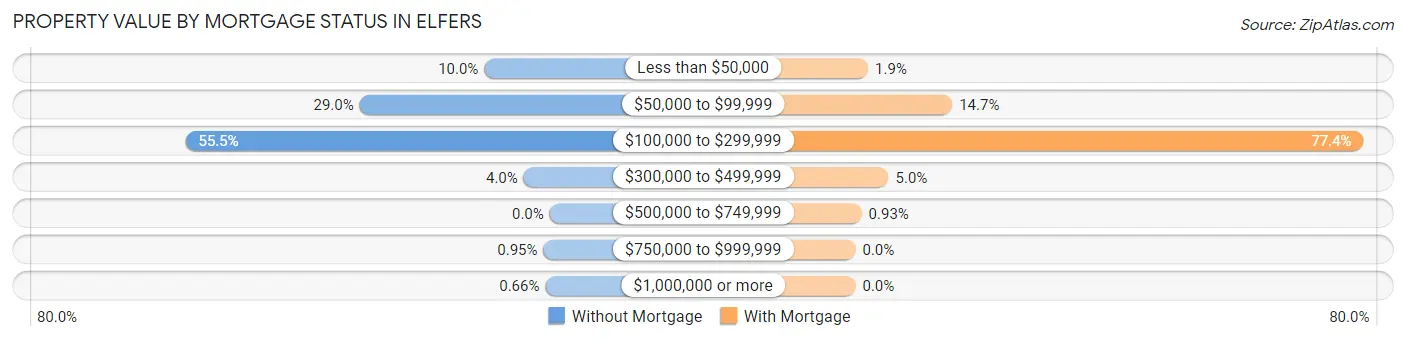
| Property Value | Without Mortgage | With Mortgage |
| Less than $50,000 | 136 (10.0%) | 37 (1.9%) |
| $50,000 to $99,999 | 395 (29.0%) | 284 (14.7%) |
| $100,000 to $299,999 | 757 (55.5%) | 1,492 (77.4%) |
| $300,000 to $499,999 | 54 (4.0%) | 97 (5.0%) |
| $500,000 to $749,999 | 0 (0.0%) | 18 (0.9%) |
| $750,000 to $999,999 | 13 (0.9%) | 0 (0.0%) |
| $1,000,000 or more | 9 (0.7%) | 0 (0.0%) |
| Total | 1,364 (100.0%) | 1,928 (100.0%) |
Household Income by Mortgage Status in Elfers
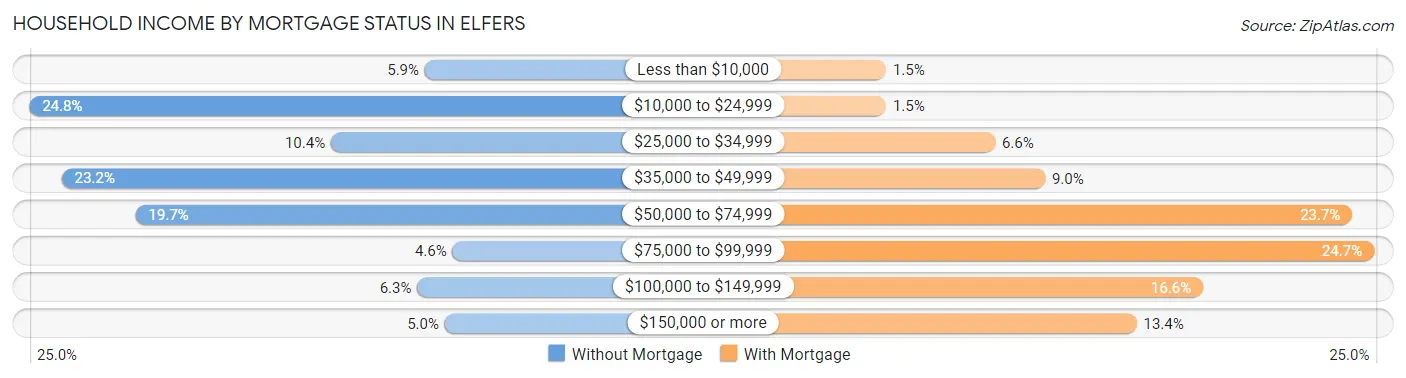
| Household Income | Without Mortgage | With Mortgage |
| Less than $10,000 | 81 (5.9%) | 28 (1.5%) |
| $10,000 to $24,999 | 338 (24.8%) | 28 (1.5%) |
| $25,000 to $34,999 | 142 (10.4%) | 128 (6.6%) |
| $35,000 to $49,999 | 317 (23.2%) | 174 (9.0%) |
| $50,000 to $74,999 | 269 (19.7%) | 456 (23.6%) |
| $75,000 to $99,999 | 63 (4.6%) | 476 (24.7%) |
| $100,000 to $149,999 | 86 (6.3%) | 319 (16.6%) |
| $150,000 or more | 68 (5.0%) | 258 (13.4%) |
| Total | 1,364 (100.0%) | 1,928 (100.0%) |
Property Value to Household Income Ratio in Elfers
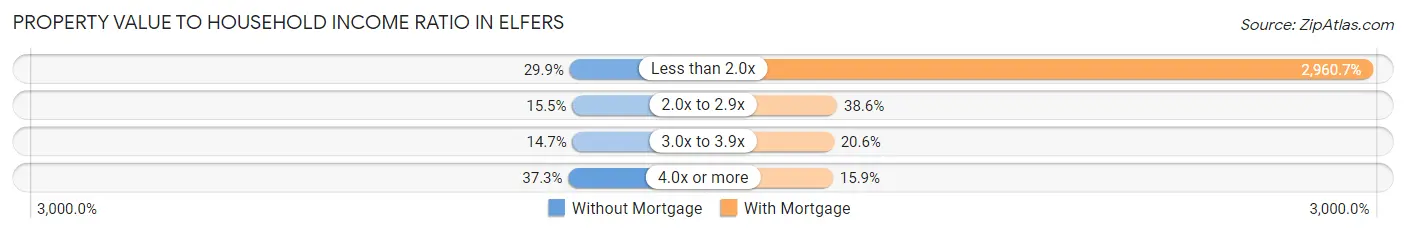
| Value-to-Income Ratio | Without Mortgage | With Mortgage |
| Less than 2.0x | 408 (29.9%) | 57,083 (2,960.7%) |
| 2.0x to 2.9x | 212 (15.5%) | 745 (38.6%) |
| 3.0x to 3.9x | 200 (14.7%) | 398 (20.6%) |
| 4.0x or more | 509 (37.3%) | 306 (15.9%) |
| Total | 1,364 (100.0%) | 1,928 (100.0%) |
Real Estate Taxes by Mortgage Status in Elfers
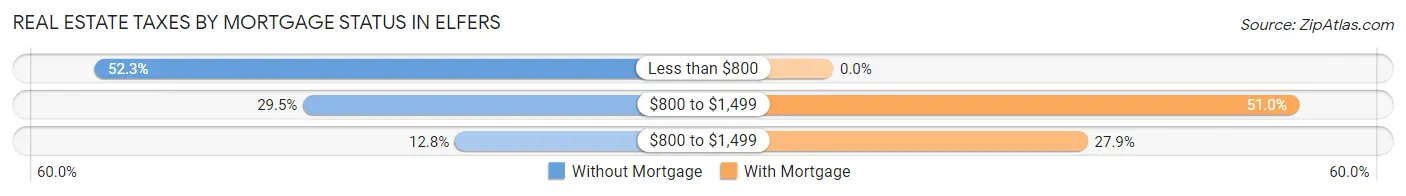
| Property Taxes | Without Mortgage | With Mortgage |
| Less than $800 | 713 (52.3%) | 0 (0.0%) |
| $800 to $1,499 | 402 (29.5%) | 984 (51.0%) |
| $800 to $1,499 | 175 (12.8%) | 538 (27.9%) |
| Total | 1,364 (100.0%) | 1,928 (100.0%) |
Health & Disability in Elfers
Health Insurance Coverage by Age in Elfers
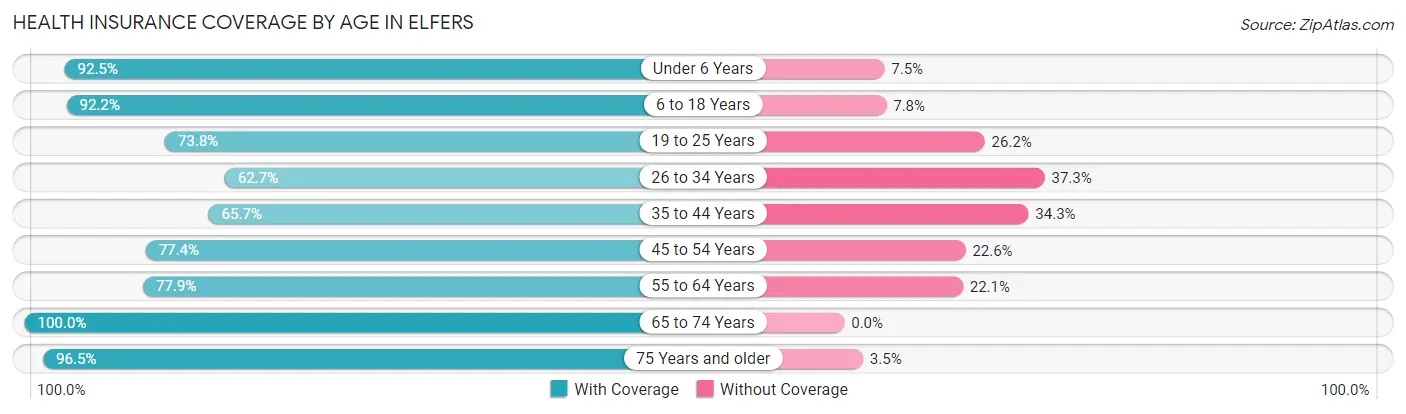
| Age Bracket | With Coverage | Without Coverage |
| Under 6 Years | 855 (92.5%) | 69 (7.5%) |
| 6 to 18 Years | 1,694 (92.2%) | 144 (7.8%) |
| 19 to 25 Years | 626 (73.8%) | 222 (26.2%) |
| 26 to 34 Years | 975 (62.7%) | 581 (37.3%) |
| 35 to 44 Years | 1,410 (65.7%) | 737 (34.3%) |
| 45 to 54 Years | 1,528 (77.4%) | 446 (22.6%) |
| 55 to 64 Years | 1,343 (77.9%) | 381 (22.1%) |
| 65 to 74 Years | 1,160 (100.0%) | 0 (0.0%) |
| 75 Years and older | 1,086 (96.5%) | 39 (3.5%) |
| Total | 10,677 (80.3%) | 2,619 (19.7%) |
Health Insurance Coverage by Citizenship Status in Elfers
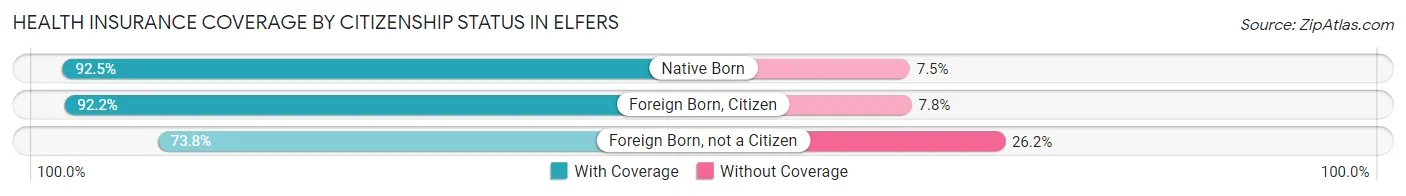
| Citizenship Status | With Coverage | Without Coverage |
| Native Born | 855 (92.5%) | 69 (7.5%) |
| Foreign Born, Citizen | 1,694 (92.2%) | 144 (7.8%) |
| Foreign Born, not a Citizen | 626 (73.8%) | 222 (26.2%) |
Health Insurance Coverage by Household Income in Elfers
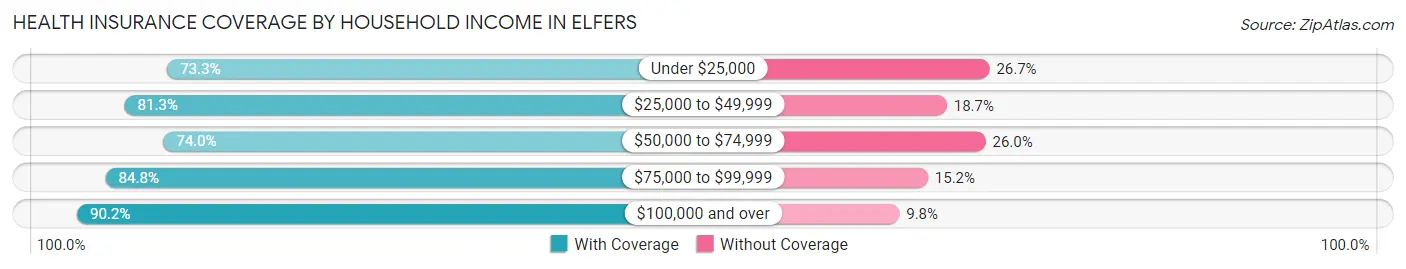
| Household Income | With Coverage | Without Coverage |
| Under $25,000 | 1,258 (73.3%) | 459 (26.7%) |
| $25,000 to $49,999 | 2,888 (81.3%) | 666 (18.7%) |
| $50,000 to $74,999 | 2,771 (74.0%) | 973 (26.0%) |
| $75,000 to $99,999 | 1,625 (84.8%) | 291 (15.2%) |
| $100,000 and over | 2,092 (90.2%) | 228 (9.8%) |
Public vs Private Health Insurance Coverage by Age in Elfers
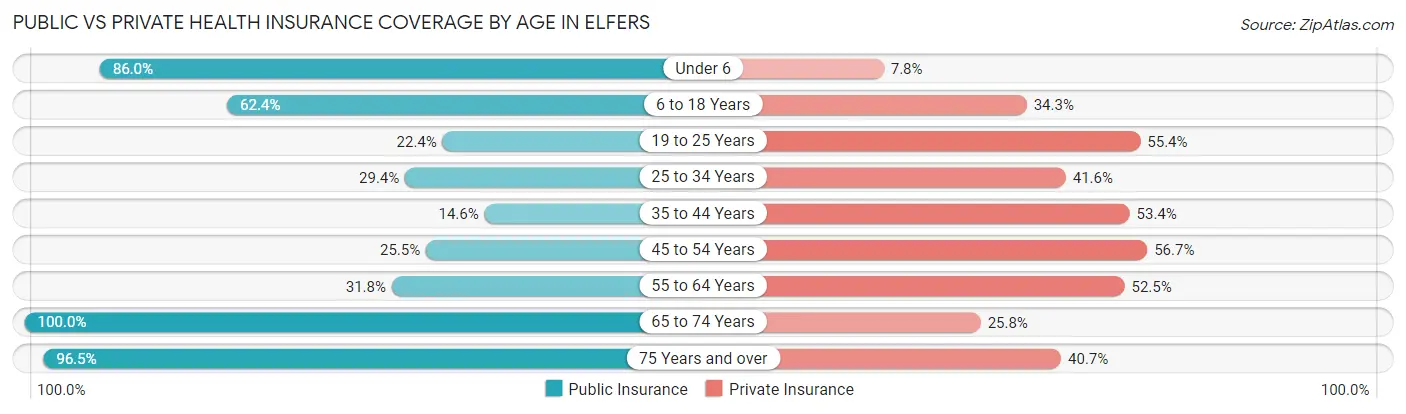
| Age Bracket | Public Insurance | Private Insurance |
| Under 6 | 795 (86.0%) | 72 (7.8%) |
| 6 to 18 Years | 1,147 (62.4%) | 631 (34.3%) |
| 19 to 25 Years | 190 (22.4%) | 470 (55.4%) |
| 25 to 34 Years | 457 (29.4%) | 647 (41.6%) |
| 35 to 44 Years | 314 (14.6%) | 1,147 (53.4%) |
| 45 to 54 Years | 503 (25.5%) | 1,119 (56.7%) |
| 55 to 64 Years | 549 (31.8%) | 905 (52.5%) |
| 65 to 74 Years | 1,160 (100.0%) | 299 (25.8%) |
| 75 Years and over | 1,086 (96.5%) | 458 (40.7%) |
| Total | 6,201 (46.6%) | 5,748 (43.2%) |
Disability Status by Sex by Age in Elfers
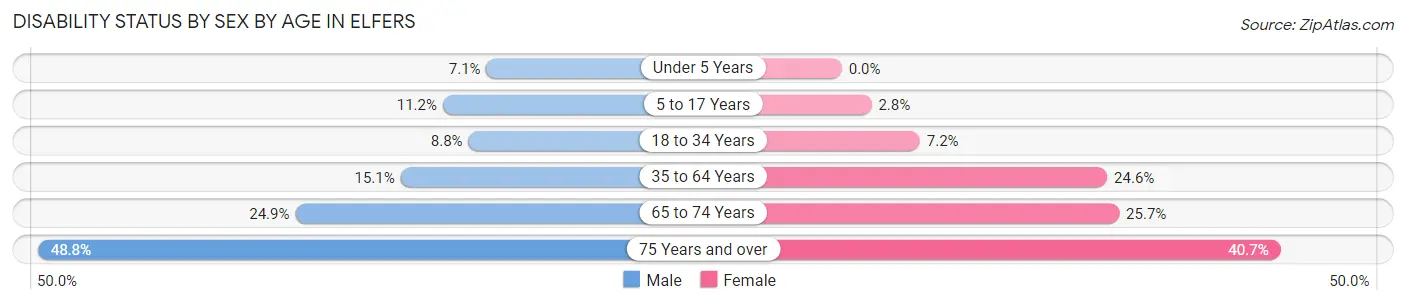
| Age Bracket | Male | Female |
| Under 5 Years | 30 (7.1%) | 0 (0.0%) |
| 5 to 17 Years | 115 (11.2%) | 23 (2.8%) |
| 18 to 34 Years | 99 (8.8%) | 103 (7.2%) |
| 35 to 64 Years | 449 (15.1%) | 708 (24.6%) |
| 65 to 74 Years | 104 (24.9%) | 191 (25.7%) |
| 75 Years and over | 218 (48.8%) | 276 (40.7%) |
Disability Class by Sex by Age in Elfers
Disability Class: Hearing Difficulty
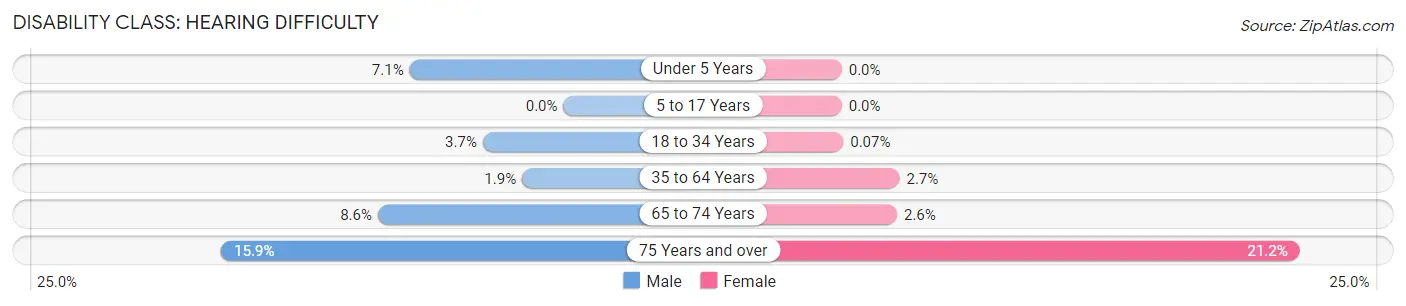
| Age Bracket | Male | Female |
| Under 5 Years | 30 (7.1%) | 0 (0.0%) |
| 5 to 17 Years | 0 (0.0%) | 0 (0.0%) |
| 18 to 34 Years | 42 (3.7%) | 1 (0.1%) |
| 35 to 64 Years | 57 (1.9%) | 77 (2.7%) |
| 65 to 74 Years | 36 (8.6%) | 19 (2.6%) |
| 75 Years and over | 71 (15.9%) | 144 (21.2%) |
Disability Class: Vision Difficulty
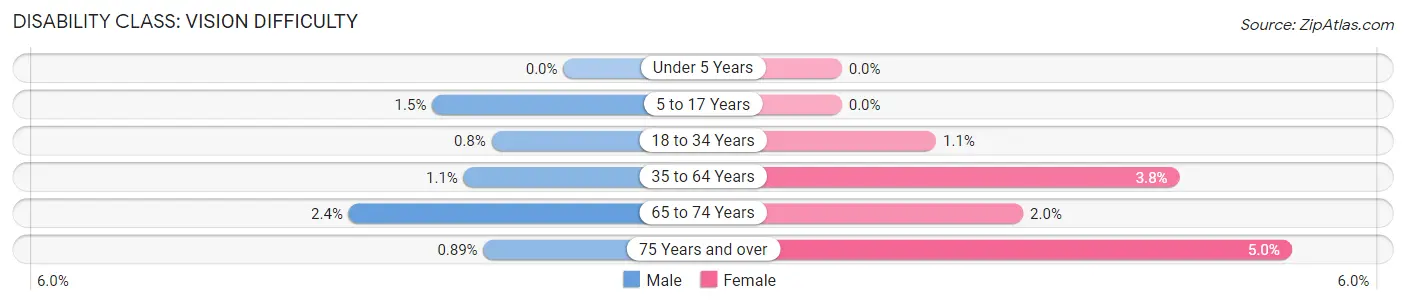
| Age Bracket | Male | Female |
| Under 5 Years | 0 (0.0%) | 0 (0.0%) |
| 5 to 17 Years | 15 (1.5%) | 0 (0.0%) |
| 18 to 34 Years | 9 (0.8%) | 15 (1.1%) |
| 35 to 64 Years | 33 (1.1%) | 108 (3.8%) |
| 65 to 74 Years | 10 (2.4%) | 15 (2.0%) |
| 75 Years and over | 4 (0.9%) | 34 (5.0%) |
Disability Class: Cognitive Difficulty
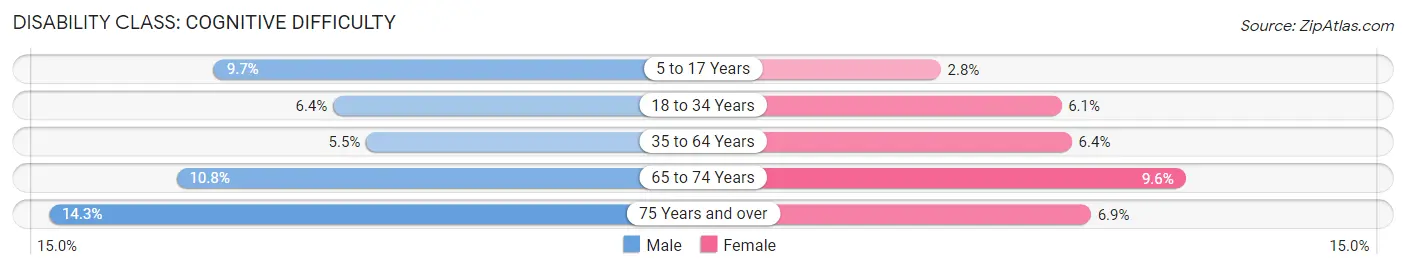
| Age Bracket | Male | Female |
| 5 to 17 Years | 100 (9.7%) | 23 (2.8%) |
| 18 to 34 Years | 72 (6.4%) | 87 (6.1%) |
| 35 to 64 Years | 163 (5.5%) | 184 (6.4%) |
| 65 to 74 Years | 45 (10.8%) | 71 (9.6%) |
| 75 Years and over | 64 (14.3%) | 47 (6.9%) |
Disability Class: Ambulatory Difficulty
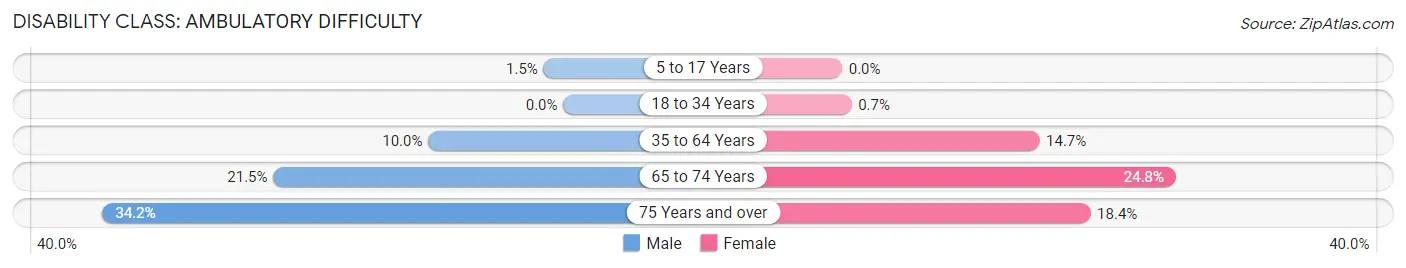
| Age Bracket | Male | Female |
| 5 to 17 Years | 15 (1.5%) | 0 (0.0%) |
| 18 to 34 Years | 0 (0.0%) | 10 (0.7%) |
| 35 to 64 Years | 298 (10.0%) | 421 (14.6%) |
| 65 to 74 Years | 90 (21.5%) | 184 (24.8%) |
| 75 Years and over | 153 (34.2%) | 125 (18.4%) |
Disability Class: Self-Care Difficulty
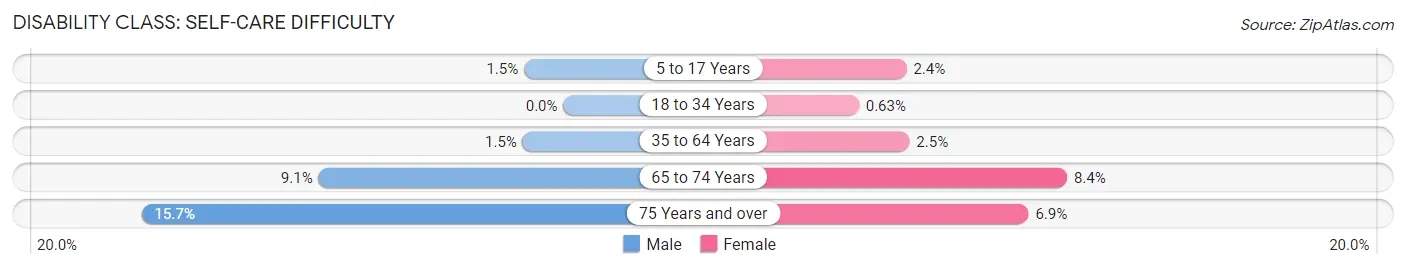
| Age Bracket | Male | Female |
| 5 to 17 Years | 15 (1.5%) | 20 (2.4%) |
| 18 to 34 Years | 0 (0.0%) | 9 (0.6%) |
| 35 to 64 Years | 45 (1.5%) | 72 (2.5%) |
| 65 to 74 Years | 38 (9.1%) | 62 (8.4%) |
| 75 Years and over | 70 (15.7%) | 47 (6.9%) |
Technology Access in Elfers
Computing Device Access in Elfers
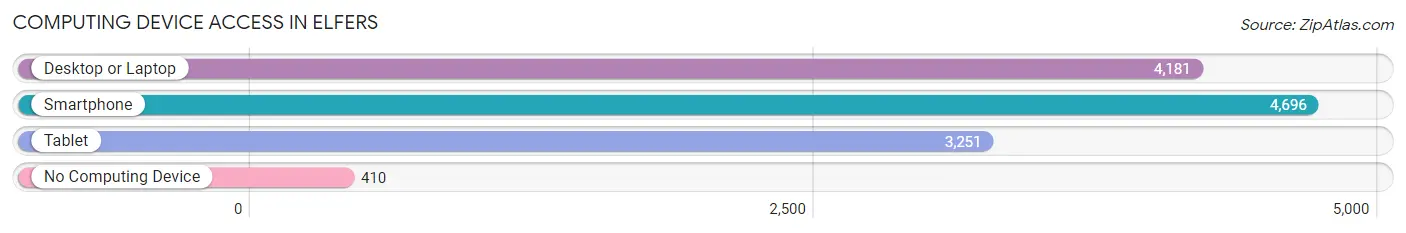
| Device Type | # Households | % Households |
| Desktop or Laptop | 4,181 | 76.7% |
| Smartphone | 4,696 | 86.1% |
| Tablet | 3,251 | 59.6% |
| No Computing Device | 410 | 7.5% |
| Total | 5,452 | 100.0% |
Internet Access in Elfers
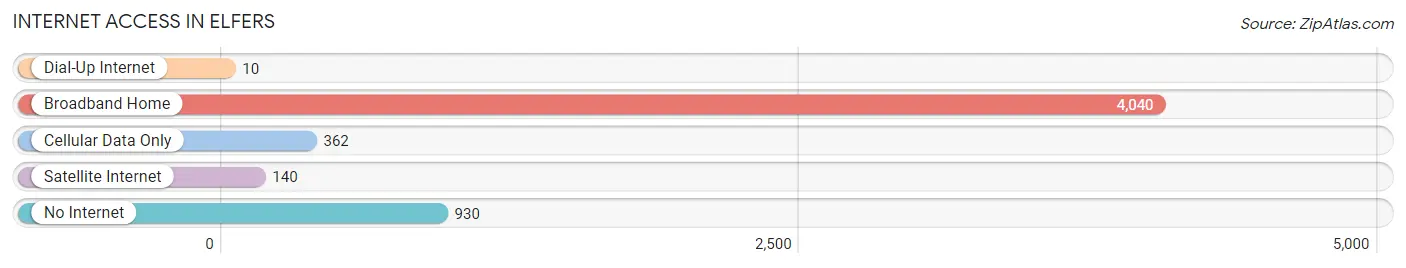
| Internet Type | # Households | % Households |
| Dial-Up Internet | 10 | 0.2% |
| Broadband Home | 4,040 | 74.1% |
| Cellular Data Only | 362 | 6.6% |
| Satellite Internet | 140 | 2.6% |
| No Internet | 930 | 17.1% |
| Total | 5,452 | 100.0% |
Elfers Summary
Elmers, Florida is a small town located in Pasco County, Florida. It is situated on the Gulf Coast, just north of Tampa Bay. The town has a population of approximately 4,000 people and is part of the Tampa-St. Petersburg-Clearwater metropolitan area.
History
Elmers, Florida was founded in 1887 by a group of settlers from the nearby town of Elfers. The town was named after the Elfers family, who were among the first settlers. The town was originally a farming community, but it soon became a popular tourist destination due to its proximity to the Gulf Coast.
In the early 1900s, the town began to grow and develop. The first post office was established in 1906, and the first school was built in 1908. The town also had a hotel, a general store, and a few other businesses.
In the 1920s, the town began to experience a population boom. This was due to the development of the nearby Tampa Bay area, which was becoming a popular destination for tourists. The population of Elmers grew to over 1,000 people by the 1930s.
In the 1950s, the town began to experience a decline in population. This was due to the development of the nearby cities of Tampa and St. Petersburg, which drew away many of the town’s residents. By the 1970s, the population had dropped to just over 1,000 people.
Geography
Elmers, Florida is located in Pasco County, Florida. It is situated on the Gulf Coast, just north of Tampa Bay. The town is bordered by the cities of New Port Richey to the north, Port Richey to the east, and Hudson to the south.
The town is located on the Gulf Coast, which is known for its white sand beaches and warm waters. The town is also located near several popular tourist attractions, such as Busch Gardens and the Florida Aquarium.
Economy
The economy of Elmers, Florida is largely based on tourism. The town is home to several popular tourist attractions, such as Busch Gardens and the Florida Aquarium. The town also has several restaurants, bars, and shops that cater to tourists.
In addition to tourism, the town also has a few small businesses, such as a grocery store, a hardware store, and a few other shops. The town also has a few manufacturing companies, such as a boat manufacturer and a furniture manufacturer.
Demographics
As of the 2010 census, the population of Elmers, Florida was 4,000 people. The town has a median age of 44.7 years, and the median household income is $41,000. The town is predominantly white, with a small Hispanic population.
Conclusion
Elmers, Florida is a small town located in Pasco County, Florida. It is situated on the Gulf Coast, just north of Tampa Bay. The town has a population of approximately 4,000 people and is part of the Tampa-St. Petersburg-Clearwater metropolitan area. The town’s economy is largely based on tourism, and it is home to several popular tourist attractions. The town is predominantly white, with a small Hispanic population.
Common Questions
What is the Total Population of Elfers?
Total Population of Elfers is 13,296.
What is the Total Male Population of Elfers?
Total Male Population of Elfers is 6,408.
What is the Total Female Population of Elfers?
Total Female Population of Elfers is 6,888.
What is the Ratio of Males per 100 Females in Elfers?
There are 93.03 Males per 100 Females in Elfers.
What is the Ratio of Females per 100 Males in Elfers?
There are 107.49 Females per 100 Males in Elfers.
What is the Median Population Age in Elfers?
Median Population Age in Elfers is 40.9 Years.
What is the Average Family Size in Elfers
Average Family Size in Elfers is 3.1 People.
What is the Average Household Size in Elfers
Average Household Size in Elfers is 2.4 People.
What is Per Capita Income in Elfers?
Per Capita income in Elfers is $25,618.
What is the Median Family Income in Elfers?
Median Family Income in Elfers is $57,623.
What is the Median Household income in Elfers?
Median Household Income in Elfers is $50,467.
What is Income or Wage Gap in Elfers?
Income or Wage Gap in Elfers is 25.1%.
Women in Elfers earn 74.9 cents for every dollar earned by a man.
What is Family Income Deficit in Elfers?
Family Income Deficit in Elfers is $8,863.
Families that are below poverty line in Elfers earn $8,863 less on average than the poverty threshold level.
What is Inequality or Gini Index in Elfers?
Inequality or Gini Index in Elfers is 0.36.
How Large is the Labor Force in Elfers?
There are 6,478 People in the Labor Forcein in Elfers.
What is the Percentage of People in the Labor Force in Elfers?
58.9% of People are in the Labor Force in Elfers.
What is the Unemployment Rate in Elfers?
Unemployment Rate in Elfers is 4.2%.