Dade City, FL
Dade City Map
Dade City Overview
7,221
TOTAL POPULATION
3,318
MALE POPULATION
3,903
FEMALE POPULATION
85.01
MALES / 100 FEMALES
117.63
FEMALES / 100 MALES
40.4
MEDIAN AGE
3.1
AVG FAMILY SIZE
2.7
AVG HOUSEHOLD SIZE
$29,877
PER CAPITA INCOME
$64,966
AVG FAMILY INCOME
$63,493
AVG HOUSEHOLD INCOME
23.5%
WAGE / INCOME GAP [ % ]
76.5¢/ $1
WAGE / INCOME GAP [ $ ]
$8,635
FAMILY INCOME DEFICIT
0.44
INEQUALITY / GINI INDEX
2,724
LABOR FORCE [ PEOPLE ]
46.3%
PERCENT IN LABOR FORCE
5.4%
UNEMPLOYMENT RATE
Dade City Area Codes
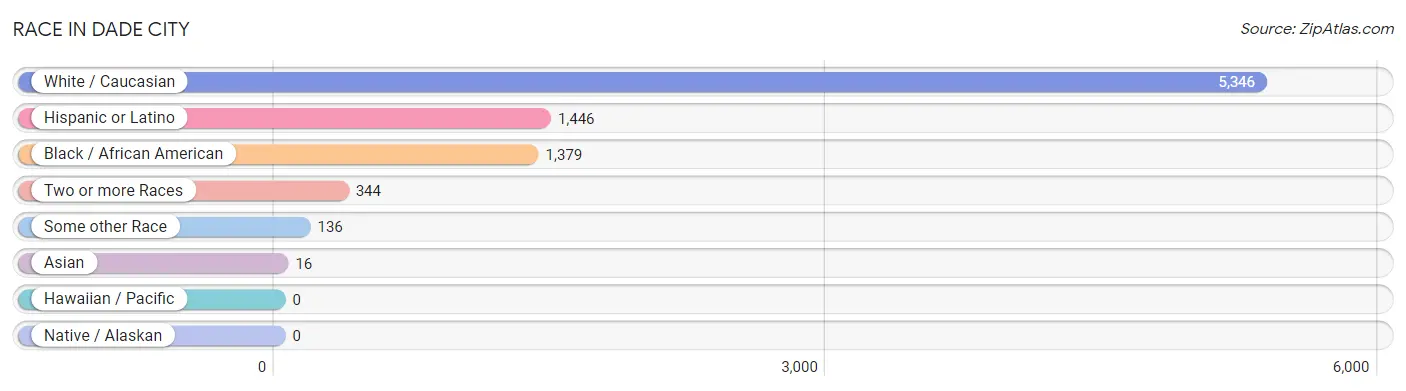
Race in Dade City
The most populous races in Dade City are White / Caucasian (5,346 | 74.0%), Hispanic or Latino (1,446 | 20.0%), and Black / African American (1,379 | 19.1%).
| Race | # Population | % Population |
| Asian | 16 | 0.2% |
| Black / African American | 1,379 | 19.1% |
| Hawaiian / Pacific | 0 | 0.0% |
| Hispanic or Latino | 1,446 | 20.0% |
| Native / Alaskan | 0 | 0.0% |
| White / Caucasian | 5,346 | 74.0% |
| Two or more Races | 344 | 4.8% |
| Some other Race | 136 | 1.9% |
| Total | 7,221 | 100.0% |
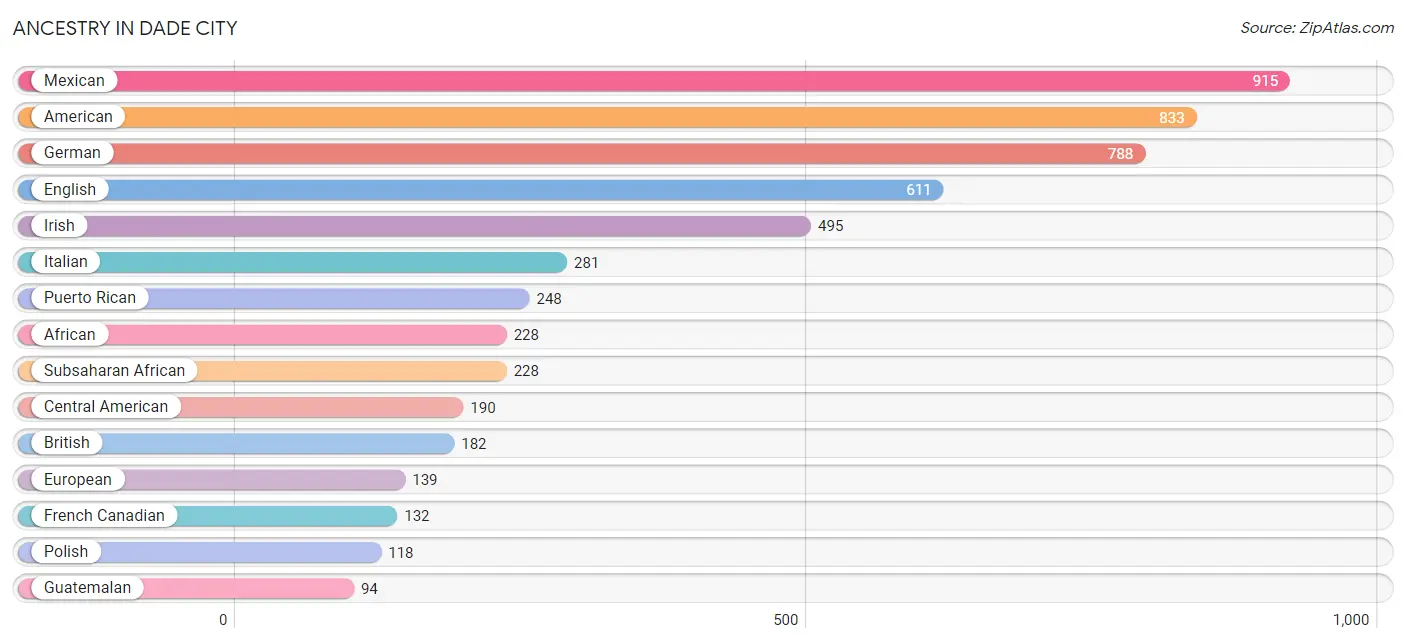
Ancestry in Dade City
The most populous ancestries reported in Dade City are Mexican (915 | 12.7%), American (833 | 11.5%), German (788 | 10.9%), English (611 | 8.5%), and Irish (495 | 6.9%), together accounting for 50.4% of all Dade City residents.
| Ancestry | # Population | % Population |
| African | 228 | 3.2% |
| American | 833 | 11.5% |
| Austrian | 31 | 0.4% |
| Bahamian | 13 | 0.2% |
| British | 182 | 2.5% |
| Canadian | 32 | 0.4% |
| Central American | 190 | 2.6% |
| Cherokee | 49 | 0.7% |
| Cuban | 37 | 0.5% |
| Czech | 8 | 0.1% |
| Dominican | 7 | 0.1% |
| Dutch | 37 | 0.5% |
| Ecuadorian | 2 | 0.0% |
| English | 611 | 8.5% |
| European | 139 | 1.9% |
| Finnish | 16 | 0.2% |
| French | 84 | 1.2% |
| French Canadian | 132 | 1.8% |
| German | 788 | 10.9% |
| Guatemalan | 94 | 1.3% |
| Honduran | 47 | 0.6% |
| Hungarian | 12 | 0.2% |
| Irish | 495 | 6.9% |
| Italian | 281 | 3.9% |
| Jamaican | 60 | 0.8% |
| Korean | 22 | 0.3% |
| Lithuanian | 24 | 0.3% |
| Mexican | 915 | 12.7% |
| Northern European | 29 | 0.4% |
| Polish | 118 | 1.6% |
| Portuguese | 45 | 0.6% |
| Puerto Rican | 248 | 3.4% |
| Russian | 56 | 0.8% |
| Salvadoran | 49 | 0.7% |
| Scandinavian | 16 | 0.2% |
| Scotch-Irish | 46 | 0.6% |
| Scottish | 75 | 1.0% |
| South American | 2 | 0.0% |
| Spaniard | 41 | 0.6% |
| Subsaharan African | 228 | 3.2% |
| Swedish | 9 | 0.1% |
| Swiss | 29 | 0.4% |
| Ukrainian | 12 | 0.2% |
| Yugoslavian | 13 | 0.2% | View All 44 Rows |
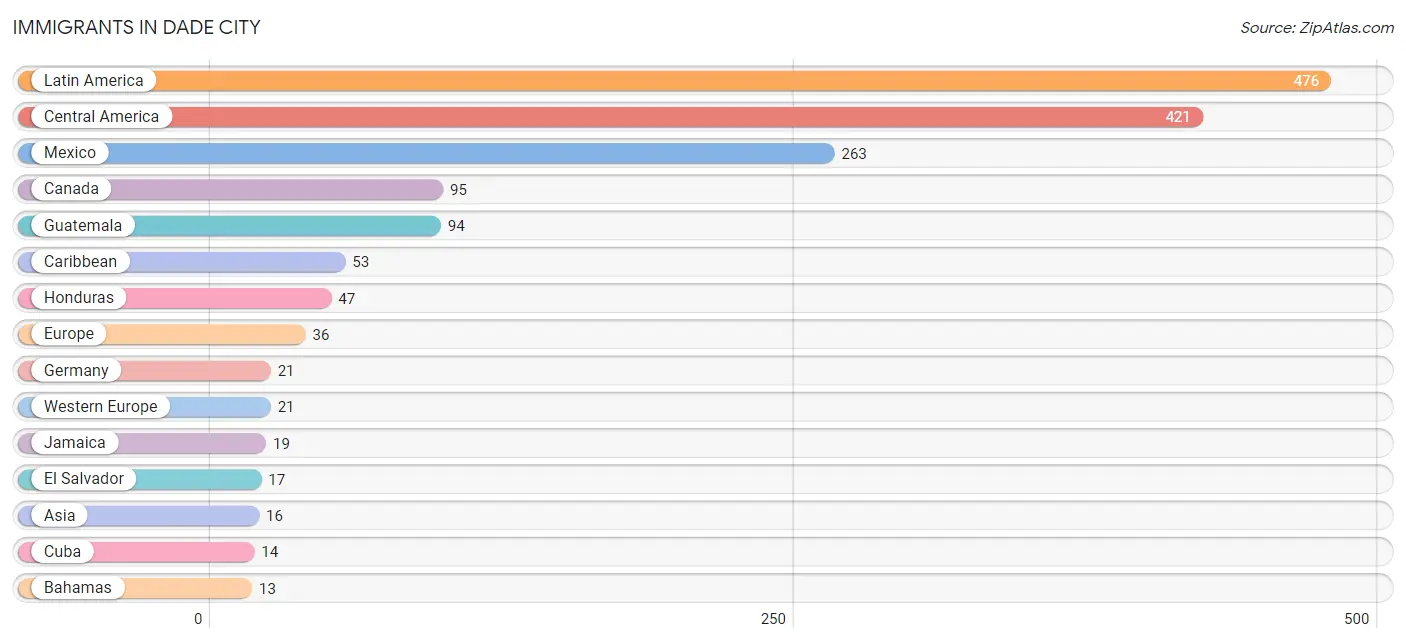
Immigrants in Dade City
The most numerous immigrant groups reported in Dade City came from Latin America (476 | 6.6%), Central America (421 | 5.8%), Mexico (263 | 3.6%), Canada (95 | 1.3%), and Guatemala (94 | 1.3%), together accounting for 18.7% of all Dade City residents.
| Immigration Origin | # Population | % Population |
| Asia | 16 | 0.2% |
| Bahamas | 13 | 0.2% |
| Canada | 95 | 1.3% |
| Caribbean | 53 | 0.7% |
| Central America | 421 | 5.8% |
| Cuba | 14 | 0.2% |
| Dominican Republic | 7 | 0.1% |
| Eastern Asia | 9 | 0.1% |
| Eastern Europe | 13 | 0.2% |
| Ecuador | 2 | 0.0% |
| El Salvador | 17 | 0.2% |
| England | 2 | 0.0% |
| Europe | 36 | 0.5% |
| Germany | 21 | 0.3% |
| Guatemala | 94 | 1.3% |
| Honduras | 47 | 0.6% |
| Jamaica | 19 | 0.3% |
| Korea | 9 | 0.1% |
| Latin America | 476 | 6.6% |
| Mexico | 263 | 3.6% |
| Northern Europe | 2 | 0.0% |
| Philippines | 7 | 0.1% |
| South America | 2 | 0.0% |
| South Eastern Asia | 7 | 0.1% |
| Western Europe | 21 | 0.3% | View All 25 Rows |
Sex and Age in Dade City
Sex and Age in Dade City
The most populous age groups in Dade City are 15 to 19 Years (331 | 10.0%) for men and 30 to 34 Years (386 | 9.9%) for women.
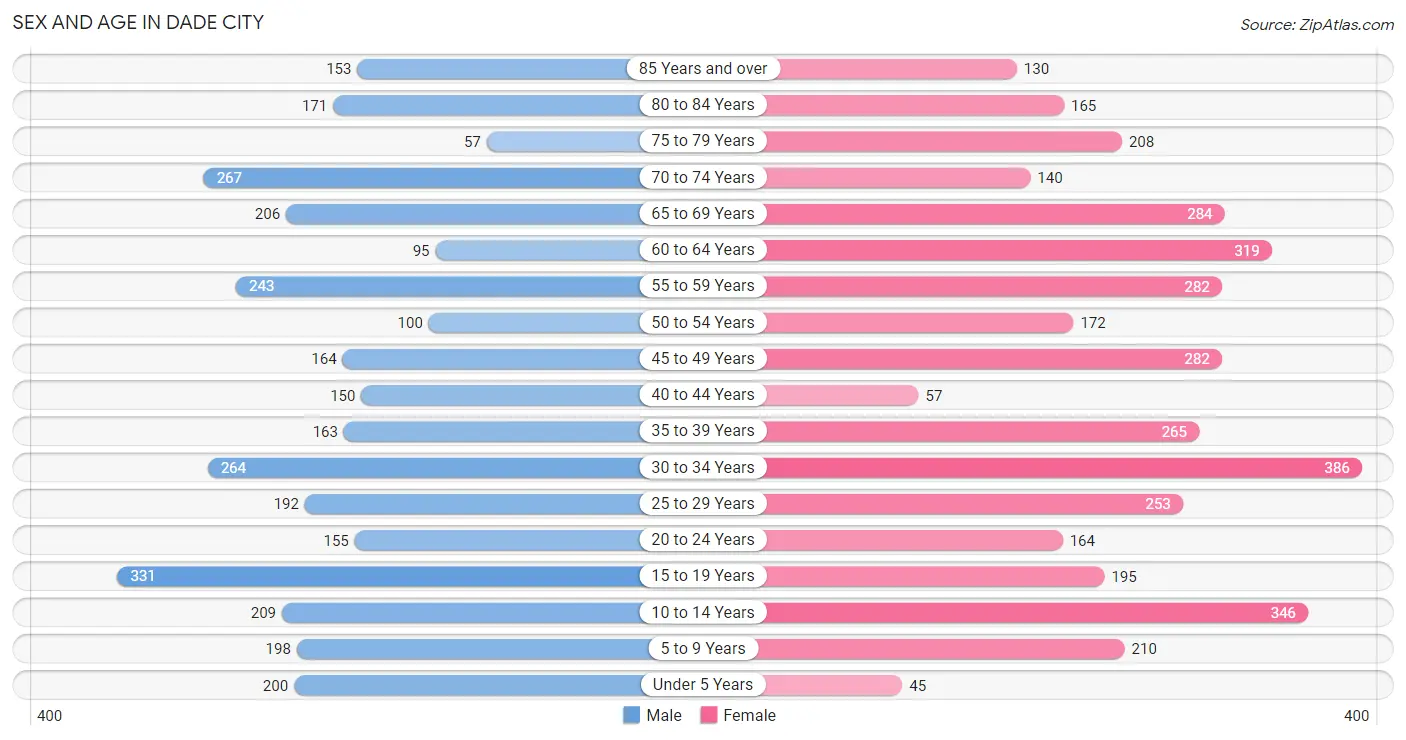
| Age Bracket | Male | Female |
| Under 5 Years | 200 (6.0%) | 45 (1.1%) |
| 5 to 9 Years | 198 (6.0%) | 210 (5.4%) |
| 10 to 14 Years | 209 (6.3%) | 346 (8.9%) |
| 15 to 19 Years | 331 (10.0%) | 195 (5.0%) |
| 20 to 24 Years | 155 (4.7%) | 164 (4.2%) |
| 25 to 29 Years | 192 (5.8%) | 253 (6.5%) |
| 30 to 34 Years | 264 (8.0%) | 386 (9.9%) |
| 35 to 39 Years | 163 (4.9%) | 265 (6.8%) |
| 40 to 44 Years | 150 (4.5%) | 57 (1.5%) |
| 45 to 49 Years | 164 (4.9%) | 282 (7.2%) |
| 50 to 54 Years | 100 (3.0%) | 172 (4.4%) |
| 55 to 59 Years | 243 (7.3%) | 282 (7.2%) |
| 60 to 64 Years | 95 (2.9%) | 319 (8.2%) |
| 65 to 69 Years | 206 (6.2%) | 284 (7.3%) |
| 70 to 74 Years | 267 (8.1%) | 140 (3.6%) |
| 75 to 79 Years | 57 (1.7%) | 208 (5.3%) |
| 80 to 84 Years | 171 (5.1%) | 165 (4.2%) |
| 85 Years and over | 153 (4.6%) | 130 (3.3%) |
| Total | 3,318 (100.0%) | 3,903 (100.0%) |
Families and Households in Dade City
Median Family Size in Dade City
The median family size in Dade City is 3.12 persons per family, with single female/mother families (622 | 32.6%) accounting for the largest median family size of 3.35 persons per family. On the other hand, single male/father families (130 | 6.8%) represent the smallest median family size with 2.02 persons per family.
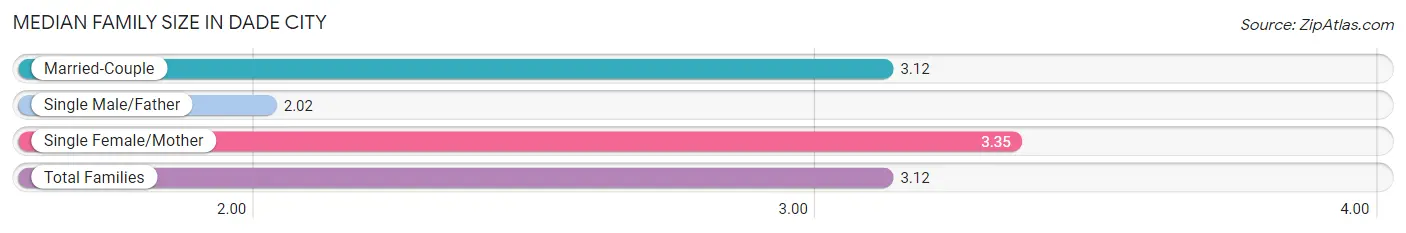
| Family Type | # Families | Family Size |
| Married-Couple | 1,158 (60.6%) | 3.12 |
| Single Male/Father | 130 (6.8%) | 2.02 |
| Single Female/Mother | 622 (32.6%) | 3.35 |
| Total Families | 1,910 (100.0%) | 3.12 |
Median Household Size in Dade City
The median household size in Dade City is 2.74 persons per household, with single female/mother households (622 | 24.8%) accounting for the largest median household size of 3.49 persons per household. non-family households (595 | 23.7%) represent the smallest median household size with 1.28 persons per household.
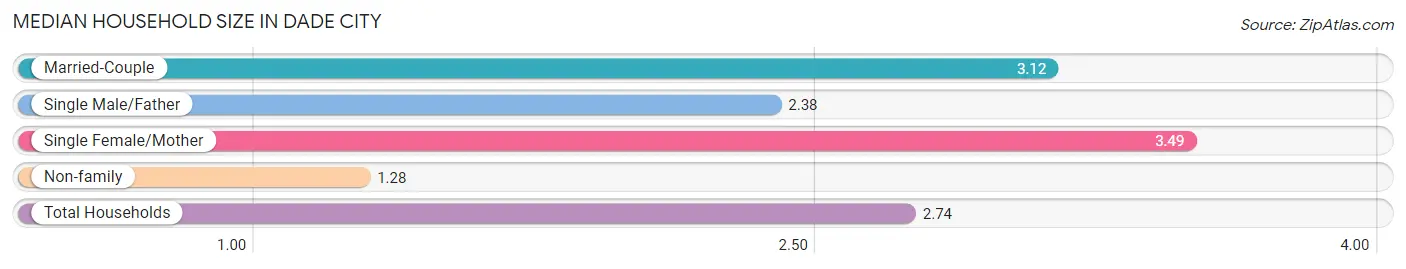
| Household Type | # Households | Household Size |
| Married-Couple | 1,158 (46.2%) | 3.12 |
| Single Male/Father | 130 (5.2%) | 2.38 |
| Single Female/Mother | 622 (24.8%) | 3.49 |
| Non-family | 595 (23.7%) | 1.28 |
| Total Households | 2,505 (100.0%) | 2.74 |
Household Size by Marriage Status in Dade City
Out of a total of 2,505 households in Dade City, 1,910 (76.2%) are family households, while 595 (23.7%) are nonfamily households. The most numerous type of family households are 2-person households, comprising 1,085, and the most common type of nonfamily households are 1-person households, comprising 445.
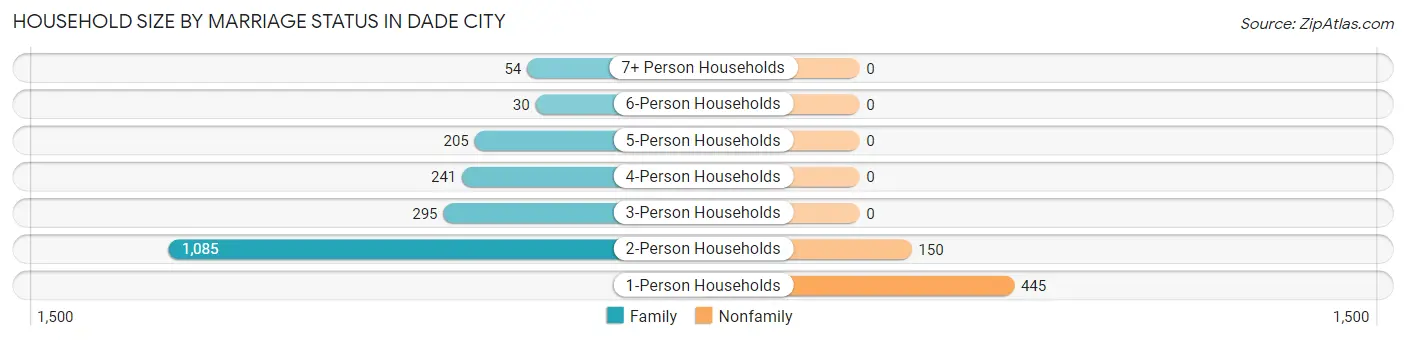
| Household Size | Family Households | Nonfamily Households |
| 1-Person Households | - | 445 (17.8%) |
| 2-Person Households | 1,085 (43.3%) | 150 (6.0%) |
| 3-Person Households | 295 (11.8%) | 0 (0.0%) |
| 4-Person Households | 241 (9.6%) | 0 (0.0%) |
| 5-Person Households | 205 (8.2%) | 0 (0.0%) |
| 6-Person Households | 30 (1.2%) | 0 (0.0%) |
| 7+ Person Households | 54 (2.2%) | 0 (0.0%) |
| Total | 1,910 (76.2%) | 595 (23.7%) |
Female Fertility in Dade City
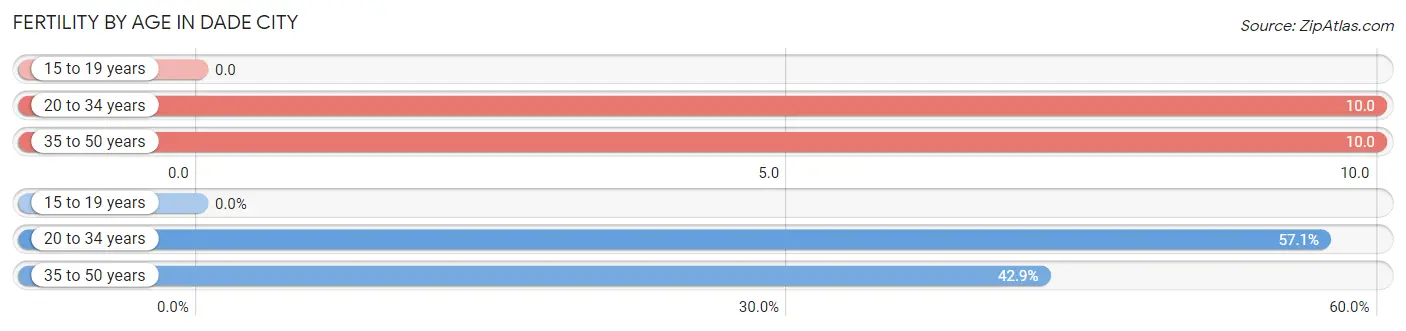
Fertility by Age in Dade City
Average fertility rate in Dade City is 9.0 births per 1,000 women. Women in the age bracket of 20 to 34 years have the highest fertility rate with 10.0 births per 1,000 women. Women in the age bracket of 20 to 34 years acount for 57.1% of all women with births.
| Age Bracket | Women with Births | Births / 1,000 Women |
| 15 to 19 years | 0 (0.0%) | 0.0 |
| 20 to 34 years | 8 (57.1%) | 10.0 |
| 35 to 50 years | 6 (42.9%) | 10.0 |
| Total | 14 (100.0%) | 9.0 |
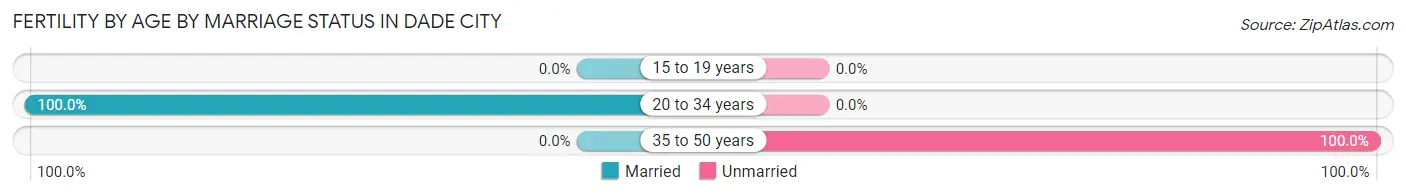
Fertility by Age by Marriage Status in Dade City
57.1% of women with births (14) in Dade City are married. The highest percentage of unmarried women with births falls into 35 to 50 years age bracket with 100.0% of them unmarried at the time of birth, while the lowest percentage of unmarried women with births belong to 20 to 34 years age bracket with 0.0% of them unmarried.
| Age Bracket | Married | Unmarried |
| 15 to 19 years | 0 (0.0%) | 0 (0.0%) |
| 20 to 34 years | 8 (100.0%) | 0 (0.0%) |
| 35 to 50 years | 0 (0.0%) | 6 (100.0%) |
| Total | 8 (57.1%) | 6 (42.9%) |
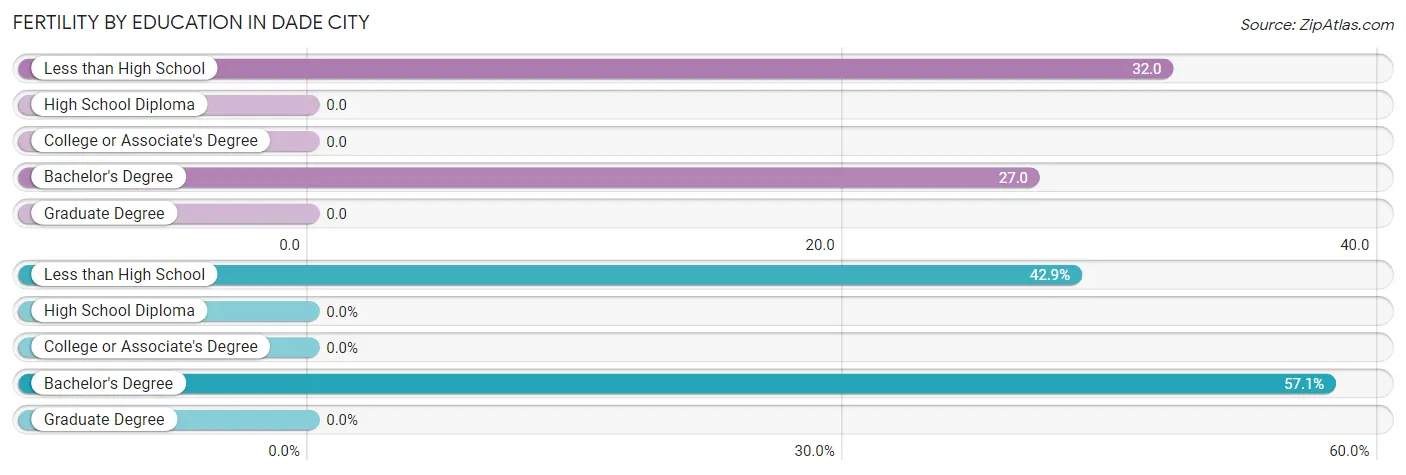
Fertility by Education in Dade City
| Educational Attainment | Women with Births | Births / 1,000 Women |
| Less than High School | 6 (42.9%) | 32.0 |
| High School Diploma | 0 (0.0%) | 0.0 |
| College or Associate's Degree | 0 (0.0%) | 0.0 |
| Bachelor's Degree | 8 (57.1%) | 27.0 |
| Graduate Degree | 0 (0.0%) | 0.0 |
| Total | 14 (100.0%) | 9.0 |
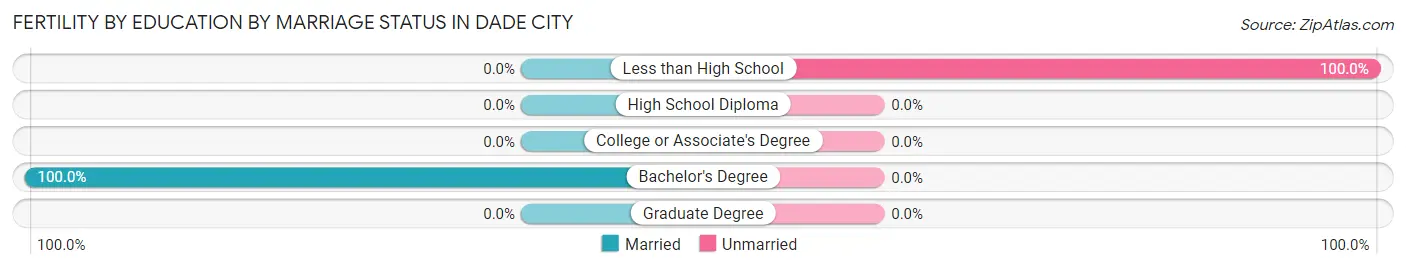
Fertility by Education by Marriage Status in Dade City
42.9% of women with births in Dade City are unmarried. Women with the educational attainment of bachelor's degree are most likely to be married with 100.0% of them married at childbirth, while women with the educational attainment of less than high school are least likely to be married with 100.0% of them unmarried at childbirth.
| Educational Attainment | Married | Unmarried |
| Less than High School | 0 (0.0%) | 6 (100.0%) |
| High School Diploma | 0 (0.0%) | 0 (0.0%) |
| College or Associate's Degree | 0 (0.0%) | 0 (0.0%) |
| Bachelor's Degree | 8 (100.0%) | 0 (0.0%) |
| Graduate Degree | 0 (0.0%) | 0 (0.0%) |
| Total | 8 (57.1%) | 6 (42.9%) |
Income in Dade City
Income Overview in Dade City
Per Capita Income in Dade City is $29,877, while median incomes of families and households are $64,966 and $63,493 respectively.
| Characteristic | Number | Measure |
| Per Capita Income | 7,221 | $29,877 |
| Median Family Income | 1,910 | $64,966 |
| Mean Family Income | 1,910 | $78,927 |
| Median Household Income | 2,505 | $63,493 |
| Mean Household Income | 2,505 | $77,569 |
| Income Deficit | 1,910 | $8,635 |
| Wage / Income Gap (%) | 7,221 | 23.51% |
| Wage / Income Gap ($) | 7,221 | 76.49¢ per $1 |
| Gini / Inequality Index | 7,221 | 0.44 |
Earnings by Sex in Dade City
Average Earnings in Dade City are $34,259, $41,023 for men and $31,380 for women, a difference of 23.5%.
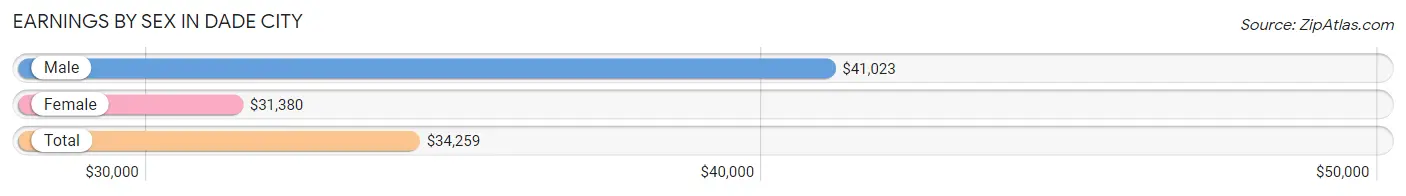
| Sex | Number | Average Earnings |
| Male | 1,372 (47.2%) | $41,023 |
| Female | 1,533 (52.8%) | $31,380 |
| Total | 2,905 (100.0%) | $34,259 |
Earnings by Sex by Income Bracket in Dade City
The most common earnings brackets in Dade City are $100,000+ for men (184 | 13.4%) and $50,000 to $54,999 for women (205 | 13.4%).
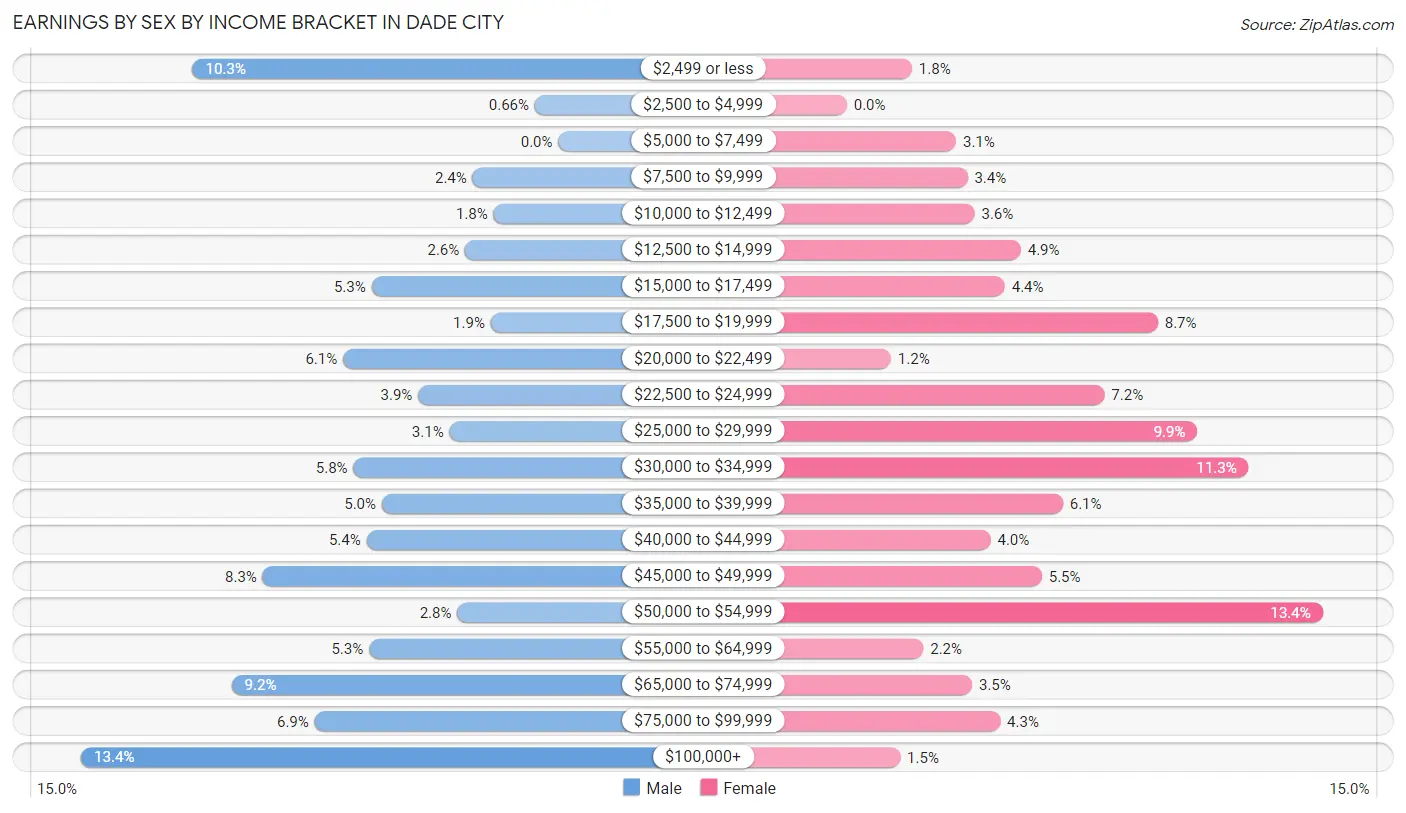
| Income | Male | Female |
| $2,499 or less | 141 (10.3%) | 28 (1.8%) |
| $2,500 to $4,999 | 9 (0.7%) | 0 (0.0%) |
| $5,000 to $7,499 | 0 (0.0%) | 47 (3.1%) |
| $7,500 to $9,999 | 33 (2.4%) | 52 (3.4%) |
| $10,000 to $12,499 | 25 (1.8%) | 55 (3.6%) |
| $12,500 to $14,999 | 36 (2.6%) | 75 (4.9%) |
| $15,000 to $17,499 | 72 (5.2%) | 68 (4.4%) |
| $17,500 to $19,999 | 26 (1.9%) | 134 (8.7%) |
| $20,000 to $22,499 | 83 (6.0%) | 19 (1.2%) |
| $22,500 to $24,999 | 54 (3.9%) | 111 (7.2%) |
| $25,000 to $29,999 | 42 (3.1%) | 151 (9.9%) |
| $30,000 to $34,999 | 79 (5.8%) | 173 (11.3%) |
| $35,000 to $39,999 | 68 (5.0%) | 93 (6.1%) |
| $40,000 to $44,999 | 74 (5.4%) | 62 (4.0%) |
| $45,000 to $49,999 | 114 (8.3%) | 84 (5.5%) |
| $50,000 to $54,999 | 39 (2.8%) | 205 (13.4%) |
| $55,000 to $64,999 | 73 (5.3%) | 33 (2.1%) |
| $65,000 to $74,999 | 126 (9.2%) | 54 (3.5%) |
| $75,000 to $99,999 | 94 (6.9%) | 66 (4.3%) |
| $100,000+ | 184 (13.4%) | 23 (1.5%) |
| Total | 1,372 (100.0%) | 1,533 (100.0%) |
Earnings by Sex by Educational Attainment in Dade City
Average earnings in Dade City are $47,076 for men and $33,200 for women, a difference of 29.5%. Men with an educational attainment of graduate degree enjoy the highest average annual earnings of $250,001, while those with less than high school education earn the least with $15,948. Women with an educational attainment of graduate degree earn the most with the average annual earnings of $50,417, while those with high school diploma education have the smallest earnings of $19,748.
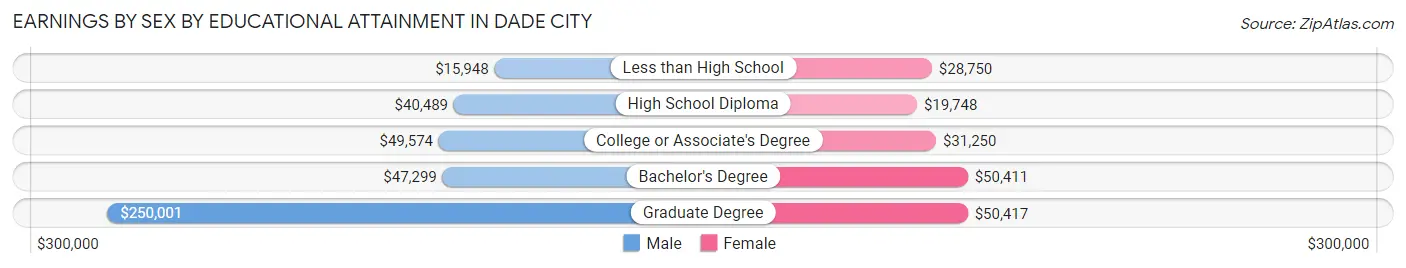
| Educational Attainment | Male Income | Female Income |
| Less than High School | $15,948 | $28,750 |
| High School Diploma | $40,489 | $19,748 |
| College or Associate's Degree | $49,574 | $31,250 |
| Bachelor's Degree | $47,299 | $50,411 |
| Graduate Degree | $250,001 | $50,417 |
| Total | $47,076 | $33,200 |
Family Income in Dade City
Family Income Brackets in Dade City
According to the Dade City family income data, there are 413 families falling into the $50,000 to $74,999 income range, which is the most common income bracket and makes up 21.6% of all families. Conversely, the less than $10,000 income bracket is the least frequent group with only 6 families (0.3%) belonging to this category.
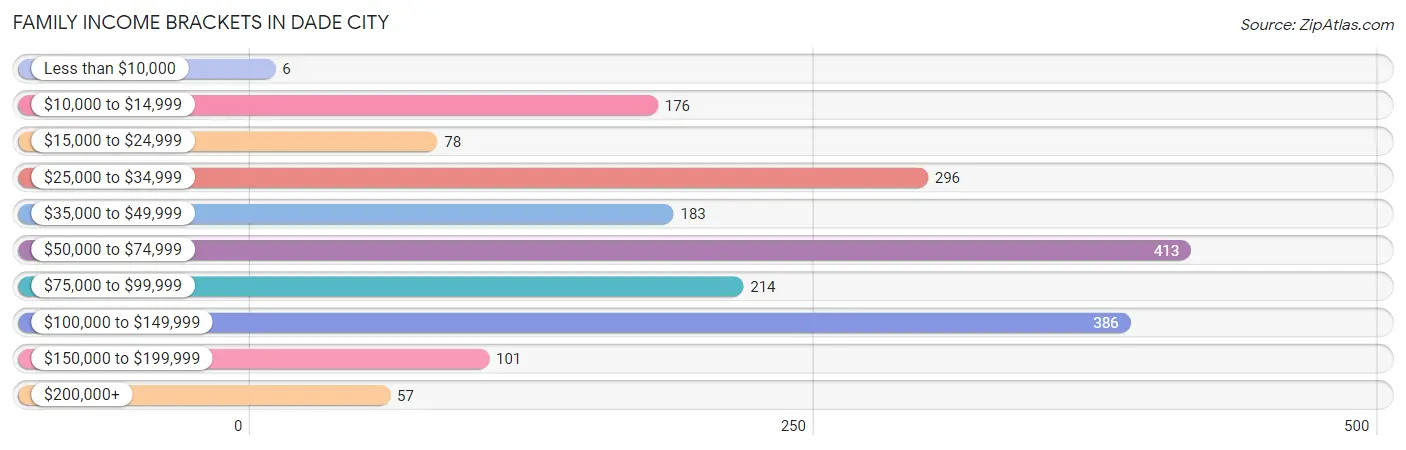
| Income Bracket | # Families | % Families |
| Less than $10,000 | 6 | 0.3% |
| $10,000 to $14,999 | 176 | 9.2% |
| $15,000 to $24,999 | 78 | 4.1% |
| $25,000 to $34,999 | 296 | 15.5% |
| $35,000 to $49,999 | 183 | 9.6% |
| $50,000 to $74,999 | 413 | 21.6% |
| $75,000 to $99,999 | 214 | 11.2% |
| $100,000 to $149,999 | 386 | 20.2% |
| $150,000 to $199,999 | 101 | 5.3% |
| $200,000+ | 57 | 3.0% |
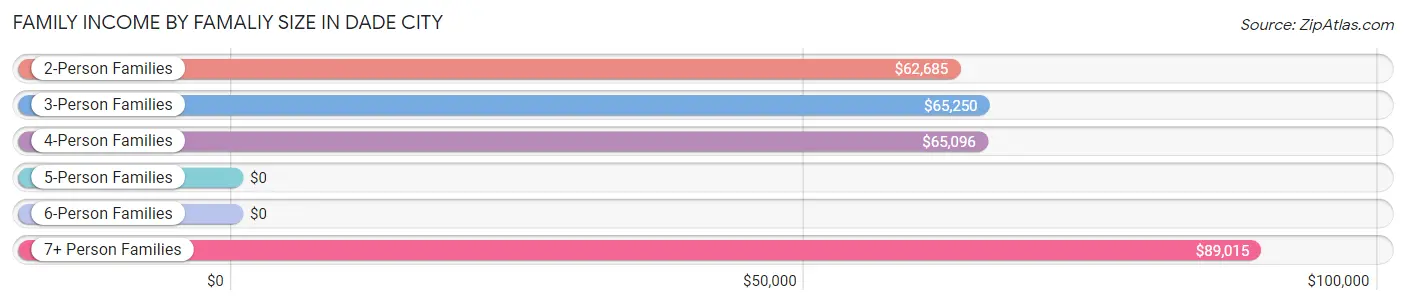
Family Income by Famaliy Size in Dade City
7+ person families (54 | 2.8%) account for the highest median family income in Dade City with $89,015 per family, while 2-person families (1,156 | 60.5%) have the highest median income of $31,342 per family member.
| Income Bracket | # Families | Median Income |
| 2-Person Families | 1,156 (60.5%) | $62,685 |
| 3-Person Families | 258 (13.5%) | $65,250 |
| 4-Person Families | 235 (12.3%) | $65,096 |
| 5-Person Families | 177 (9.3%) | $0 |
| 6-Person Families | 30 (1.6%) | $0 |
| 7+ Person Families | 54 (2.8%) | $89,015 |
| Total | 1,910 (100.0%) | $64,966 |
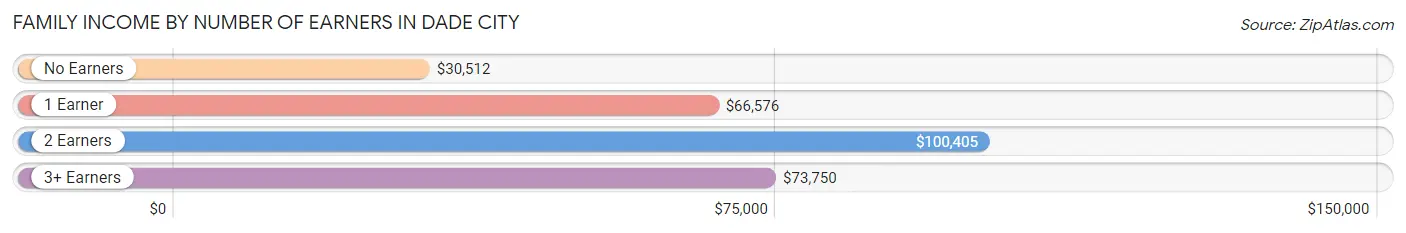
Family Income by Number of Earners in Dade City
The median family income in Dade City is $64,966, with families comprising 2 earners (545) having the highest median family income of $100,405, while families with no earners (506) have the lowest median family income of $30,512, accounting for 28.5% and 26.5% of families, respectively.
| Number of Earners | # Families | Median Income |
| No Earners | 506 (26.5%) | $30,512 |
| 1 Earner | 765 (40.1%) | $66,576 |
| 2 Earners | 545 (28.5%) | $100,405 |
| 3+ Earners | 94 (4.9%) | $73,750 |
| Total | 1,910 (100.0%) | $64,966 |
Household Income in Dade City
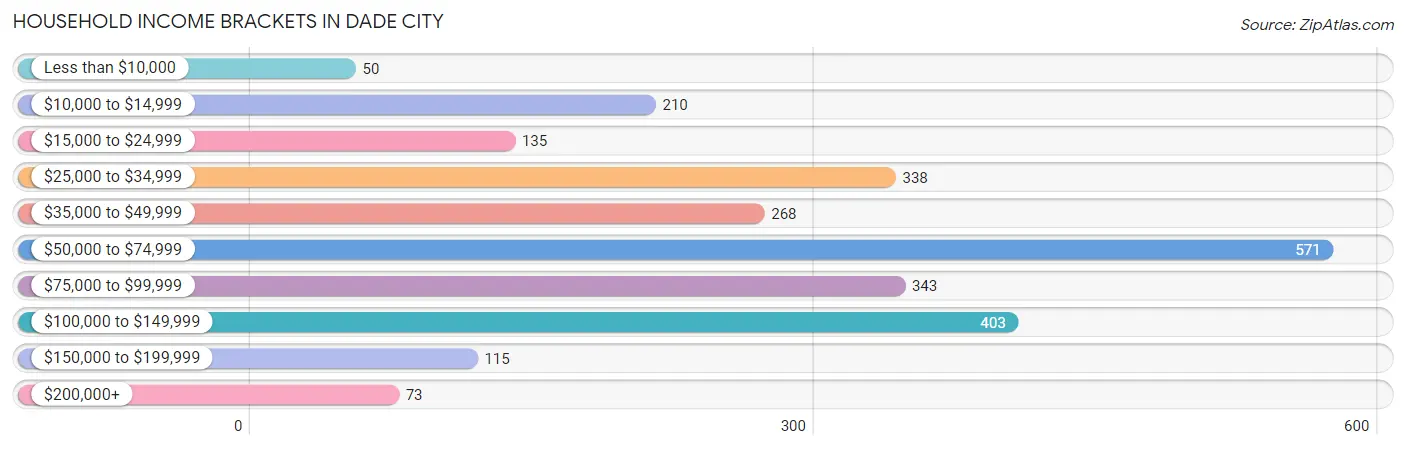
Household Income Brackets in Dade City
With 571 households falling in the category, the $50,000 to $74,999 income range is the most frequent in Dade City, accounting for 22.8% of all households. In contrast, only 50 households (2.0%) fall into the less than $10,000 income bracket, making it the least populous group.
| Income Bracket | # Households | % Households |
| Less than $10,000 | 50 | 2.0% |
| $10,000 to $14,999 | 210 | 8.4% |
| $15,000 to $24,999 | 135 | 5.4% |
| $25,000 to $34,999 | 338 | 13.5% |
| $35,000 to $49,999 | 268 | 10.7% |
| $50,000 to $74,999 | 571 | 22.8% |
| $75,000 to $99,999 | 343 | 13.7% |
| $100,000 to $149,999 | 403 | 16.1% |
| $150,000 to $199,999 | 115 | 4.6% |
| $200,000+ | 73 | 2.9% |
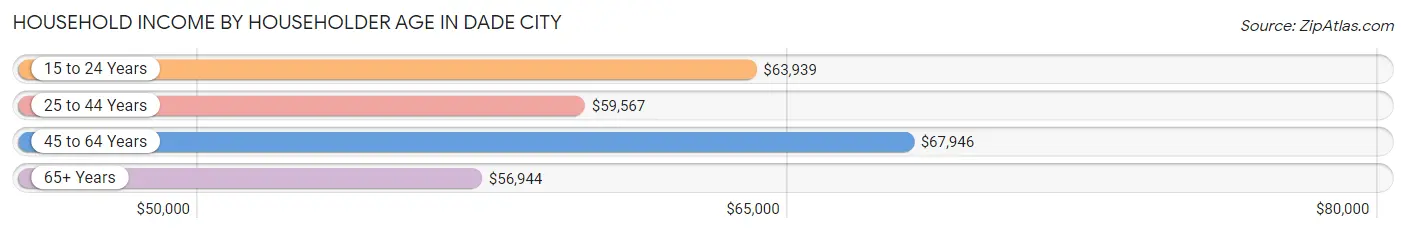
Household Income by Householder Age in Dade City
The median household income in Dade City is $63,493, with the highest median household income of $67,946 found in the 45 to 64 years age bracket for the primary householder. A total of 926 households (37.0%) fall into this category. Meanwhile, the 65+ years age bracket for the primary householder has the lowest median household income of $56,944, with 852 households (34.0%) in this group.
| Income Bracket | # Households | Median Income |
| 15 to 24 Years | 56 (2.2%) | $63,939 |
| 25 to 44 Years | 671 (26.8%) | $59,567 |
| 45 to 64 Years | 926 (37.0%) | $67,946 |
| 65+ Years | 852 (34.0%) | $56,944 |
| Total | 2,505 (100.0%) | $63,493 |
Poverty in Dade City
Income Below Poverty by Sex and Age in Dade City
With 13.4% poverty level for males and 12.3% for females among the residents of Dade City, 5 year old males and 5 year old females are the most vulnerable to poverty, with 16 males (100.0%) and 25 females (53.2%) in their respective age groups living below the poverty level.
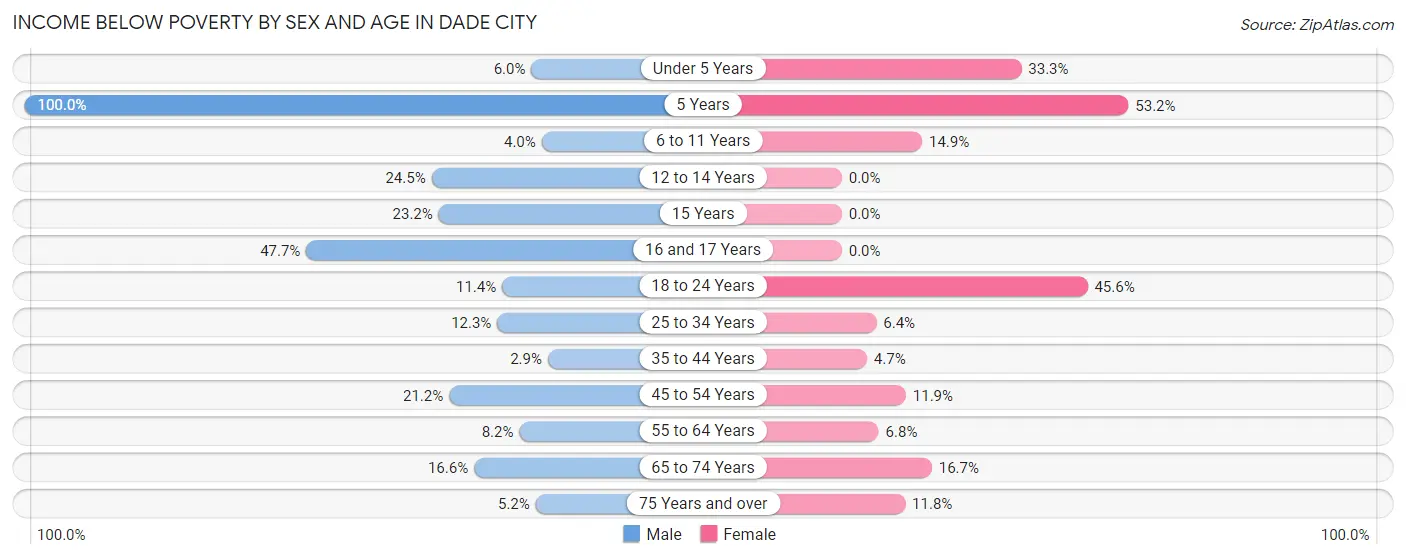
| Age Bracket | Male | Female |
| Under 5 Years | 11 (5.9%) | 15 (33.3%) |
| 5 Years | 16 (100.0%) | 25 (53.2%) |
| 6 to 11 Years | 10 (4.0%) | 39 (14.9%) |
| 12 to 14 Years | 35 (24.5%) | 0 (0.0%) |
| 15 Years | 25 (23.2%) | 0 (0.0%) |
| 16 and 17 Years | 63 (47.7%) | 0 (0.0%) |
| 18 to 24 Years | 28 (11.4%) | 114 (45.6%) |
| 25 to 34 Years | 56 (12.3%) | 41 (6.4%) |
| 35 to 44 Years | 9 (2.9%) | 15 (4.7%) |
| 45 to 54 Years | 56 (21.2%) | 54 (11.9%) |
| 55 to 64 Years | 27 (8.2%) | 40 (6.8%) |
| 65 to 74 Years | 70 (16.6%) | 65 (16.7%) |
| 75 Years and over | 14 (5.1%) | 46 (11.8%) |
| Total | 420 (13.4%) | 454 (12.3%) |
Income Above Poverty by Sex and Age in Dade City
According to the poverty statistics in Dade City, males aged 35 to 44 years and females aged 12 to 14 years are the age groups that are most secure financially, with 97.1% of males and 100.0% of females in these age groups living above the poverty line.
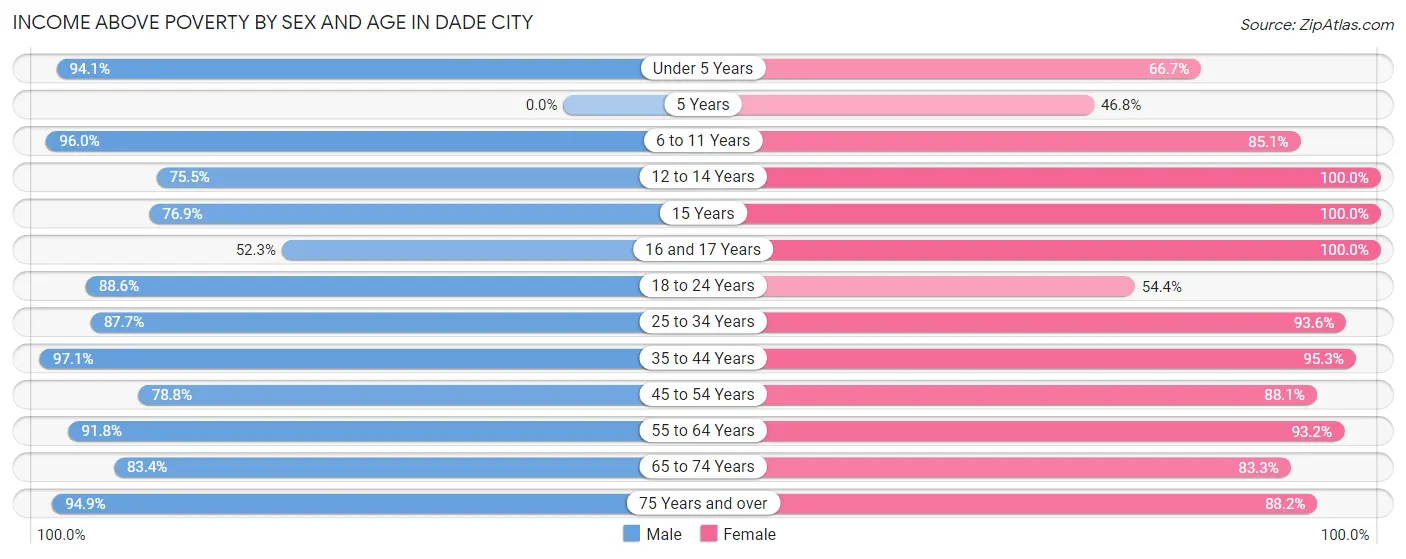
| Age Bracket | Male | Female |
| Under 5 Years | 174 (94.1%) | 30 (66.7%) |
| 5 Years | 0 (0.0%) | 22 (46.8%) |
| 6 to 11 Years | 238 (96.0%) | 223 (85.1%) |
| 12 to 14 Years | 108 (75.5%) | 235 (100.0%) |
| 15 Years | 83 (76.8%) | 21 (100.0%) |
| 16 and 17 Years | 69 (52.3%) | 62 (100.0%) |
| 18 to 24 Years | 218 (88.6%) | 136 (54.4%) |
| 25 to 34 Years | 400 (87.7%) | 598 (93.6%) |
| 35 to 44 Years | 304 (97.1%) | 307 (95.3%) |
| 45 to 54 Years | 208 (78.8%) | 400 (88.1%) |
| 55 to 64 Years | 303 (91.8%) | 545 (93.2%) |
| 65 to 74 Years | 352 (83.4%) | 324 (83.3%) |
| 75 Years and over | 258 (94.9%) | 345 (88.2%) |
| Total | 2,715 (86.6%) | 3,248 (87.7%) |
Income Below Poverty Among Married-Couple Families in Dade City
The poverty statistics for married-couple families in Dade City show that 5.9% or 68 of the total 1,158 families live below the poverty line. Families with 3 or 4 children have the highest poverty rate of 9.2%, comprising of 16 families. On the other hand, families with 1 or 2 children have the lowest poverty rate of 0.0%, which includes 0 families.
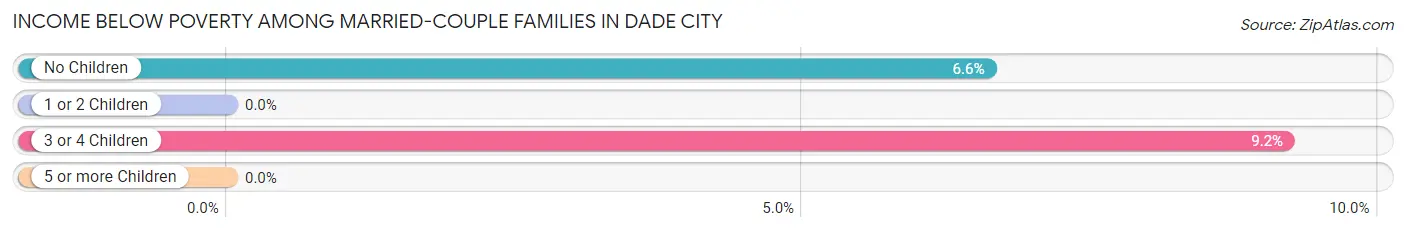
| Children | Above Poverty | Below Poverty |
| No Children | 736 (93.4%) | 52 (6.6%) |
| 1 or 2 Children | 163 (100.0%) | 0 (0.0%) |
| 3 or 4 Children | 158 (90.8%) | 16 (9.2%) |
| 5 or more Children | 33 (100.0%) | 0 (0.0%) |
| Total | 1,090 (94.1%) | 68 (5.9%) |
Income Below Poverty Among Single-Parent Households in Dade City
According to the poverty data in Dade City, 53.1% or 69 single-father households and 14.5% or 90 single-mother households are living below the poverty line. Among single-father households, those with 1 or 2 children have the highest poverty rate, with 55 households (77.5%) experiencing poverty. Likewise, among single-mother households, those with 1 or 2 children have the highest poverty rate, with 86 households (24.6%) falling below the poverty line.
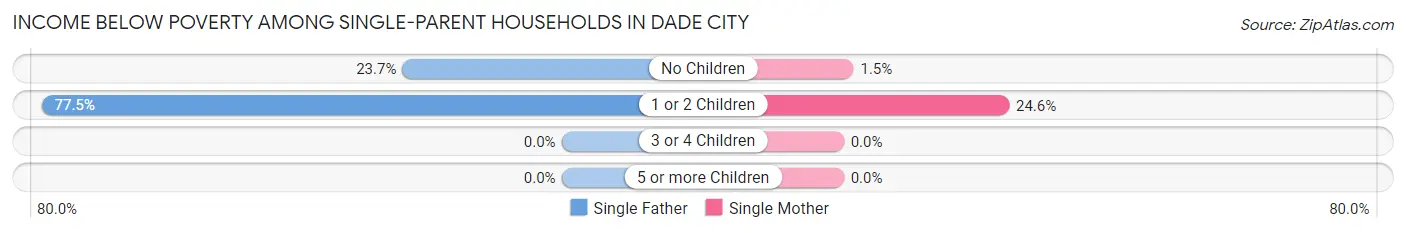
| Children | Single Father | Single Mother |
| No Children | 14 (23.7%) | 4 (1.5%) |
| 1 or 2 Children | 55 (77.5%) | 86 (24.6%) |
| 3 or 4 Children | 0 (0.0%) | 0 (0.0%) |
| 5 or more Children | 0 (0.0%) | 0 (0.0%) |
| Total | 69 (53.1%) | 90 (14.5%) |
Income Below Poverty Among Married-Couple vs Single-Parent Households in Dade City
The poverty data for Dade City shows that 68 of the married-couple family households (5.9%) and 159 of the single-parent households (21.1%) are living below the poverty level. Within the married-couple family households, those with 3 or 4 children have the highest poverty rate, with 16 households (9.2%) falling below the poverty line. Among the single-parent households, those with 1 or 2 children have the highest poverty rate, with 141 household (33.6%) living below poverty.
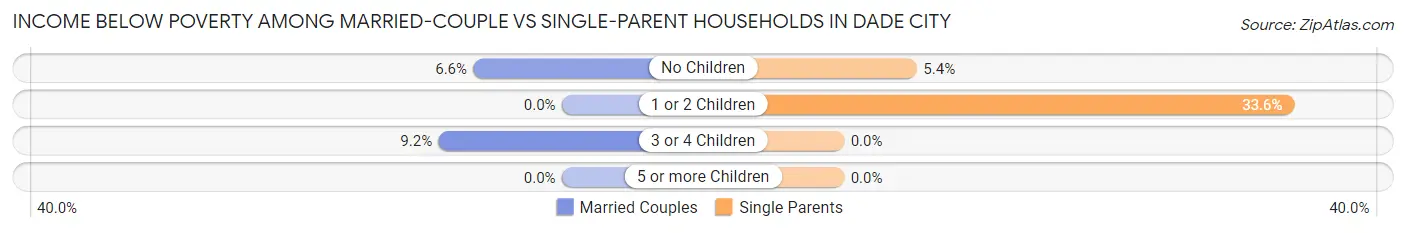
| Children | Married-Couple Families | Single-Parent Households |
| No Children | 52 (6.6%) | 18 (5.4%) |
| 1 or 2 Children | 0 (0.0%) | 141 (33.6%) |
| 3 or 4 Children | 16 (9.2%) | 0 (0.0%) |
| 5 or more Children | 0 (0.0%) | 0 (0.0%) |
| Total | 68 (5.9%) | 159 (21.1%) |
Employment Characteristics in Dade City
Employment by Class of Employer in Dade City
Among the 2,560 employed individuals in Dade City, private company employees (1,635 | 63.9%), not-for-profit organizations (295 | 11.5%), and local government employees (216 | 8.4%) make up the most common classes of employment.
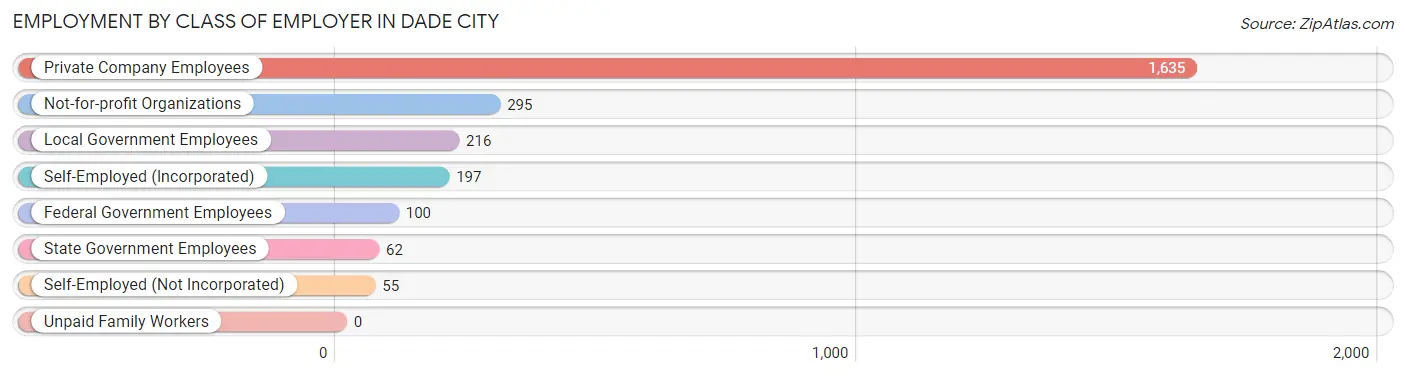
| Employer Class | # Employees | % Employees |
| Private Company Employees | 1,635 | 63.9% |
| Self-Employed (Incorporated) | 197 | 7.7% |
| Self-Employed (Not Incorporated) | 55 | 2.1% |
| Not-for-profit Organizations | 295 | 11.5% |
| Local Government Employees | 216 | 8.4% |
| State Government Employees | 62 | 2.4% |
| Federal Government Employees | 100 | 3.9% |
| Unpaid Family Workers | 0 | 0.0% |
| Total | 2,560 | 100.0% |
Employment Status by Age in Dade City
According to the labor force statistics for Dade City, out of the total population over 16 years of age (5,884), 46.3% or 2,724 individuals are in the labor force, with 5.4% or 147 of them unemployed. The age group with the highest labor force participation rate is 35 to 44 years, with 92.0% or 584 individuals in the labor force. Within the labor force, the 16 to 19 years age range has the highest percentage of unemployed individuals, with 16.8% or 17 of them being unemployed.
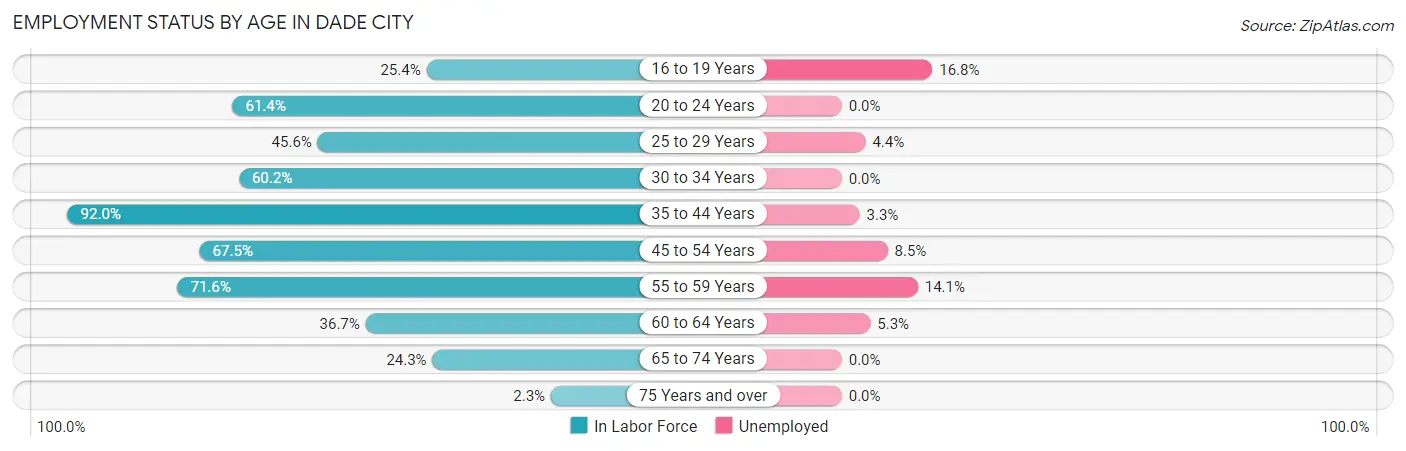
| Age Bracket | In Labor Force | Unemployed |
| 16 to 19 Years | 101 (25.4%) | 17 (16.8%) |
| 20 to 24 Years | 196 (61.4%) | 0 (0.0%) |
| 25 to 29 Years | 203 (45.6%) | 9 (4.4%) |
| 30 to 34 Years | 391 (60.2%) | 0 (0.0%) |
| 35 to 44 Years | 584 (92.0%) | 19 (3.3%) |
| 45 to 54 Years | 485 (67.5%) | 41 (8.5%) |
| 55 to 59 Years | 376 (71.6%) | 53 (14.1%) |
| 60 to 64 Years | 152 (36.7%) | 8 (5.3%) |
| 65 to 74 Years | 218 (24.3%) | 0 (0.0%) |
| 75 Years and over | 20 (2.3%) | 0 (0.0%) |
| Total | 2,724 (46.3%) | 147 (5.4%) |
Employment Status by Educational Attainment in Dade City
According to labor force statistics for Dade City, 64.7% of individuals (2,191) out of the total population between 25 and 64 years of age (3,387) are in the labor force, with 5.9% or 129 of them being unemployed. The group with the highest labor force participation rate are those with the educational attainment of less than high school, with 80.7% or 263 individuals in the labor force. Within the labor force, individuals with less than high school education have the highest percentage of unemployment, with 33.8% or 89 of them being unemployed.
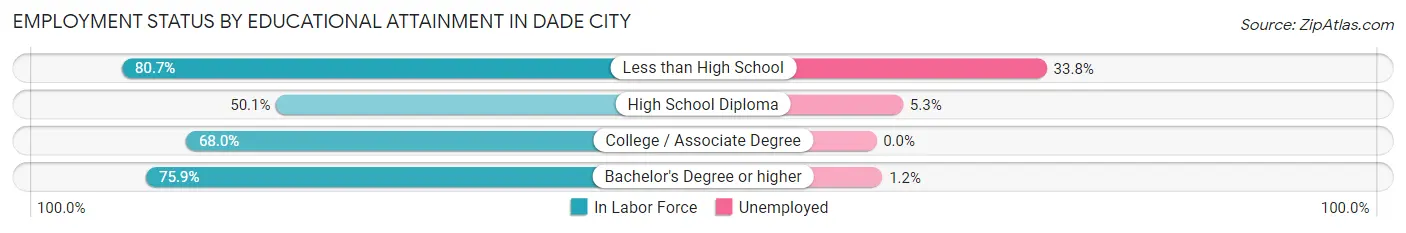
| Educational Attainment | In Labor Force | Unemployed |
| Less than High School | 263 (80.7%) | 110 (33.8%) |
| High School Diploma | 622 (50.1%) | 66 (5.3%) |
| College / Associate Degree | 649 (68.0%) | 0 (0.0%) |
| Bachelor's Degree or higher | 657 (75.9%) | 10 (1.2%) |
| Total | 2,191 (64.7%) | 200 (5.9%) |
Employment Occupations by Sex in Dade City
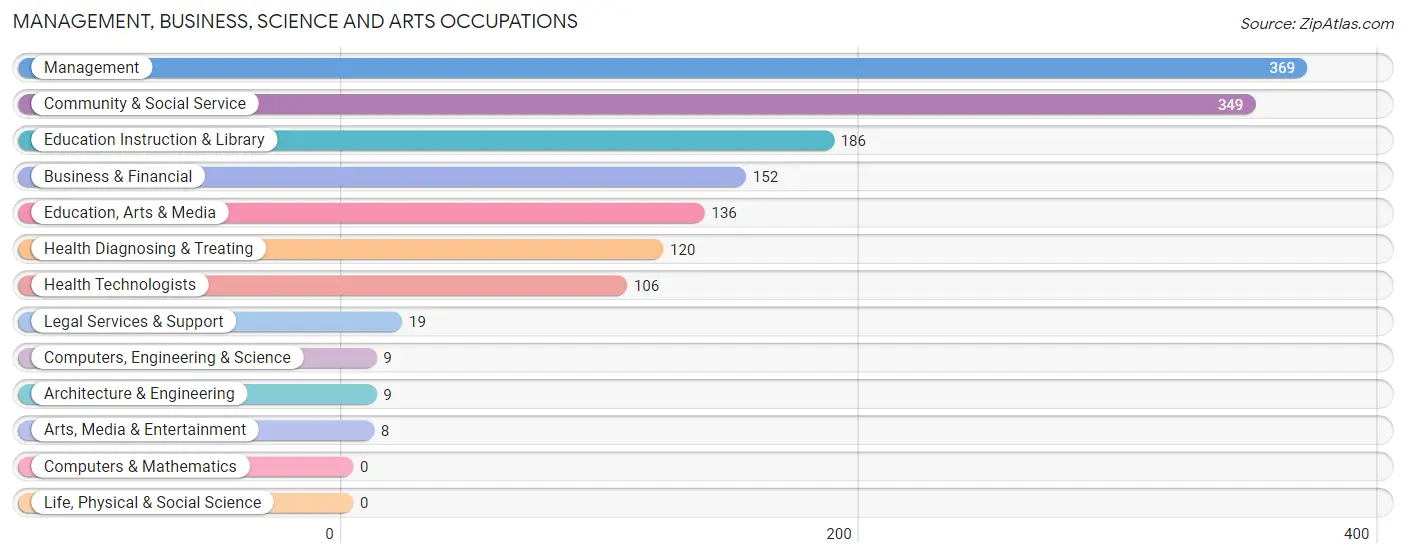
Management, Business, Science and Arts Occupations
The most common Management, Business, Science and Arts occupations in Dade City are Management (369 | 14.3%), Community & Social Service (349 | 13.5%), Education Instruction & Library (186 | 7.2%), Business & Financial (152 | 5.9%), and Education, Arts & Media (136 | 5.3%).
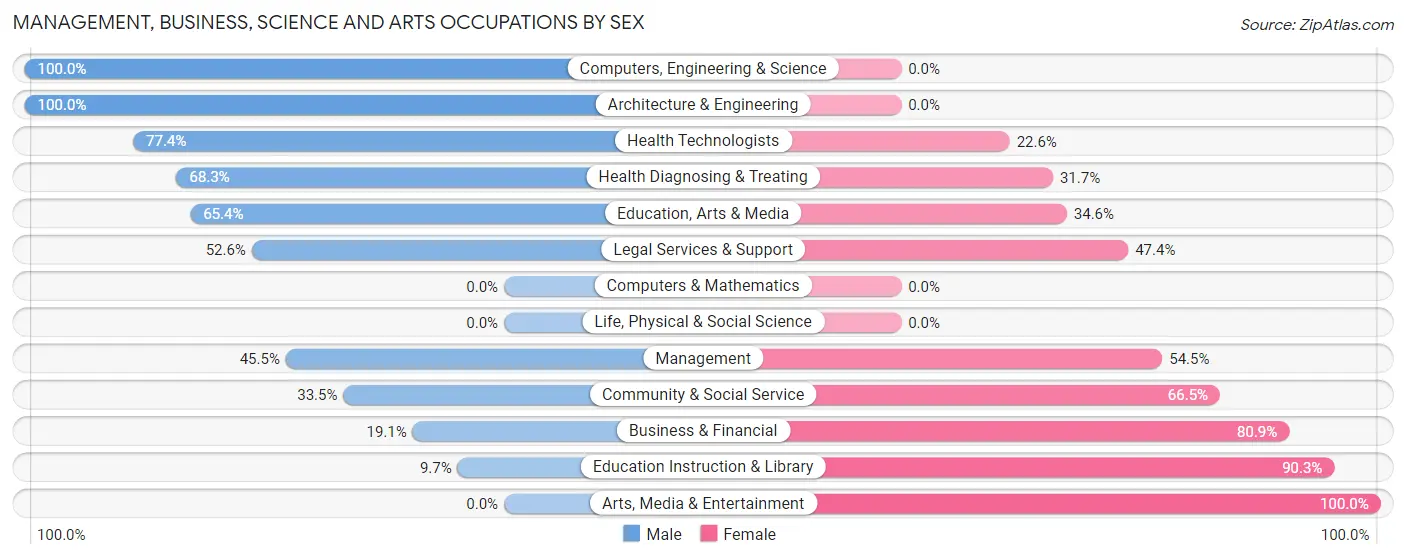
Management, Business, Science and Arts Occupations by Sex
Within the Management, Business, Science and Arts occupations in Dade City, the most male-oriented occupations are Computers, Engineering & Science (100.0%), Architecture & Engineering (100.0%), and Health Technologists (77.4%), while the most female-oriented occupations are Arts, Media & Entertainment (100.0%), Education Instruction & Library (90.3%), and Business & Financial (80.9%).
| Occupation | Male | Female |
| Management | 168 (45.5%) | 201 (54.5%) |
| Business & Financial | 29 (19.1%) | 123 (80.9%) |
| Computers, Engineering & Science | 9 (100.0%) | 0 (0.0%) |
| Computers & Mathematics | 0 (0.0%) | 0 (0.0%) |
| Architecture & Engineering | 9 (100.0%) | 0 (0.0%) |
| Life, Physical & Social Science | 0 (0.0%) | 0 (0.0%) |
| Community & Social Service | 117 (33.5%) | 232 (66.5%) |
| Education, Arts & Media | 89 (65.4%) | 47 (34.6%) |
| Legal Services & Support | 10 (52.6%) | 9 (47.4%) |
| Education Instruction & Library | 18 (9.7%) | 168 (90.3%) |
| Arts, Media & Entertainment | 0 (0.0%) | 8 (100.0%) |
| Health Diagnosing & Treating | 82 (68.3%) | 38 (31.7%) |
| Health Technologists | 82 (77.4%) | 24 (22.6%) |
| Total (Category) | 405 (40.5%) | 594 (59.5%) |
| Total (Overall) | 1,164 (45.1%) | 1,415 (54.9%) |
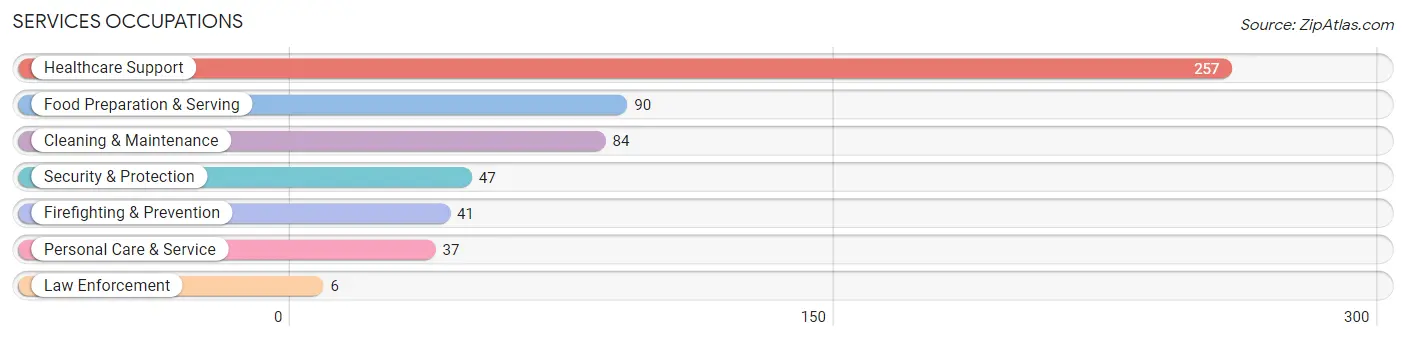
Services Occupations
The most common Services occupations in Dade City are Healthcare Support (257 | 10.0%), Food Preparation & Serving (90 | 3.5%), Cleaning & Maintenance (84 | 3.3%), Security & Protection (47 | 1.8%), and Firefighting & Prevention (41 | 1.6%).
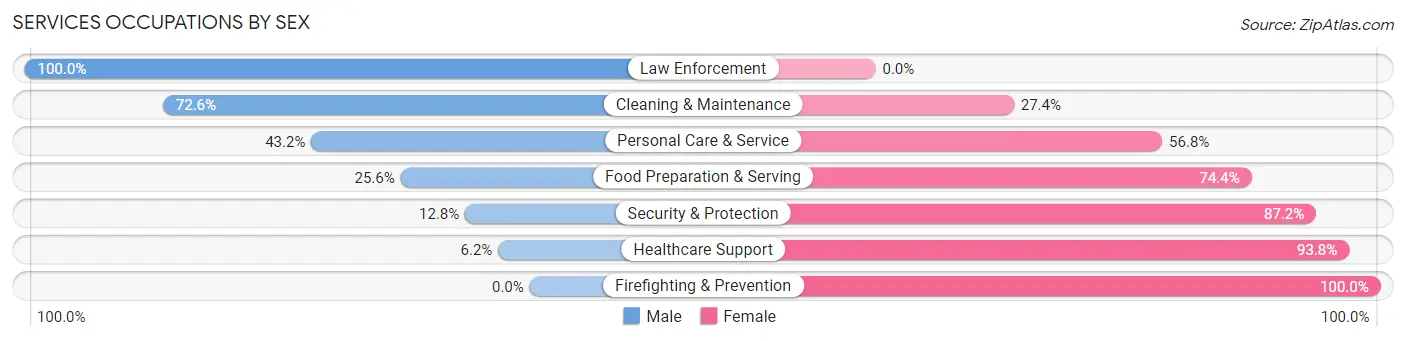
Services Occupations by Sex
Within the Services occupations in Dade City, the most male-oriented occupations are Law Enforcement (100.0%), Cleaning & Maintenance (72.6%), and Personal Care & Service (43.2%), while the most female-oriented occupations are Firefighting & Prevention (100.0%), Healthcare Support (93.8%), and Security & Protection (87.2%).
| Occupation | Male | Female |
| Healthcare Support | 16 (6.2%) | 241 (93.8%) |
| Security & Protection | 6 (12.8%) | 41 (87.2%) |
| Firefighting & Prevention | 0 (0.0%) | 41 (100.0%) |
| Law Enforcement | 6 (100.0%) | 0 (0.0%) |
| Food Preparation & Serving | 23 (25.6%) | 67 (74.4%) |
| Cleaning & Maintenance | 61 (72.6%) | 23 (27.4%) |
| Personal Care & Service | 16 (43.2%) | 21 (56.8%) |
| Total (Category) | 122 (23.7%) | 393 (76.3%) |
| Total (Overall) | 1,164 (45.1%) | 1,415 (54.9%) |
Sales and Office Occupations
The most common Sales and Office occupations in Dade City are Office & Administration (365 | 14.1%), and Sales & Related (184 | 7.1%).
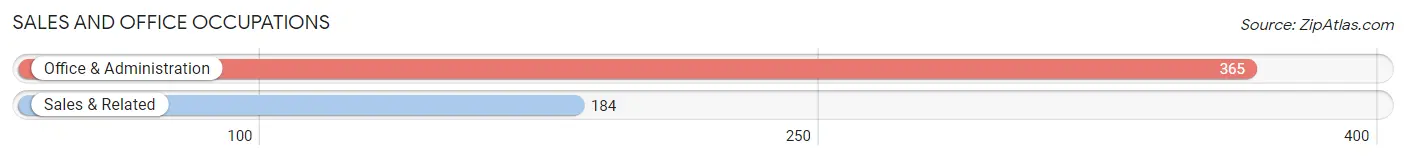
Sales and Office Occupations by Sex

| Occupation | Male | Female |
| Sales & Related | 103 (56.0%) | 81 (44.0%) |
| Office & Administration | 46 (12.6%) | 319 (87.4%) |
| Total (Category) | 149 (27.1%) | 400 (72.9%) |
| Total (Overall) | 1,164 (45.1%) | 1,415 (54.9%) |
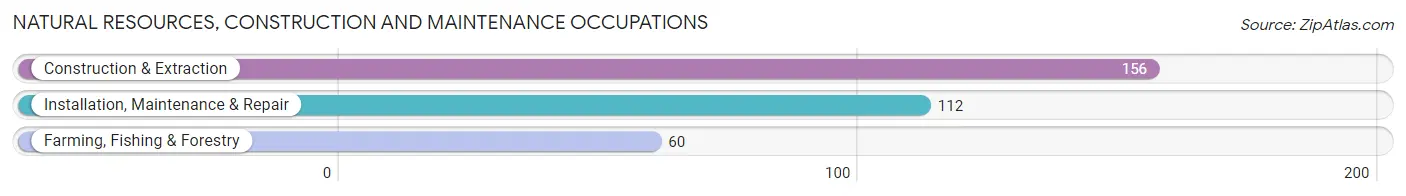
Natural Resources, Construction and Maintenance Occupations
The most common Natural Resources, Construction and Maintenance occupations in Dade City are Construction & Extraction (156 | 6.0%), Installation, Maintenance & Repair (112 | 4.3%), and Farming, Fishing & Forestry (60 | 2.3%).
Natural Resources, Construction and Maintenance Occupations by Sex
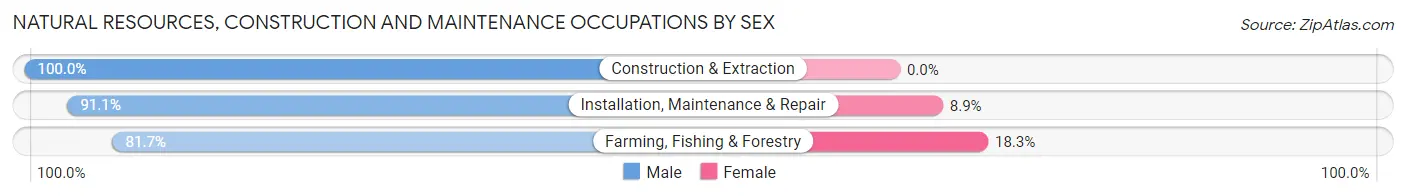
| Occupation | Male | Female |
| Farming, Fishing & Forestry | 49 (81.7%) | 11 (18.3%) |
| Construction & Extraction | 156 (100.0%) | 0 (0.0%) |
| Installation, Maintenance & Repair | 102 (91.1%) | 10 (8.9%) |
| Total (Category) | 307 (93.6%) | 21 (6.4%) |
| Total (Overall) | 1,164 (45.1%) | 1,415 (54.9%) |
Production, Transportation and Moving Occupations
The most common Production, Transportation and Moving occupations in Dade City are Material Moving (89 | 3.5%), Transportation (73 | 2.8%), and Production (26 | 1.0%).
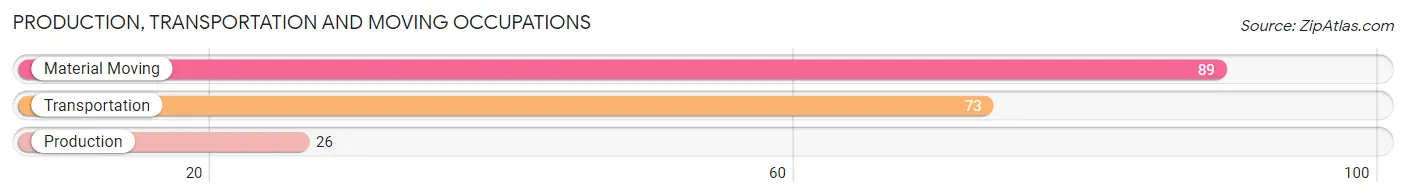
Production, Transportation and Moving Occupations by Sex
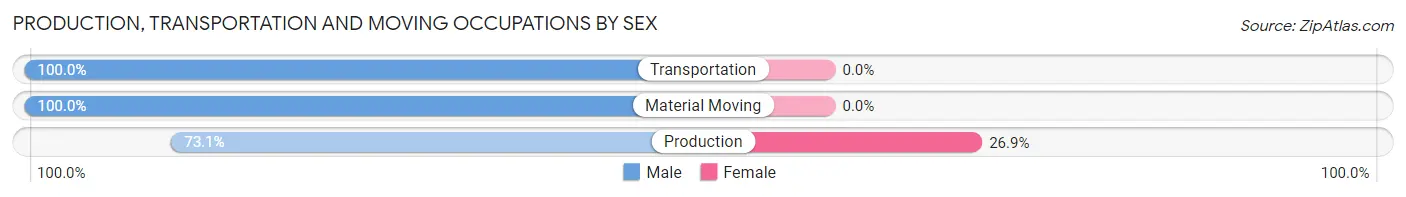
| Occupation | Male | Female |
| Production | 19 (73.1%) | 7 (26.9%) |
| Transportation | 73 (100.0%) | 0 (0.0%) |
| Material Moving | 89 (100.0%) | 0 (0.0%) |
| Total (Category) | 181 (96.3%) | 7 (3.7%) |
| Total (Overall) | 1,164 (45.1%) | 1,415 (54.9%) |
Employment Industries by Sex in Dade City
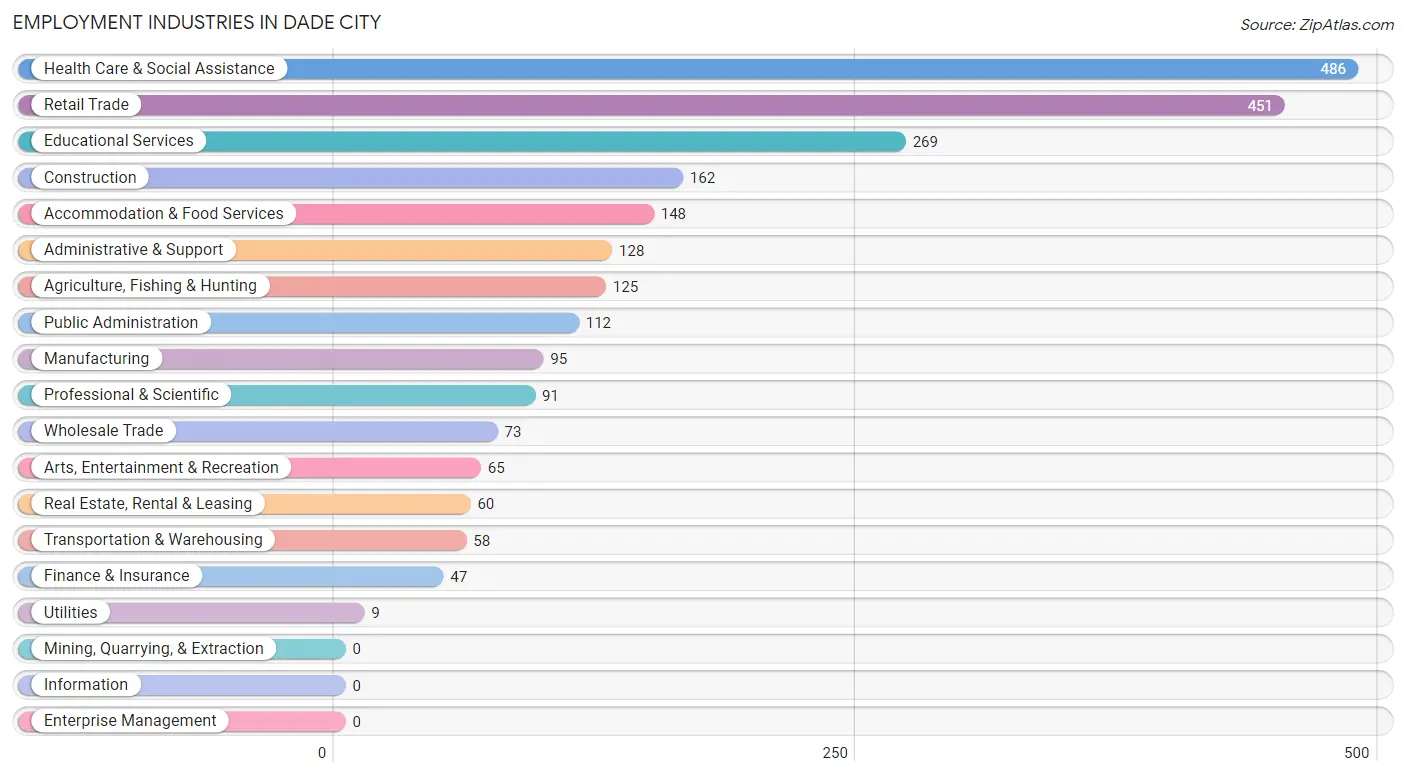
Employment Industries in Dade City
The major employment industries in Dade City include Health Care & Social Assistance (486 | 18.8%), Retail Trade (451 | 17.5%), Educational Services (269 | 10.4%), Construction (162 | 6.3%), and Accommodation & Food Services (148 | 5.7%).
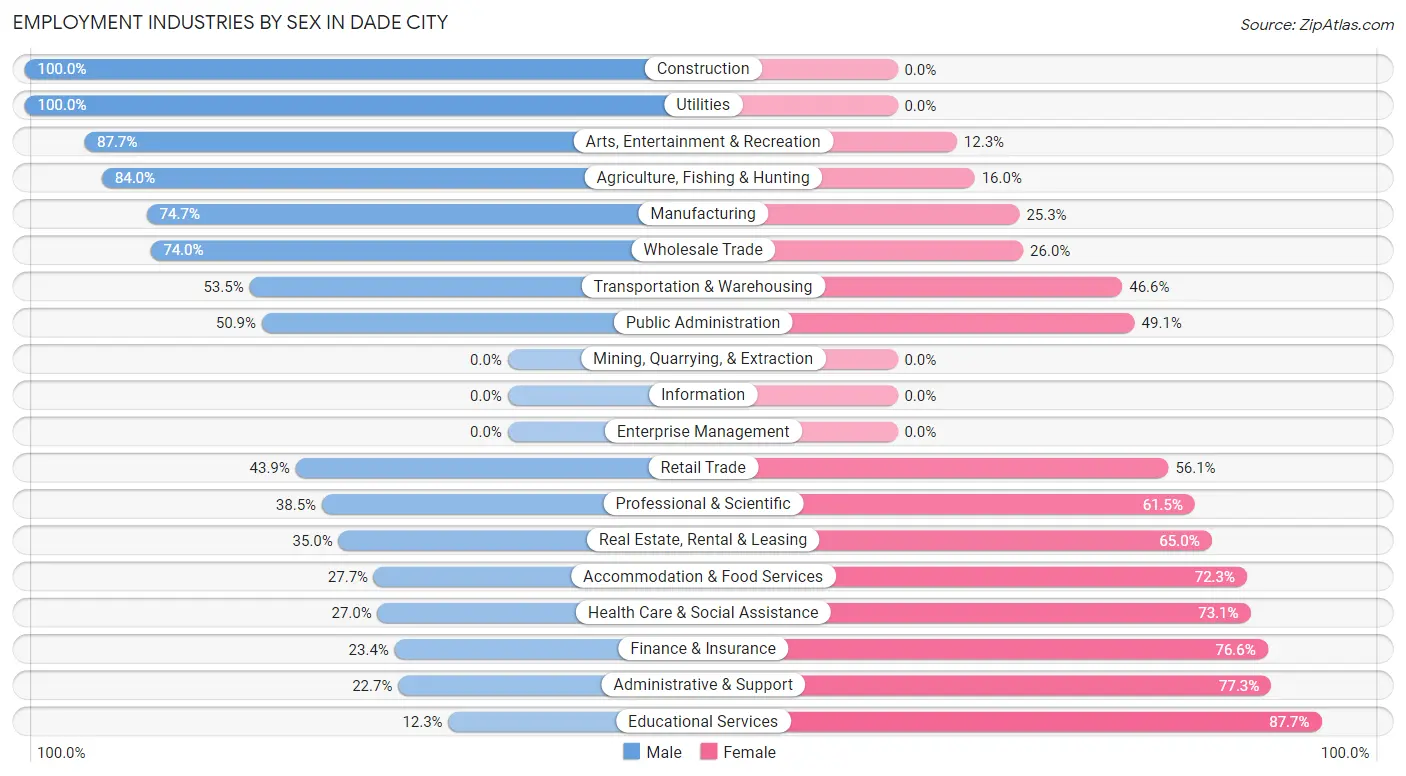
Employment Industries by Sex in Dade City
The Dade City industries that see more men than women are Construction (100.0%), Utilities (100.0%), and Arts, Entertainment & Recreation (87.7%), whereas the industries that tend to have a higher number of women are Educational Services (87.7%), Administrative & Support (77.3%), and Finance & Insurance (76.6%).
| Industry | Male | Female |
| Agriculture, Fishing & Hunting | 105 (84.0%) | 20 (16.0%) |
| Mining, Quarrying, & Extraction | 0 (0.0%) | 0 (0.0%) |
| Construction | 162 (100.0%) | 0 (0.0%) |
| Manufacturing | 71 (74.7%) | 24 (25.3%) |
| Wholesale Trade | 54 (74.0%) | 19 (26.0%) |
| Retail Trade | 198 (43.9%) | 253 (56.1%) |
| Transportation & Warehousing | 31 (53.4%) | 27 (46.6%) |
| Utilities | 9 (100.0%) | 0 (0.0%) |
| Information | 0 (0.0%) | 0 (0.0%) |
| Finance & Insurance | 11 (23.4%) | 36 (76.6%) |
| Real Estate, Rental & Leasing | 21 (35.0%) | 39 (65.0%) |
| Professional & Scientific | 35 (38.5%) | 56 (61.5%) |
| Enterprise Management | 0 (0.0%) | 0 (0.0%) |
| Administrative & Support | 29 (22.7%) | 99 (77.3%) |
| Educational Services | 33 (12.3%) | 236 (87.7%) |
| Health Care & Social Assistance | 131 (27.0%) | 355 (73.1%) |
| Arts, Entertainment & Recreation | 57 (87.7%) | 8 (12.3%) |
| Accommodation & Food Services | 41 (27.7%) | 107 (72.3%) |
| Public Administration | 57 (50.9%) | 55 (49.1%) |
| Total | 1,164 (45.1%) | 1,415 (54.9%) |
Education in Dade City
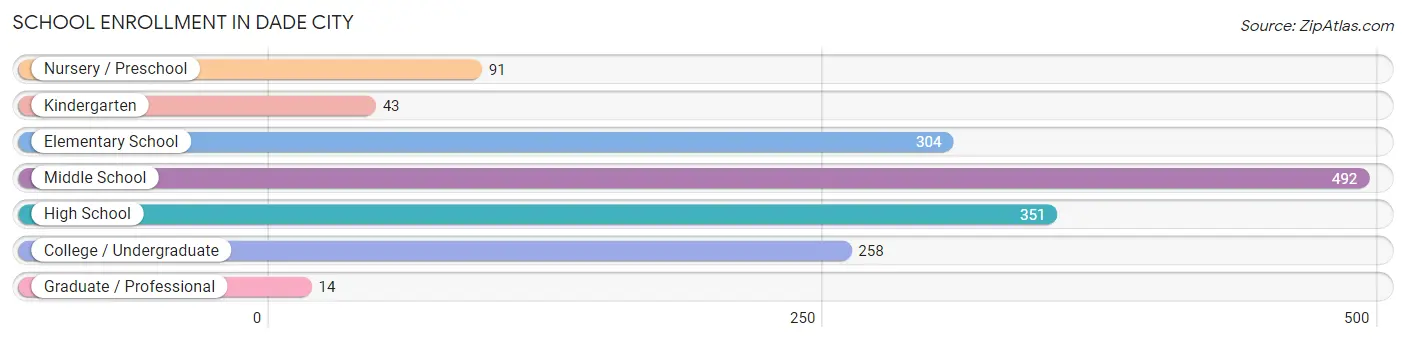
School Enrollment in Dade City
The most common levels of schooling among the 1,553 students in Dade City are middle school (492 | 31.7%), high school (351 | 22.6%), and elementary school (304 | 19.6%).
| School Level | # Students | % Students |
| Nursery / Preschool | 91 | 5.9% |
| Kindergarten | 43 | 2.8% |
| Elementary School | 304 | 19.6% |
| Middle School | 492 | 31.7% |
| High School | 351 | 22.6% |
| College / Undergraduate | 258 | 16.6% |
| Graduate / Professional | 14 | 0.9% |
| Total | 1,553 | 100.0% |
School Enrollment by Age by Funding Source in Dade City
Out of a total of 1,553 students who are enrolled in schools in Dade City, 168 (10.8%) attend a private institution, while the remaining 1,385 (89.2%) are enrolled in public schools. The age group of 18 to 19 year olds has the highest likelihood of being enrolled in private schools, with 31 (25.2% in the age bracket) enrolled. Conversely, the age group of 3 to 4 year olds has the lowest likelihood of being enrolled in a private school, with 75 (100.0% in the age bracket) attending a public institution.
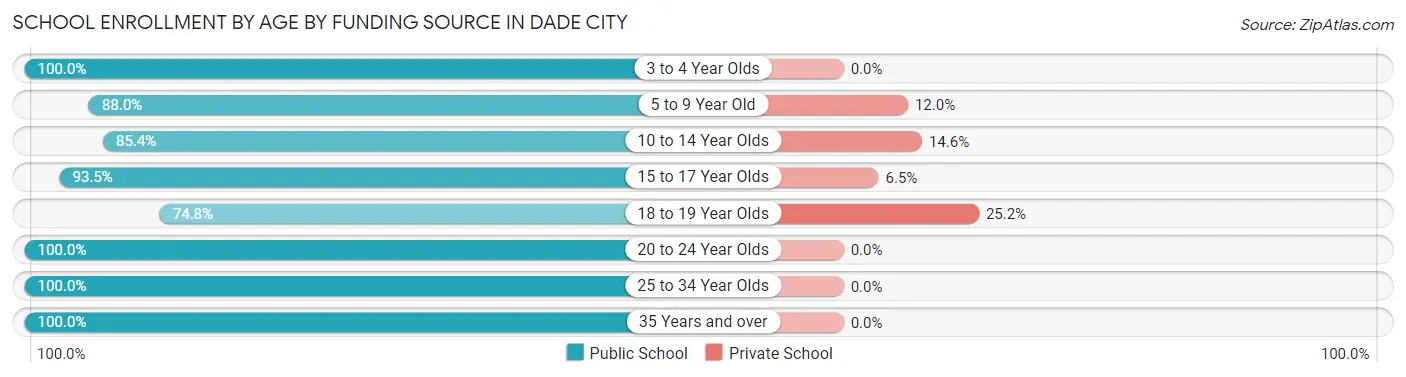
| Age Bracket | Public School | Private School |
| 3 to 4 Year Olds | 75 (100.0%) | 0 (0.0%) |
| 5 to 9 Year Old | 294 (88.0%) | 40 (12.0%) |
| 10 to 14 Year Olds | 445 (85.4%) | 76 (14.6%) |
| 15 to 17 Year Olds | 302 (93.5%) | 21 (6.5%) |
| 18 to 19 Year Olds | 92 (74.8%) | 31 (25.2%) |
| 20 to 24 Year Olds | 37 (100.0%) | 0 (0.0%) |
| 25 to 34 Year Olds | 46 (100.0%) | 0 (0.0%) |
| 35 Years and over | 94 (100.0%) | 0 (0.0%) |
| Total | 1,385 (89.2%) | 168 (10.8%) |
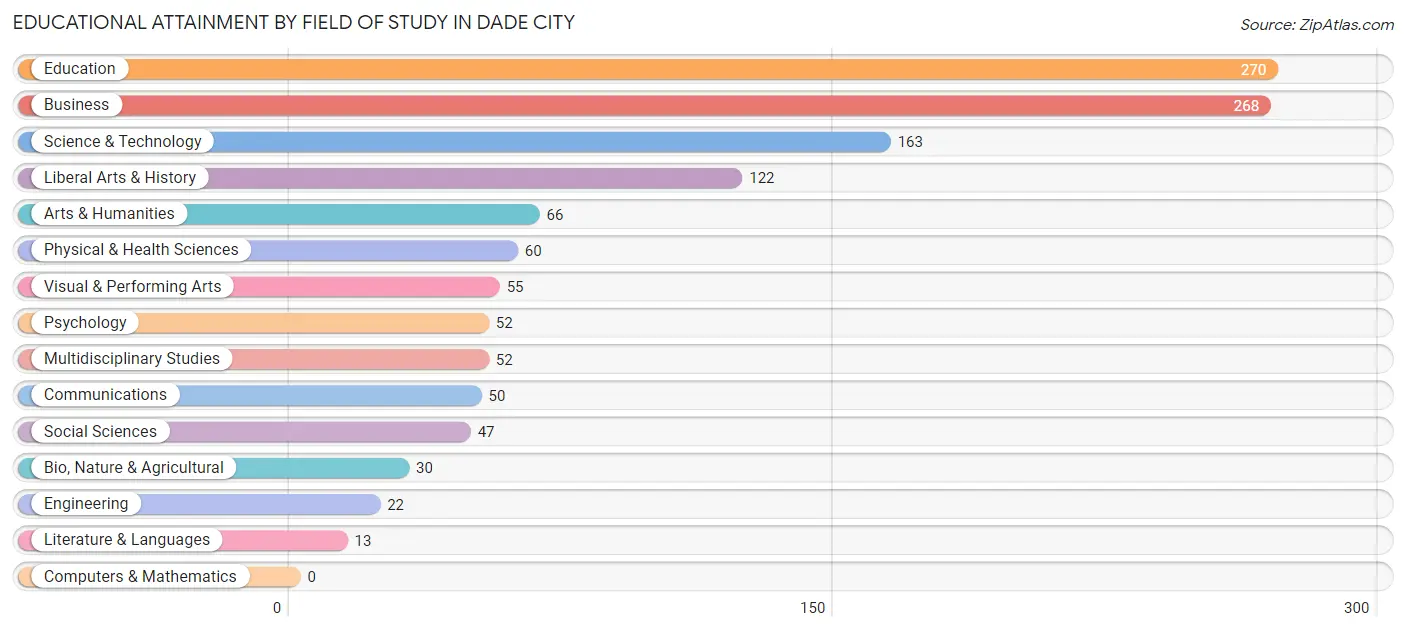
Educational Attainment by Field of Study in Dade City
Education (270 | 21.3%), business (268 | 21.1%), science & technology (163 | 12.8%), liberal arts & history (122 | 9.6%), and arts & humanities (66 | 5.2%) are the most common fields of study among 1,270 individuals in Dade City who have obtained a bachelor's degree or higher.
| Field of Study | # Graduates | % Graduates |
| Computers & Mathematics | 0 | 0.0% |
| Bio, Nature & Agricultural | 30 | 2.4% |
| Physical & Health Sciences | 60 | 4.7% |
| Psychology | 52 | 4.1% |
| Social Sciences | 47 | 3.7% |
| Engineering | 22 | 1.7% |
| Multidisciplinary Studies | 52 | 4.1% |
| Science & Technology | 163 | 12.8% |
| Business | 268 | 21.1% |
| Education | 270 | 21.3% |
| Literature & Languages | 13 | 1.0% |
| Liberal Arts & History | 122 | 9.6% |
| Visual & Performing Arts | 55 | 4.3% |
| Communications | 50 | 3.9% |
| Arts & Humanities | 66 | 5.2% |
| Total | 1,270 | 100.0% |
Transportation & Commute in Dade City
Vehicle Availability by Sex in Dade City
The most prevalent vehicle ownership categories in Dade City are males with 2 vehicles (550, accounting for 47.2%) and females with 2 vehicles (704, making up 39.4%).
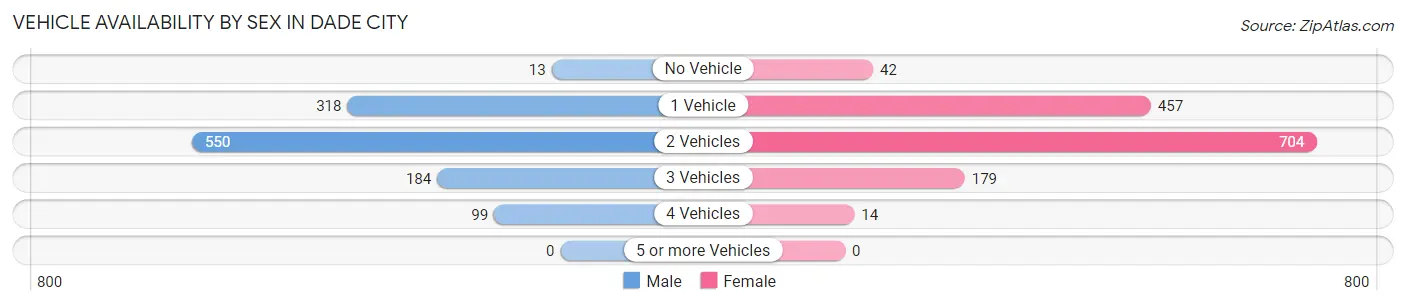
| Vehicles Available | Male | Female |
| No Vehicle | 13 (1.1%) | 42 (3.0%) |
| 1 Vehicle | 318 (27.3%) | 457 (32.7%) |
| 2 Vehicles | 550 (47.2%) | 704 (50.4%) |
| 3 Vehicles | 184 (15.8%) | 179 (12.8%) |
| 4 Vehicles | 99 (8.5%) | 14 (1.0%) |
| 5 or more Vehicles | 0 (0.0%) | 0 (0.0%) |
| Total | 1,164 (100.0%) | 1,396 (100.0%) |
Commute Time in Dade City
The most frequently occuring commute durations in Dade City are 15 to 19 minutes (451 commuters, 19.8%), 5 to 9 minutes (431 commuters, 18.9%), and 60 to 89 minutes (335 commuters, 14.7%).
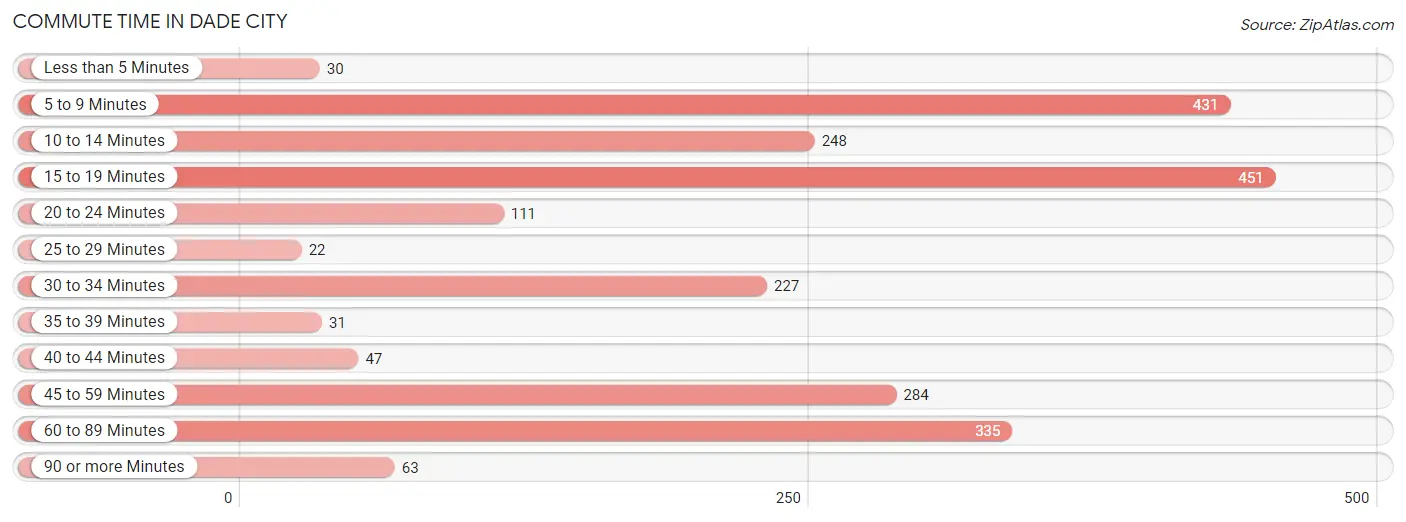
| Commute Time | # Commuters | % Commuters |
| Less than 5 Minutes | 30 | 1.3% |
| 5 to 9 Minutes | 431 | 18.9% |
| 10 to 14 Minutes | 248 | 10.9% |
| 15 to 19 Minutes | 451 | 19.8% |
| 20 to 24 Minutes | 111 | 4.9% |
| 25 to 29 Minutes | 22 | 1.0% |
| 30 to 34 Minutes | 227 | 10.0% |
| 35 to 39 Minutes | 31 | 1.4% |
| 40 to 44 Minutes | 47 | 2.1% |
| 45 to 59 Minutes | 284 | 12.5% |
| 60 to 89 Minutes | 335 | 14.7% |
| 90 or more Minutes | 63 | 2.8% |
Commute Time by Sex in Dade City
The most common commute times in Dade City are 45 to 59 minutes (232 commuters, 22.3%) for males and 5 to 9 minutes (326 commuters, 26.3%) for females.
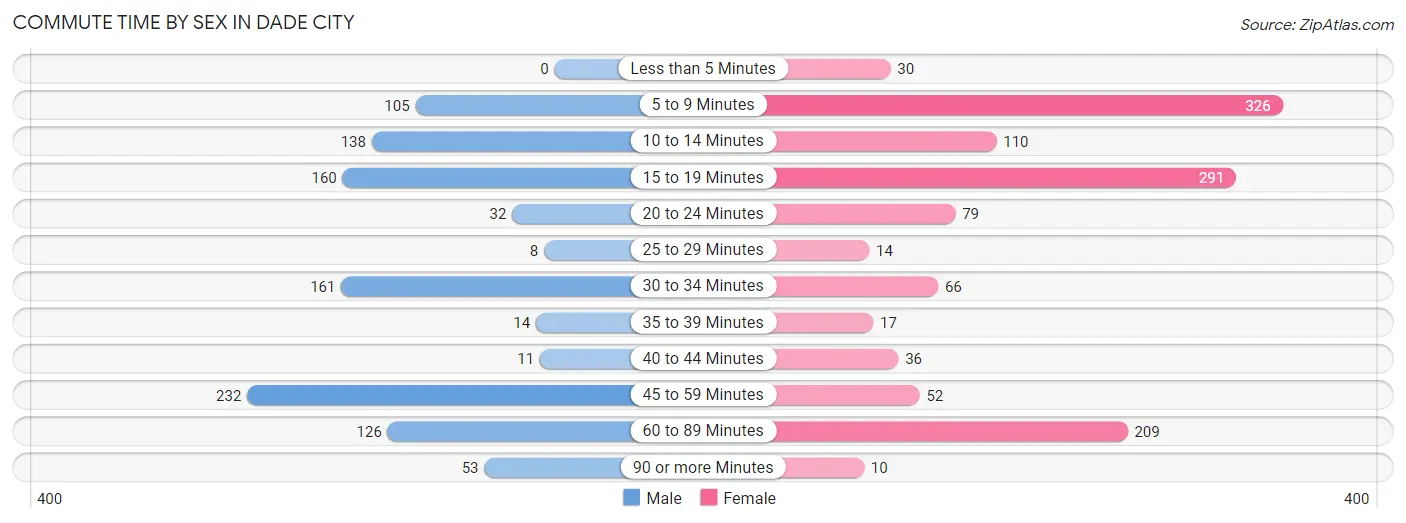
| Commute Time | Male | Female |
| Less than 5 Minutes | 0 (0.0%) | 30 (2.4%) |
| 5 to 9 Minutes | 105 (10.1%) | 326 (26.3%) |
| 10 to 14 Minutes | 138 (13.3%) | 110 (8.9%) |
| 15 to 19 Minutes | 160 (15.4%) | 291 (23.5%) |
| 20 to 24 Minutes | 32 (3.1%) | 79 (6.4%) |
| 25 to 29 Minutes | 8 (0.8%) | 14 (1.1%) |
| 30 to 34 Minutes | 161 (15.5%) | 66 (5.3%) |
| 35 to 39 Minutes | 14 (1.3%) | 17 (1.4%) |
| 40 to 44 Minutes | 11 (1.1%) | 36 (2.9%) |
| 45 to 59 Minutes | 232 (22.3%) | 52 (4.2%) |
| 60 to 89 Minutes | 126 (12.1%) | 209 (16.9%) |
| 90 or more Minutes | 53 (5.1%) | 10 (0.8%) |
Time of Departure to Work by Sex in Dade City
The most frequent times of departure to work in Dade City are 6:30 AM to 6:59 AM (157, 15.1%) for males and 7:00 AM to 7:29 AM (234, 18.9%) for females.
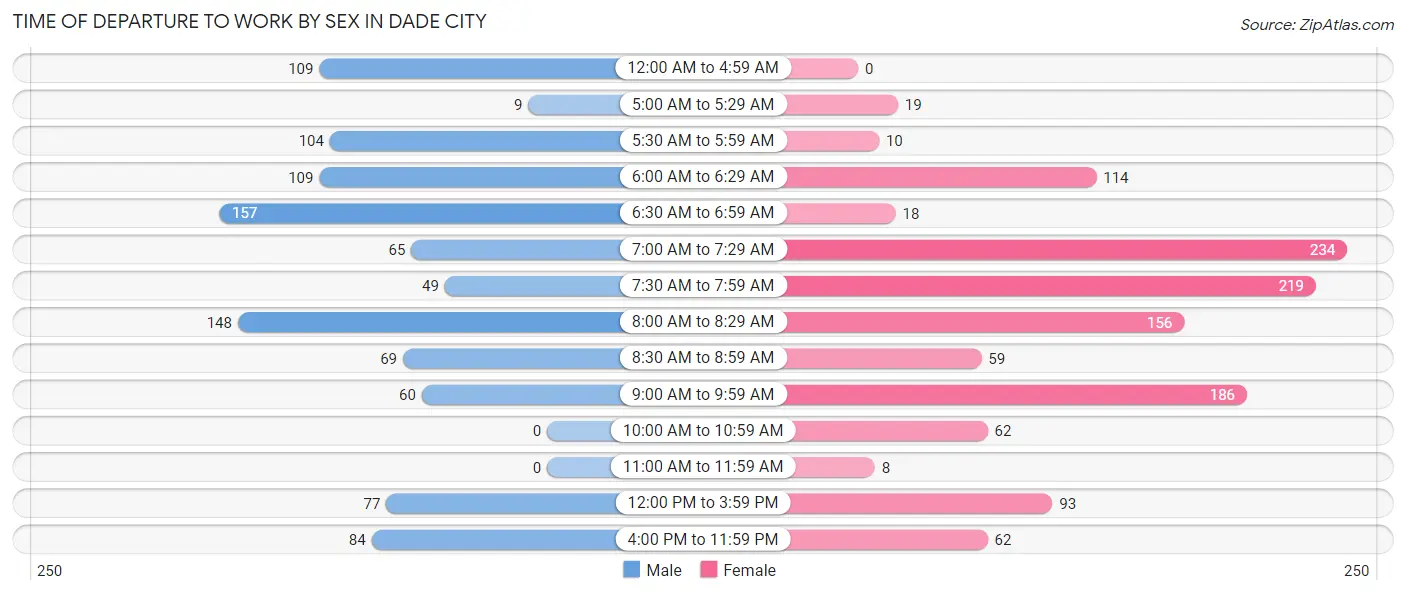
| Time of Departure | Male | Female |
| 12:00 AM to 4:59 AM | 109 (10.5%) | 0 (0.0%) |
| 5:00 AM to 5:29 AM | 9 (0.9%) | 19 (1.5%) |
| 5:30 AM to 5:59 AM | 104 (10.0%) | 10 (0.8%) |
| 6:00 AM to 6:29 AM | 109 (10.5%) | 114 (9.2%) |
| 6:30 AM to 6:59 AM | 157 (15.1%) | 18 (1.5%) |
| 7:00 AM to 7:29 AM | 65 (6.2%) | 234 (18.9%) |
| 7:30 AM to 7:59 AM | 49 (4.7%) | 219 (17.7%) |
| 8:00 AM to 8:29 AM | 148 (14.2%) | 156 (12.6%) |
| 8:30 AM to 8:59 AM | 69 (6.6%) | 59 (4.8%) |
| 9:00 AM to 9:59 AM | 60 (5.8%) | 186 (15.0%) |
| 10:00 AM to 10:59 AM | 0 (0.0%) | 62 (5.0%) |
| 11:00 AM to 11:59 AM | 0 (0.0%) | 8 (0.6%) |
| 12:00 PM to 3:59 PM | 77 (7.4%) | 93 (7.5%) |
| 4:00 PM to 11:59 PM | 84 (8.1%) | 62 (5.0%) |
| Total | 1,040 (100.0%) | 1,240 (100.0%) |
Housing Occupancy in Dade City
Occupancy by Ownership in Dade City
Of the total 2,505 dwellings in Dade City, owner-occupied units account for 1,652 (65.9%), while renter-occupied units make up 853 (34.1%).
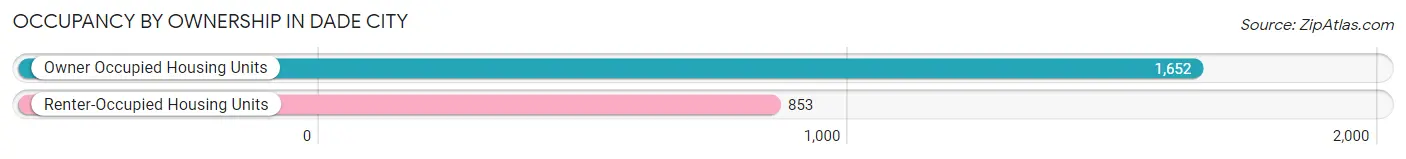
| Occupancy | # Housing Units | % Housing Units |
| Owner Occupied Housing Units | 1,652 | 65.9% |
| Renter-Occupied Housing Units | 853 | 34.1% |
| Total Occupied Housing Units | 2,505 | 100.0% |
Occupancy by Household Size in Dade City
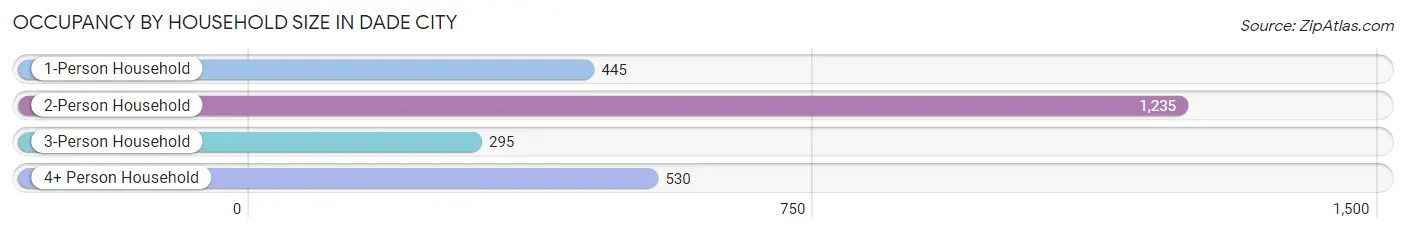
| Household Size | # Housing Units | % Housing Units |
| 1-Person Household | 445 | 17.8% |
| 2-Person Household | 1,235 | 49.3% |
| 3-Person Household | 295 | 11.8% |
| 4+ Person Household | 530 | 21.2% |
| Total Housing Units | 2,505 | 100.0% |
Occupancy by Ownership by Household Size in Dade City
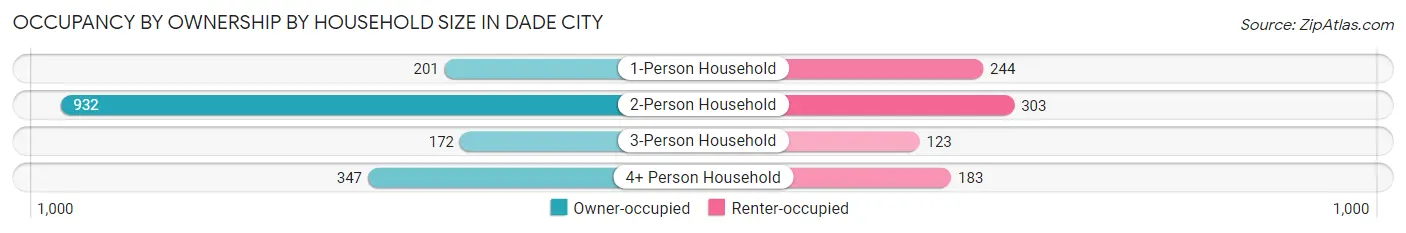
| Household Size | Owner-occupied | Renter-occupied |
| 1-Person Household | 201 (45.2%) | 244 (54.8%) |
| 2-Person Household | 932 (75.5%) | 303 (24.5%) |
| 3-Person Household | 172 (58.3%) | 123 (41.7%) |
| 4+ Person Household | 347 (65.5%) | 183 (34.5%) |
| Total Housing Units | 1,652 (65.9%) | 853 (34.1%) |
Occupancy by Educational Attainment in Dade City
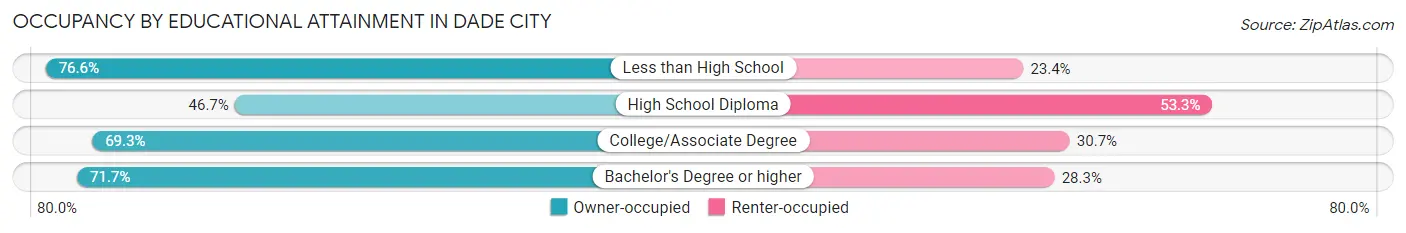
| Household Size | Owner-occupied | Renter-occupied |
| Less than High School | 410 (76.6%) | 125 (23.4%) |
| High School Diploma | 282 (46.7%) | 322 (53.3%) |
| College/Associate Degree | 550 (69.3%) | 244 (30.7%) |
| Bachelor's Degree or higher | 410 (71.7%) | 162 (28.3%) |
Occupancy by Age of Householder in Dade City
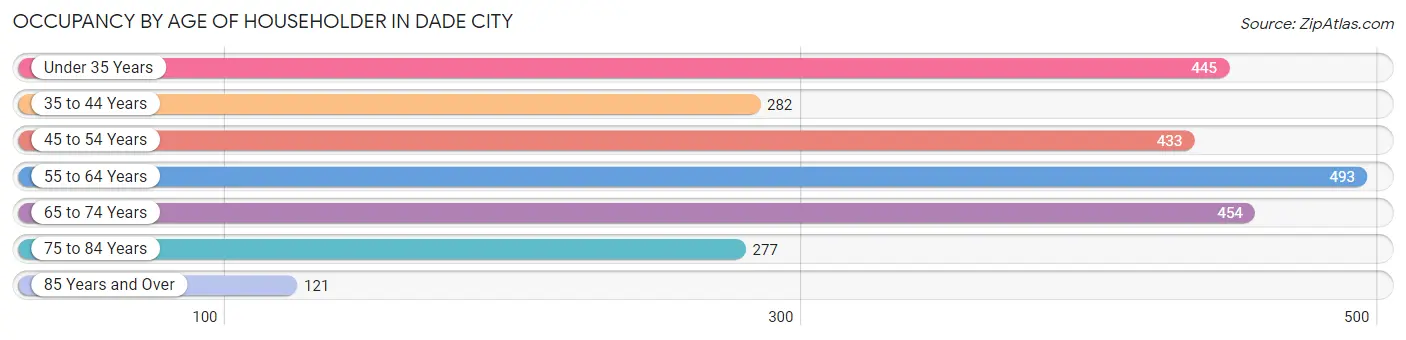
| Age Bracket | # Households | % Households |
| Under 35 Years | 445 | 17.8% |
| 35 to 44 Years | 282 | 11.3% |
| 45 to 54 Years | 433 | 17.3% |
| 55 to 64 Years | 493 | 19.7% |
| 65 to 74 Years | 454 | 18.1% |
| 75 to 84 Years | 277 | 11.1% |
| 85 Years and Over | 121 | 4.8% |
| Total | 2,505 | 100.0% |
Housing Finances in Dade City
Median Income by Occupancy in Dade City
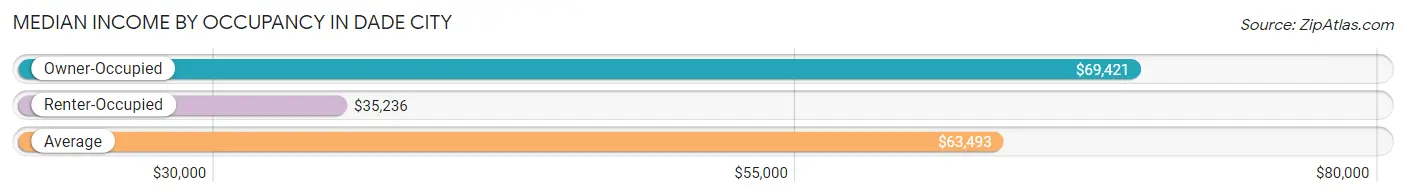
| Occupancy Type | # Households | Median Income |
| Owner-Occupied | 1,652 (65.9%) | $69,421 |
| Renter-Occupied | 853 (34.1%) | $35,236 |
| Average | 2,505 (100.0%) | $63,493 |
Occupancy by Householder Income Bracket in Dade City
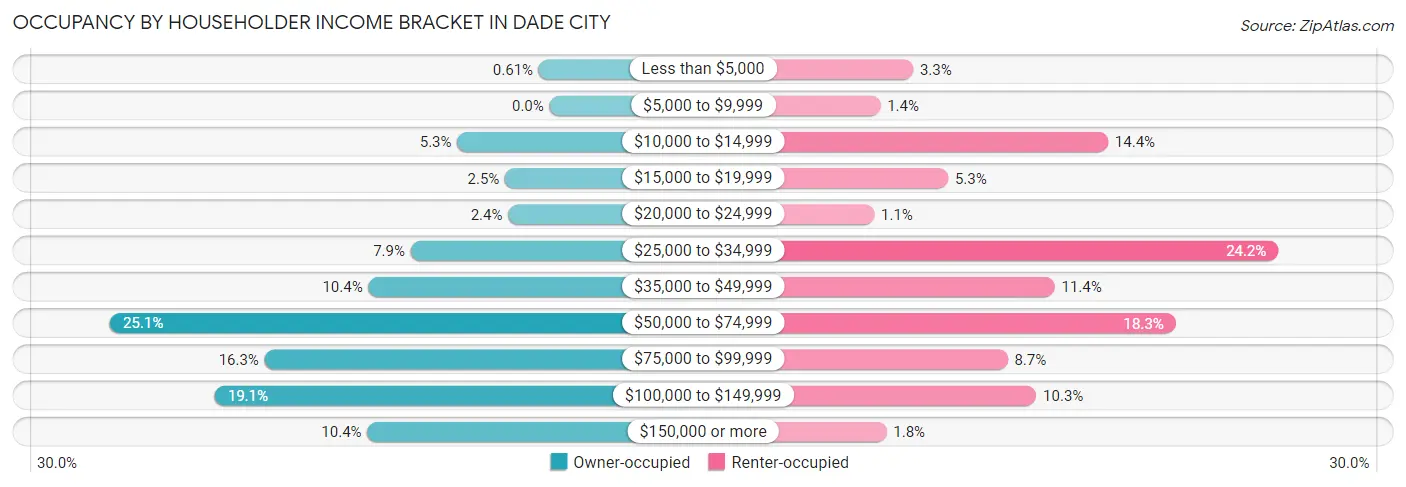
| Income Bracket | Owner-occupied | Renter-occupied |
| Less than $5,000 | 10 (0.6%) | 28 (3.3%) |
| $5,000 to $9,999 | 0 (0.0%) | 12 (1.4%) |
| $10,000 to $14,999 | 87 (5.3%) | 123 (14.4%) |
| $15,000 to $19,999 | 42 (2.5%) | 45 (5.3%) |
| $20,000 to $24,999 | 39 (2.4%) | 9 (1.1%) |
| $25,000 to $34,999 | 131 (7.9%) | 206 (24.1%) |
| $35,000 to $49,999 | 171 (10.3%) | 97 (11.4%) |
| $50,000 to $74,999 | 415 (25.1%) | 156 (18.3%) |
| $75,000 to $99,999 | 269 (16.3%) | 74 (8.7%) |
| $100,000 to $149,999 | 316 (19.1%) | 88 (10.3%) |
| $150,000 or more | 172 (10.4%) | 15 (1.8%) |
| Total | 1,652 (100.0%) | 853 (100.0%) |
Monthly Housing Cost Tiers in Dade City
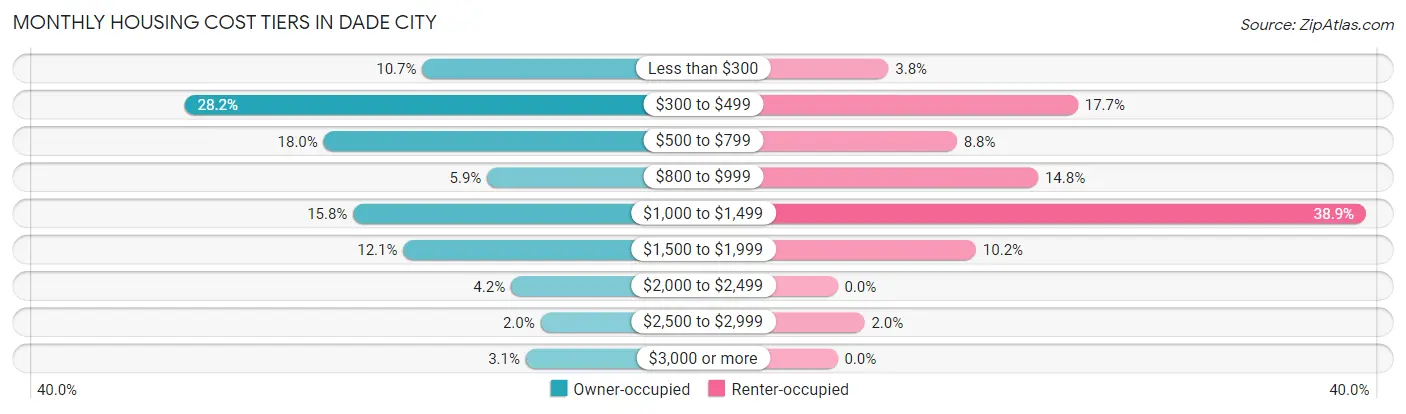
| Monthly Cost | Owner-occupied | Renter-occupied |
| Less than $300 | 177 (10.7%) | 32 (3.7%) |
| $300 to $499 | 466 (28.2%) | 151 (17.7%) |
| $500 to $799 | 297 (18.0%) | 75 (8.8%) |
| $800 to $999 | 98 (5.9%) | 126 (14.8%) |
| $1,000 to $1,499 | 261 (15.8%) | 332 (38.9%) |
| $1,500 to $1,999 | 200 (12.1%) | 87 (10.2%) |
| $2,000 to $2,499 | 69 (4.2%) | 0 (0.0%) |
| $2,500 to $2,999 | 33 (2.0%) | 17 (2.0%) |
| $3,000 or more | 51 (3.1%) | 0 (0.0%) |
| Total | 1,652 (100.0%) | 853 (100.0%) |
Physical Housing Characteristics in Dade City
Housing Structures in Dade City
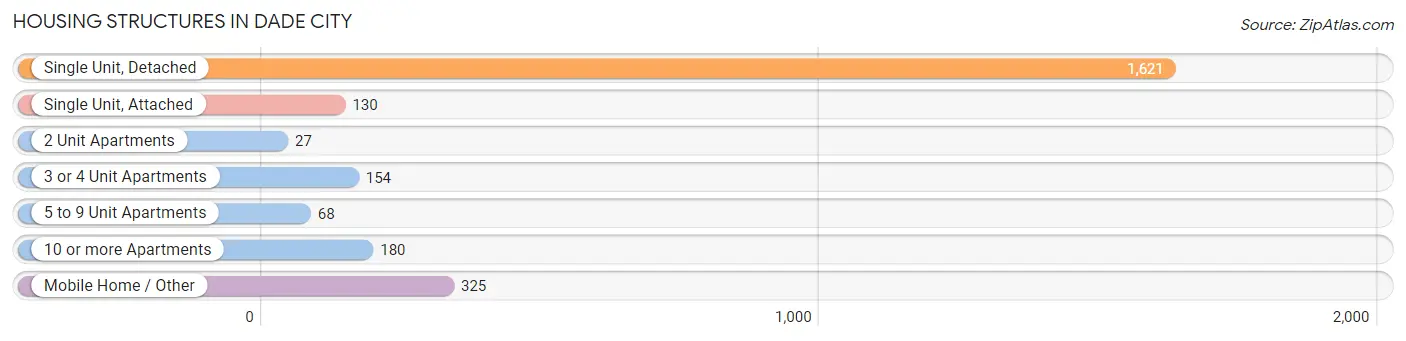
| Structure Type | # Housing Units | % Housing Units |
| Single Unit, Detached | 1,621 | 64.7% |
| Single Unit, Attached | 130 | 5.2% |
| 2 Unit Apartments | 27 | 1.1% |
| 3 or 4 Unit Apartments | 154 | 6.1% |
| 5 to 9 Unit Apartments | 68 | 2.7% |
| 10 or more Apartments | 180 | 7.2% |
| Mobile Home / Other | 325 | 13.0% |
| Total | 2,505 | 100.0% |
Housing Structures by Occupancy in Dade City
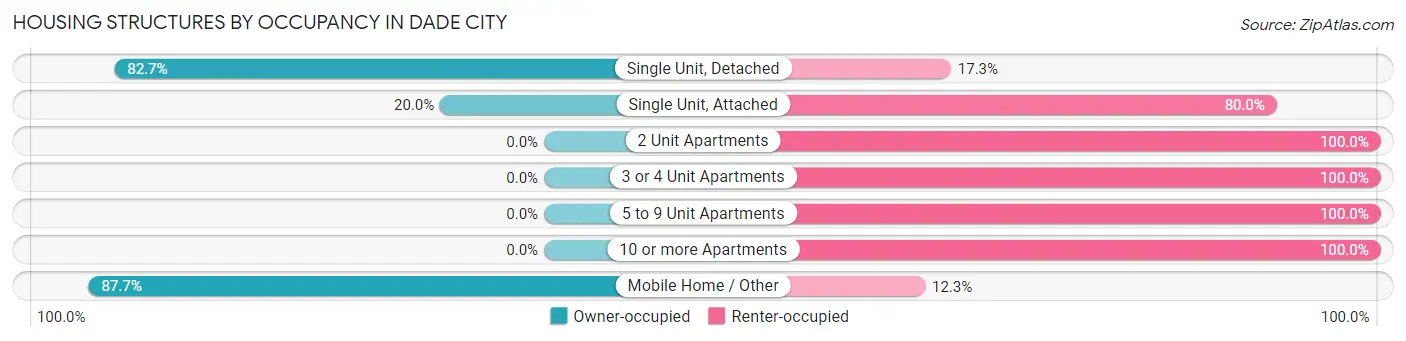
| Structure Type | Owner-occupied | Renter-occupied |
| Single Unit, Detached | 1,341 (82.7%) | 280 (17.3%) |
| Single Unit, Attached | 26 (20.0%) | 104 (80.0%) |
| 2 Unit Apartments | 0 (0.0%) | 27 (100.0%) |
| 3 or 4 Unit Apartments | 0 (0.0%) | 154 (100.0%) |
| 5 to 9 Unit Apartments | 0 (0.0%) | 68 (100.0%) |
| 10 or more Apartments | 0 (0.0%) | 180 (100.0%) |
| Mobile Home / Other | 285 (87.7%) | 40 (12.3%) |
| Total | 1,652 (65.9%) | 853 (34.1%) |
Housing Structures by Number of Rooms in Dade City
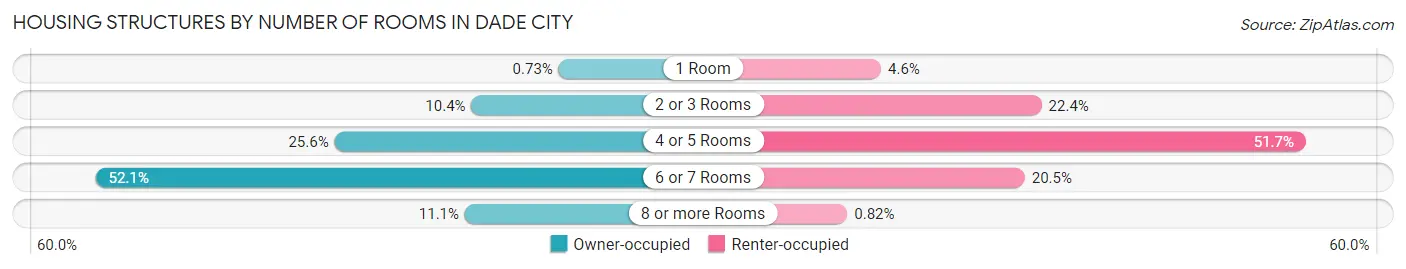
| Number of Rooms | Owner-occupied | Renter-occupied |
| 1 Room | 12 (0.7%) | 39 (4.6%) |
| 2 or 3 Rooms | 172 (10.4%) | 191 (22.4%) |
| 4 or 5 Rooms | 423 (25.6%) | 441 (51.7%) |
| 6 or 7 Rooms | 861 (52.1%) | 175 (20.5%) |
| 8 or more Rooms | 184 (11.1%) | 7 (0.8%) |
| Total | 1,652 (100.0%) | 853 (100.0%) |
Housing Structure by Heating Type in Dade City
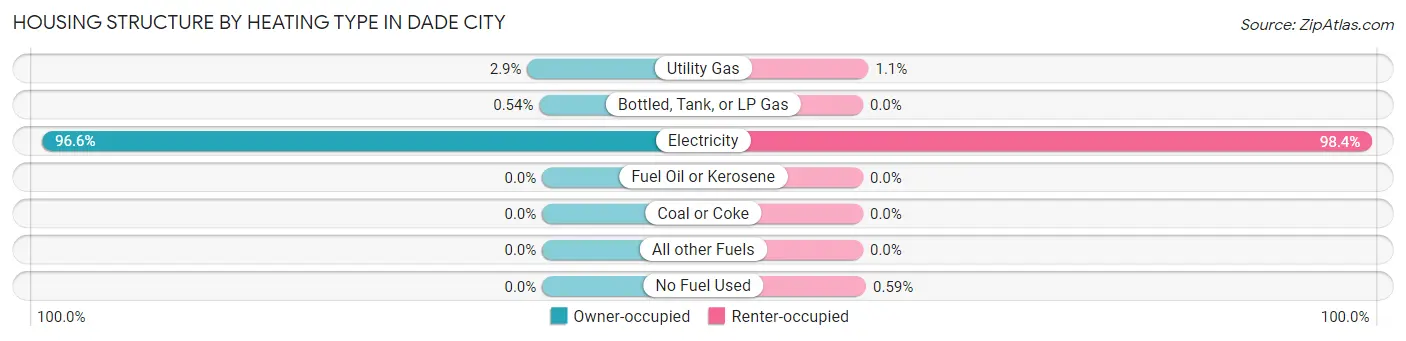
| Heating Type | Owner-occupied | Renter-occupied |
| Utility Gas | 47 (2.9%) | 9 (1.1%) |
| Bottled, Tank, or LP Gas | 9 (0.5%) | 0 (0.0%) |
| Electricity | 1,596 (96.6%) | 839 (98.4%) |
| Fuel Oil or Kerosene | 0 (0.0%) | 0 (0.0%) |
| Coal or Coke | 0 (0.0%) | 0 (0.0%) |
| All other Fuels | 0 (0.0%) | 0 (0.0%) |
| No Fuel Used | 0 (0.0%) | 5 (0.6%) |
| Total | 1,652 (100.0%) | 853 (100.0%) |
Household Vehicle Usage in Dade City
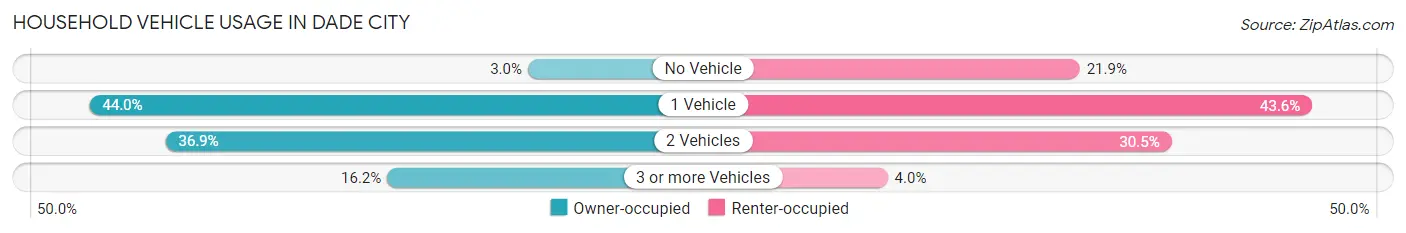
| Vehicles per Household | Owner-occupied | Renter-occupied |
| No Vehicle | 50 (3.0%) | 187 (21.9%) |
| 1 Vehicle | 726 (44.0%) | 372 (43.6%) |
| 2 Vehicles | 609 (36.9%) | 260 (30.5%) |
| 3 or more Vehicles | 267 (16.2%) | 34 (4.0%) |
| Total | 1,652 (100.0%) | 853 (100.0%) |
Real Estate & Mortgages in Dade City
Real Estate and Mortgage Overview in Dade City
| Characteristic | Without Mortgage | With Mortgage |
| Housing Units | 815 | 837 |
| Median Property Value | $105,200 | $232,100 |
| Median Household Income | $56,875 | $155 |
| Monthly Housing Costs | $437 | $51 |
| Real Estate Taxes | $895 | $57 |
Property Value by Mortgage Status in Dade City
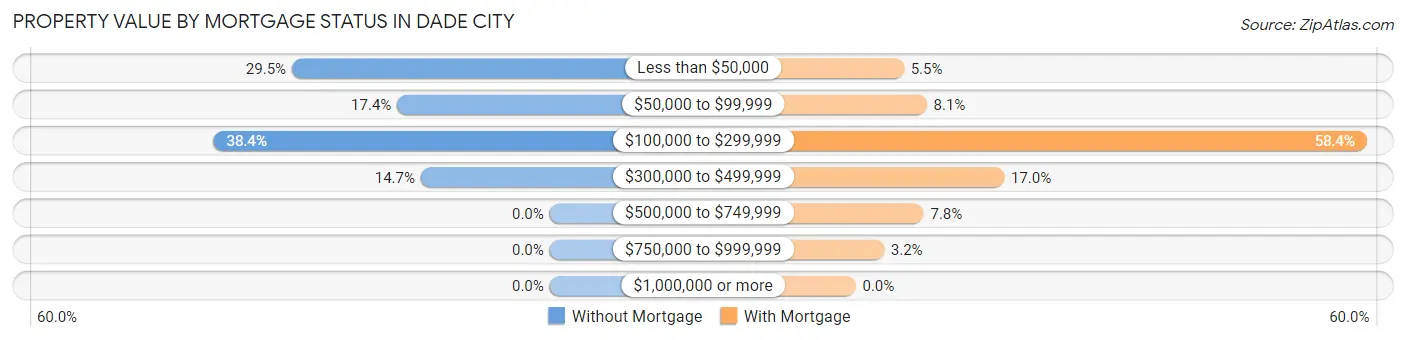
| Property Value | Without Mortgage | With Mortgage |
| Less than $50,000 | 240 (29.4%) | 46 (5.5%) |
| $50,000 to $99,999 | 142 (17.4%) | 68 (8.1%) |
| $100,000 to $299,999 | 313 (38.4%) | 489 (58.4%) |
| $300,000 to $499,999 | 120 (14.7%) | 142 (17.0%) |
| $500,000 to $749,999 | 0 (0.0%) | 65 (7.8%) |
| $750,000 to $999,999 | 0 (0.0%) | 27 (3.2%) |
| $1,000,000 or more | 0 (0.0%) | 0 (0.0%) |
| Total | 815 (100.0%) | 837 (100.0%) |
Household Income by Mortgage Status in Dade City
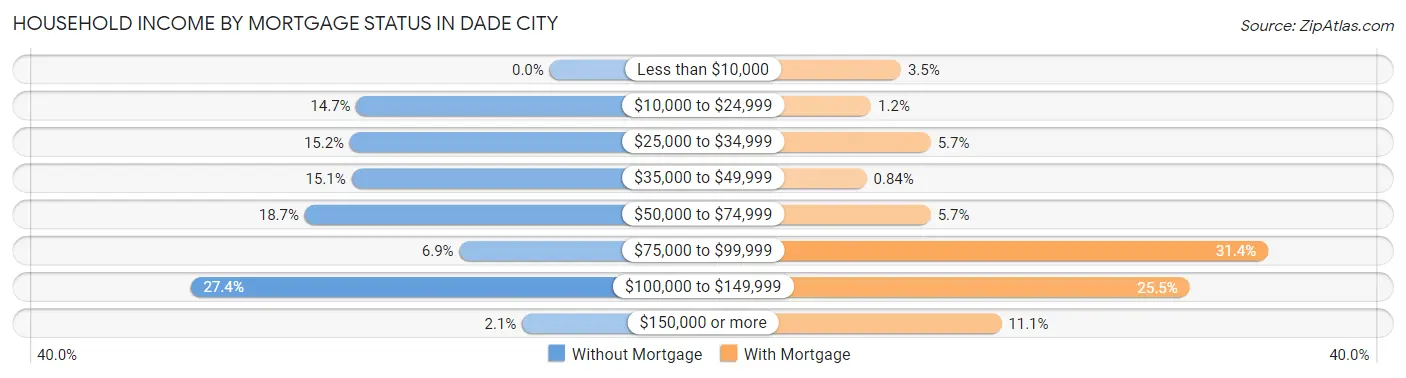
| Household Income | Without Mortgage | With Mortgage |
| Less than $10,000 | 0 (0.0%) | 29 (3.5%) |
| $10,000 to $24,999 | 120 (14.7%) | 10 (1.2%) |
| $25,000 to $34,999 | 124 (15.2%) | 48 (5.7%) |
| $35,000 to $49,999 | 123 (15.1%) | 7 (0.8%) |
| $50,000 to $74,999 | 152 (18.6%) | 48 (5.7%) |
| $75,000 to $99,999 | 56 (6.9%) | 263 (31.4%) |
| $100,000 to $149,999 | 223 (27.4%) | 213 (25.5%) |
| $150,000 or more | 17 (2.1%) | 93 (11.1%) |
| Total | 815 (100.0%) | 837 (100.0%) |
Property Value to Household Income Ratio in Dade City
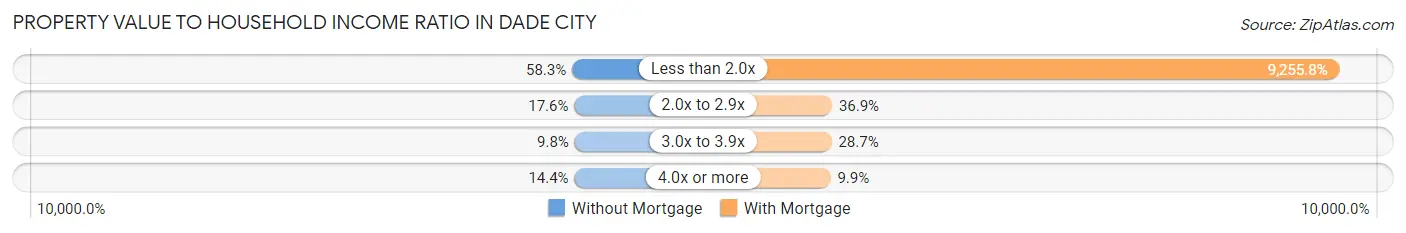
| Value-to-Income Ratio | Without Mortgage | With Mortgage |
| Less than 2.0x | 475 (58.3%) | 77,471 (9,255.8%) |
| 2.0x to 2.9x | 143 (17.5%) | 309 (36.9%) |
| 3.0x to 3.9x | 80 (9.8%) | 240 (28.7%) |
| 4.0x or more | 117 (14.4%) | 83 (9.9%) |
| Total | 815 (100.0%) | 837 (100.0%) |
Real Estate Taxes by Mortgage Status in Dade City
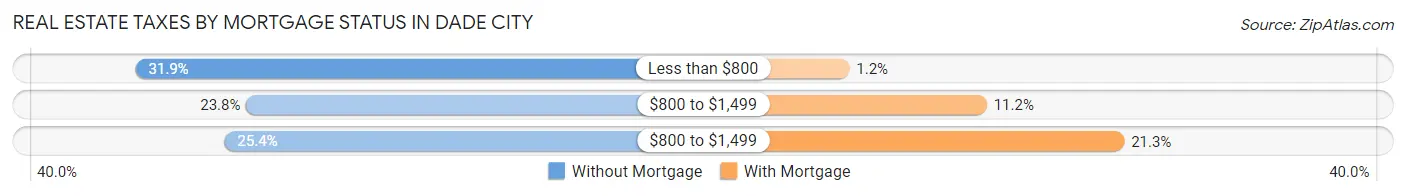
| Property Taxes | Without Mortgage | With Mortgage |
| Less than $800 | 260 (31.9%) | 10 (1.2%) |
| $800 to $1,499 | 194 (23.8%) | 94 (11.2%) |
| $800 to $1,499 | 207 (25.4%) | 178 (21.3%) |
| Total | 815 (100.0%) | 837 (100.0%) |
Health & Disability in Dade City
Health Insurance Coverage by Age in Dade City
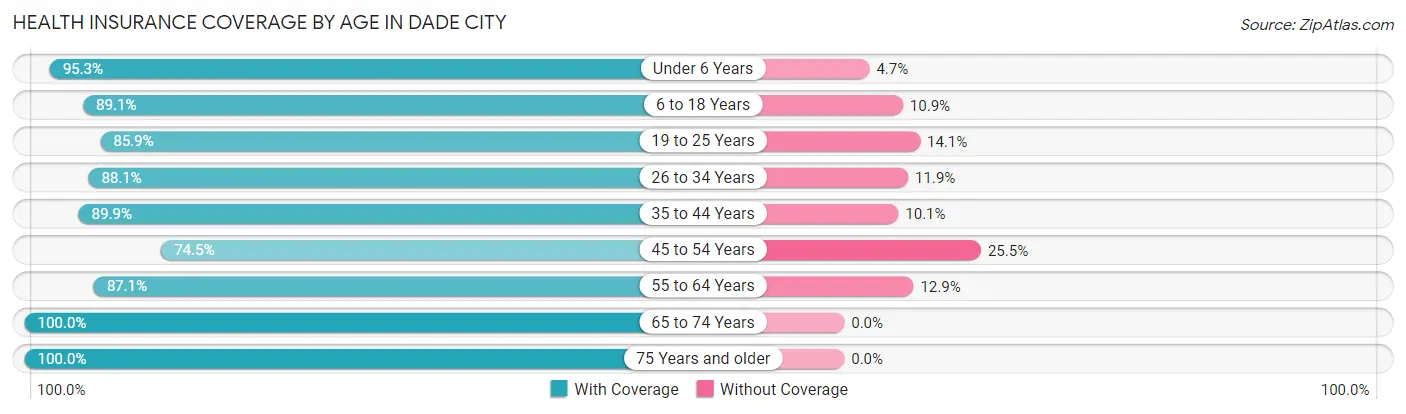
| Age Bracket | With Coverage | Without Coverage |
| Under 6 Years | 305 (95.3%) | 15 (4.7%) |
| 6 to 18 Years | 1,214 (89.1%) | 149 (10.9%) |
| 19 to 25 Years | 371 (85.9%) | 61 (14.1%) |
| 26 to 34 Years | 910 (88.1%) | 123 (11.9%) |
| 35 to 44 Years | 571 (89.9%) | 64 (10.1%) |
| 45 to 54 Years | 535 (74.5%) | 183 (25.5%) |
| 55 to 64 Years | 797 (87.1%) | 118 (12.9%) |
| 65 to 74 Years | 811 (100.0%) | 0 (0.0%) |
| 75 Years and older | 663 (100.0%) | 0 (0.0%) |
| Total | 6,177 (89.6%) | 713 (10.3%) |
Health Insurance Coverage by Citizenship Status in Dade City
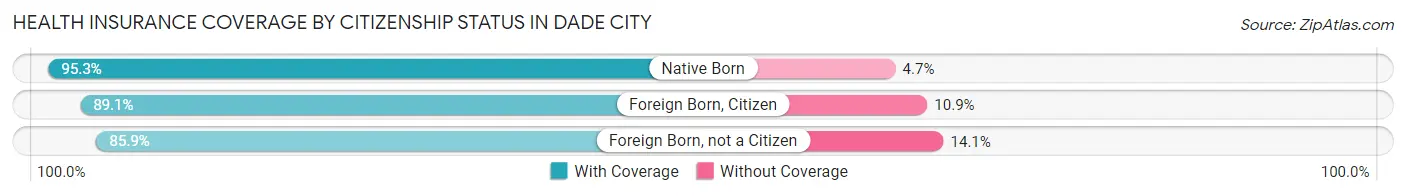
| Citizenship Status | With Coverage | Without Coverage |
| Native Born | 305 (95.3%) | 15 (4.7%) |
| Foreign Born, Citizen | 1,214 (89.1%) | 149 (10.9%) |
| Foreign Born, not a Citizen | 371 (85.9%) | 61 (14.1%) |
Health Insurance Coverage by Household Income in Dade City
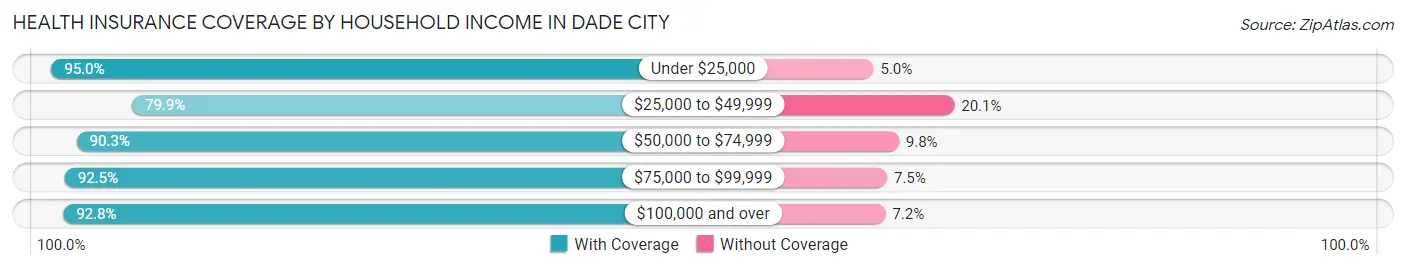
| Household Income | With Coverage | Without Coverage |
| Under $25,000 | 739 (95.0%) | 39 (5.0%) |
| $25,000 to $49,999 | 1,142 (79.9%) | 288 (20.1%) |
| $50,000 to $74,999 | 1,666 (90.2%) | 180 (9.8%) |
| $75,000 to $99,999 | 858 (92.5%) | 70 (7.5%) |
| $100,000 and over | 1,742 (92.8%) | 136 (7.2%) |
Public vs Private Health Insurance Coverage by Age in Dade City
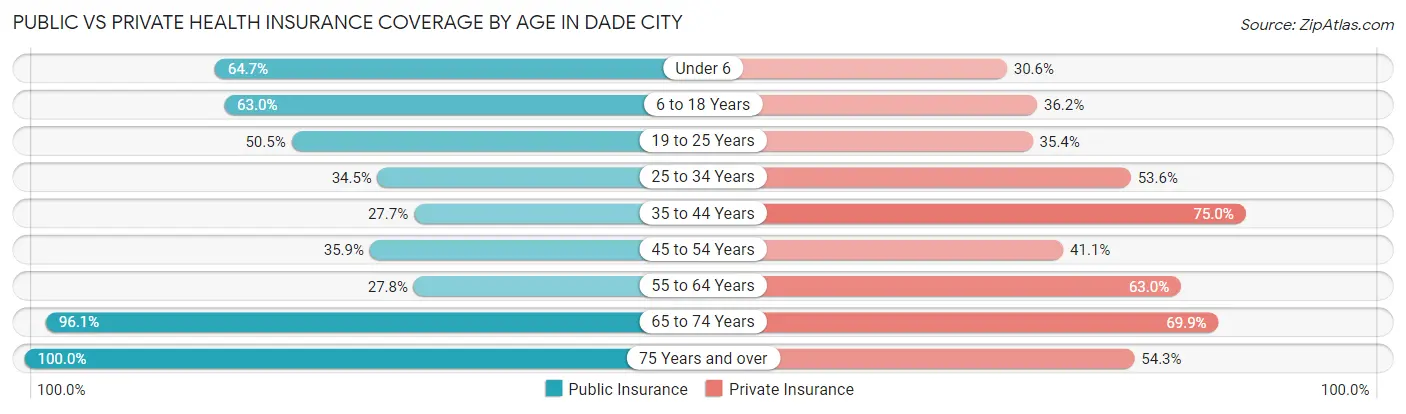
| Age Bracket | Public Insurance | Private Insurance |
| Under 6 | 207 (64.7%) | 98 (30.6%) |
| 6 to 18 Years | 858 (62.9%) | 494 (36.2%) |
| 19 to 25 Years | 218 (50.5%) | 153 (35.4%) |
| 25 to 34 Years | 356 (34.5%) | 554 (53.6%) |
| 35 to 44 Years | 176 (27.7%) | 476 (75.0%) |
| 45 to 54 Years | 258 (35.9%) | 295 (41.1%) |
| 55 to 64 Years | 254 (27.8%) | 576 (62.9%) |
| 65 to 74 Years | 779 (96.1%) | 567 (69.9%) |
| 75 Years and over | 663 (100.0%) | 360 (54.3%) |
| Total | 3,769 (54.7%) | 3,573 (51.9%) |
Disability Status by Sex by Age in Dade City
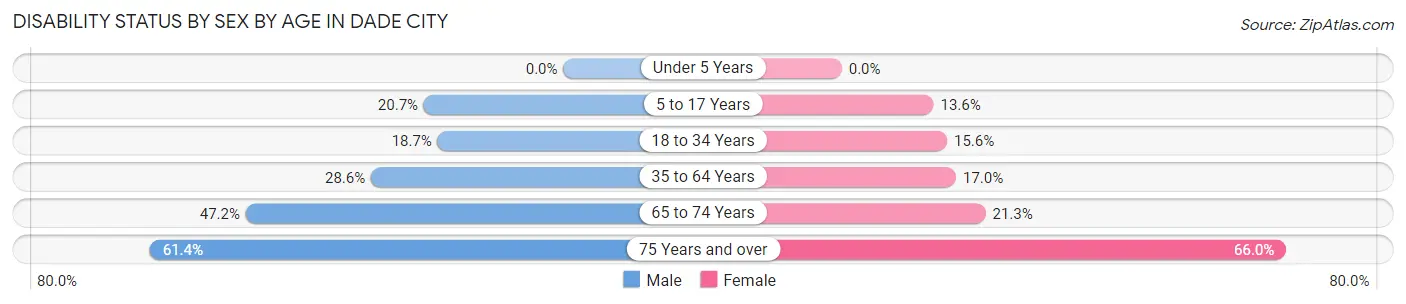
| Age Bracket | Male | Female |
| Under 5 Years | 0 (0.0%) | 0 (0.0%) |
| 5 to 17 Years | 134 (20.7%) | 87 (13.6%) |
| 18 to 34 Years | 131 (18.7%) | 143 (15.6%) |
| 35 to 64 Years | 259 (28.6%) | 231 (17.0%) |
| 65 to 74 Years | 199 (47.2%) | 83 (21.3%) |
| 75 Years and over | 167 (61.4%) | 258 (66.0%) |
Disability Class by Sex by Age in Dade City
Disability Class: Hearing Difficulty
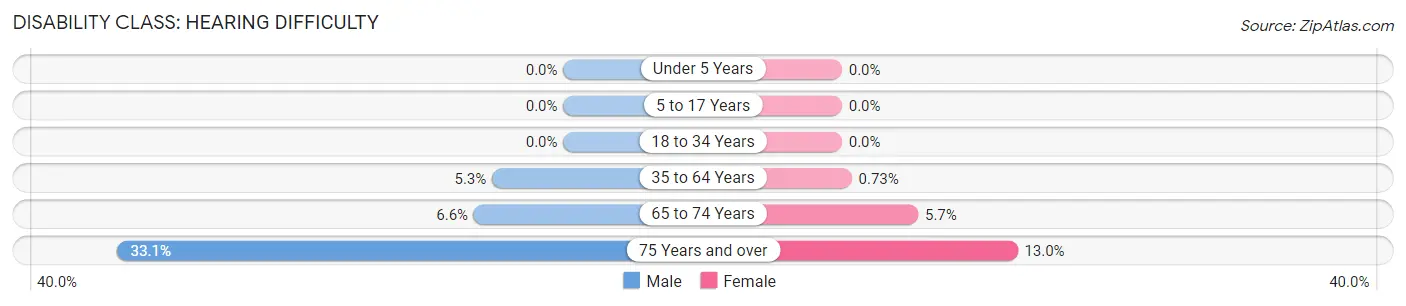
| Age Bracket | Male | Female |
| Under 5 Years | 0 (0.0%) | 0 (0.0%) |
| 5 to 17 Years | 0 (0.0%) | 0 (0.0%) |
| 18 to 34 Years | 0 (0.0%) | 0 (0.0%) |
| 35 to 64 Years | 48 (5.3%) | 10 (0.7%) |
| 65 to 74 Years | 28 (6.6%) | 22 (5.7%) |
| 75 Years and over | 90 (33.1%) | 51 (13.0%) |
Disability Class: Vision Difficulty
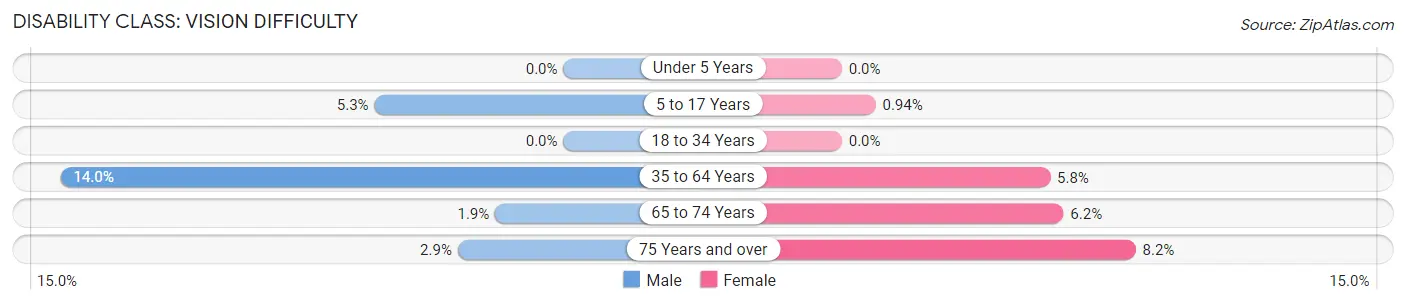
| Age Bracket | Male | Female |
| Under 5 Years | 0 (0.0%) | 0 (0.0%) |
| 5 to 17 Years | 34 (5.3%) | 6 (0.9%) |
| 18 to 34 Years | 0 (0.0%) | 0 (0.0%) |
| 35 to 64 Years | 127 (14.0%) | 79 (5.8%) |
| 65 to 74 Years | 8 (1.9%) | 24 (6.2%) |
| 75 Years and over | 8 (2.9%) | 32 (8.2%) |
Disability Class: Cognitive Difficulty
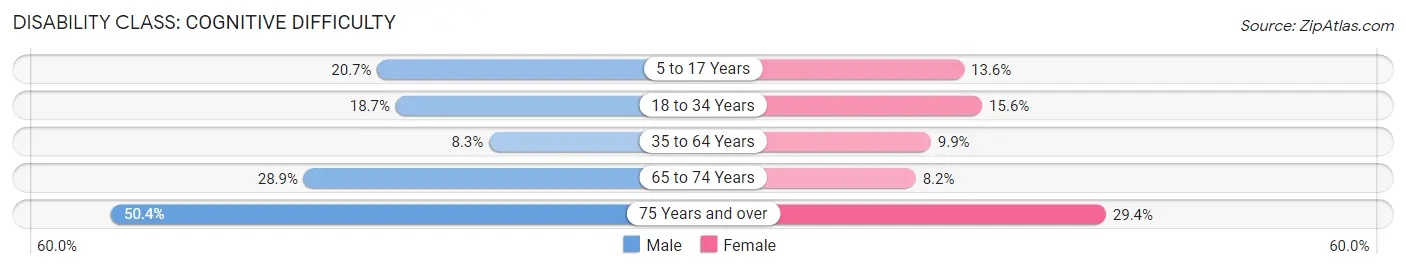
| Age Bracket | Male | Female |
| 5 to 17 Years | 134 (20.7%) | 87 (13.6%) |
| 18 to 34 Years | 131 (18.7%) | 143 (15.6%) |
| 35 to 64 Years | 75 (8.3%) | 135 (9.9%) |
| 65 to 74 Years | 122 (28.9%) | 32 (8.2%) |
| 75 Years and over | 137 (50.4%) | 115 (29.4%) |
Disability Class: Ambulatory Difficulty
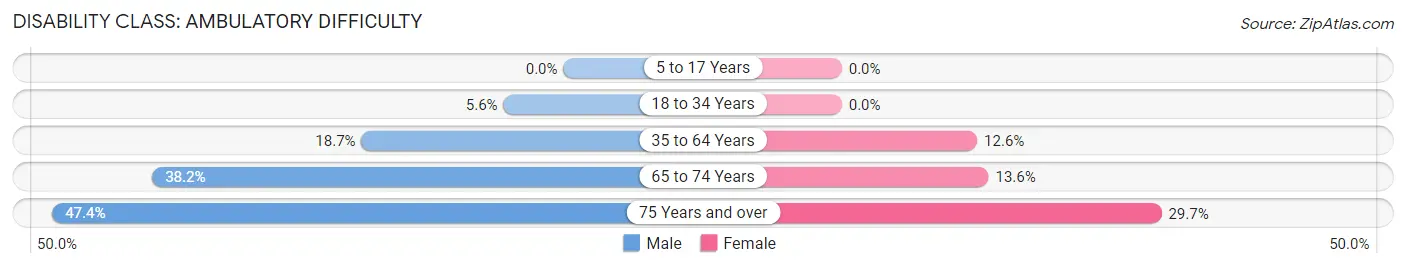
| Age Bracket | Male | Female |
| 5 to 17 Years | 0 (0.0%) | 0 (0.0%) |
| 18 to 34 Years | 39 (5.6%) | 0 (0.0%) |
| 35 to 64 Years | 170 (18.7%) | 171 (12.6%) |
| 65 to 74 Years | 161 (38.2%) | 53 (13.6%) |
| 75 Years and over | 129 (47.4%) | 116 (29.7%) |
Disability Class: Self-Care Difficulty
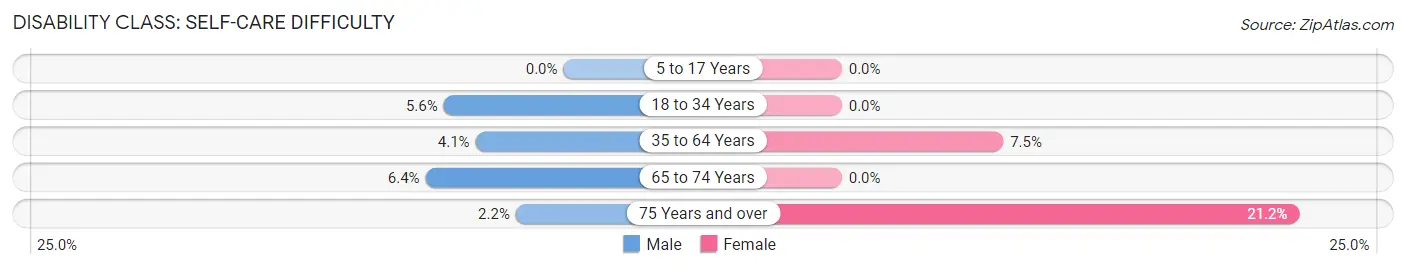
| Age Bracket | Male | Female |
| 5 to 17 Years | 0 (0.0%) | 0 (0.0%) |
| 18 to 34 Years | 39 (5.6%) | 0 (0.0%) |
| 35 to 64 Years | 37 (4.1%) | 102 (7.5%) |
| 65 to 74 Years | 27 (6.4%) | 0 (0.0%) |
| 75 Years and over | 6 (2.2%) | 83 (21.2%) |
Technology Access in Dade City
Computing Device Access in Dade City
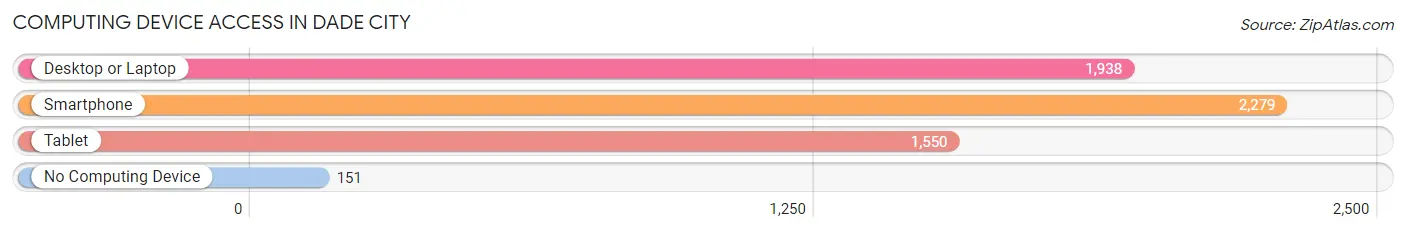
| Device Type | # Households | % Households |
| Desktop or Laptop | 1,938 | 77.4% |
| Smartphone | 2,279 | 91.0% |
| Tablet | 1,550 | 61.9% |
| No Computing Device | 151 | 6.0% |
| Total | 2,505 | 100.0% |
Internet Access in Dade City
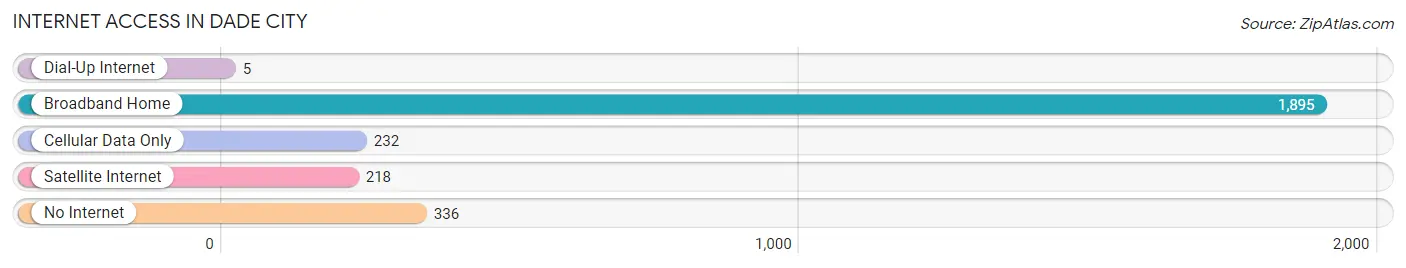
| Internet Type | # Households | % Households |
| Dial-Up Internet | 5 | 0.2% |
| Broadband Home | 1,895 | 75.6% |
| Cellular Data Only | 232 | 9.3% |
| Satellite Internet | 218 | 8.7% |
| No Internet | 336 | 13.4% |
| Total | 2,505 | 100.0% |
Dade City Summary
Dade City is a city located in Pasco County, Florida, United States. It is the county seat of Pasco County and is located approximately 35 miles northeast of Tampa. The population was 6,188 at the 2010 census. Dade City is known for its antique stores, historic buildings, and its annual Kumquat Festival.
History
Dade City was founded in 1885 by Captain Blanton Webster Dade, a Confederate veteran of the Civil War. He purchased 80 acres of land and named the area after himself. The area was originally known as Fort Dade, but the name was changed to Dade City in 1887.
The first post office was established in 1887 and the first school was built in 1888. The railroad arrived in 1891, connecting Dade City to Tampa and other cities in the region.
In 1895, Dade City was incorporated as a city. The city was a popular tourist destination in the early 1900s, with many visitors coming to enjoy the mild climate and natural beauty of the area.
Geography
Dade City is located at 28°30'N 82°10'W (28.50, -82.17). According to the United States Census Bureau, the city has a total area of 4.2 square miles (10.8 km2), all land.
Economy
The economy of Dade City is largely based on agriculture and tourism. The city is home to several large farms, including the Dade City Packing Company, which is one of the largest citrus packing houses in the state.
The city is also home to several tourist attractions, including the Pioneer Florida Museum and Village, which is a living history museum that features a variety of historic buildings and artifacts. The city also hosts the annual Kumquat Festival, which celebrates the local citrus industry.
Demographics
As of the census of 2010, there were 6,188 people, 2,541 households, and 1,619 families residing in the city. The population density was 1,467.2 people per square mile (567.2/km2). There were 2,845 housing units at an average density of 677.2 per square mile (262.2/km2). The racial makeup of the city was 79.2% White, 15.2% African American, 0.4% Native American, 0.7% Asian, 0.1% Pacific Islander, 2.7% from other races, and 1.7% from two or more races. Hispanic or Latino of any race were 8.2% of the population.
There were 2,541 households, out of which 24.2% had children under the age of 18 living with them, 44.2% were married couples living together, 14.7% had a female householder with no husband present, and 35.7% were non-families. 29.7% of all households were made up of individuals, and 14.2% had someone living alone who was 65 years of age or older. The average household size was 2.41 and the average family size was 2.97.
In the city, the population was spread out, with 22.2% under the age of 18, 8.2% from 18 to 24, 24.2% from 25 to 44, 25.2% from 45 to 64, and 20.2% who were 65 years of age or older. The median age was 41 years. For every 100 females, there were 91.2 males. For every 100 females age 18 and over, there were 87.7 males.
The median income for a household in the city was $31,944, and the median income for a family was $38,929. Males had a median income of $30,917 versus $22,917 for females. The per capita income for the city was $17,845. About 11.2% of families and 14.2% of the population were below the poverty line, including 19.2% of those under age 18 and 10.2% of those age 65 or over.
Common Questions
What is the Total Population of Dade City?
Total Population of Dade City is 7,221.
What is the Total Male Population of Dade City?
Total Male Population of Dade City is 3,318.
What is the Total Female Population of Dade City?
Total Female Population of Dade City is 3,903.
What is the Ratio of Males per 100 Females in Dade City?
There are 85.01 Males per 100 Females in Dade City.
What is the Ratio of Females per 100 Males in Dade City?
There are 117.63 Females per 100 Males in Dade City.
What is the Median Population Age in Dade City?
Median Population Age in Dade City is 40.4 Years.
What is the Average Family Size in Dade City
Average Family Size in Dade City is 3.1 People.
What is the Average Household Size in Dade City
Average Household Size in Dade City is 2.7 People.
What is Per Capita Income in Dade City?
Per Capita income in Dade City is $29,877.
What is the Median Family Income in Dade City?
Median Family Income in Dade City is $64,966.
What is the Median Household income in Dade City?
Median Household Income in Dade City is $63,493.
What is Income or Wage Gap in Dade City?
Income or Wage Gap in Dade City is 23.5%.
Women in Dade City earn 76.5 cents for every dollar earned by a man.
What is Family Income Deficit in Dade City?
Family Income Deficit in Dade City is $8,635.
Families that are below poverty line in Dade City earn $8,635 less on average than the poverty threshold level.
What is Inequality or Gini Index in Dade City?
Inequality or Gini Index in Dade City is 0.44.
How Large is the Labor Force in Dade City?
There are 2,724 People in the Labor Forcein in Dade City.
What is the Percentage of People in the Labor Force in Dade City?
46.3% of People are in the Labor Force in Dade City.
What is the Unemployment Rate in Dade City?
Unemployment Rate in Dade City is 5.4%.