Crystal River, FL
Crystal River Map

Crystal River Overview
3,398
TOTAL POPULATION
1,698
MALE POPULATION
1,700
FEMALE POPULATION
99.88
MALES / 100 FEMALES
100.12
FEMALES / 100 MALES
64.1
MEDIAN AGE
2.6
AVG FAMILY SIZE
1.9
AVG HOUSEHOLD SIZE
$32,842
PER CAPITA INCOME
$52,408
AVG FAMILY INCOME
$46,795
AVG HOUSEHOLD INCOME
24.6%
WAGE / INCOME GAP [ % ]
75.4¢/ $1
WAGE / INCOME GAP [ $ ]
$7,078
FAMILY INCOME DEFICIT
0.49
INEQUALITY / GINI INDEX
991
LABOR FORCE [ PEOPLE ]
32.8%
PERCENT IN LABOR FORCE
11.0%
UNEMPLOYMENT RATE
Crystal River Area Codes
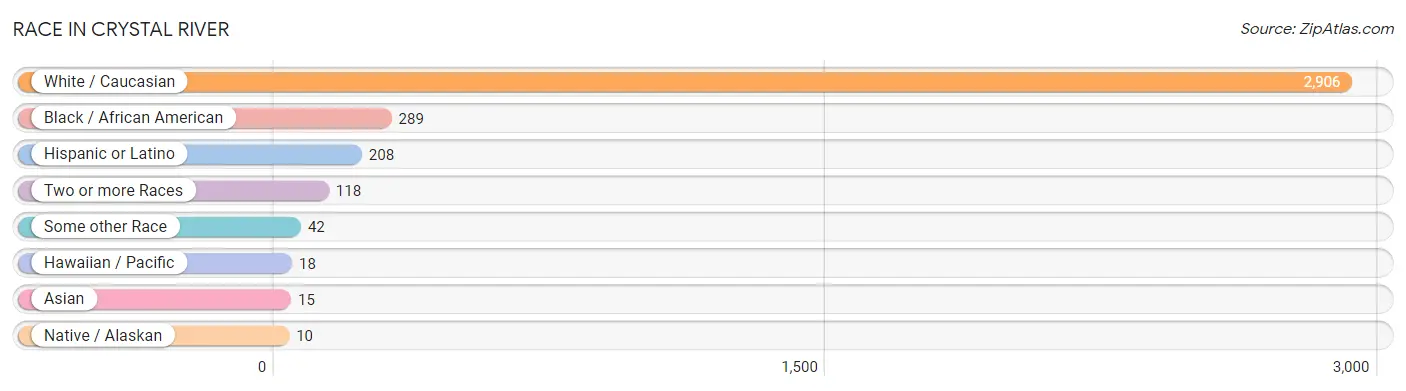
Race in Crystal River
The most populous races in Crystal River are White / Caucasian (2,906 | 85.5%), Black / African American (289 | 8.5%), and Hispanic or Latino (208 | 6.1%).
| Race | # Population | % Population |
| Asian | 15 | 0.4% |
| Black / African American | 289 | 8.5% |
| Hawaiian / Pacific | 18 | 0.5% |
| Hispanic or Latino | 208 | 6.1% |
| Native / Alaskan | 10 | 0.3% |
| White / Caucasian | 2,906 | 85.5% |
| Two or more Races | 118 | 3.5% |
| Some other Race | 42 | 1.2% |
| Total | 3,398 | 100.0% |
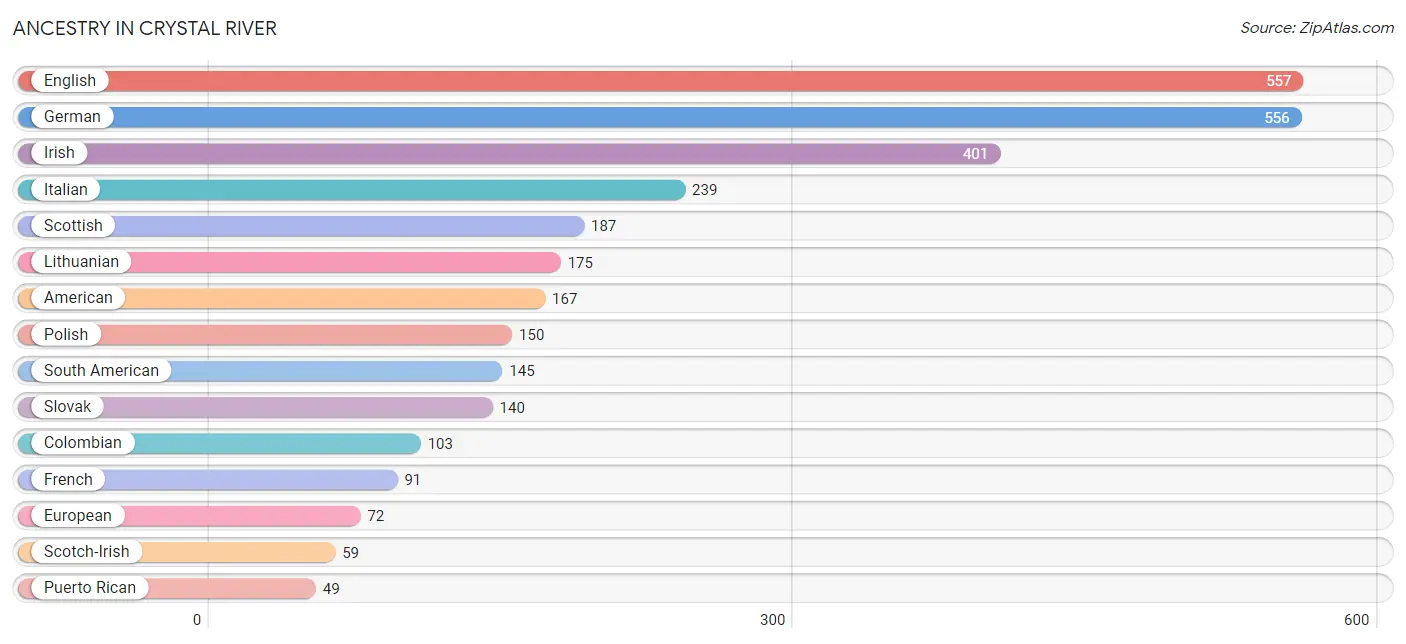
Ancestry in Crystal River
The most populous ancestries reported in Crystal River are English (557 | 16.4%), German (556 | 16.4%), Irish (401 | 11.8%), Italian (239 | 7.0%), and Scottish (187 | 5.5%), together accounting for 57.1% of all Crystal River residents.
| Ancestry | # Population | % Population |
| American | 167 | 4.9% |
| British | 40 | 1.2% |
| Canadian | 5 | 0.2% |
| Cherokee | 19 | 0.6% |
| Colombian | 103 | 3.0% |
| Cuban | 4 | 0.1% |
| Czech | 23 | 0.7% |
| Dominican | 10 | 0.3% |
| Dutch | 3 | 0.1% |
| English | 557 | 16.4% |
| Ethiopian | 19 | 0.6% |
| European | 72 | 2.1% |
| Finnish | 21 | 0.6% |
| French | 91 | 2.7% |
| German | 556 | 16.4% |
| Greek | 24 | 0.7% |
| Iranian | 32 | 0.9% |
| Irish | 401 | 11.8% |
| Italian | 239 | 7.0% |
| Korean | 15 | 0.4% |
| Lithuanian | 175 | 5.1% |
| Native Hawaiian | 18 | 0.5% |
| Norwegian | 14 | 0.4% |
| Polish | 150 | 4.4% |
| Portuguese | 19 | 0.6% |
| Puerto Rican | 49 | 1.4% |
| Scotch-Irish | 59 | 1.7% |
| Scottish | 187 | 5.5% |
| Slovak | 140 | 4.1% |
| South American | 145 | 4.3% |
| Subsaharan African | 19 | 0.6% |
| Swedish | 29 | 0.9% |
| Venezuelan | 42 | 1.2% | View All 33 Rows |
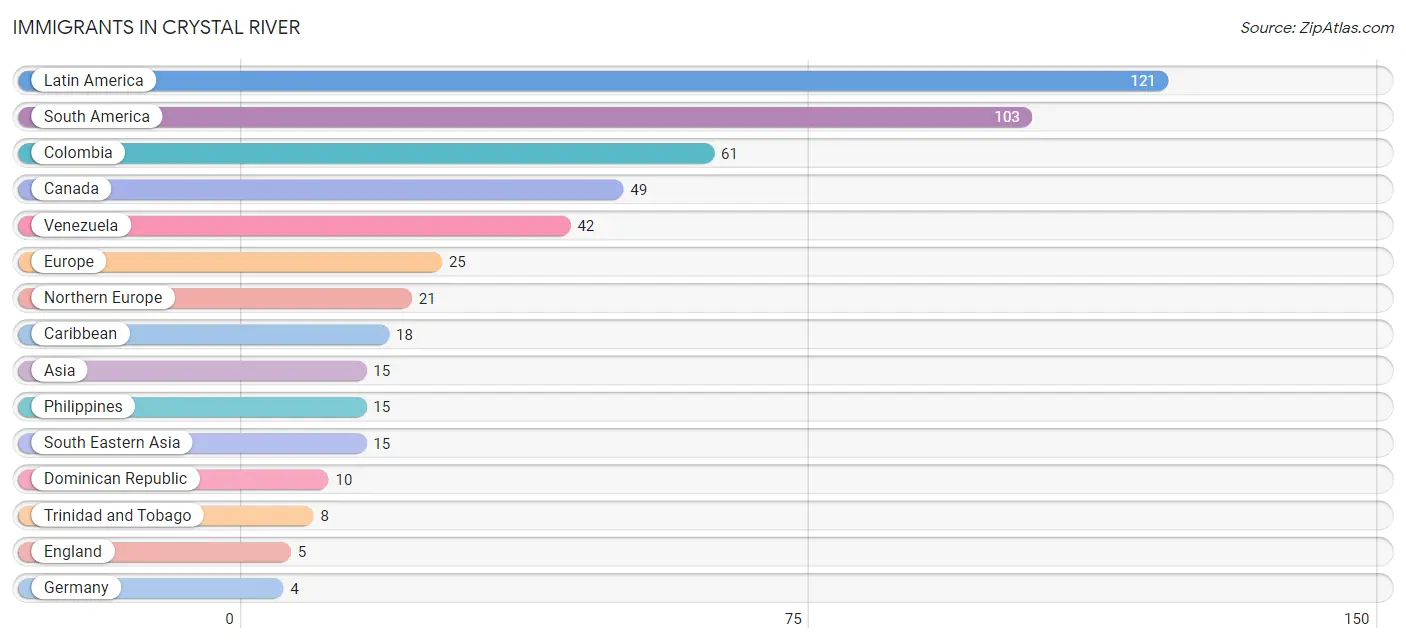
Immigrants in Crystal River
The most numerous immigrant groups reported in Crystal River came from Latin America (121 | 3.6%), South America (103 | 3.0%), Colombia (61 | 1.8%), Canada (49 | 1.4%), and Venezuela (42 | 1.2%), together accounting for 11.1% of all Crystal River residents.
| Immigration Origin | # Population | % Population |
| Asia | 15 | 0.4% |
| Canada | 49 | 1.4% |
| Caribbean | 18 | 0.5% |
| Colombia | 61 | 1.8% |
| Dominican Republic | 10 | 0.3% |
| England | 5 | 0.2% |
| Europe | 25 | 0.7% |
| Germany | 4 | 0.1% |
| Latin America | 121 | 3.6% |
| Northern Europe | 21 | 0.6% |
| Philippines | 15 | 0.4% |
| South America | 103 | 3.0% |
| South Eastern Asia | 15 | 0.4% |
| Trinidad and Tobago | 8 | 0.2% |
| Venezuela | 42 | 1.2% |
| Western Europe | 4 | 0.1% | View All 16 Rows |
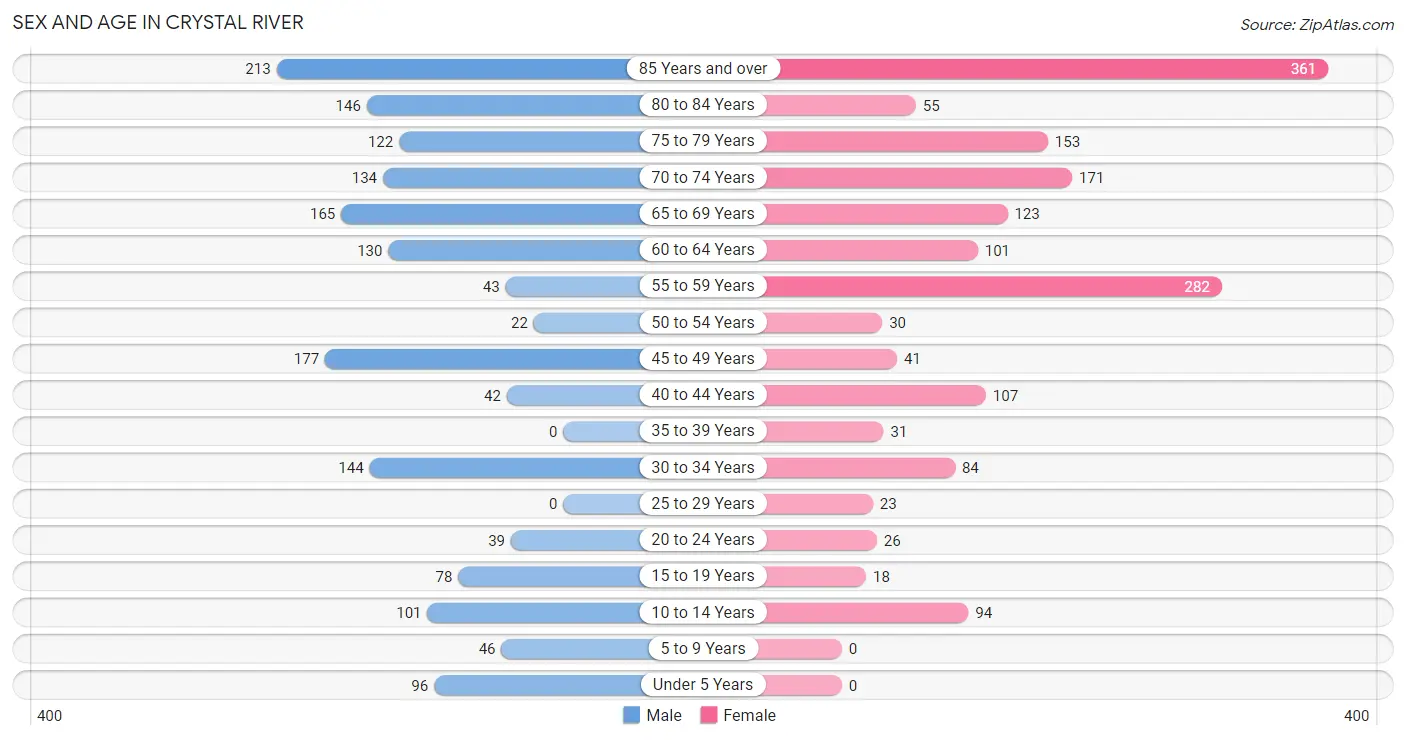
Sex and Age in Crystal River
Sex and Age in Crystal River
The most populous age groups in Crystal River are 85 Years and over (213 | 12.5%) for men and 85 Years and over (361 | 21.2%) for women.
| Age Bracket | Male | Female |
| Under 5 Years | 96 (5.7%) | 0 (0.0%) |
| 5 to 9 Years | 46 (2.7%) | 0 (0.0%) |
| 10 to 14 Years | 101 (5.9%) | 94 (5.5%) |
| 15 to 19 Years | 78 (4.6%) | 18 (1.1%) |
| 20 to 24 Years | 39 (2.3%) | 26 (1.5%) |
| 25 to 29 Years | 0 (0.0%) | 23 (1.3%) |
| 30 to 34 Years | 144 (8.5%) | 84 (4.9%) |
| 35 to 39 Years | 0 (0.0%) | 31 (1.8%) |
| 40 to 44 Years | 42 (2.5%) | 107 (6.3%) |
| 45 to 49 Years | 177 (10.4%) | 41 (2.4%) |
| 50 to 54 Years | 22 (1.3%) | 30 (1.8%) |
| 55 to 59 Years | 43 (2.5%) | 282 (16.6%) |
| 60 to 64 Years | 130 (7.7%) | 101 (5.9%) |
| 65 to 69 Years | 165 (9.7%) | 123 (7.2%) |
| 70 to 74 Years | 134 (7.9%) | 171 (10.1%) |
| 75 to 79 Years | 122 (7.2%) | 153 (9.0%) |
| 80 to 84 Years | 146 (8.6%) | 55 (3.2%) |
| 85 Years and over | 213 (12.5%) | 361 (21.2%) |
| Total | 1,698 (100.0%) | 1,700 (100.0%) |
Families and Households in Crystal River
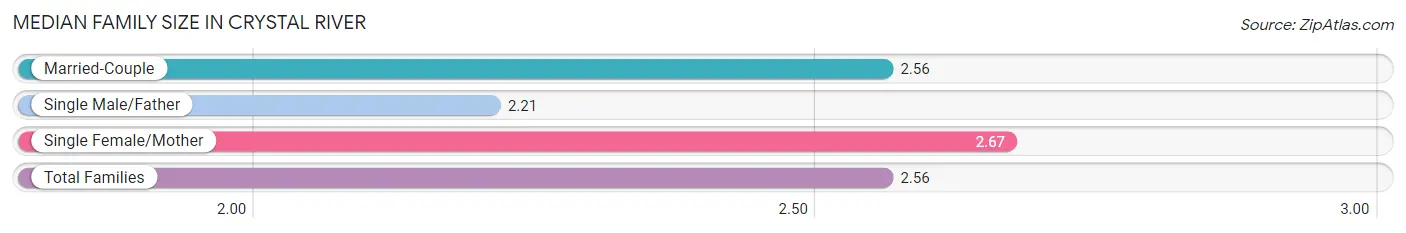
Median Family Size in Crystal River
The median family size in Crystal River is 2.56 persons per family, with single female/mother families (75 | 8.9%) accounting for the largest median family size of 2.67 persons per family. On the other hand, single male/father families (28 | 3.3%) represent the smallest median family size with 2.21 persons per family.
| Family Type | # Families | Family Size |
| Married-Couple | 742 (87.8%) | 2.56 |
| Single Male/Father | 28 (3.3%) | 2.21 |
| Single Female/Mother | 75 (8.9%) | 2.67 |
| Total Families | 845 (100.0%) | 2.56 |
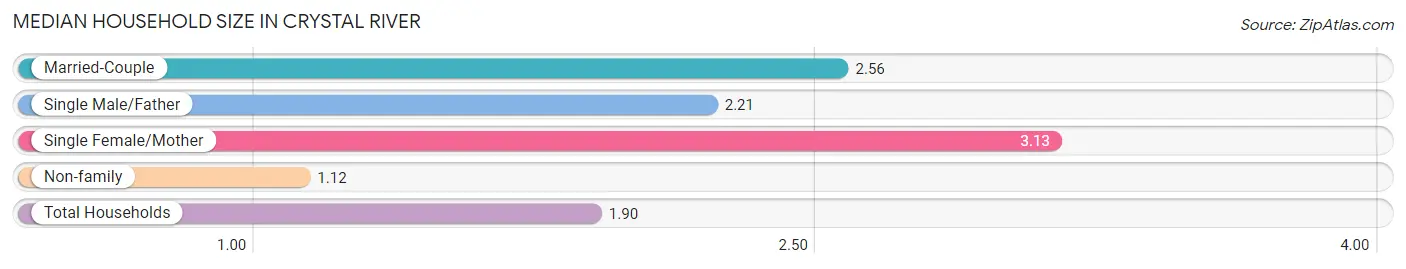
Median Household Size in Crystal River
The median household size in Crystal River is 1.90 persons per household, with single female/mother households (75 | 4.7%) accounting for the largest median household size of 3.13 persons per household. non-family households (758 | 47.3%) represent the smallest median household size with 1.12 persons per household.
| Household Type | # Households | Household Size |
| Married-Couple | 742 (46.3%) | 2.56 |
| Single Male/Father | 28 (1.8%) | 2.21 |
| Single Female/Mother | 75 (4.7%) | 3.13 |
| Non-family | 758 (47.3%) | 1.12 |
| Total Households | 1,603 (100.0%) | 1.90 |
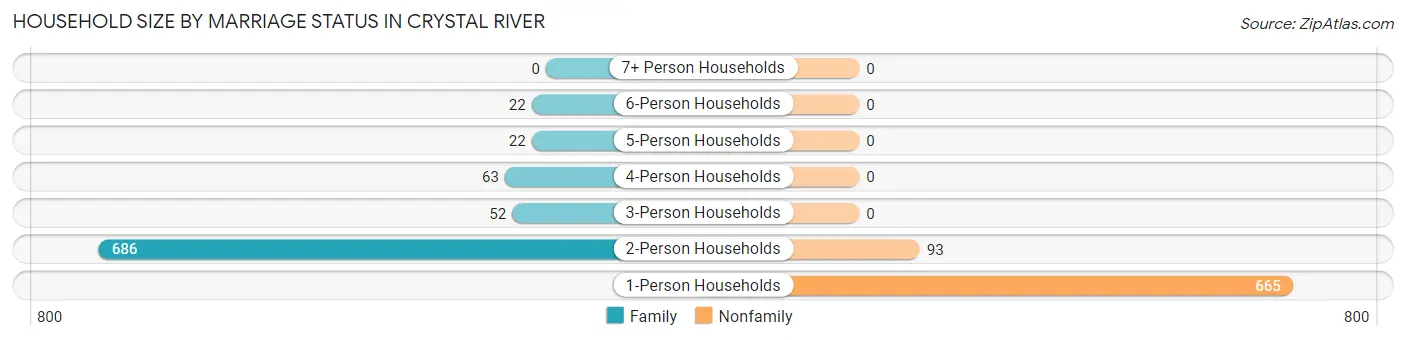
Household Size by Marriage Status in Crystal River
Out of a total of 1,603 households in Crystal River, 845 (52.7%) are family households, while 758 (47.3%) are nonfamily households. The most numerous type of family households are 2-person households, comprising 686, and the most common type of nonfamily households are 1-person households, comprising 665.
| Household Size | Family Households | Nonfamily Households |
| 1-Person Households | - | 665 (41.5%) |
| 2-Person Households | 686 (42.8%) | 93 (5.8%) |
| 3-Person Households | 52 (3.2%) | 0 (0.0%) |
| 4-Person Households | 63 (3.9%) | 0 (0.0%) |
| 5-Person Households | 22 (1.4%) | 0 (0.0%) |
| 6-Person Households | 22 (1.4%) | 0 (0.0%) |
| 7+ Person Households | 0 (0.0%) | 0 (0.0%) |
| Total | 845 (52.7%) | 758 (47.3%) |
Female Fertility in Crystal River
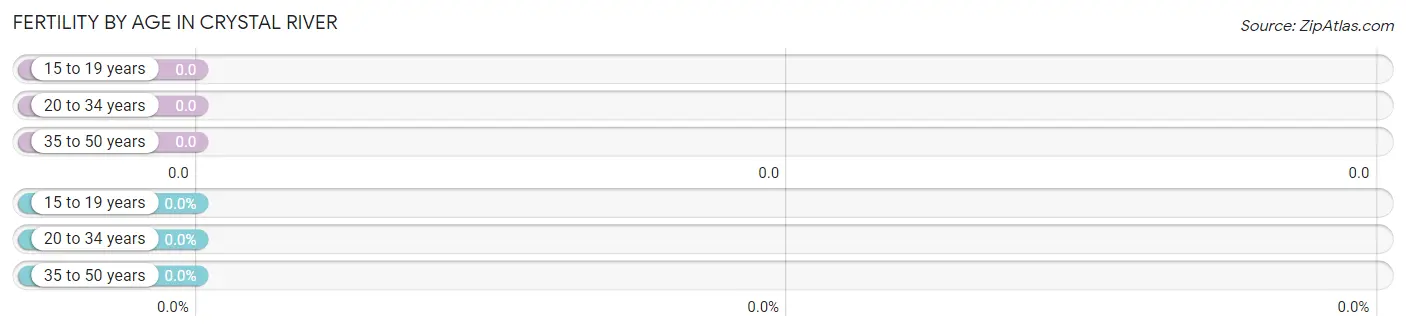
Fertility by Age in Crystal River
| Age Bracket | Women with Births | Births / 1,000 Women |
| 15 to 19 years | 0 (0.0%) | 0.0 |
| 20 to 34 years | 0 (0.0%) | 0.0 |
| 35 to 50 years | 0 (0.0%) | 0.0 |
| Total | 0 (0.0%) | 0.0 |
Fertility by Age by Marriage Status in Crystal River
| Age Bracket | Married | Unmarried |
| 15 to 19 years | 0 (0.0%) | 0 (0.0%) |
| 20 to 34 years | 0 (0.0%) | 0 (0.0%) |
| 35 to 50 years | 0 (0.0%) | 0 (0.0%) |
| Total | 0 (0.0%) | 0 (0.0%) |
Fertility by Education in Crystal River
| Educational Attainment | Women with Births | Births / 1,000 Women |
| Less than High School | 0 (0.0%) | 0.0 |
| High School Diploma | 0 (0.0%) | 0.0 |
| College or Associate's Degree | 0 (0.0%) | 0.0 |
| Bachelor's Degree | 0 (0.0%) | 0.0 |
| Graduate Degree | 0 (0.0%) | 0.0 |
| Total | 0 (0.0%) | 0.0 |
Fertility by Education by Marriage Status in Crystal River
| Educational Attainment | Married | Unmarried |
| Less than High School | 0 (0.0%) | 0 (0.0%) |
| High School Diploma | 0 (0.0%) | 0 (0.0%) |
| College or Associate's Degree | 0 (0.0%) | 0 (0.0%) |
| Bachelor's Degree | 0 (0.0%) | 0 (0.0%) |
| Graduate Degree | 0 (0.0%) | 0 (0.0%) |
| Total | 0 (0.0%) | 0 (0.0%) |
Income in Crystal River
Income Overview in Crystal River
Per Capita Income in Crystal River is $32,842, while median incomes of families and households are $52,408 and $46,795 respectively.
| Characteristic | Number | Measure |
| Per Capita Income | 3,398 | $32,842 |
| Median Family Income | 845 | $52,408 |
| Mean Family Income | 845 | $78,435 |
| Median Household Income | 1,603 | $46,795 |
| Mean Household Income | 1,603 | $66,688 |
| Income Deficit | 845 | $7,078 |
| Wage / Income Gap (%) | 3,398 | 24.57% |
| Wage / Income Gap ($) | 3,398 | 75.43¢ per $1 |
| Gini / Inequality Index | 3,398 | 0.49 |
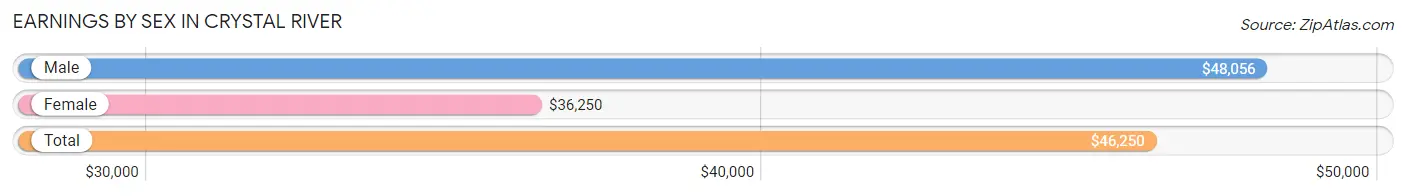
Earnings by Sex in Crystal River
Average Earnings in Crystal River are $46,250, $48,056 for men and $36,250 for women, a difference of 24.6%.
| Sex | Number | Average Earnings |
| Male | 522 (53.2%) | $48,056 |
| Female | 459 (46.8%) | $36,250 |
| Total | 981 (100.0%) | $46,250 |
Earnings by Sex by Income Bracket in Crystal River
The most common earnings brackets in Crystal River are $75,000 to $99,999 for men (187 | 35.8%) and $55,000 to $64,999 for women (148 | 32.2%).
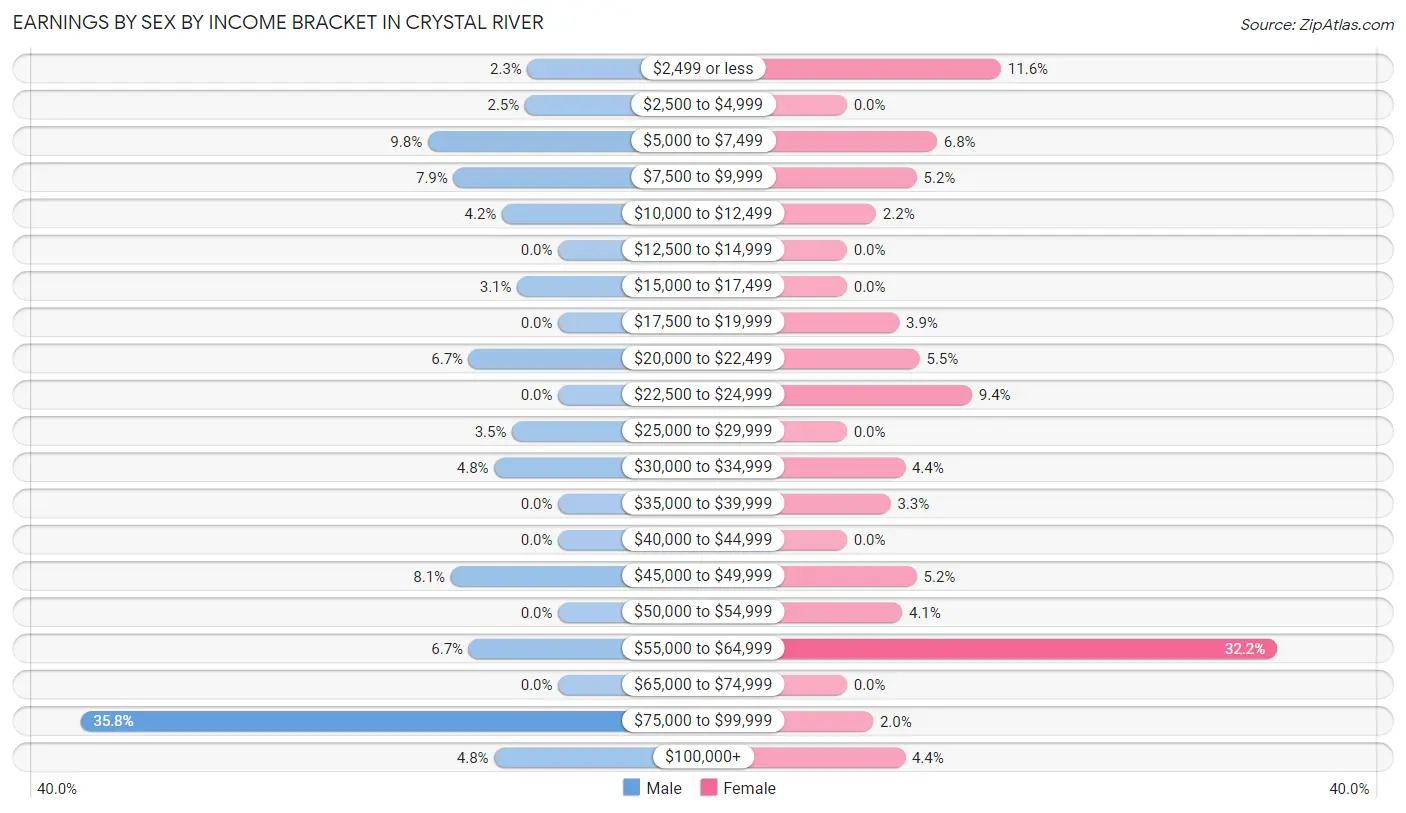
| Income | Male | Female |
| $2,499 or less | 12 (2.3%) | 53 (11.6%) |
| $2,500 to $4,999 | 13 (2.5%) | 0 (0.0%) |
| $5,000 to $7,499 | 51 (9.8%) | 31 (6.8%) |
| $7,500 to $9,999 | 41 (7.9%) | 24 (5.2%) |
| $10,000 to $12,499 | 22 (4.2%) | 10 (2.2%) |
| $12,500 to $14,999 | 0 (0.0%) | 0 (0.0%) |
| $15,000 to $17,499 | 16 (3.1%) | 0 (0.0%) |
| $17,500 to $19,999 | 0 (0.0%) | 18 (3.9%) |
| $20,000 to $22,499 | 35 (6.7%) | 25 (5.4%) |
| $22,500 to $24,999 | 0 (0.0%) | 43 (9.4%) |
| $25,000 to $29,999 | 18 (3.5%) | 0 (0.0%) |
| $30,000 to $34,999 | 25 (4.8%) | 20 (4.4%) |
| $35,000 to $39,999 | 0 (0.0%) | 15 (3.3%) |
| $40,000 to $44,999 | 0 (0.0%) | 0 (0.0%) |
| $45,000 to $49,999 | 42 (8.1%) | 24 (5.2%) |
| $50,000 to $54,999 | 0 (0.0%) | 19 (4.1%) |
| $55,000 to $64,999 | 35 (6.7%) | 148 (32.2%) |
| $65,000 to $74,999 | 0 (0.0%) | 0 (0.0%) |
| $75,000 to $99,999 | 187 (35.8%) | 9 (2.0%) |
| $100,000+ | 25 (4.8%) | 20 (4.4%) |
| Total | 522 (100.0%) | 459 (100.0%) |
Earnings by Sex by Educational Attainment in Crystal River
Average earnings in Crystal River are $60,042 for men and $47,404 for women, a difference of 21.0%. Men with an educational attainment of bachelor's degree enjoy the highest average annual earnings of $89,703, while those with less than high school education earn the least with $11,477. Women with an educational attainment of bachelor's degree earn the most with the average annual earnings of $55,364, while those with high school diploma education have the smallest earnings of $36,705.
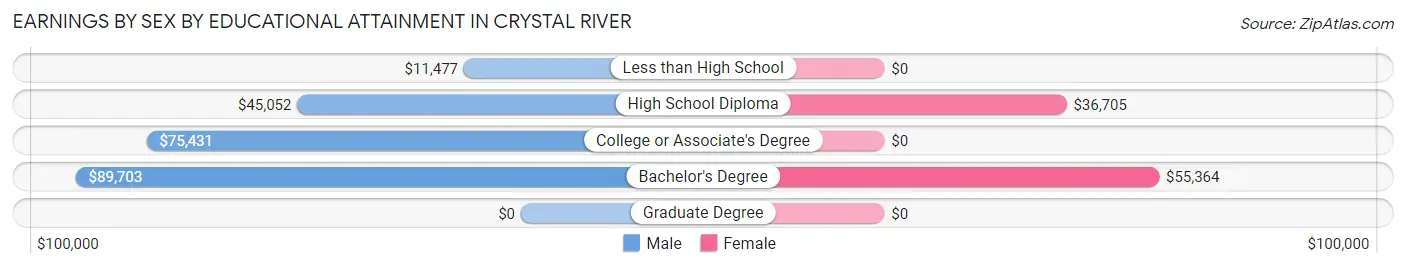
| Educational Attainment | Male Income | Female Income |
| Less than High School | $11,477 | $0 |
| High School Diploma | $45,052 | $36,705 |
| College or Associate's Degree | $75,431 | $0 |
| Bachelor's Degree | $89,703 | $55,364 |
| Graduate Degree | - | - |
| Total | $60,042 | $47,404 |
Family Income in Crystal River
Family Income Brackets in Crystal River
According to the Crystal River family income data, there are 220 families falling into the $50,000 to $74,999 income range, which is the most common income bracket and makes up 26.0% of all families.
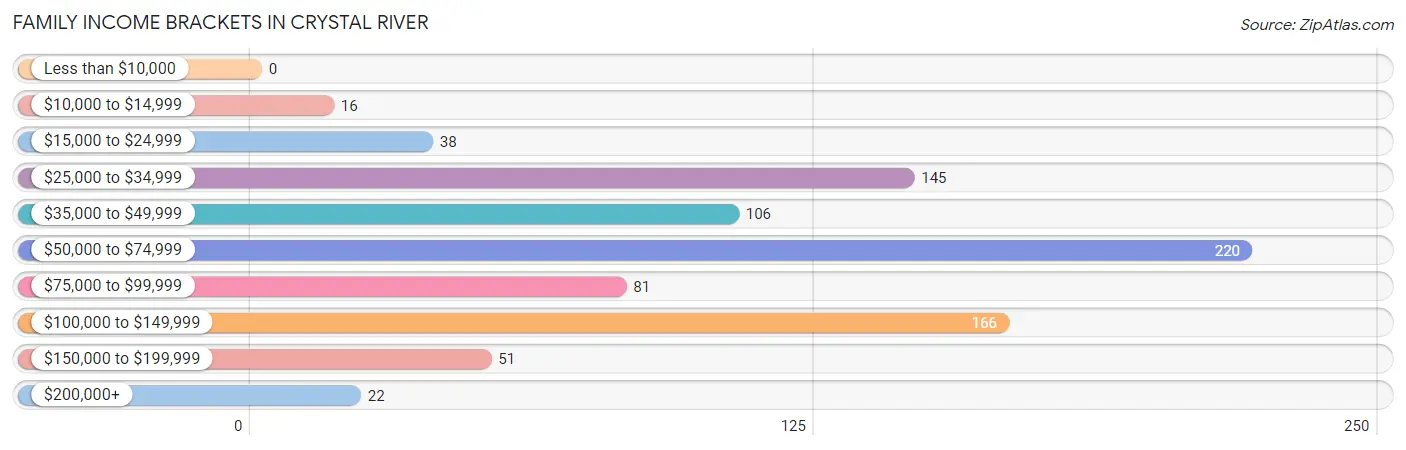
| Income Bracket | # Families | % Families |
| Less than $10,000 | 0 | 0.0% |
| $10,000 to $14,999 | 16 | 1.9% |
| $15,000 to $24,999 | 38 | 4.5% |
| $25,000 to $34,999 | 145 | 17.2% |
| $35,000 to $49,999 | 106 | 12.5% |
| $50,000 to $74,999 | 220 | 26.0% |
| $75,000 to $99,999 | 81 | 9.6% |
| $100,000 to $149,999 | 166 | 19.6% |
| $150,000 to $199,999 | 51 | 6.0% |
| $200,000+ | 22 | 2.6% |
Family Income by Famaliy Size in Crystal River
3-person families (91 | 10.8%) account for the highest median family income in Crystal River with $61,058 per family, while 2-person families (686 | 81.2%) have the highest median income of $26,138 per family member.
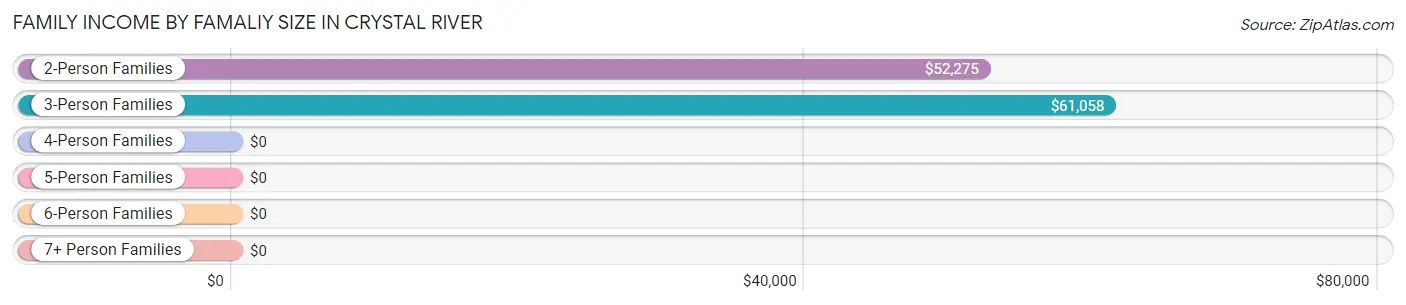
| Income Bracket | # Families | Median Income |
| 2-Person Families | 686 (81.2%) | $52,275 |
| 3-Person Families | 91 (10.8%) | $61,058 |
| 4-Person Families | 24 (2.8%) | $0 |
| 5-Person Families | 22 (2.6%) | $0 |
| 6-Person Families | 22 (2.6%) | $0 |
| 7+ Person Families | 0 (0.0%) | $0 |
| Total | 845 (100.0%) | $52,408 |
Family Income by Number of Earners in Crystal River
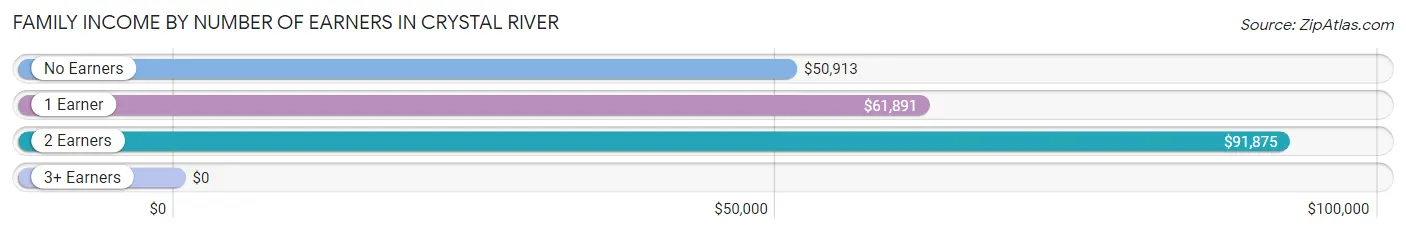
| Number of Earners | # Families | Median Income |
| No Earners | 444 (52.5%) | $50,913 |
| 1 Earner | 189 (22.4%) | $61,891 |
| 2 Earners | 194 (23.0%) | $91,875 |
| 3+ Earners | 18 (2.1%) | $0 |
| Total | 845 (100.0%) | $52,408 |
Household Income in Crystal River
Household Income Brackets in Crystal River
With 313 households falling in the category, the $50,000 to $74,999 income range is the most frequent in Crystal River, accounting for 19.5% of all households. In contrast, only 67 households (4.2%) fall into the $200,000+ income bracket, making it the least populous group.
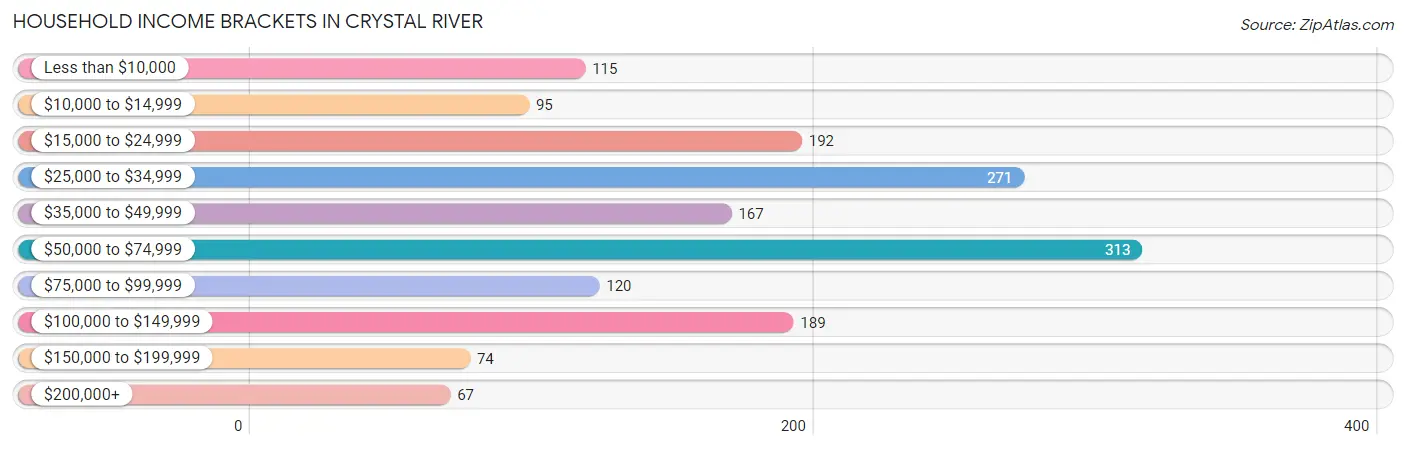
| Income Bracket | # Households | % Households |
| Less than $10,000 | 115 | 7.2% |
| $10,000 to $14,999 | 95 | 5.9% |
| $15,000 to $24,999 | 192 | 12.0% |
| $25,000 to $34,999 | 271 | 16.9% |
| $35,000 to $49,999 | 167 | 10.4% |
| $50,000 to $74,999 | 313 | 19.5% |
| $75,000 to $99,999 | 120 | 7.5% |
| $100,000 to $149,999 | 189 | 11.8% |
| $150,000 to $199,999 | 74 | 4.6% |
| $200,000+ | 67 | 4.2% |
Household Income by Householder Age in Crystal River
The median household income in Crystal River is $46,795, with the highest median household income of $91,094 found in the 25 to 44 years age bracket for the primary householder. A total of 215 households (13.4%) fall into this category. Meanwhile, the 15 to 24 years age bracket for the primary householder has the lowest median household income of $0, with 18 households (1.1%) in this group.
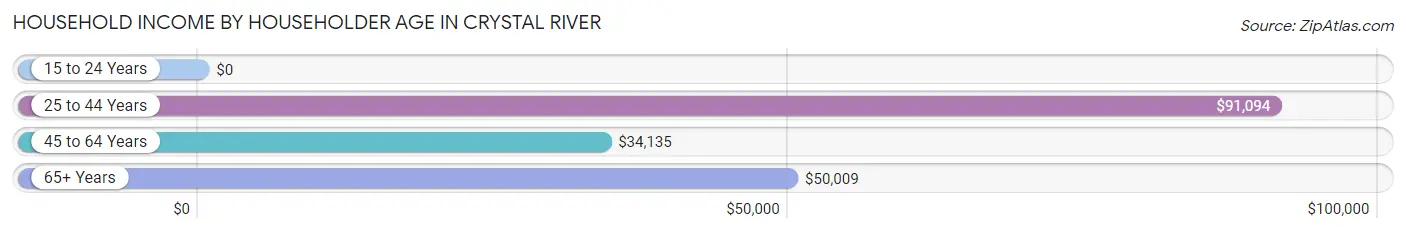
| Income Bracket | # Households | Median Income |
| 15 to 24 Years | 18 (1.1%) | $0 |
| 25 to 44 Years | 215 (13.4%) | $91,094 |
| 45 to 64 Years | 471 (29.4%) | $34,135 |
| 65+ Years | 899 (56.1%) | $50,009 |
| Total | 1,603 (100.0%) | $46,795 |
Poverty in Crystal River
Income Below Poverty by Sex and Age in Crystal River
With 23.4% poverty level for males and 17.0% for females among the residents of Crystal River, 15 year old males and 12 to 14 year old females are the most vulnerable to poverty, with 39 males (100.0%) and 36 females (48.0%) in their respective age groups living below the poverty level.
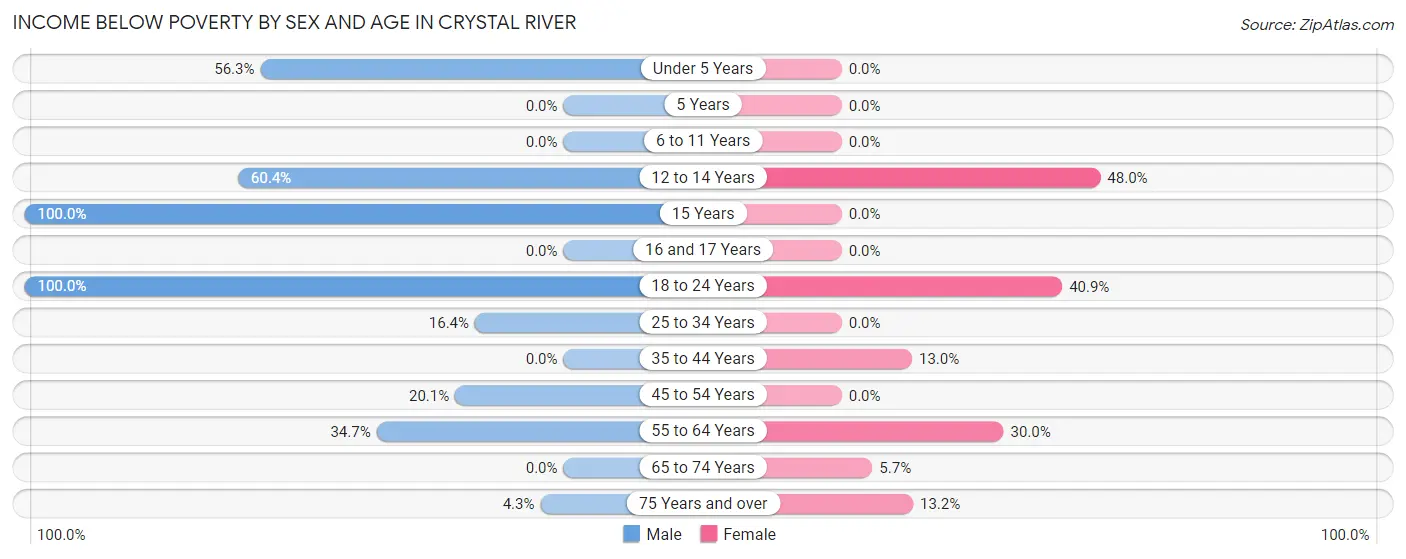
| Age Bracket | Male | Female |
| Under 5 Years | 54 (56.2%) | 0 (0.0%) |
| 5 Years | 0 (0.0%) | 0 (0.0%) |
| 6 to 11 Years | 0 (0.0%) | 0 (0.0%) |
| 12 to 14 Years | 61 (60.4%) | 36 (48.0%) |
| 15 Years | 39 (100.0%) | 0 (0.0%) |
| 16 and 17 Years | 0 (0.0%) | 0 (0.0%) |
| 18 to 24 Years | 78 (100.0%) | 18 (40.9%) |
| 25 to 34 Years | 22 (16.4%) | 0 (0.0%) |
| 35 to 44 Years | 0 (0.0%) | 18 (13.0%) |
| 45 to 54 Years | 39 (20.1%) | 0 (0.0%) |
| 55 to 64 Years | 60 (34.7%) | 112 (30.0%) |
| 65 to 74 Years | 0 (0.0%) | 15 (5.7%) |
| 75 Years and over | 16 (4.3%) | 52 (13.2%) |
| Total | 369 (23.4%) | 251 (17.0%) |
Income Above Poverty by Sex and Age in Crystal River
According to the poverty statistics in Crystal River, males aged 6 to 11 years and females aged 6 to 11 years are the age groups that are most secure financially, with 100.0% of males and 100.0% of females in these age groups living above the poverty line.
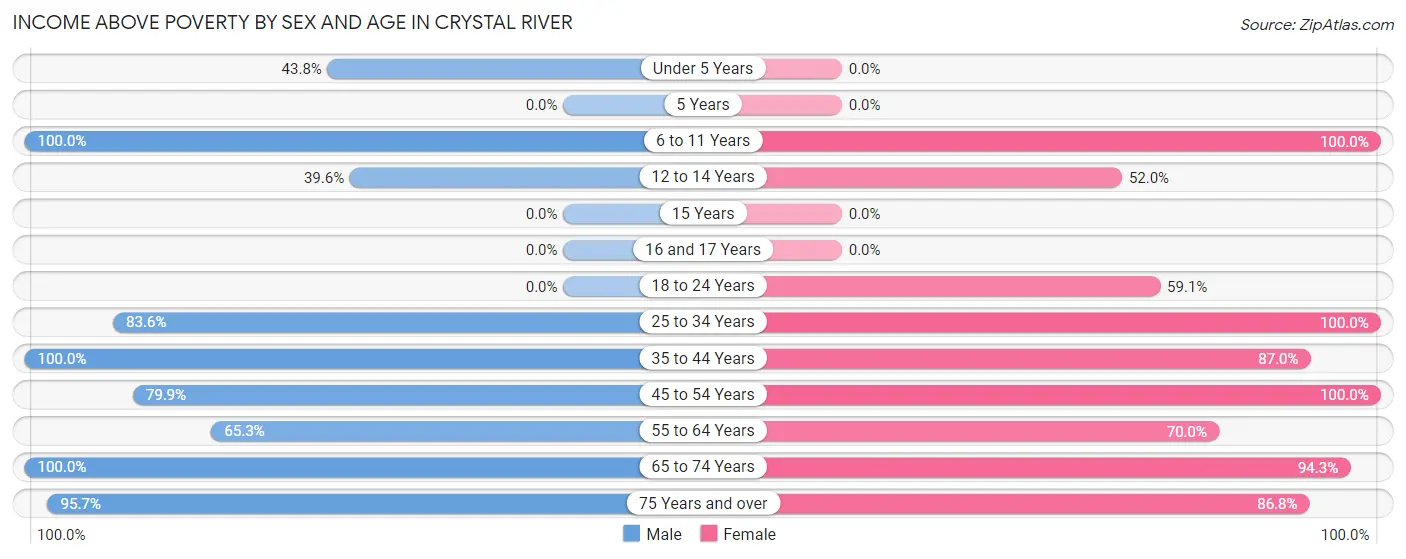
| Age Bracket | Male | Female |
| Under 5 Years | 42 (43.8%) | 0 (0.0%) |
| 5 Years | 0 (0.0%) | 0 (0.0%) |
| 6 to 11 Years | 46 (100.0%) | 19 (100.0%) |
| 12 to 14 Years | 40 (39.6%) | 39 (52.0%) |
| 15 Years | 0 (0.0%) | 0 (0.0%) |
| 16 and 17 Years | 0 (0.0%) | 0 (0.0%) |
| 18 to 24 Years | 0 (0.0%) | 26 (59.1%) |
| 25 to 34 Years | 112 (83.6%) | 107 (100.0%) |
| 35 to 44 Years | 42 (100.0%) | 120 (87.0%) |
| 45 to 54 Years | 155 (79.9%) | 65 (100.0%) |
| 55 to 64 Years | 113 (65.3%) | 261 (70.0%) |
| 65 to 74 Years | 299 (100.0%) | 249 (94.3%) |
| 75 Years and over | 358 (95.7%) | 341 (86.8%) |
| Total | 1,207 (76.6%) | 1,227 (83.0%) |
Income Below Poverty Among Married-Couple Families in Crystal River
The poverty statistics for married-couple families in Crystal River show that 8.1% or 60 of the total 742 families live below the poverty line. Families with 3 or 4 children have the highest poverty rate of 100.0%, comprising of 22 families. On the other hand, families with no children have the lowest poverty rate of 2.5%, which includes 16 families.
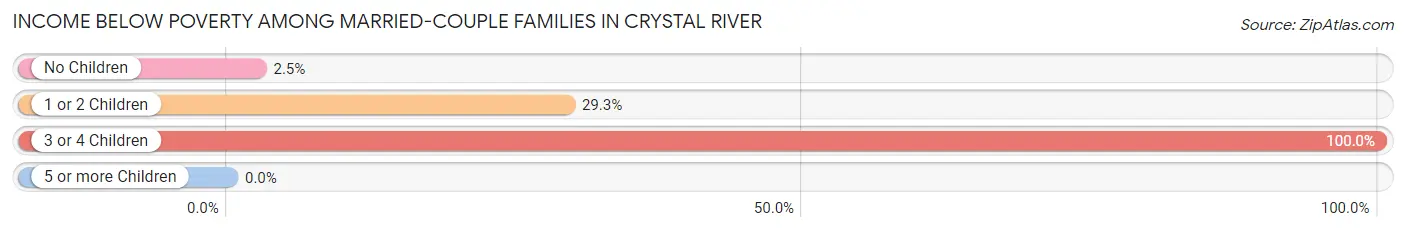
| Children | Above Poverty | Below Poverty |
| No Children | 629 (97.5%) | 16 (2.5%) |
| 1 or 2 Children | 53 (70.7%) | 22 (29.3%) |
| 3 or 4 Children | 0 (0.0%) | 22 (100.0%) |
| 5 or more Children | 0 (0.0%) | 0 (0.0%) |
| Total | 682 (91.9%) | 60 (8.1%) |
Income Below Poverty Among Single-Parent Households in Crystal River
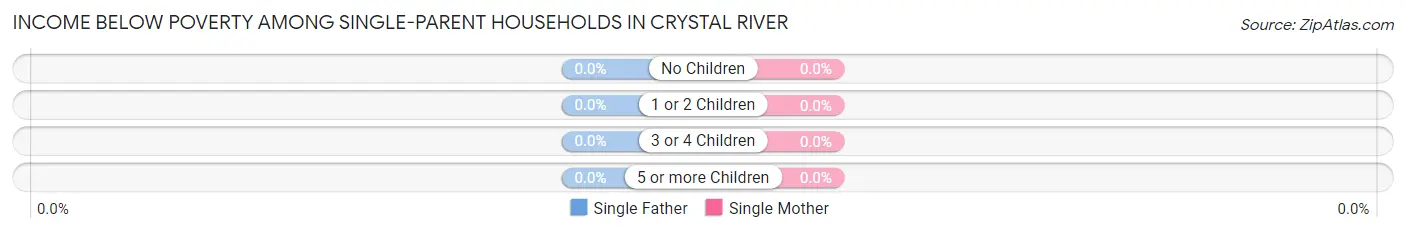
| Children | Single Father | Single Mother |
| No Children | 0 (0.0%) | 0 (0.0%) |
| 1 or 2 Children | 0 (0.0%) | 0 (0.0%) |
| 3 or 4 Children | 0 (0.0%) | 0 (0.0%) |
| 5 or more Children | 0 (0.0%) | 0 (0.0%) |
| Total | 0 (0.0%) | 0 (0.0%) |
Income Below Poverty Among Married-Couple vs Single-Parent Households in Crystal River
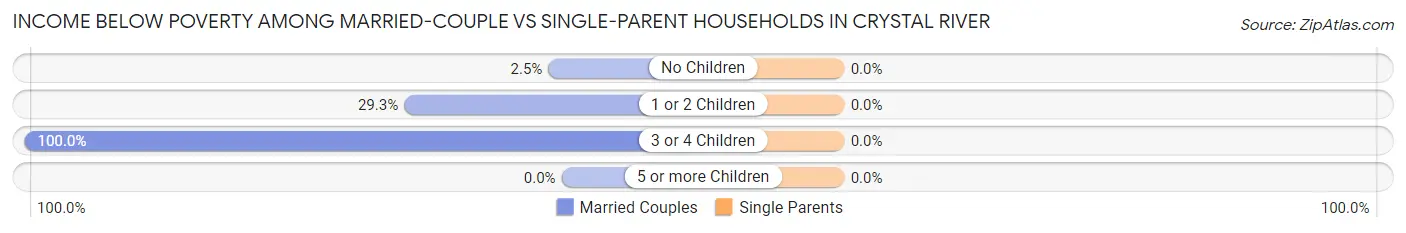
| Children | Married-Couple Families | Single-Parent Households |
| No Children | 16 (2.5%) | 0 (0.0%) |
| 1 or 2 Children | 22 (29.3%) | 0 (0.0%) |
| 3 or 4 Children | 22 (100.0%) | 0 (0.0%) |
| 5 or more Children | 0 (0.0%) | 0 (0.0%) |
| Total | 60 (8.1%) | 0 (0.0%) |
Employment Characteristics in Crystal River
Employment by Class of Employer in Crystal River
Among the 859 employed individuals in Crystal River, private company employees (622 | 72.4%), self-employed (not incorporated) (87 | 10.1%), and state government employees (59 | 6.9%) make up the most common classes of employment.
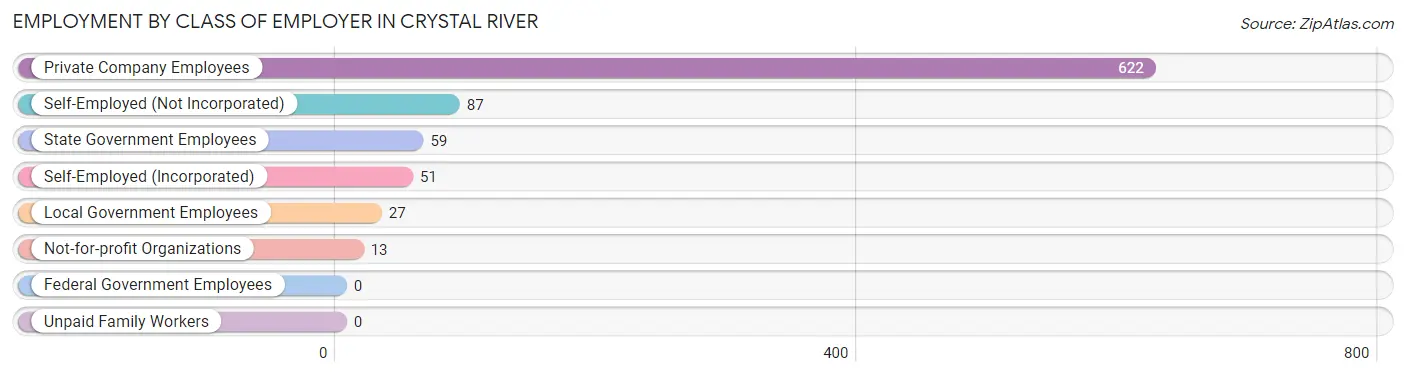
| Employer Class | # Employees | % Employees |
| Private Company Employees | 622 | 72.4% |
| Self-Employed (Incorporated) | 51 | 5.9% |
| Self-Employed (Not Incorporated) | 87 | 10.1% |
| Not-for-profit Organizations | 13 | 1.5% |
| Local Government Employees | 27 | 3.1% |
| State Government Employees | 59 | 6.9% |
| Federal Government Employees | 0 | 0.0% |
| Unpaid Family Workers | 0 | 0.0% |
| Total | 859 | 100.0% |
Employment Status by Age in Crystal River
According to the labor force statistics for Crystal River, out of the total population over 16 years of age (3,022), 32.8% or 991 individuals are in the labor force, with 11.0% or 109 of them unemployed. The age group with the highest labor force participation rate is 16 to 19 years, with 100.0% or 57 individuals in the labor force. Within the labor force, the 16 to 19 years age range has the highest percentage of unemployed individuals, with 68.4% or 39 of them being unemployed.
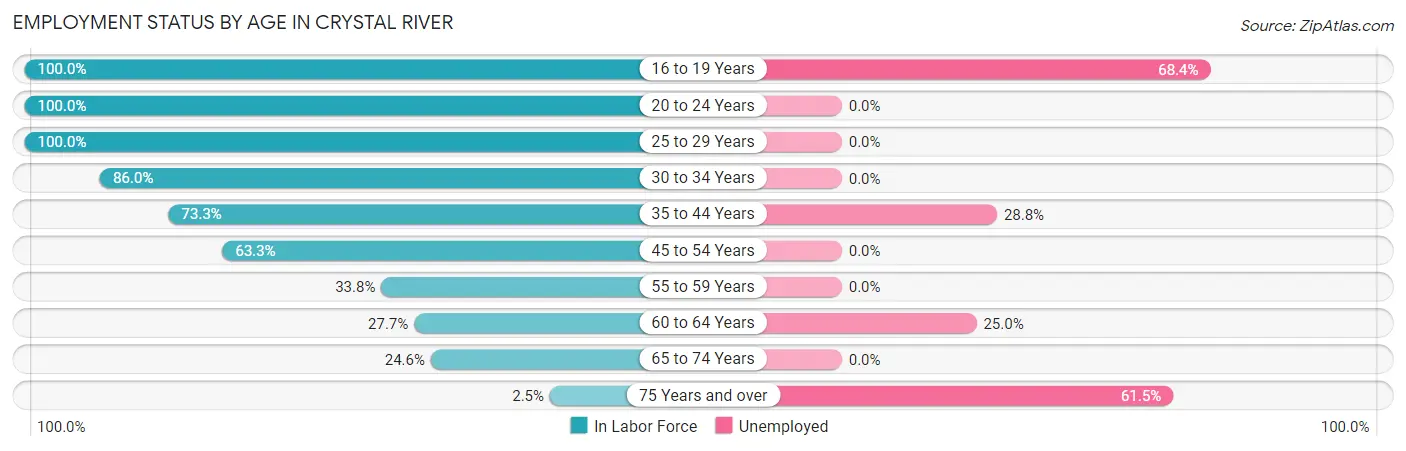
| Age Bracket | In Labor Force | Unemployed |
| 16 to 19 Years | 57 (100.0%) | 39 (68.4%) |
| 20 to 24 Years | 65 (100.0%) | 0 (0.0%) |
| 25 to 29 Years | 23 (100.0%) | 0 (0.0%) |
| 30 to 34 Years | 196 (86.0%) | 0 (0.0%) |
| 35 to 44 Years | 132 (73.3%) | 38 (28.8%) |
| 45 to 54 Years | 171 (63.3%) | 0 (0.0%) |
| 55 to 59 Years | 110 (33.8%) | 0 (0.0%) |
| 60 to 64 Years | 64 (27.7%) | 16 (25.0%) |
| 65 to 74 Years | 146 (24.6%) | 0 (0.0%) |
| 75 Years and over | 26 (2.5%) | 16 (61.5%) |
| Total | 991 (32.8%) | 109 (11.0%) |
Employment Status by Educational Attainment in Crystal River
According to labor force statistics for Crystal River, 55.4% of individuals (696) out of the total population between 25 and 64 years of age (1,257) are in the labor force, with 7.8% or 54 of them being unemployed. The group with the highest labor force participation rate are those with the educational attainment of high school diploma, with 61.5% or 219 individuals in the labor force. Within the labor force, individuals with college / associate degree education have the highest percentage of unemployment, with 11.3% or 18 of them being unemployed.
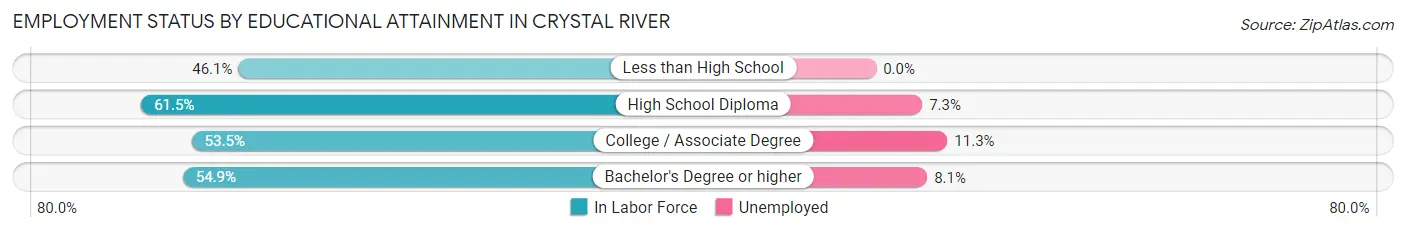
| Educational Attainment | In Labor Force | Unemployed |
| Less than High School | 70 (46.1%) | 0 (0.0%) |
| High School Diploma | 219 (61.5%) | 26 (7.3%) |
| College / Associate Degree | 159 (53.5%) | 34 (11.3%) |
| Bachelor's Degree or higher | 248 (54.9%) | 37 (8.1%) |
| Total | 696 (55.4%) | 98 (7.8%) |
Employment Occupations by Sex in Crystal River
Management, Business, Science and Arts Occupations
The most common Management, Business, Science and Arts occupations in Crystal River are Management (88 | 10.0%), Computers, Engineering & Science (63 | 7.1%), Community & Social Service (43 | 4.9%), Computers & Mathematics (38 | 4.3%), and Health Diagnosing & Treating (33 | 3.7%).
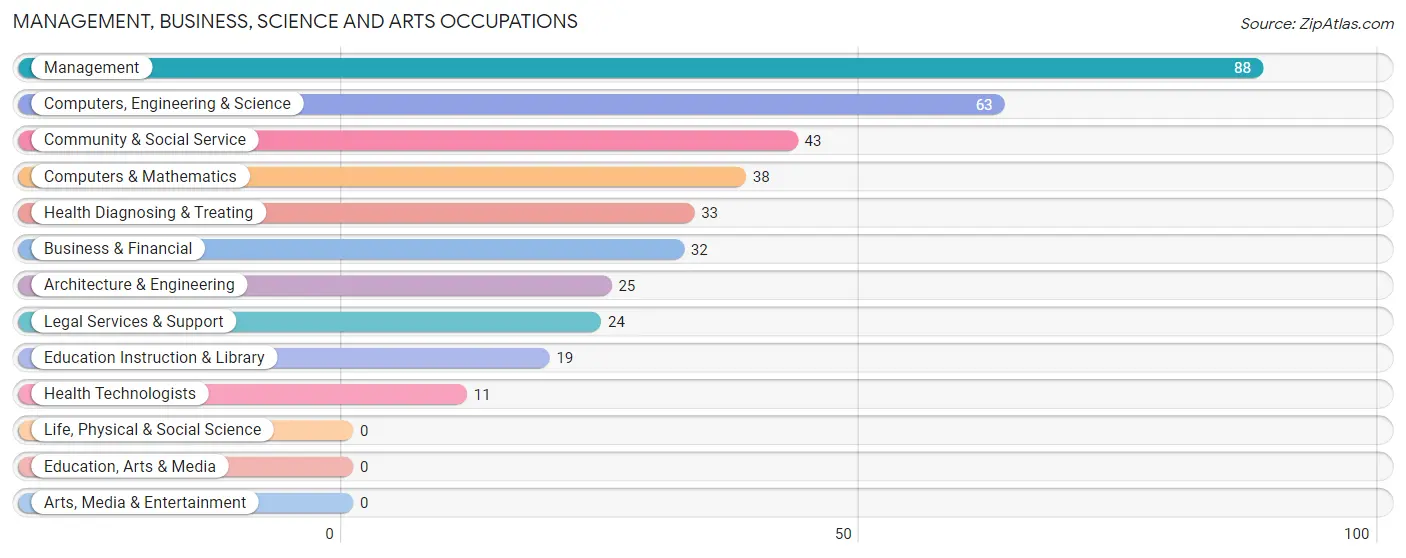
Management, Business, Science and Arts Occupations by Sex
Within the Management, Business, Science and Arts occupations in Crystal River, the most male-oriented occupations are Computers, Engineering & Science (100.0%), Computers & Mathematics (100.0%), and Architecture & Engineering (100.0%), while the most female-oriented occupations are Education Instruction & Library (100.0%), Health Diagnosing & Treating (100.0%), and Health Technologists (100.0%).
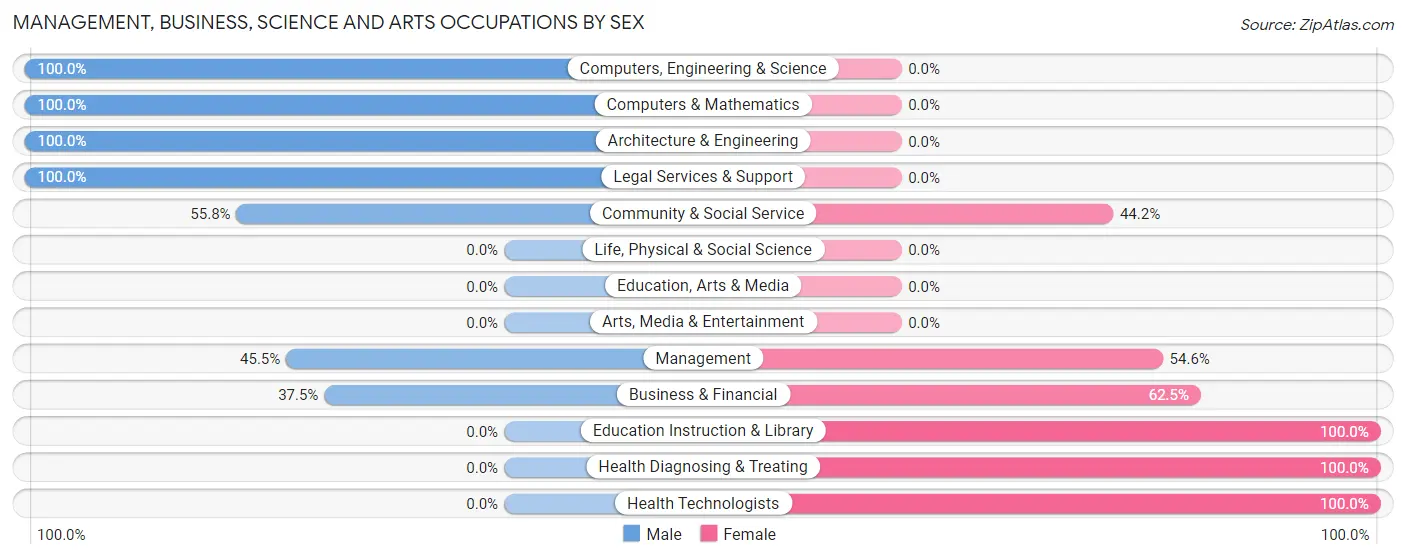
| Occupation | Male | Female |
| Management | 40 (45.5%) | 48 (54.5%) |
| Business & Financial | 12 (37.5%) | 20 (62.5%) |
| Computers, Engineering & Science | 63 (100.0%) | 0 (0.0%) |
| Computers & Mathematics | 38 (100.0%) | 0 (0.0%) |
| Architecture & Engineering | 25 (100.0%) | 0 (0.0%) |
| Life, Physical & Social Science | 0 (0.0%) | 0 (0.0%) |
| Community & Social Service | 24 (55.8%) | 19 (44.2%) |
| Education, Arts & Media | 0 (0.0%) | 0 (0.0%) |
| Legal Services & Support | 24 (100.0%) | 0 (0.0%) |
| Education Instruction & Library | 0 (0.0%) | 19 (100.0%) |
| Arts, Media & Entertainment | 0 (0.0%) | 0 (0.0%) |
| Health Diagnosing & Treating | 0 (0.0%) | 33 (100.0%) |
| Health Technologists | 0 (0.0%) | 11 (100.0%) |
| Total (Category) | 139 (53.7%) | 120 (46.3%) |
| Total (Overall) | 489 (55.5%) | 392 (44.5%) |
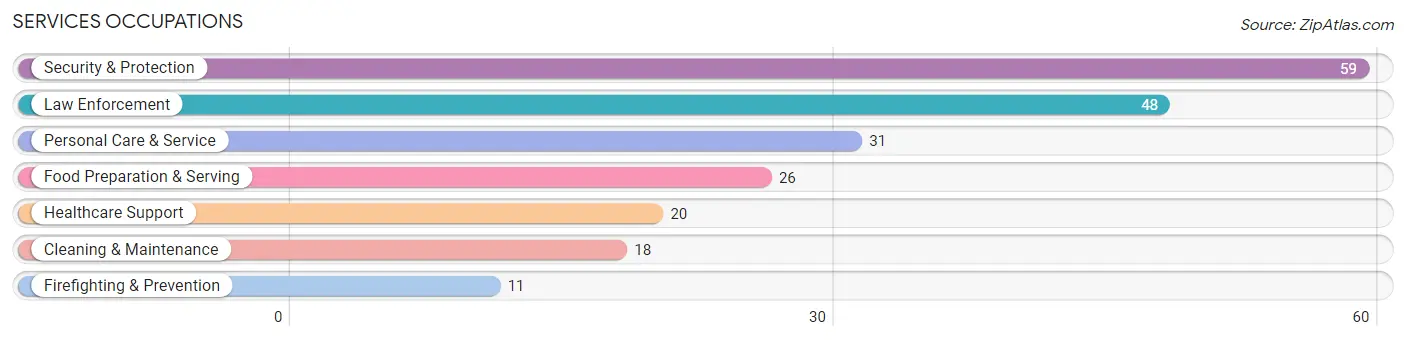
Services Occupations
The most common Services occupations in Crystal River are Security & Protection (59 | 6.7%), Law Enforcement (48 | 5.4%), Personal Care & Service (31 | 3.5%), Food Preparation & Serving (26 | 2.9%), and Healthcare Support (20 | 2.3%).
Services Occupations by Sex
Within the Services occupations in Crystal River, the most male-oriented occupations are Law Enforcement (52.1%), Cleaning & Maintenance (44.4%), and Security & Protection (42.4%), while the most female-oriented occupations are Healthcare Support (100.0%), Firefighting & Prevention (100.0%), and Food Preparation & Serving (100.0%).
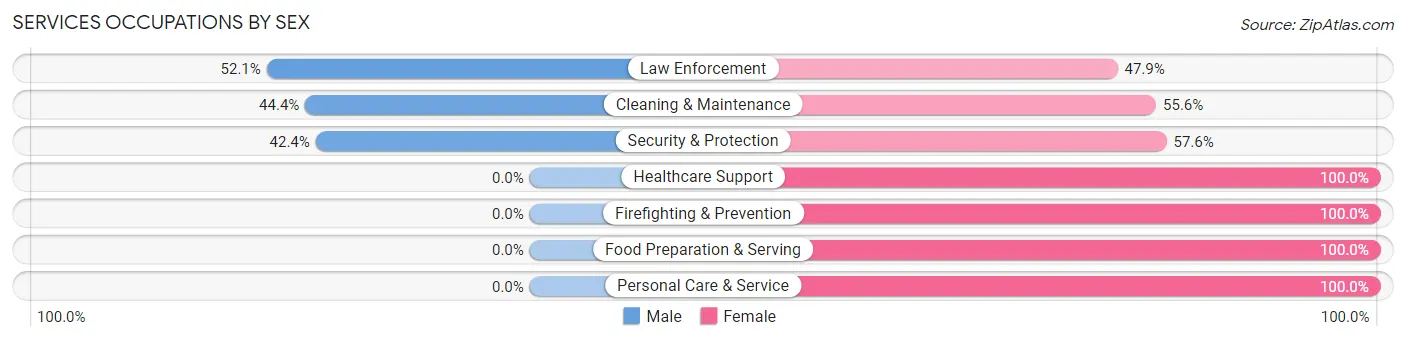
| Occupation | Male | Female |
| Healthcare Support | 0 (0.0%) | 20 (100.0%) |
| Security & Protection | 25 (42.4%) | 34 (57.6%) |
| Firefighting & Prevention | 0 (0.0%) | 11 (100.0%) |
| Law Enforcement | 25 (52.1%) | 23 (47.9%) |
| Food Preparation & Serving | 0 (0.0%) | 26 (100.0%) |
| Cleaning & Maintenance | 8 (44.4%) | 10 (55.6%) |
| Personal Care & Service | 0 (0.0%) | 31 (100.0%) |
| Total (Category) | 33 (21.4%) | 121 (78.6%) |
| Total (Overall) | 489 (55.5%) | 392 (44.5%) |
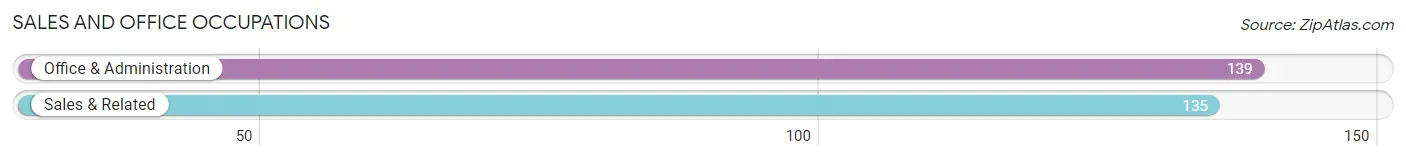
Sales and Office Occupations
The most common Sales and Office occupations in Crystal River are Office & Administration (139 | 15.8%), and Sales & Related (135 | 15.3%).
Sales and Office Occupations by Sex
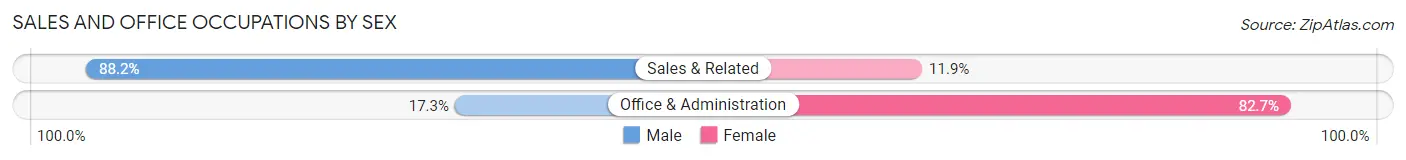
| Occupation | Male | Female |
| Sales & Related | 119 (88.1%) | 16 (11.8%) |
| Office & Administration | 24 (17.3%) | 115 (82.7%) |
| Total (Category) | 143 (52.2%) | 131 (47.8%) |
| Total (Overall) | 489 (55.5%) | 392 (44.5%) |
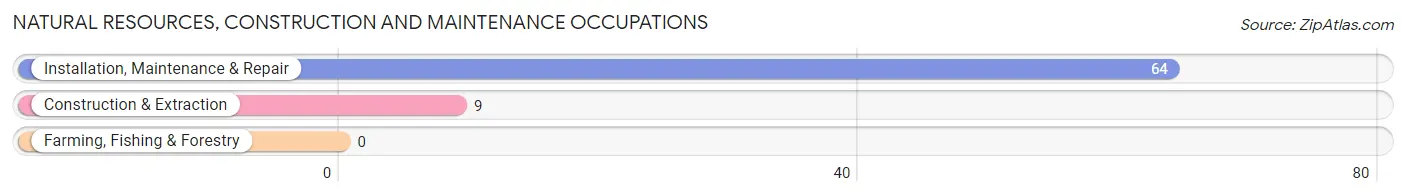
Natural Resources, Construction and Maintenance Occupations
The most common Natural Resources, Construction and Maintenance occupations in Crystal River are Installation, Maintenance & Repair (64 | 7.3%), and Construction & Extraction (9 | 1.0%).
Natural Resources, Construction and Maintenance Occupations by Sex
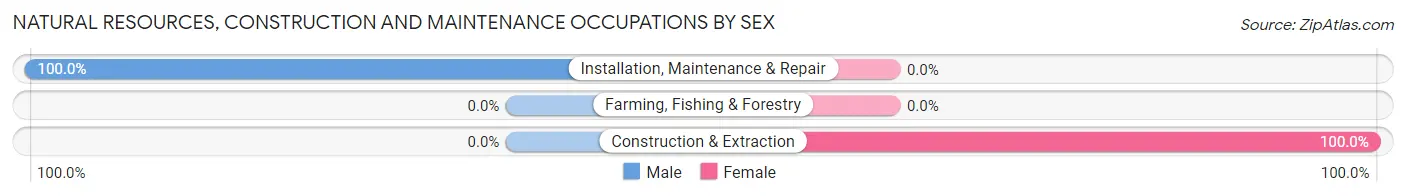
| Occupation | Male | Female |
| Farming, Fishing & Forestry | 0 (0.0%) | 0 (0.0%) |
| Construction & Extraction | 0 (0.0%) | 9 (100.0%) |
| Installation, Maintenance & Repair | 64 (100.0%) | 0 (0.0%) |
| Total (Category) | 64 (87.7%) | 9 (12.3%) |
| Total (Overall) | 489 (55.5%) | 392 (44.5%) |
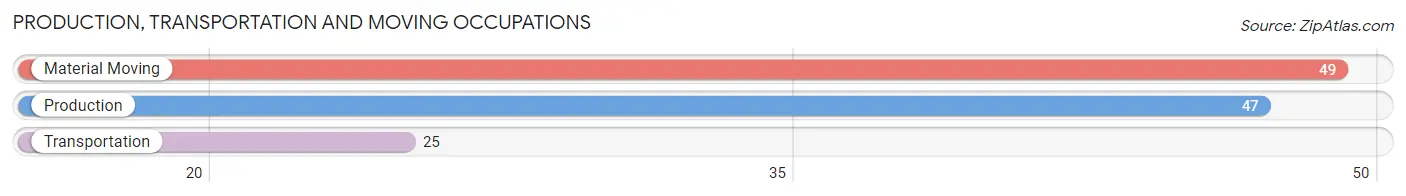
Production, Transportation and Moving Occupations
The most common Production, Transportation and Moving occupations in Crystal River are Material Moving (49 | 5.6%), Production (47 | 5.3%), and Transportation (25 | 2.8%).
Production, Transportation and Moving Occupations by Sex
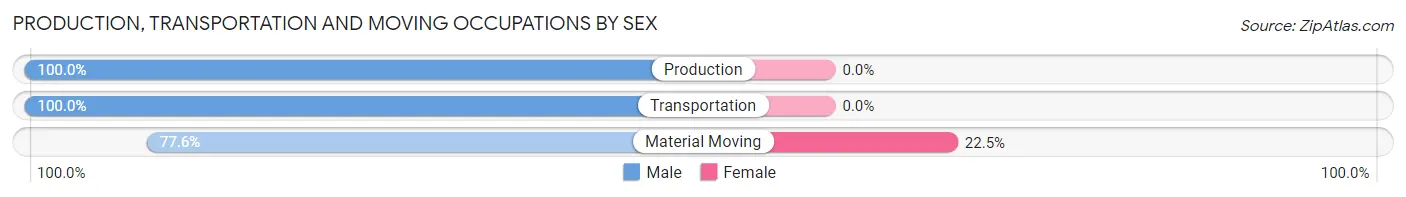
| Occupation | Male | Female |
| Production | 47 (100.0%) | 0 (0.0%) |
| Transportation | 25 (100.0%) | 0 (0.0%) |
| Material Moving | 38 (77.5%) | 11 (22.5%) |
| Total (Category) | 110 (90.9%) | 11 (9.1%) |
| Total (Overall) | 489 (55.5%) | 392 (44.5%) |
Employment Industries by Sex in Crystal River
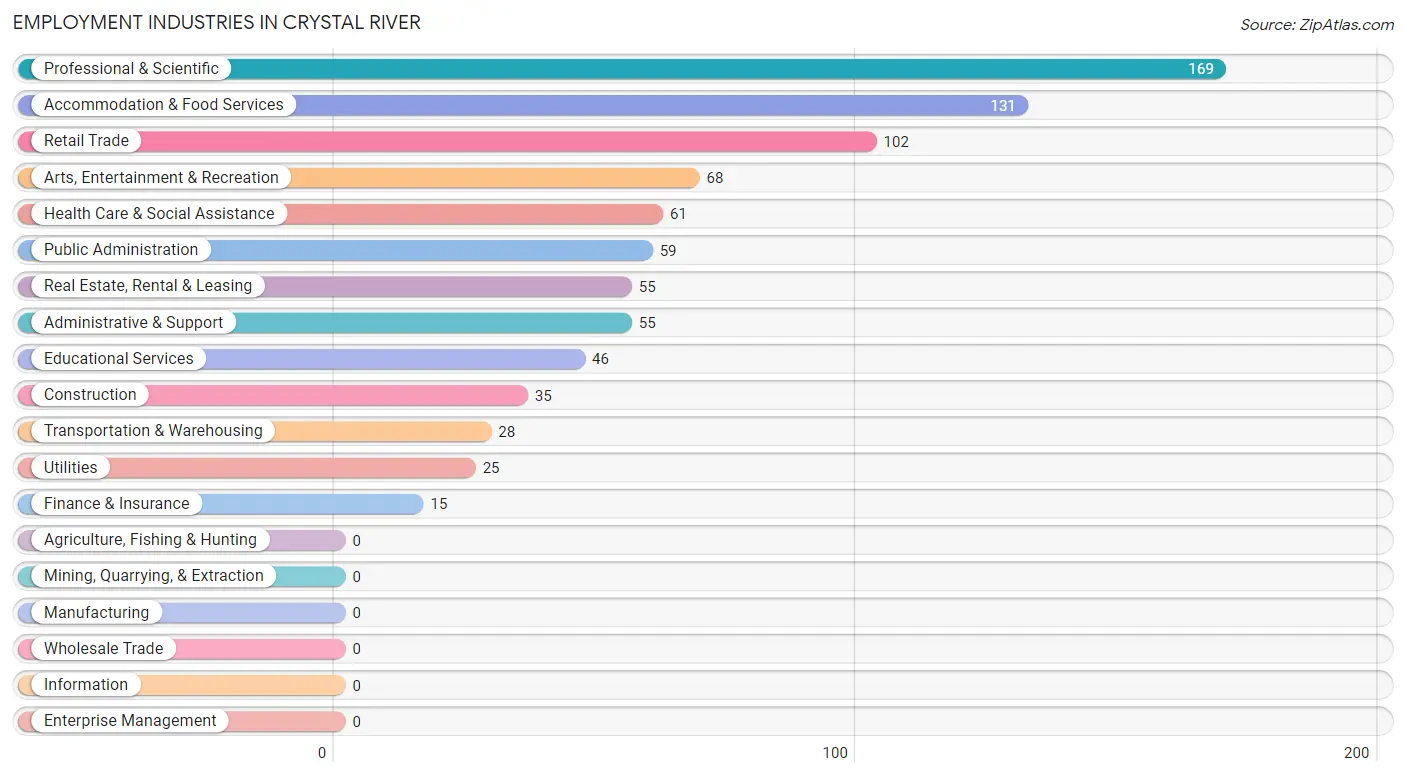
Employment Industries in Crystal River
The major employment industries in Crystal River include Professional & Scientific (169 | 19.2%), Accommodation & Food Services (131 | 14.9%), Retail Trade (102 | 11.6%), Arts, Entertainment & Recreation (68 | 7.7%), and Health Care & Social Assistance (61 | 6.9%).
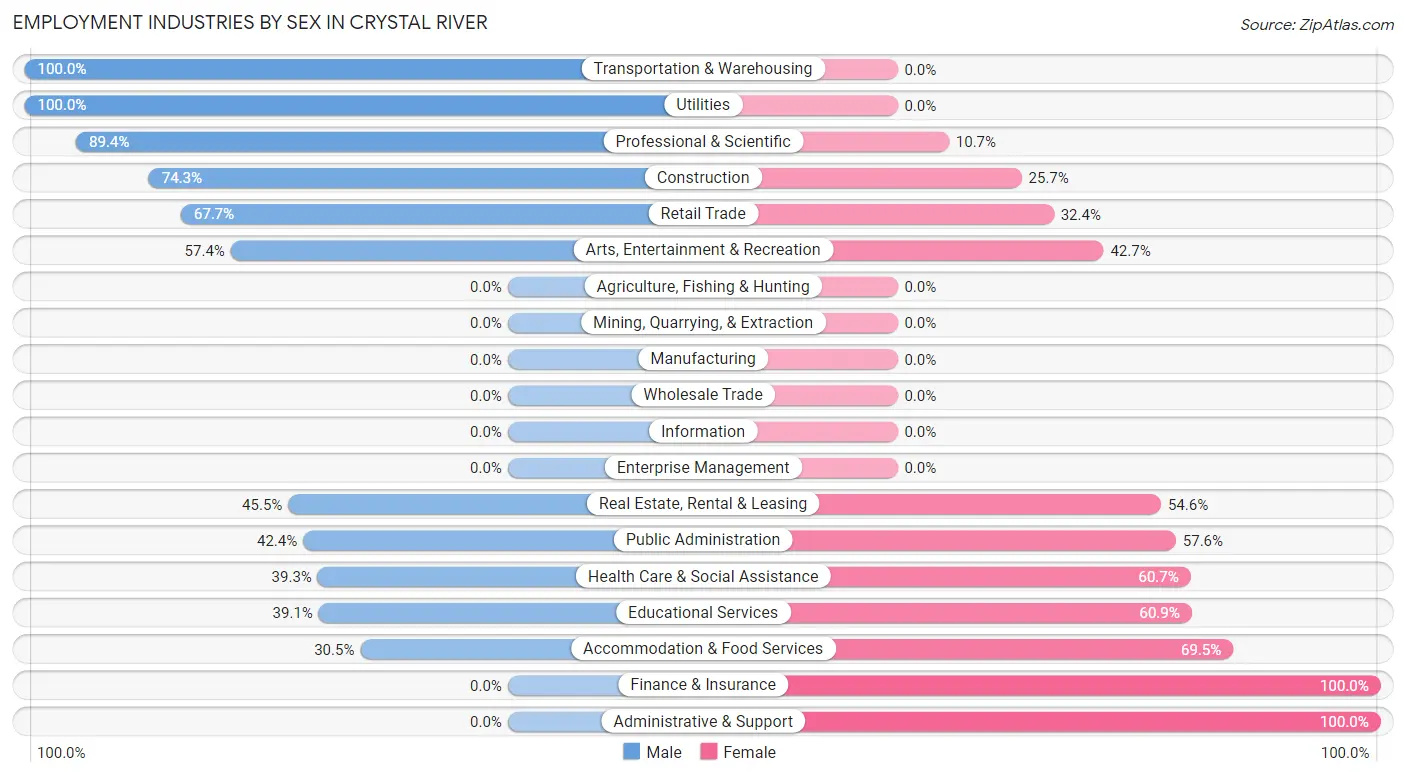
Employment Industries by Sex in Crystal River
The Crystal River industries that see more men than women are Transportation & Warehousing (100.0%), Utilities (100.0%), and Professional & Scientific (89.3%), whereas the industries that tend to have a higher number of women are Finance & Insurance (100.0%), Administrative & Support (100.0%), and Accommodation & Food Services (69.5%).
| Industry | Male | Female |
| Agriculture, Fishing & Hunting | 0 (0.0%) | 0 (0.0%) |
| Mining, Quarrying, & Extraction | 0 (0.0%) | 0 (0.0%) |
| Construction | 26 (74.3%) | 9 (25.7%) |
| Manufacturing | 0 (0.0%) | 0 (0.0%) |
| Wholesale Trade | 0 (0.0%) | 0 (0.0%) |
| Retail Trade | 69 (67.6%) | 33 (32.4%) |
| Transportation & Warehousing | 28 (100.0%) | 0 (0.0%) |
| Utilities | 25 (100.0%) | 0 (0.0%) |
| Information | 0 (0.0%) | 0 (0.0%) |
| Finance & Insurance | 0 (0.0%) | 15 (100.0%) |
| Real Estate, Rental & Leasing | 25 (45.5%) | 30 (54.5%) |
| Professional & Scientific | 151 (89.3%) | 18 (10.6%) |
| Enterprise Management | 0 (0.0%) | 0 (0.0%) |
| Administrative & Support | 0 (0.0%) | 55 (100.0%) |
| Educational Services | 18 (39.1%) | 28 (60.9%) |
| Health Care & Social Assistance | 24 (39.3%) | 37 (60.7%) |
| Arts, Entertainment & Recreation | 39 (57.4%) | 29 (42.6%) |
| Accommodation & Food Services | 40 (30.5%) | 91 (69.5%) |
| Public Administration | 25 (42.4%) | 34 (57.6%) |
| Total | 489 (55.5%) | 392 (44.5%) |
Education in Crystal River
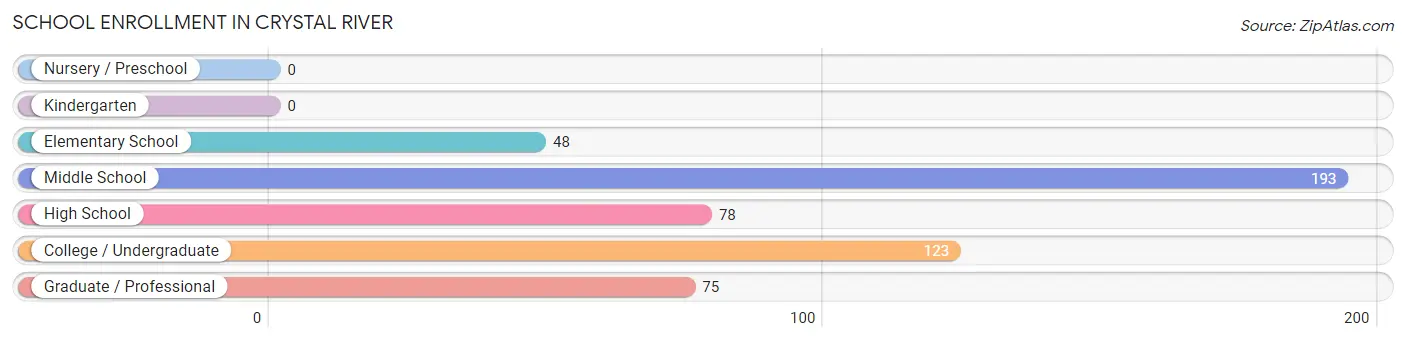
School Enrollment in Crystal River
The most common levels of schooling among the 517 students in Crystal River are middle school (193 | 37.3%), college / undergraduate (123 | 23.8%), and high school (78 | 15.1%).
| School Level | # Students | % Students |
| Nursery / Preschool | 0 | 0.0% |
| Kindergarten | 0 | 0.0% |
| Elementary School | 48 | 9.3% |
| Middle School | 193 | 37.3% |
| High School | 78 | 15.1% |
| College / Undergraduate | 123 | 23.8% |
| Graduate / Professional | 75 | 14.5% |
| Total | 517 | 100.0% |
School Enrollment by Age by Funding Source in Crystal River
Out of a total of 517 students who are enrolled in schools in Crystal River, 38 (7.4%) attend a private institution, while the remaining 479 (92.6%) are enrolled in public schools. The age group of 35 years and over has the highest likelihood of being enrolled in private schools, with 20 (52.6% in the age bracket) enrolled. Conversely, the age group of 5 to 9 year old has the lowest likelihood of being enrolled in a private school, with 46 (100.0% in the age bracket) attending a public institution.
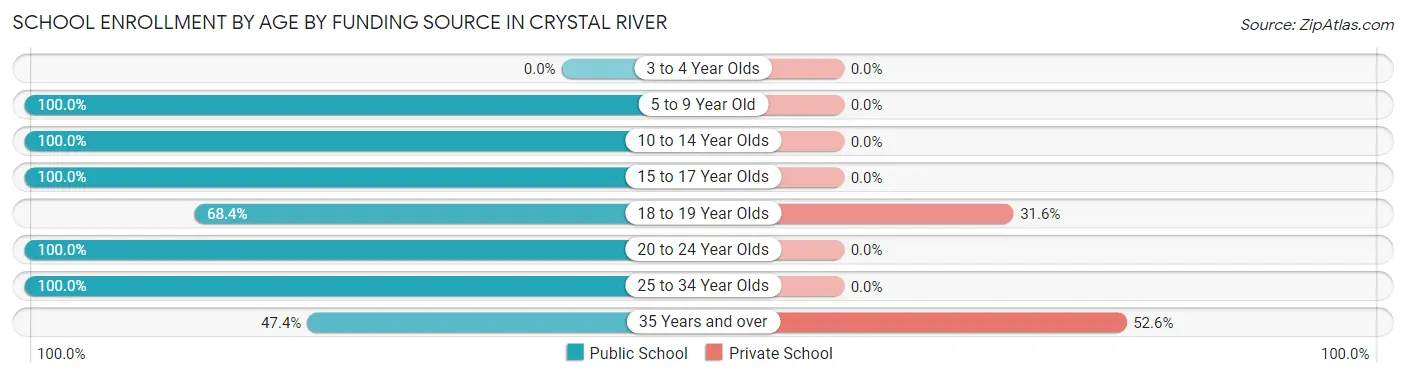
| Age Bracket | Public School | Private School |
| 3 to 4 Year Olds | 0 (0.0%) | 0 (0.0%) |
| 5 to 9 Year Old | 46 (100.0%) | 0 (0.0%) |
| 10 to 14 Year Olds | 195 (100.0%) | 0 (0.0%) |
| 15 to 17 Year Olds | 39 (100.0%) | 0 (0.0%) |
| 18 to 19 Year Olds | 39 (68.4%) | 18 (31.6%) |
| 20 to 24 Year Olds | 65 (100.0%) | 0 (0.0%) |
| 25 to 34 Year Olds | 77 (100.0%) | 0 (0.0%) |
| 35 Years and over | 18 (47.4%) | 20 (52.6%) |
| Total | 479 (92.6%) | 38 (7.4%) |
Educational Attainment by Field of Study in Crystal River
Engineering (249 | 21.3%), business (236 | 20.2%), psychology (165 | 14.1%), education (115 | 9.8%), and social sciences (110 | 9.4%) are the most common fields of study among 1,170 individuals in Crystal River who have obtained a bachelor's degree or higher.
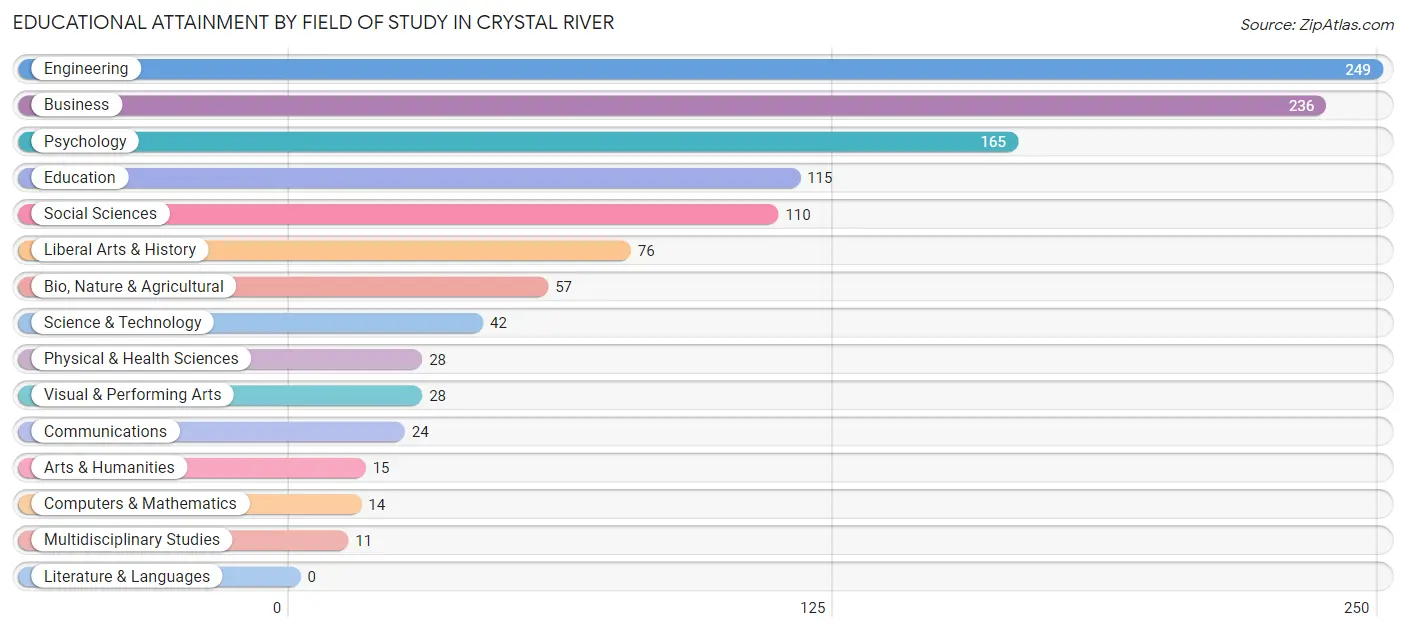
| Field of Study | # Graduates | % Graduates |
| Computers & Mathematics | 14 | 1.2% |
| Bio, Nature & Agricultural | 57 | 4.9% |
| Physical & Health Sciences | 28 | 2.4% |
| Psychology | 165 | 14.1% |
| Social Sciences | 110 | 9.4% |
| Engineering | 249 | 21.3% |
| Multidisciplinary Studies | 11 | 0.9% |
| Science & Technology | 42 | 3.6% |
| Business | 236 | 20.2% |
| Education | 115 | 9.8% |
| Literature & Languages | 0 | 0.0% |
| Liberal Arts & History | 76 | 6.5% |
| Visual & Performing Arts | 28 | 2.4% |
| Communications | 24 | 2.1% |
| Arts & Humanities | 15 | 1.3% |
| Total | 1,170 | 100.0% |
Transportation & Commute in Crystal River
Vehicle Availability by Sex in Crystal River
The most prevalent vehicle ownership categories in Crystal River are males with 2 vehicles (184, accounting for 39.4%) and females with 2 vehicles (76, making up 46.9%).
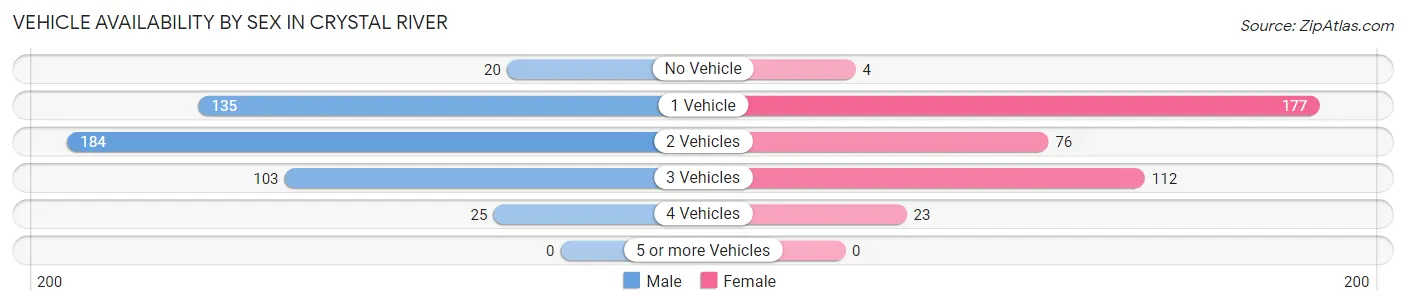
| Vehicles Available | Male | Female |
| No Vehicle | 20 (4.3%) | 4 (1.0%) |
| 1 Vehicle | 135 (28.9%) | 177 (45.2%) |
| 2 Vehicles | 184 (39.4%) | 76 (19.4%) |
| 3 Vehicles | 103 (22.1%) | 112 (28.6%) |
| 4 Vehicles | 25 (5.3%) | 23 (5.9%) |
| 5 or more Vehicles | 0 (0.0%) | 0 (0.0%) |
| Total | 467 (100.0%) | 392 (100.0%) |
Commute Time in Crystal River
The most frequently occuring commute durations in Crystal River are 5 to 9 minutes (183 commuters, 23.9%), 10 to 14 minutes (167 commuters, 21.8%), and 15 to 19 minutes (165 commuters, 21.5%).
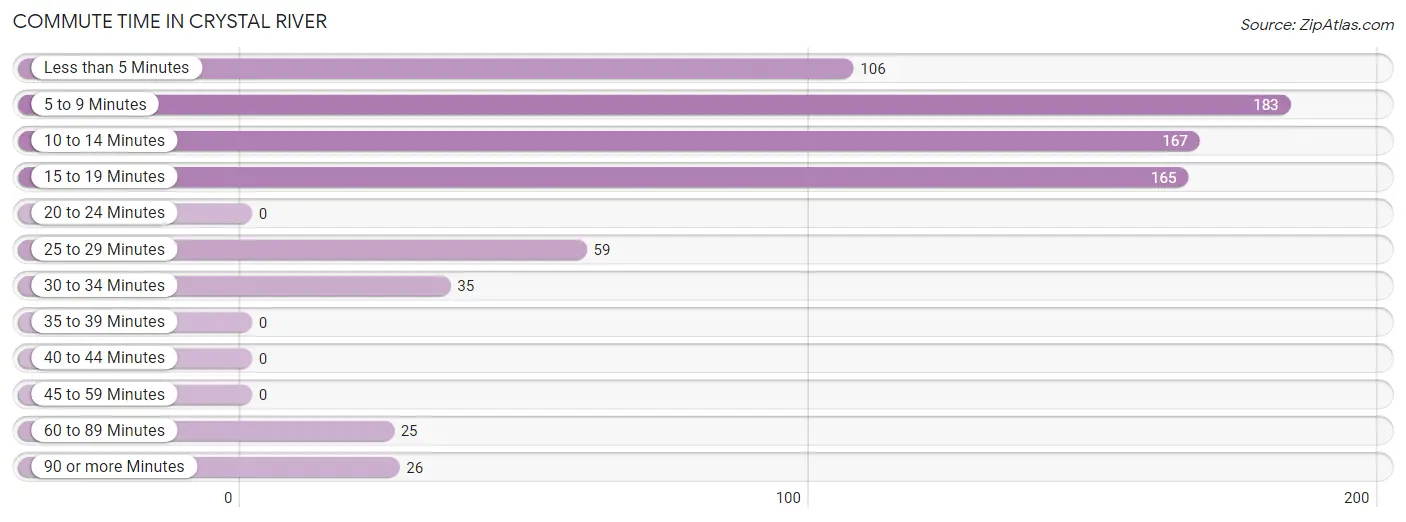
| Commute Time | # Commuters | % Commuters |
| Less than 5 Minutes | 106 | 13.8% |
| 5 to 9 Minutes | 183 | 23.9% |
| 10 to 14 Minutes | 167 | 21.8% |
| 15 to 19 Minutes | 165 | 21.5% |
| 20 to 24 Minutes | 0 | 0.0% |
| 25 to 29 Minutes | 59 | 7.7% |
| 30 to 34 Minutes | 35 | 4.6% |
| 35 to 39 Minutes | 0 | 0.0% |
| 40 to 44 Minutes | 0 | 0.0% |
| 45 to 59 Minutes | 0 | 0.0% |
| 60 to 89 Minutes | 25 | 3.3% |
| 90 or more Minutes | 26 | 3.4% |
Commute Time by Sex in Crystal River
The most common commute times in Crystal River are 5 to 9 minutes (107 commuters, 27.2%) for males and 15 to 19 minutes (121 commuters, 32.4%) for females.
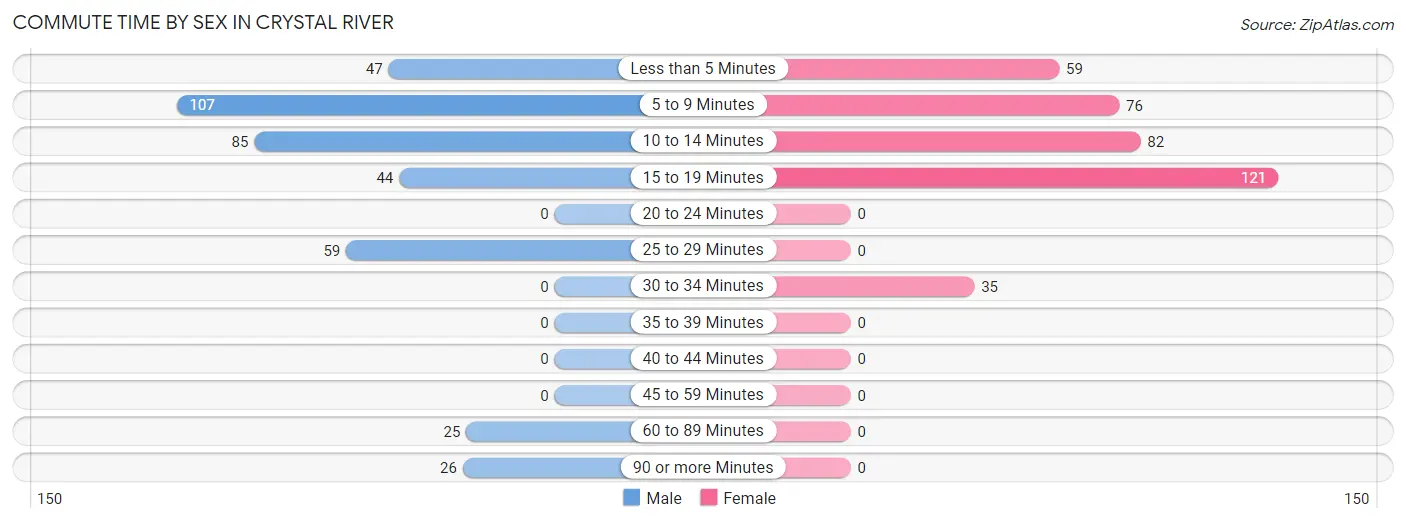
| Commute Time | Male | Female |
| Less than 5 Minutes | 47 (12.0%) | 59 (15.8%) |
| 5 to 9 Minutes | 107 (27.2%) | 76 (20.4%) |
| 10 to 14 Minutes | 85 (21.6%) | 82 (22.0%) |
| 15 to 19 Minutes | 44 (11.2%) | 121 (32.4%) |
| 20 to 24 Minutes | 0 (0.0%) | 0 (0.0%) |
| 25 to 29 Minutes | 59 (15.0%) | 0 (0.0%) |
| 30 to 34 Minutes | 0 (0.0%) | 35 (9.4%) |
| 35 to 39 Minutes | 0 (0.0%) | 0 (0.0%) |
| 40 to 44 Minutes | 0 (0.0%) | 0 (0.0%) |
| 45 to 59 Minutes | 0 (0.0%) | 0 (0.0%) |
| 60 to 89 Minutes | 25 (6.4%) | 0 (0.0%) |
| 90 or more Minutes | 26 (6.6%) | 0 (0.0%) |
Time of Departure to Work by Sex in Crystal River
The most frequent times of departure to work in Crystal River are 7:00 AM to 7:29 AM (140, 35.6%) for males and 8:00 AM to 8:29 AM (128, 34.3%) for females.
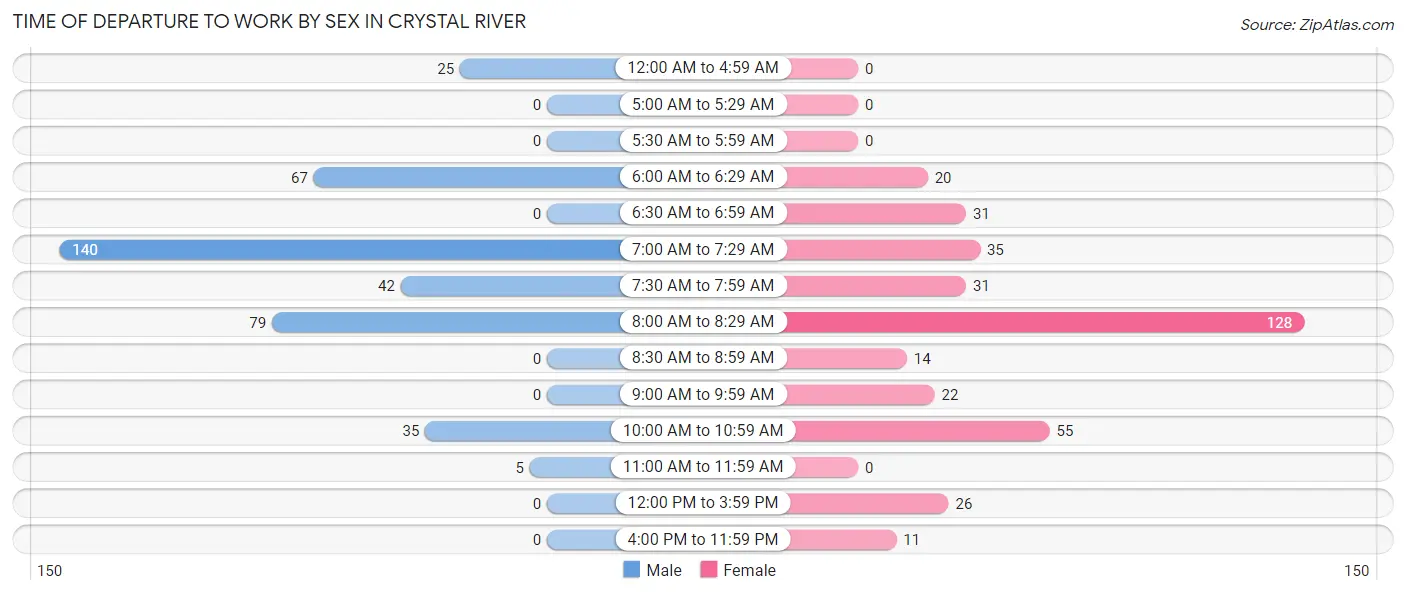
| Time of Departure | Male | Female |
| 12:00 AM to 4:59 AM | 25 (6.4%) | 0 (0.0%) |
| 5:00 AM to 5:29 AM | 0 (0.0%) | 0 (0.0%) |
| 5:30 AM to 5:59 AM | 0 (0.0%) | 0 (0.0%) |
| 6:00 AM to 6:29 AM | 67 (17.1%) | 20 (5.4%) |
| 6:30 AM to 6:59 AM | 0 (0.0%) | 31 (8.3%) |
| 7:00 AM to 7:29 AM | 140 (35.6%) | 35 (9.4%) |
| 7:30 AM to 7:59 AM | 42 (10.7%) | 31 (8.3%) |
| 8:00 AM to 8:29 AM | 79 (20.1%) | 128 (34.3%) |
| 8:30 AM to 8:59 AM | 0 (0.0%) | 14 (3.7%) |
| 9:00 AM to 9:59 AM | 0 (0.0%) | 22 (5.9%) |
| 10:00 AM to 10:59 AM | 35 (8.9%) | 55 (14.7%) |
| 11:00 AM to 11:59 AM | 5 (1.3%) | 0 (0.0%) |
| 12:00 PM to 3:59 PM | 0 (0.0%) | 26 (7.0%) |
| 4:00 PM to 11:59 PM | 0 (0.0%) | 11 (2.9%) |
| Total | 393 (100.0%) | 373 (100.0%) |
Housing Occupancy in Crystal River
Occupancy by Ownership in Crystal River
Of the total 1,603 dwellings in Crystal River, owner-occupied units account for 1,052 (65.6%), while renter-occupied units make up 551 (34.4%).
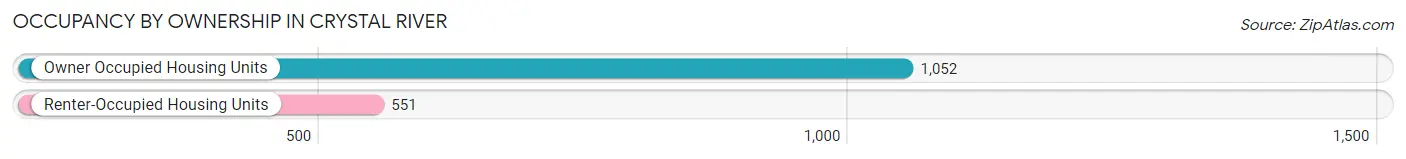
| Occupancy | # Housing Units | % Housing Units |
| Owner Occupied Housing Units | 1,052 | 65.6% |
| Renter-Occupied Housing Units | 551 | 34.4% |
| Total Occupied Housing Units | 1,603 | 100.0% |
Occupancy by Household Size in Crystal River
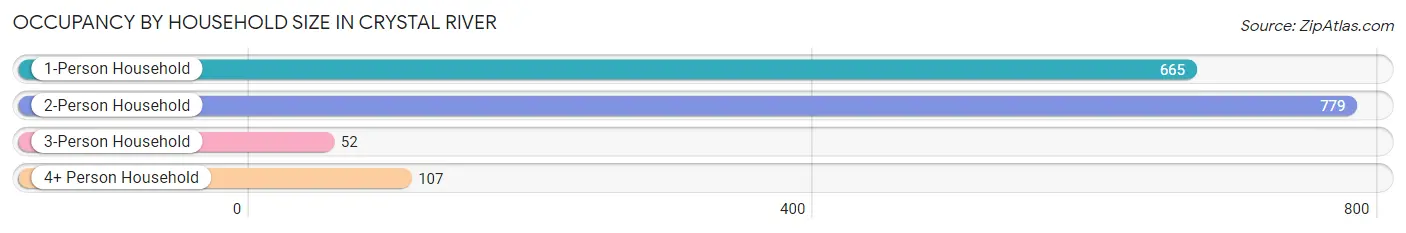
| Household Size | # Housing Units | % Housing Units |
| 1-Person Household | 665 | 41.5% |
| 2-Person Household | 779 | 48.6% |
| 3-Person Household | 52 | 3.2% |
| 4+ Person Household | 107 | 6.7% |
| Total Housing Units | 1,603 | 100.0% |
Occupancy by Ownership by Household Size in Crystal River
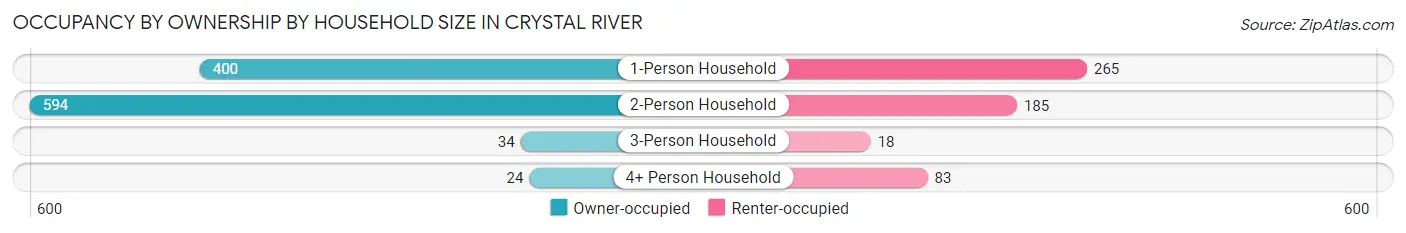
| Household Size | Owner-occupied | Renter-occupied |
| 1-Person Household | 400 (60.2%) | 265 (39.9%) |
| 2-Person Household | 594 (76.2%) | 185 (23.7%) |
| 3-Person Household | 34 (65.4%) | 18 (34.6%) |
| 4+ Person Household | 24 (22.4%) | 83 (77.6%) |
| Total Housing Units | 1,052 (65.6%) | 551 (34.4%) |
Occupancy by Educational Attainment in Crystal River
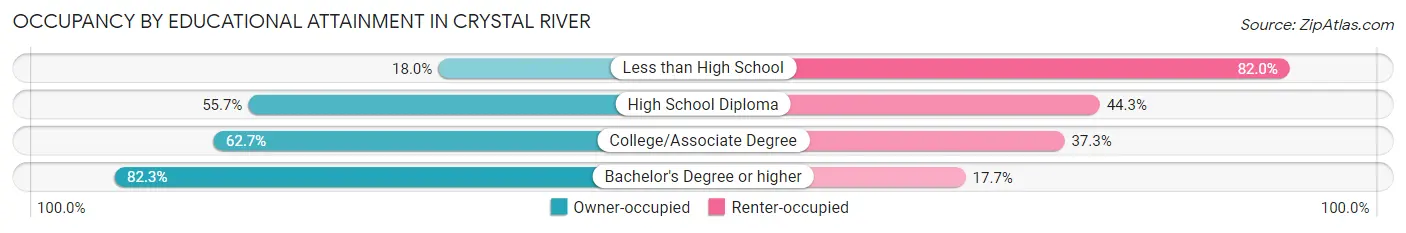
| Household Size | Owner-occupied | Renter-occupied |
| Less than High School | 20 (18.0%) | 91 (82.0%) |
| High School Diploma | 221 (55.7%) | 176 (44.3%) |
| College/Associate Degree | 287 (62.7%) | 171 (37.3%) |
| Bachelor's Degree or higher | 524 (82.3%) | 113 (17.7%) |
Occupancy by Age of Householder in Crystal River
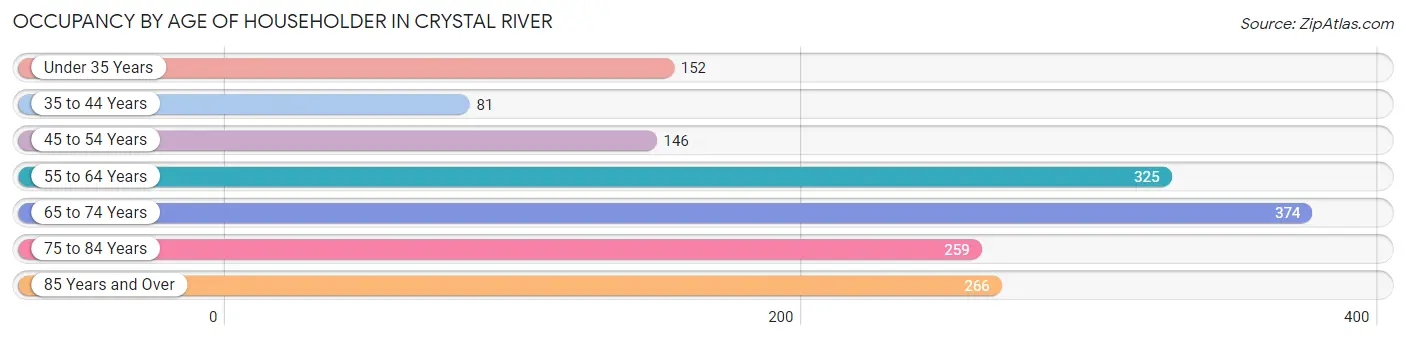
| Age Bracket | # Households | % Households |
| Under 35 Years | 152 | 9.5% |
| 35 to 44 Years | 81 | 5.1% |
| 45 to 54 Years | 146 | 9.1% |
| 55 to 64 Years | 325 | 20.3% |
| 65 to 74 Years | 374 | 23.3% |
| 75 to 84 Years | 259 | 16.2% |
| 85 Years and Over | 266 | 16.6% |
| Total | 1,603 | 100.0% |
Housing Finances in Crystal River
Median Income by Occupancy in Crystal River
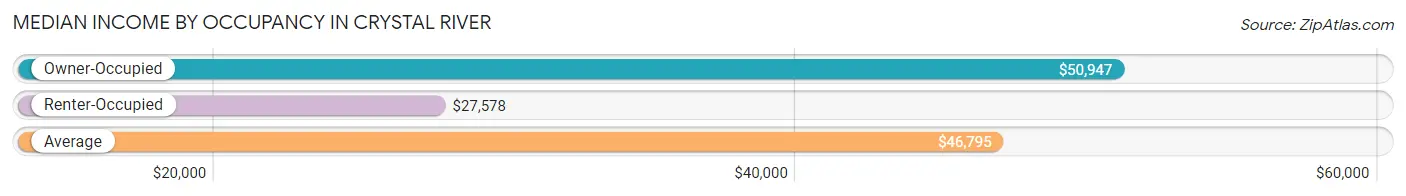
| Occupancy Type | # Households | Median Income |
| Owner-Occupied | 1,052 (65.6%) | $50,947 |
| Renter-Occupied | 551 (34.4%) | $27,578 |
| Average | 1,603 (100.0%) | $46,795 |
Occupancy by Householder Income Bracket in Crystal River
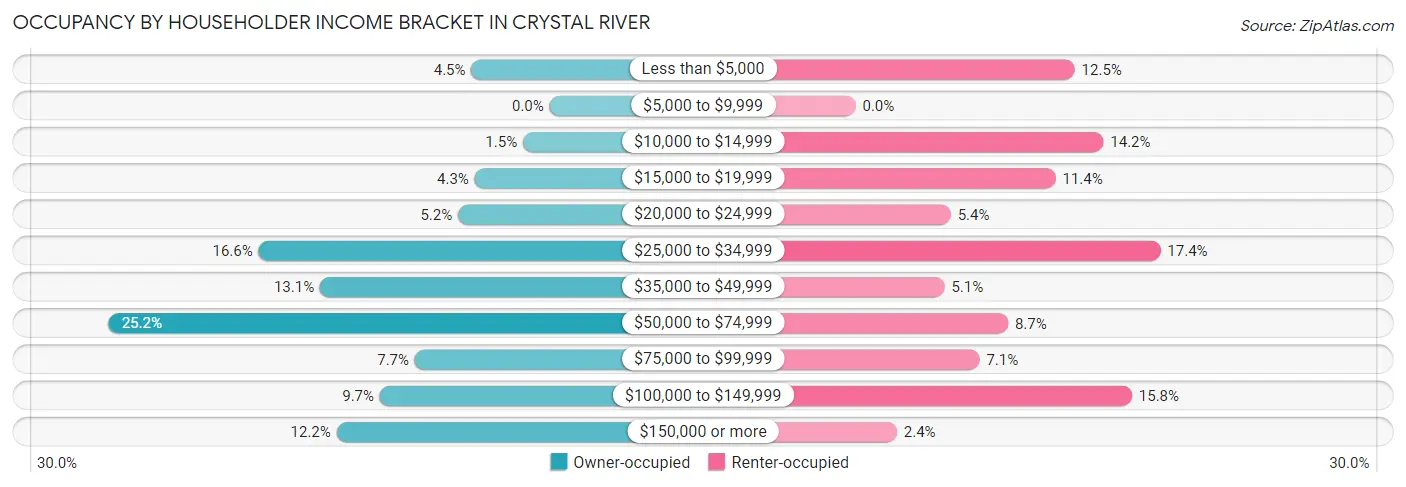
| Income Bracket | Owner-occupied | Renter-occupied |
| Less than $5,000 | 47 (4.5%) | 69 (12.5%) |
| $5,000 to $9,999 | 0 (0.0%) | 0 (0.0%) |
| $10,000 to $14,999 | 16 (1.5%) | 78 (14.2%) |
| $15,000 to $19,999 | 45 (4.3%) | 63 (11.4%) |
| $20,000 to $24,999 | 55 (5.2%) | 30 (5.4%) |
| $25,000 to $34,999 | 175 (16.6%) | 96 (17.4%) |
| $35,000 to $49,999 | 138 (13.1%) | 28 (5.1%) |
| $50,000 to $74,999 | 265 (25.2%) | 48 (8.7%) |
| $75,000 to $99,999 | 81 (7.7%) | 39 (7.1%) |
| $100,000 to $149,999 | 102 (9.7%) | 87 (15.8%) |
| $150,000 or more | 128 (12.2%) | 13 (2.4%) |
| Total | 1,052 (100.0%) | 551 (100.0%) |
Monthly Housing Cost Tiers in Crystal River
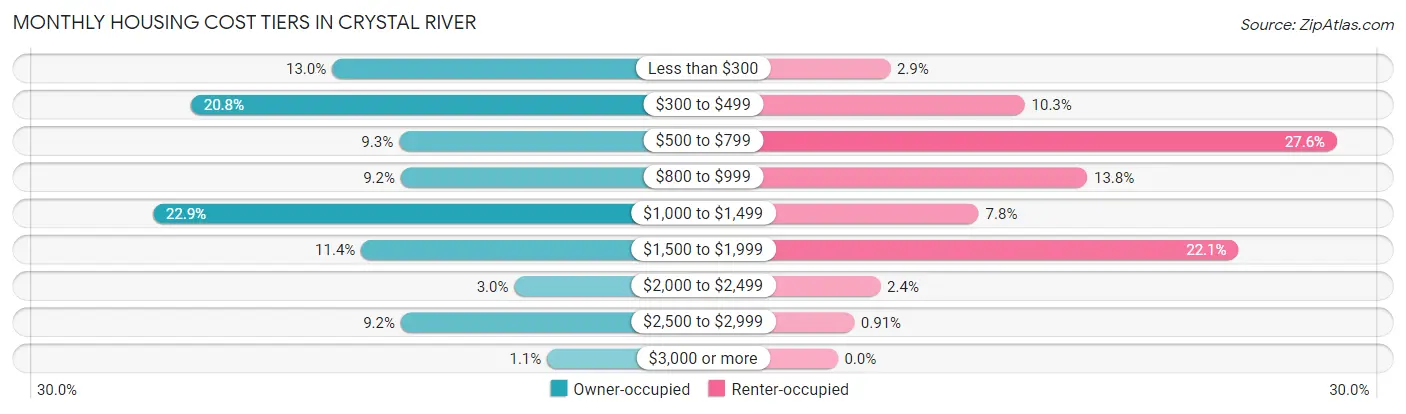
| Monthly Cost | Owner-occupied | Renter-occupied |
| Less than $300 | 137 (13.0%) | 16 (2.9%) |
| $300 to $499 | 219 (20.8%) | 57 (10.3%) |
| $500 to $799 | 98 (9.3%) | 152 (27.6%) |
| $800 to $999 | 97 (9.2%) | 76 (13.8%) |
| $1,000 to $1,499 | 241 (22.9%) | 43 (7.8%) |
| $1,500 to $1,999 | 120 (11.4%) | 122 (22.1%) |
| $2,000 to $2,499 | 31 (2.9%) | 13 (2.4%) |
| $2,500 to $2,999 | 97 (9.2%) | 5 (0.9%) |
| $3,000 or more | 12 (1.1%) | 0 (0.0%) |
| Total | 1,052 (100.0%) | 551 (100.0%) |
Physical Housing Characteristics in Crystal River
Housing Structures in Crystal River
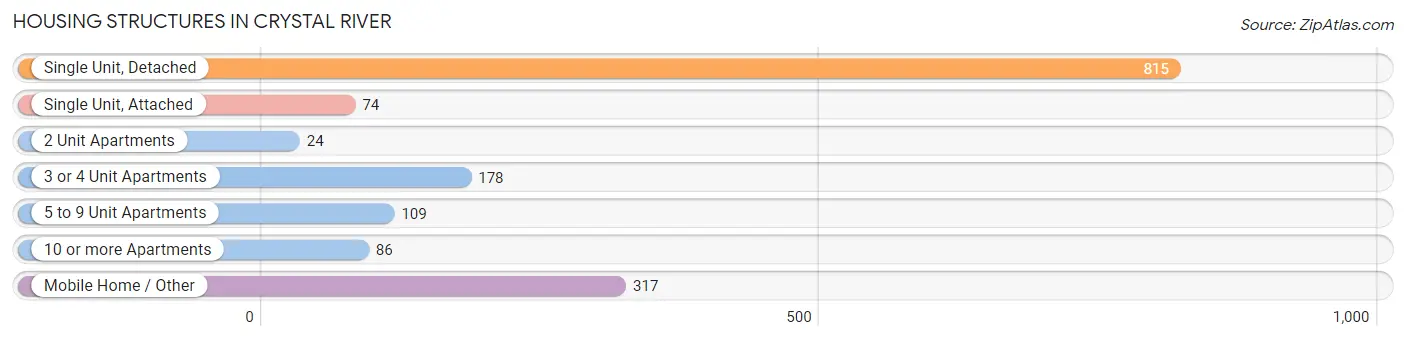
| Structure Type | # Housing Units | % Housing Units |
| Single Unit, Detached | 815 | 50.8% |
| Single Unit, Attached | 74 | 4.6% |
| 2 Unit Apartments | 24 | 1.5% |
| 3 or 4 Unit Apartments | 178 | 11.1% |
| 5 to 9 Unit Apartments | 109 | 6.8% |
| 10 or more Apartments | 86 | 5.4% |
| Mobile Home / Other | 317 | 19.8% |
| Total | 1,603 | 100.0% |
Housing Structures by Occupancy in Crystal River
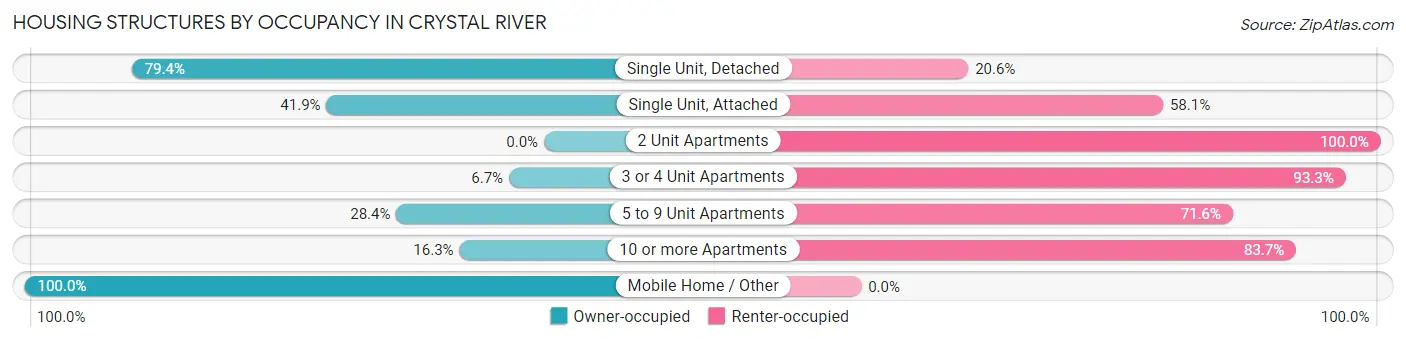
| Structure Type | Owner-occupied | Renter-occupied |
| Single Unit, Detached | 647 (79.4%) | 168 (20.6%) |
| Single Unit, Attached | 31 (41.9%) | 43 (58.1%) |
| 2 Unit Apartments | 0 (0.0%) | 24 (100.0%) |
| 3 or 4 Unit Apartments | 12 (6.7%) | 166 (93.3%) |
| 5 to 9 Unit Apartments | 31 (28.4%) | 78 (71.6%) |
| 10 or more Apartments | 14 (16.3%) | 72 (83.7%) |
| Mobile Home / Other | 317 (100.0%) | 0 (0.0%) |
| Total | 1,052 (65.6%) | 551 (34.4%) |
Housing Structures by Number of Rooms in Crystal River
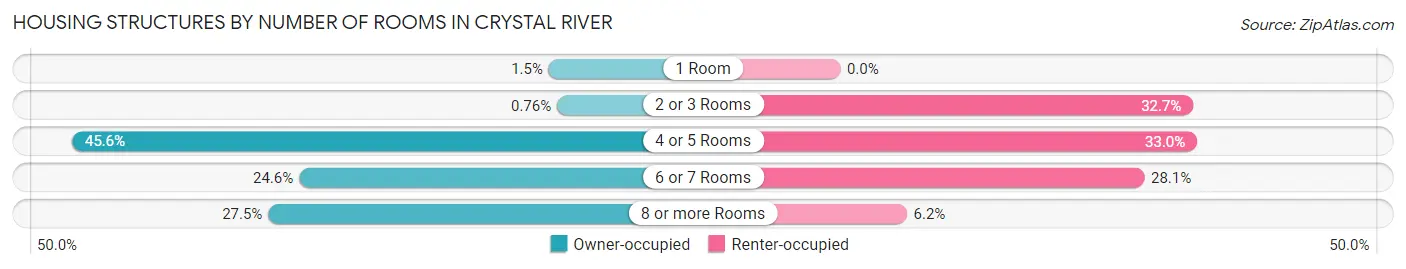
| Number of Rooms | Owner-occupied | Renter-occupied |
| 1 Room | 16 (1.5%) | 0 (0.0%) |
| 2 or 3 Rooms | 8 (0.8%) | 180 (32.7%) |
| 4 or 5 Rooms | 480 (45.6%) | 182 (33.0%) |
| 6 or 7 Rooms | 259 (24.6%) | 155 (28.1%) |
| 8 or more Rooms | 289 (27.5%) | 34 (6.2%) |
| Total | 1,052 (100.0%) | 551 (100.0%) |
Housing Structure by Heating Type in Crystal River
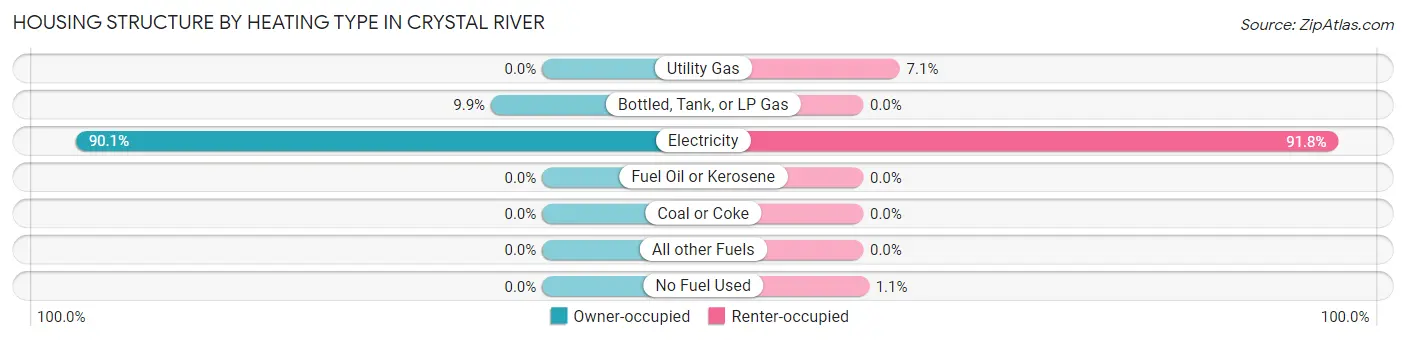
| Heating Type | Owner-occupied | Renter-occupied |
| Utility Gas | 0 (0.0%) | 39 (7.1%) |
| Bottled, Tank, or LP Gas | 104 (9.9%) | 0 (0.0%) |
| Electricity | 948 (90.1%) | 506 (91.8%) |
| Fuel Oil or Kerosene | 0 (0.0%) | 0 (0.0%) |
| Coal or Coke | 0 (0.0%) | 0 (0.0%) |
| All other Fuels | 0 (0.0%) | 0 (0.0%) |
| No Fuel Used | 0 (0.0%) | 6 (1.1%) |
| Total | 1,052 (100.0%) | 551 (100.0%) |
Household Vehicle Usage in Crystal River
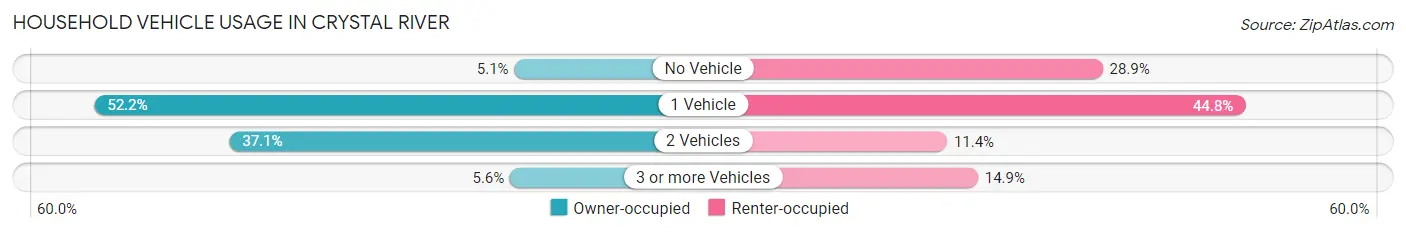
| Vehicles per Household | Owner-occupied | Renter-occupied |
| No Vehicle | 54 (5.1%) | 159 (28.9%) |
| 1 Vehicle | 549 (52.2%) | 247 (44.8%) |
| 2 Vehicles | 390 (37.1%) | 63 (11.4%) |
| 3 or more Vehicles | 59 (5.6%) | 82 (14.9%) |
| Total | 1,052 (100.0%) | 551 (100.0%) |
Real Estate & Mortgages in Crystal River
Real Estate and Mortgage Overview in Crystal River
| Characteristic | Without Mortgage | With Mortgage |
| Housing Units | 709 | 343 |
| Median Property Value | - | - |
| Median Household Income | $51,094 | $63 |
| Monthly Housing Costs | $488 | $12 |
| Real Estate Taxes | - | - |
Property Value by Mortgage Status in Crystal River
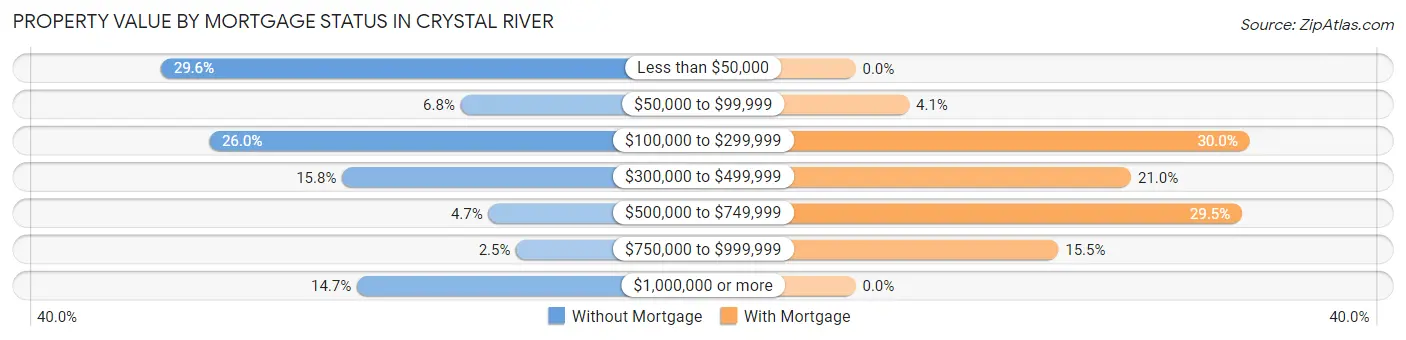
| Property Value | Without Mortgage | With Mortgage |
| Less than $50,000 | 210 (29.6%) | 0 (0.0%) |
| $50,000 to $99,999 | 48 (6.8%) | 14 (4.1%) |
| $100,000 to $299,999 | 184 (26.0%) | 103 (30.0%) |
| $300,000 to $499,999 | 112 (15.8%) | 72 (21.0%) |
| $500,000 to $749,999 | 33 (4.6%) | 101 (29.4%) |
| $750,000 to $999,999 | 18 (2.5%) | 53 (15.4%) |
| $1,000,000 or more | 104 (14.7%) | 0 (0.0%) |
| Total | 709 (100.0%) | 343 (100.0%) |
Household Income by Mortgage Status in Crystal River
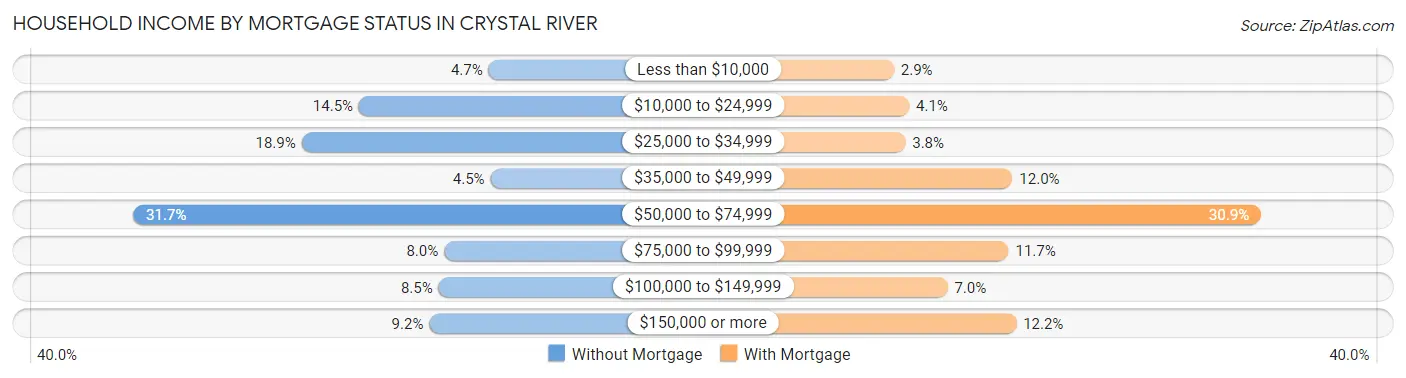
| Household Income | Without Mortgage | With Mortgage |
| Less than $10,000 | 33 (4.6%) | 10 (2.9%) |
| $10,000 to $24,999 | 103 (14.5%) | 14 (4.1%) |
| $25,000 to $34,999 | 134 (18.9%) | 13 (3.8%) |
| $35,000 to $49,999 | 32 (4.5%) | 41 (11.9%) |
| $50,000 to $74,999 | 225 (31.7%) | 106 (30.9%) |
| $75,000 to $99,999 | 57 (8.0%) | 40 (11.7%) |
| $100,000 to $149,999 | 60 (8.5%) | 24 (7.0%) |
| $150,000 or more | 65 (9.2%) | 42 (12.2%) |
| Total | 709 (100.0%) | 343 (100.0%) |
Property Value to Household Income Ratio in Crystal River
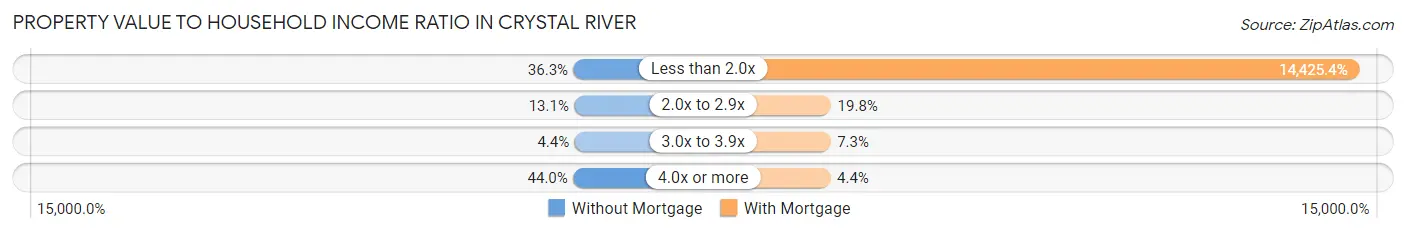
| Value-to-Income Ratio | Without Mortgage | With Mortgage |
| Less than 2.0x | 257 (36.2%) | 49,479 (14,425.4%) |
| 2.0x to 2.9x | 93 (13.1%) | 68 (19.8%) |
| 3.0x to 3.9x | 31 (4.4%) | 25 (7.3%) |
| 4.0x or more | 312 (44.0%) | 15 (4.4%) |
| Total | 709 (100.0%) | 343 (100.0%) |
Real Estate Taxes by Mortgage Status in Crystal River
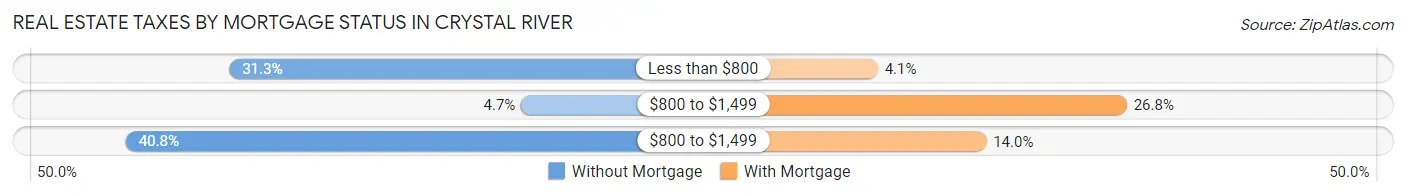
| Property Taxes | Without Mortgage | With Mortgage |
| Less than $800 | 222 (31.3%) | 14 (4.1%) |
| $800 to $1,499 | 33 (4.6%) | 92 (26.8%) |
| $800 to $1,499 | 289 (40.8%) | 48 (14.0%) |
| Total | 709 (100.0%) | 343 (100.0%) |
Health & Disability in Crystal River
Health Insurance Coverage by Age in Crystal River
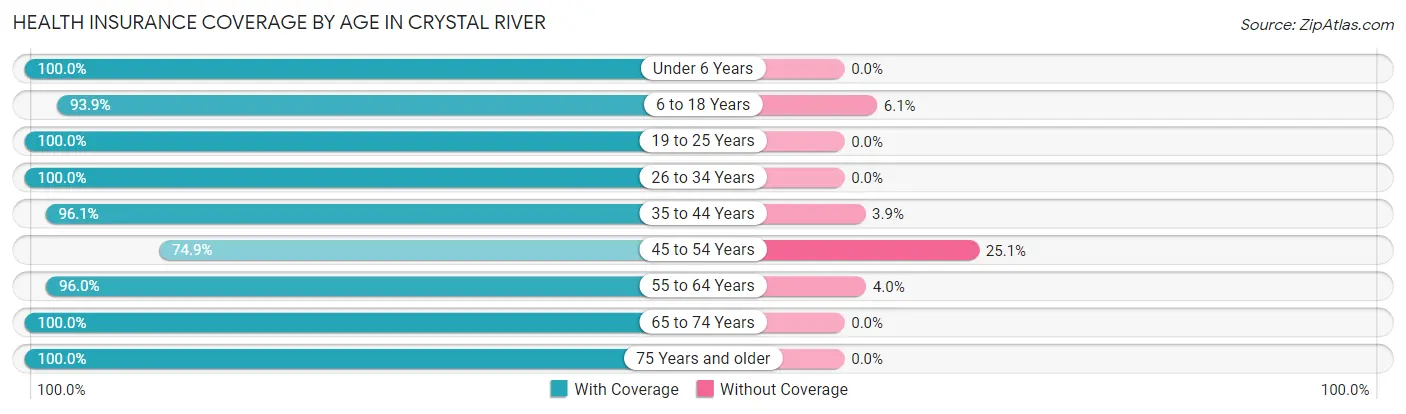
| Age Bracket | With Coverage | Without Coverage |
| Under 6 Years | 96 (100.0%) | 0 (0.0%) |
| 6 to 18 Years | 263 (93.9%) | 17 (6.1%) |
| 19 to 25 Years | 122 (100.0%) | 0 (0.0%) |
| 26 to 34 Years | 241 (100.0%) | 0 (0.0%) |
| 35 to 44 Years | 173 (96.1%) | 7 (3.9%) |
| 45 to 54 Years | 194 (74.9%) | 65 (25.1%) |
| 55 to 64 Years | 524 (96.0%) | 22 (4.0%) |
| 65 to 74 Years | 563 (100.0%) | 0 (0.0%) |
| 75 Years and older | 767 (100.0%) | 0 (0.0%) |
| Total | 2,943 (96.4%) | 111 (3.6%) |
Health Insurance Coverage by Citizenship Status in Crystal River
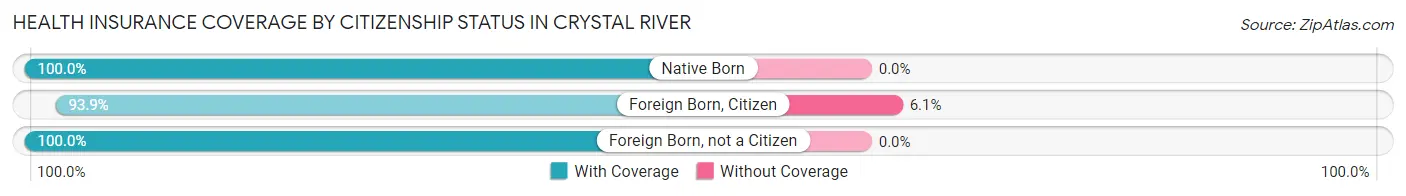
| Citizenship Status | With Coverage | Without Coverage |
| Native Born | 96 (100.0%) | 0 (0.0%) |
| Foreign Born, Citizen | 263 (93.9%) | 17 (6.1%) |
| Foreign Born, not a Citizen | 122 (100.0%) | 0 (0.0%) |
Health Insurance Coverage by Household Income in Crystal River
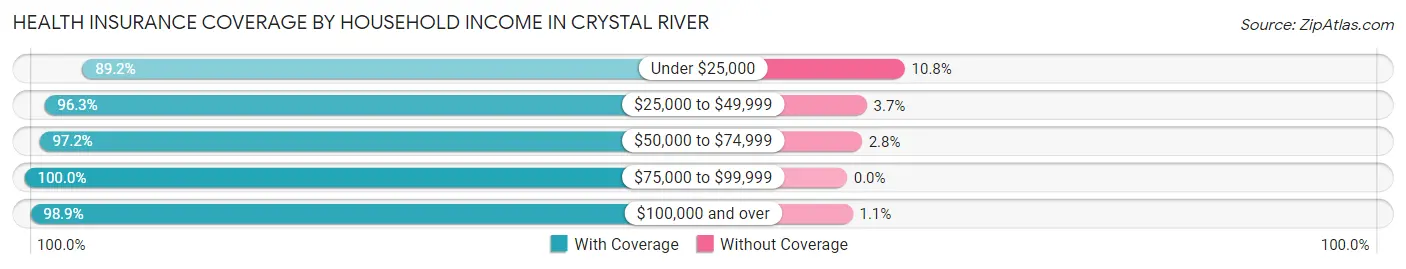
| Household Income | With Coverage | Without Coverage |
| Under $25,000 | 420 (89.2%) | 51 (10.8%) |
| $25,000 to $49,999 | 1,011 (96.3%) | 39 (3.7%) |
| $50,000 to $74,999 | 488 (97.2%) | 14 (2.8%) |
| $75,000 to $99,999 | 364 (100.0%) | 0 (0.0%) |
| $100,000 and over | 650 (98.9%) | 7 (1.1%) |
Public vs Private Health Insurance Coverage by Age in Crystal River
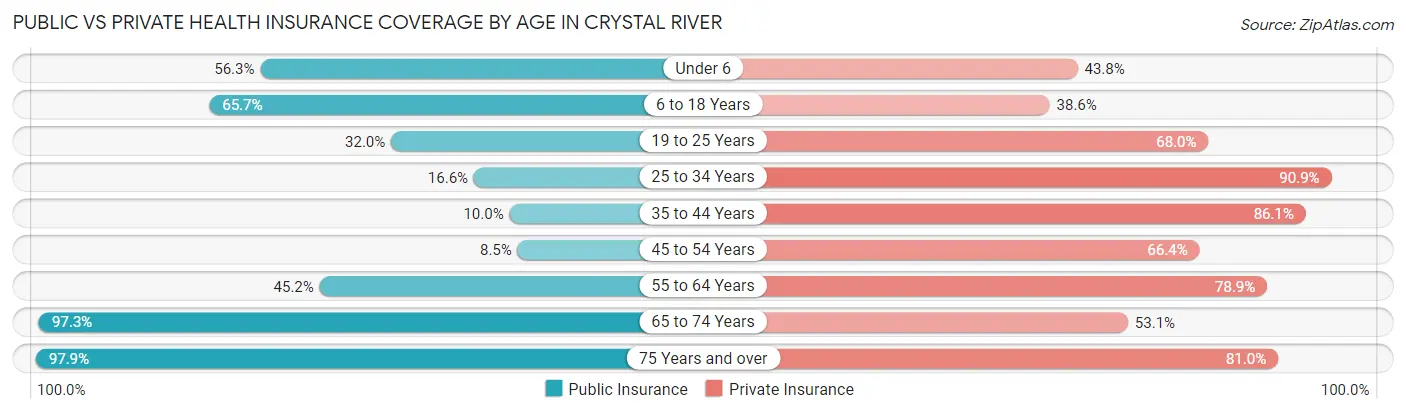
| Age Bracket | Public Insurance | Private Insurance |
| Under 6 | 54 (56.2%) | 42 (43.8%) |
| 6 to 18 Years | 184 (65.7%) | 108 (38.6%) |
| 19 to 25 Years | 39 (32.0%) | 83 (68.0%) |
| 25 to 34 Years | 40 (16.6%) | 219 (90.9%) |
| 35 to 44 Years | 18 (10.0%) | 155 (86.1%) |
| 45 to 54 Years | 22 (8.5%) | 172 (66.4%) |
| 55 to 64 Years | 247 (45.2%) | 431 (78.9%) |
| 65 to 74 Years | 548 (97.3%) | 299 (53.1%) |
| 75 Years and over | 751 (97.9%) | 621 (81.0%) |
| Total | 1,903 (62.3%) | 2,130 (69.7%) |
Disability Status by Sex by Age in Crystal River
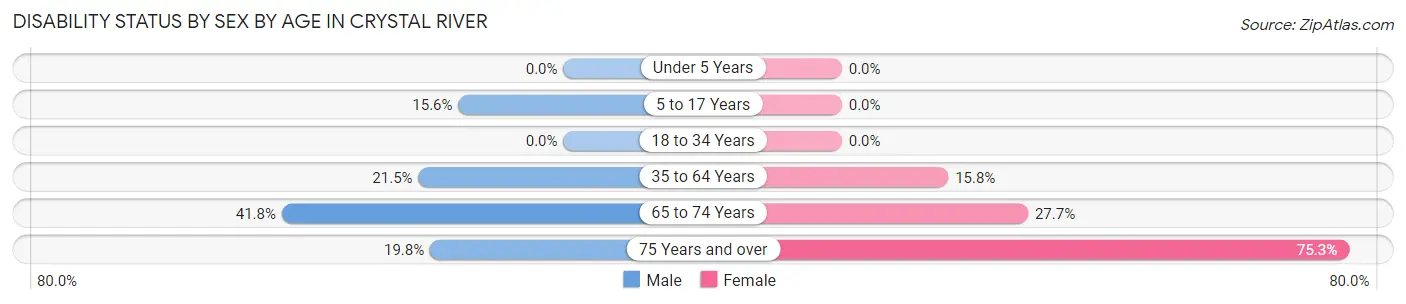
| Age Bracket | Male | Female |
| Under 5 Years | 0 (0.0%) | 0 (0.0%) |
| 5 to 17 Years | 29 (15.6%) | 0 (0.0%) |
| 18 to 34 Years | 0 (0.0%) | 0 (0.0%) |
| 35 to 64 Years | 88 (21.5%) | 91 (15.8%) |
| 65 to 74 Years | 125 (41.8%) | 73 (27.7%) |
| 75 Years and over | 74 (19.8%) | 296 (75.3%) |
Disability Class by Sex by Age in Crystal River
Disability Class: Hearing Difficulty
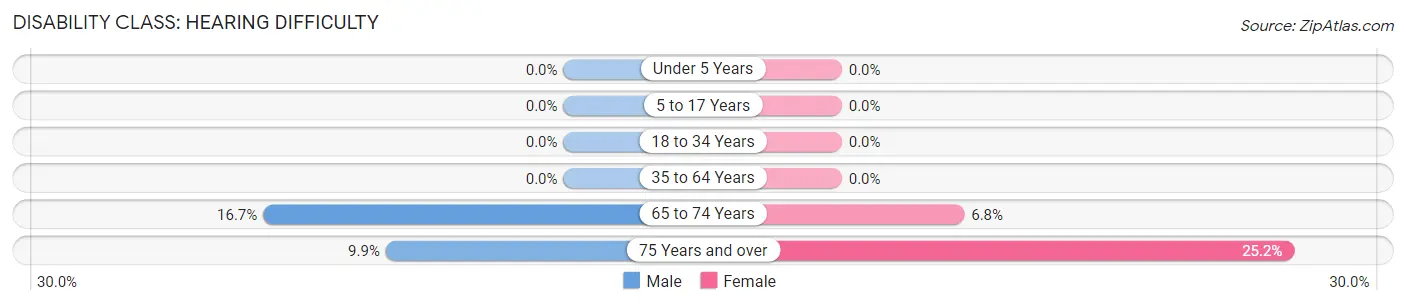
| Age Bracket | Male | Female |
| Under 5 Years | 0 (0.0%) | 0 (0.0%) |
| 5 to 17 Years | 0 (0.0%) | 0 (0.0%) |
| 18 to 34 Years | 0 (0.0%) | 0 (0.0%) |
| 35 to 64 Years | 0 (0.0%) | 0 (0.0%) |
| 65 to 74 Years | 50 (16.7%) | 18 (6.8%) |
| 75 Years and over | 37 (9.9%) | 99 (25.2%) |
Disability Class: Vision Difficulty
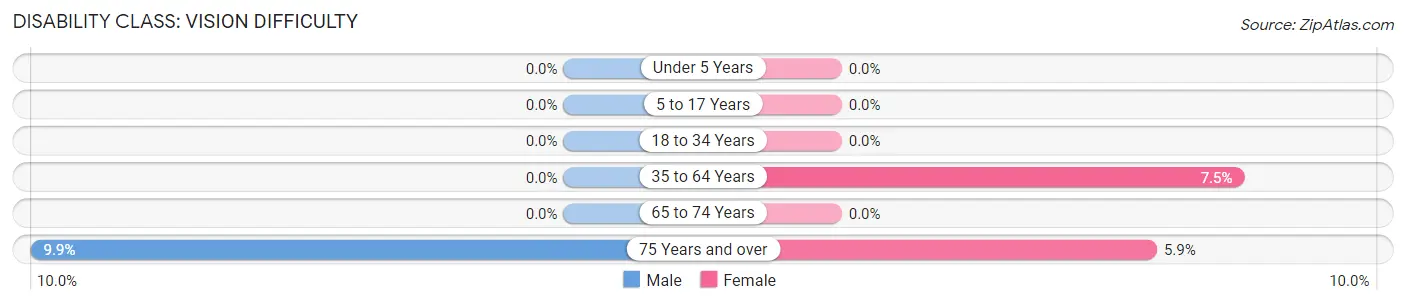
| Age Bracket | Male | Female |
| Under 5 Years | 0 (0.0%) | 0 (0.0%) |
| 5 to 17 Years | 0 (0.0%) | 0 (0.0%) |
| 18 to 34 Years | 0 (0.0%) | 0 (0.0%) |
| 35 to 64 Years | 0 (0.0%) | 43 (7.5%) |
| 65 to 74 Years | 0 (0.0%) | 0 (0.0%) |
| 75 Years and over | 37 (9.9%) | 23 (5.9%) |
Disability Class: Cognitive Difficulty
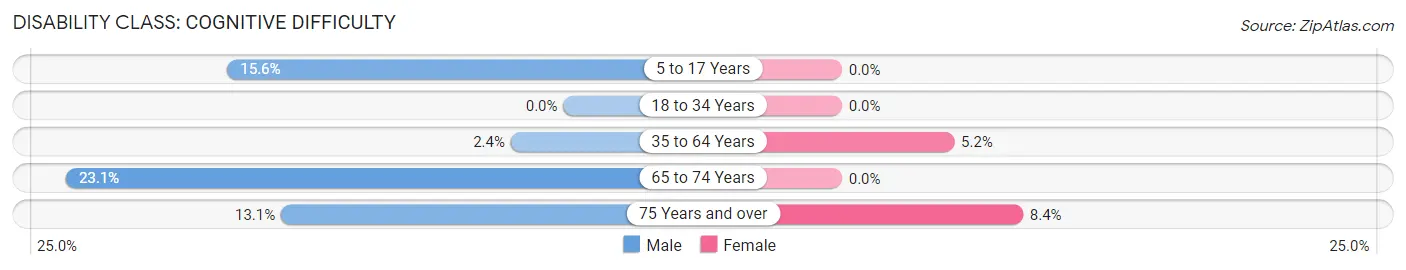
| Age Bracket | Male | Female |
| 5 to 17 Years | 29 (15.6%) | 0 (0.0%) |
| 18 to 34 Years | 0 (0.0%) | 0 (0.0%) |
| 35 to 64 Years | 10 (2.4%) | 30 (5.2%) |
| 65 to 74 Years | 69 (23.1%) | 0 (0.0%) |
| 75 Years and over | 49 (13.1%) | 33 (8.4%) |
Disability Class: Ambulatory Difficulty
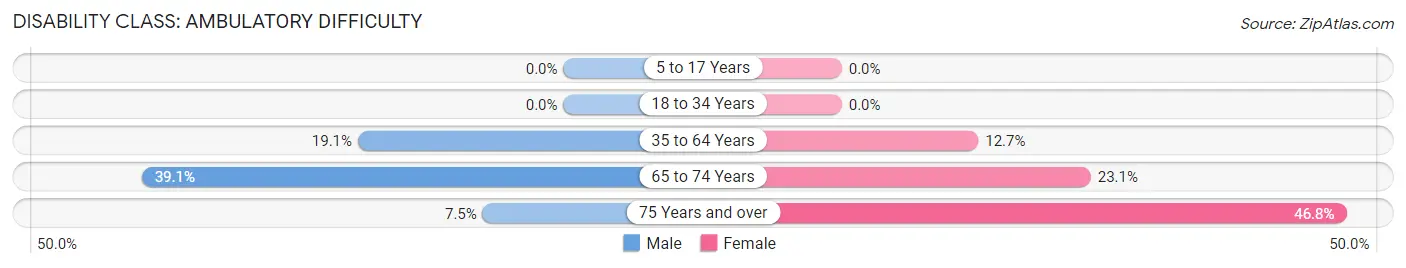
| Age Bracket | Male | Female |
| 5 to 17 Years | 0 (0.0%) | 0 (0.0%) |
| 18 to 34 Years | 0 (0.0%) | 0 (0.0%) |
| 35 to 64 Years | 78 (19.1%) | 73 (12.7%) |
| 65 to 74 Years | 117 (39.1%) | 61 (23.1%) |
| 75 Years and over | 28 (7.5%) | 184 (46.8%) |
Disability Class: Self-Care Difficulty
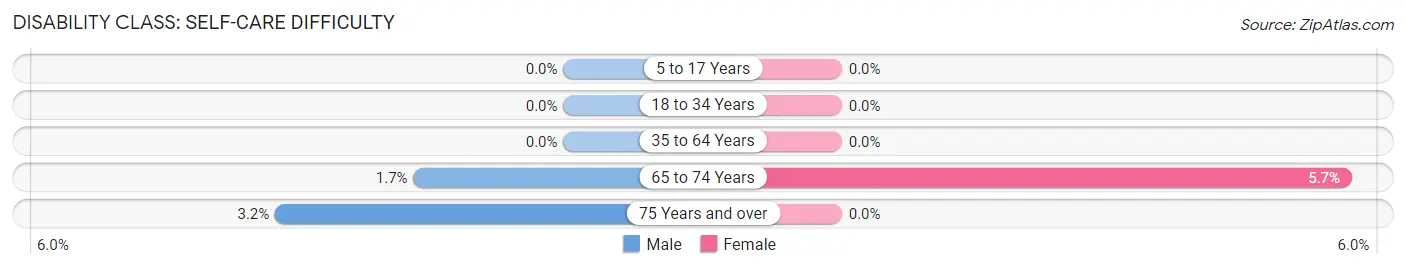
| Age Bracket | Male | Female |
| 5 to 17 Years | 0 (0.0%) | 0 (0.0%) |
| 18 to 34 Years | 0 (0.0%) | 0 (0.0%) |
| 35 to 64 Years | 0 (0.0%) | 0 (0.0%) |
| 65 to 74 Years | 5 (1.7%) | 15 (5.7%) |
| 75 Years and over | 12 (3.2%) | 0 (0.0%) |
Technology Access in Crystal River
Computing Device Access in Crystal River
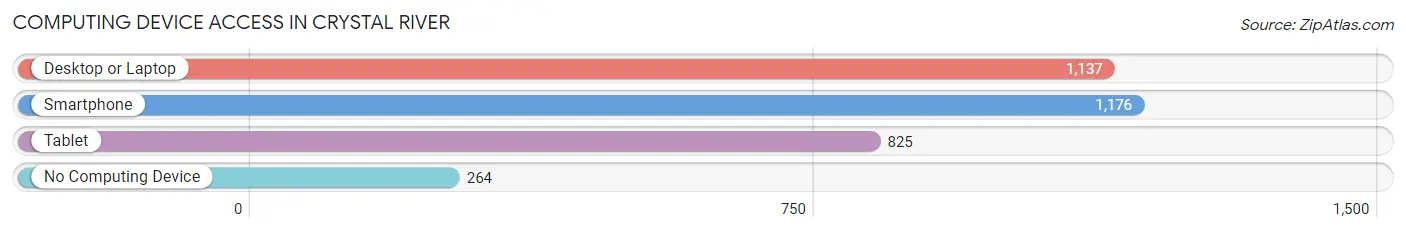
| Device Type | # Households | % Households |
| Desktop or Laptop | 1,137 | 70.9% |
| Smartphone | 1,176 | 73.4% |
| Tablet | 825 | 51.5% |
| No Computing Device | 264 | 16.5% |
| Total | 1,603 | 100.0% |
Internet Access in Crystal River
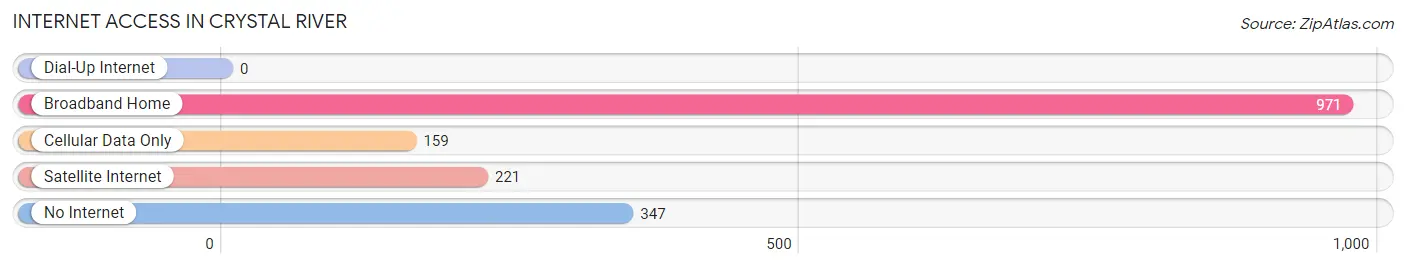
| Internet Type | # Households | % Households |
| Dial-Up Internet | 0 | 0.0% |
| Broadband Home | 971 | 60.6% |
| Cellular Data Only | 159 | 9.9% |
| Satellite Internet | 221 | 13.8% |
| No Internet | 347 | 21.6% |
| Total | 1,603 | 100.0% |
Crystal River Summary
Introduction
Crystal River is a city located in Citrus County, Florida, United States. It is located on the Gulf of Mexico, approximately 80 miles north of Tampa. The city is known for its natural springs, which attract tourists from all over the world. The city has a population of 3,108 as of the 2010 census.
History
The area that is now Crystal River was originally inhabited by the Timucua Indians. The first European settlers arrived in the area in the late 1700s. The city was officially founded in 1845 and was named after the Crystal River, which flows through the city.
In the late 1800s, the city became a popular tourist destination due to its natural springs. The springs were believed to have healing properties and were used by the locals for medicinal purposes. The city was also known for its fishing and oyster harvesting.
In the early 1900s, the city began to grow and develop. The first hotel was built in 1912 and the first bridge was built in 1915. The city was incorporated in 1923 and the first mayor was elected in 1924.
Geography
Crystal River is located in Citrus County, Florida, on the Gulf of Mexico. The city is situated on the Crystal River, which flows through the city. The city is surrounded by the Chassahowitzka National Wildlife Refuge and the Crystal River National Wildlife Refuge.
The city has a total area of 4.2 square miles, of which 3.9 square miles is land and 0.3 square miles is water. The city has a humid subtropical climate, with hot, humid summers and mild winters.
Economy
The economy of Crystal River is largely based on tourism. The city is known for its natural springs, which attract tourists from all over the world. The city is also home to several fishing charters, which offer deep sea fishing trips.
The city is also home to several manufacturing companies, including a paper mill and a plastics factory. The city is also home to several retail stores, restaurants, and other businesses.
Demographics
As of the 2010 census, the population of Crystal River was 3,108. The racial makeup of the city was 94.3% White, 2.2% African American, 0.7% Native American, 0.4% Asian, 0.1% Pacific Islander, 0.9% from other races, and 1.4% from two or more races. Hispanic or Latino of any race were 4.2% of the population.
The median income for a household in the city was $31,250, and the median income for a family was $37,500. The per capita income for the city was $17,845. About 15.2% of families and 18.2% of the population were below the poverty line, including 25.2% of those under age 18 and 8.3% of those age 65 or over.
Conclusion
Crystal River is a city located in Citrus County, Florida, United States. It is located on the Gulf of Mexico, approximately 80 miles north of Tampa. The city is known for its natural springs, which attract tourists from all over the world. The city has a population of 3,108 as of the 2010 census. The economy of Crystal River is largely based on tourism, with fishing charters, manufacturing companies, retail stores, restaurants, and other businesses. The racial makeup of the city was 94.3% White, 2.2% African American, 0.7% Native American, 0.4% Asian, 0.1% Pacific Islander, 0.9% from other races, and 1.4% from two or more races. The median income for a household in the city was $31,250, and the median income for a family was $37,500.
Common Questions
What is the Total Population of Crystal River?
Total Population of Crystal River is 3,398.
What is the Total Male Population of Crystal River?
Total Male Population of Crystal River is 1,698.
What is the Total Female Population of Crystal River?
Total Female Population of Crystal River is 1,700.
What is the Ratio of Males per 100 Females in Crystal River?
There are 99.88 Males per 100 Females in Crystal River.
What is the Ratio of Females per 100 Males in Crystal River?
There are 100.12 Females per 100 Males in Crystal River.
What is the Median Population Age in Crystal River?
Median Population Age in Crystal River is 64.1 Years.
What is the Average Family Size in Crystal River
Average Family Size in Crystal River is 2.6 People.
What is the Average Household Size in Crystal River
Average Household Size in Crystal River is 1.9 People.
What is Per Capita Income in Crystal River?
Per Capita income in Crystal River is $32,842.
What is the Median Family Income in Crystal River?
Median Family Income in Crystal River is $52,408.
What is the Median Household income in Crystal River?
Median Household Income in Crystal River is $46,795.
What is Income or Wage Gap in Crystal River?
Income or Wage Gap in Crystal River is 24.6%.
Women in Crystal River earn 75.4 cents for every dollar earned by a man.
What is Family Income Deficit in Crystal River?
Family Income Deficit in Crystal River is $7,078.
Families that are below poverty line in Crystal River earn $7,078 less on average than the poverty threshold level.
What is Inequality or Gini Index in Crystal River?
Inequality or Gini Index in Crystal River is 0.49.
How Large is the Labor Force in Crystal River?
There are 991 People in the Labor Forcein in Crystal River.
What is the Percentage of People in the Labor Force in Crystal River?
32.8% of People are in the Labor Force in Crystal River.
What is the Unemployment Rate in Crystal River?
Unemployment Rate in Crystal River is 11.0%.