Clarcona, FL
Clarcona Map
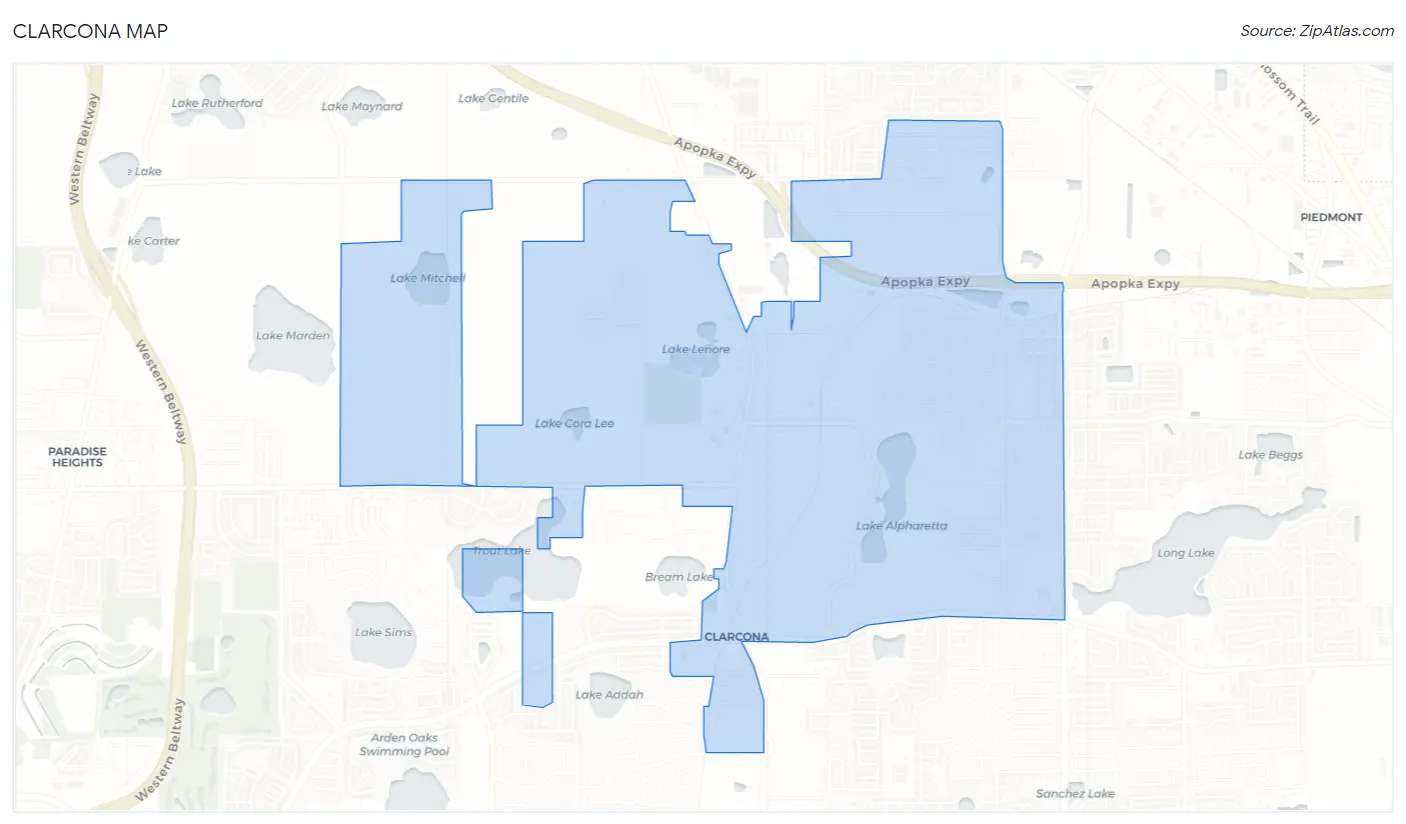
Clarcona Overview
4,128
TOTAL POPULATION
1,719
MALE POPULATION
2,409
FEMALE POPULATION
71.36
MALES / 100 FEMALES
140.14
FEMALES / 100 MALES
39.5
MEDIAN AGE
3.6
AVG FAMILY SIZE
2.7
AVG HOUSEHOLD SIZE
$28,744
PER CAPITA INCOME
$60,375
AVG FAMILY INCOME
$38,154
AVG HOUSEHOLD INCOME
24.3%
WAGE / INCOME GAP [ % ]
75.7¢/ $1
WAGE / INCOME GAP [ $ ]
0.60
INEQUALITY / GINI INDEX
1,500
LABOR FORCE [ PEOPLE ]
48.3%
PERCENT IN LABOR FORCE
1.3%
UNEMPLOYMENT RATE
Clarcona Area Codes
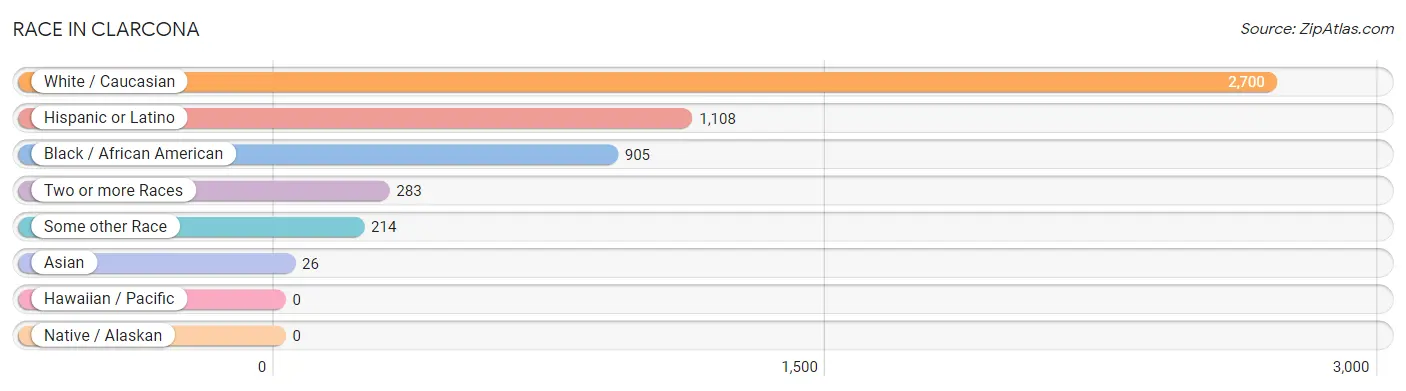
Race in Clarcona
The most populous races in Clarcona are White / Caucasian (2,700 | 65.4%), Hispanic or Latino (1,108 | 26.8%), and Black / African American (905 | 21.9%).
| Race | # Population | % Population |
| Asian | 26 | 0.6% |
| Black / African American | 905 | 21.9% |
| Hawaiian / Pacific | 0 | 0.0% |
| Hispanic or Latino | 1,108 | 26.8% |
| Native / Alaskan | 0 | 0.0% |
| White / Caucasian | 2,700 | 65.4% |
| Two or more Races | 283 | 6.9% |
| Some other Race | 214 | 5.2% |
| Total | 4,128 | 100.0% |
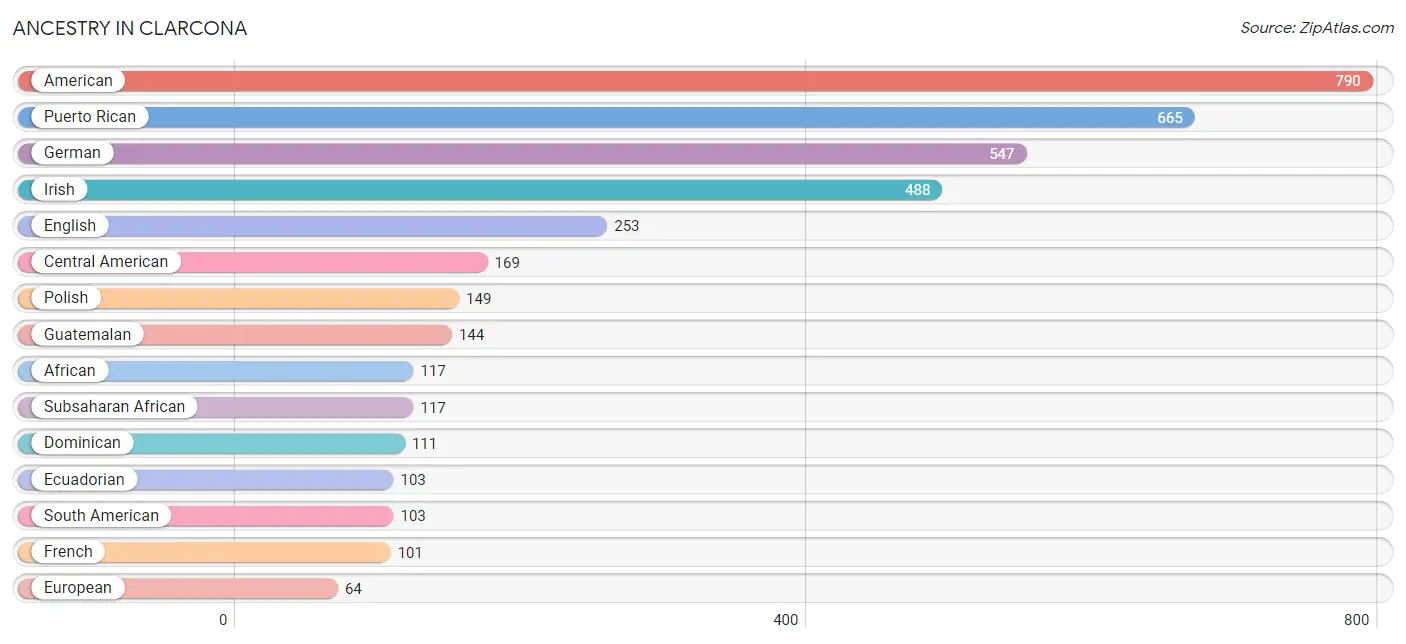
Ancestry in Clarcona
The most populous ancestries reported in Clarcona are American (790 | 19.1%), Puerto Rican (665 | 16.1%), German (547 | 13.3%), Irish (488 | 11.8%), and English (253 | 6.1%), together accounting for 66.4% of all Clarcona residents.
| Ancestry | # Population | % Population |
| African | 117 | 2.8% |
| American | 790 | 19.1% |
| Belgian | 10 | 0.2% |
| Central American | 169 | 4.1% |
| Dominican | 111 | 2.7% |
| Ecuadorian | 103 | 2.5% |
| English | 253 | 6.1% |
| European | 64 | 1.5% |
| French | 101 | 2.5% |
| German | 547 | 13.3% |
| Guatemalan | 144 | 3.5% |
| Guyanese | 24 | 0.6% |
| Haitian | 60 | 1.5% |
| Honduran | 25 | 0.6% |
| Irish | 488 | 11.8% |
| Italian | 38 | 0.9% |
| Mexican | 12 | 0.3% |
| Polish | 149 | 3.6% |
| Puerto Rican | 665 | 16.1% |
| Scottish | 8 | 0.2% |
| South American | 103 | 2.5% |
| Spaniard | 48 | 1.2% |
| Sri Lankan | 34 | 0.8% |
| Subsaharan African | 117 | 2.8% |
| Swedish | 32 | 0.8% |
| Thai | 24 | 0.6% |
| Ukrainian | 12 | 0.3% | View All 27 Rows |
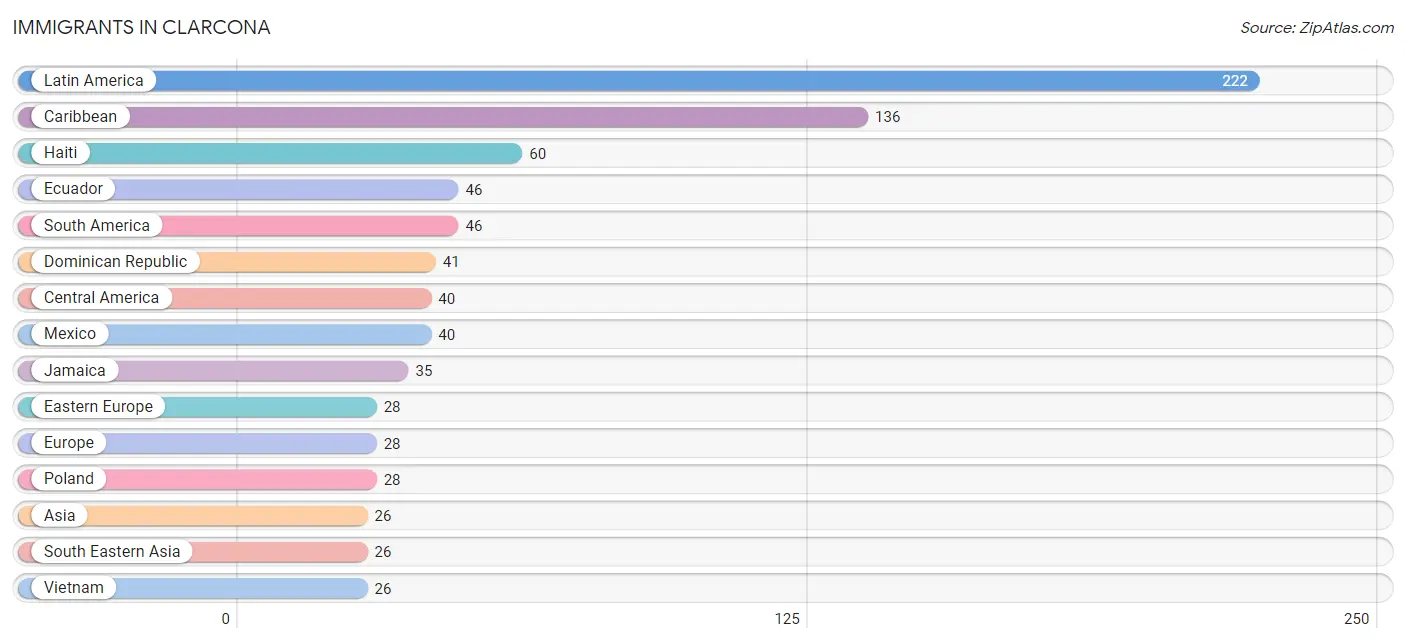
Immigrants in Clarcona
The most numerous immigrant groups reported in Clarcona came from Latin America (222 | 5.4%), Caribbean (136 | 3.3%), Haiti (60 | 1.5%), Ecuador (46 | 1.1%), and South America (46 | 1.1%), together accounting for 12.3% of all Clarcona residents.
| Immigration Origin | # Population | % Population |
| Asia | 26 | 0.6% |
| Canada | 10 | 0.2% |
| Caribbean | 136 | 3.3% |
| Central America | 40 | 1.0% |
| Dominican Republic | 41 | 1.0% |
| Eastern Europe | 28 | 0.7% |
| Ecuador | 46 | 1.1% |
| Europe | 28 | 0.7% |
| Haiti | 60 | 1.5% |
| Jamaica | 35 | 0.9% |
| Latin America | 222 | 5.4% |
| Mexico | 40 | 1.0% |
| Poland | 28 | 0.7% |
| South America | 46 | 1.1% |
| South Eastern Asia | 26 | 0.6% |
| Vietnam | 26 | 0.6% | View All 16 Rows |
Sex and Age in Clarcona
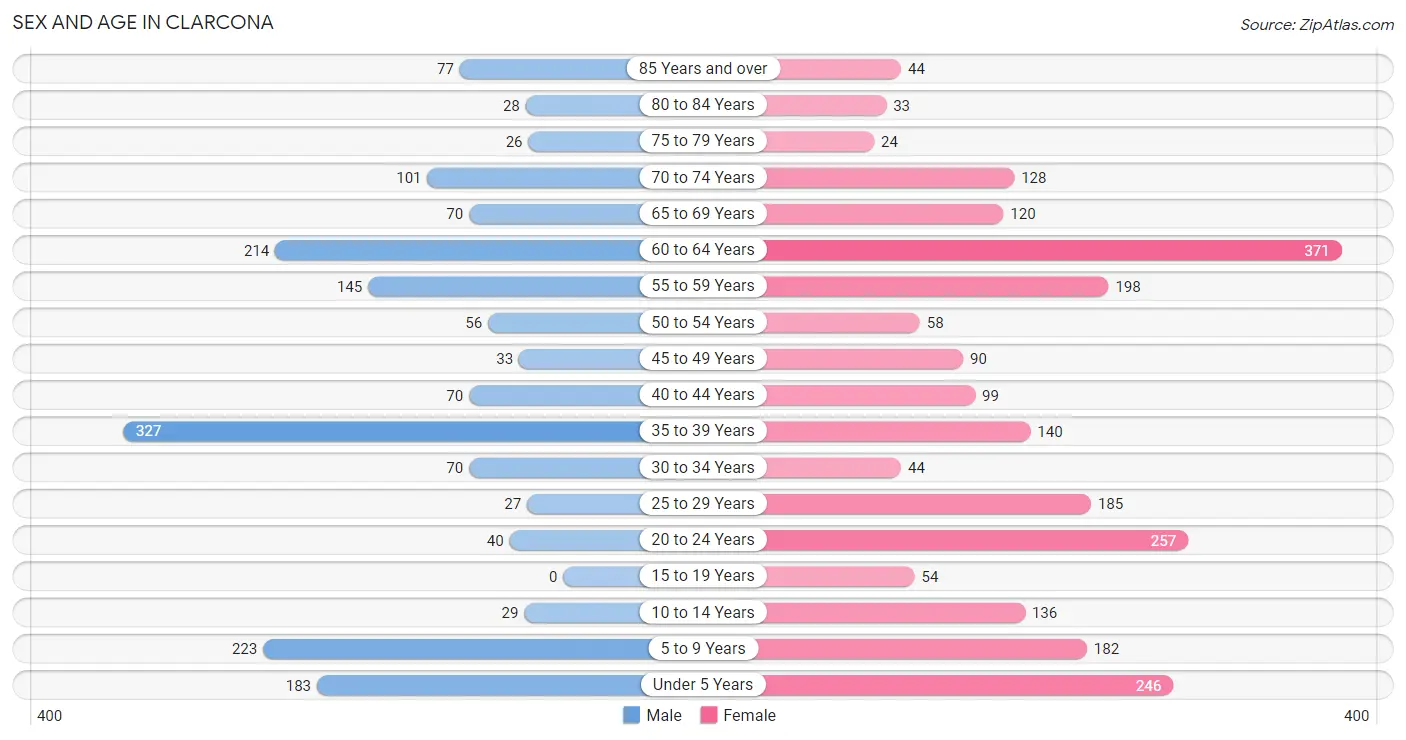
Sex and Age in Clarcona
The most populous age groups in Clarcona are 35 to 39 Years (327 | 19.0%) for men and 60 to 64 Years (371 | 15.4%) for women.
| Age Bracket | Male | Female |
| Under 5 Years | 183 (10.6%) | 246 (10.2%) |
| 5 to 9 Years | 223 (13.0%) | 182 (7.6%) |
| 10 to 14 Years | 29 (1.7%) | 136 (5.7%) |
| 15 to 19 Years | 0 (0.0%) | 54 (2.2%) |
| 20 to 24 Years | 40 (2.3%) | 257 (10.7%) |
| 25 to 29 Years | 27 (1.6%) | 185 (7.7%) |
| 30 to 34 Years | 70 (4.1%) | 44 (1.8%) |
| 35 to 39 Years | 327 (19.0%) | 140 (5.8%) |
| 40 to 44 Years | 70 (4.1%) | 99 (4.1%) |
| 45 to 49 Years | 33 (1.9%) | 90 (3.7%) |
| 50 to 54 Years | 56 (3.3%) | 58 (2.4%) |
| 55 to 59 Years | 145 (8.4%) | 198 (8.2%) |
| 60 to 64 Years | 214 (12.4%) | 371 (15.4%) |
| 65 to 69 Years | 70 (4.1%) | 120 (5.0%) |
| 70 to 74 Years | 101 (5.9%) | 128 (5.3%) |
| 75 to 79 Years | 26 (1.5%) | 24 (1.0%) |
| 80 to 84 Years | 28 (1.6%) | 33 (1.4%) |
| 85 Years and over | 77 (4.5%) | 44 (1.8%) |
| Total | 1,719 (100.0%) | 2,409 (100.0%) |
Families and Households in Clarcona
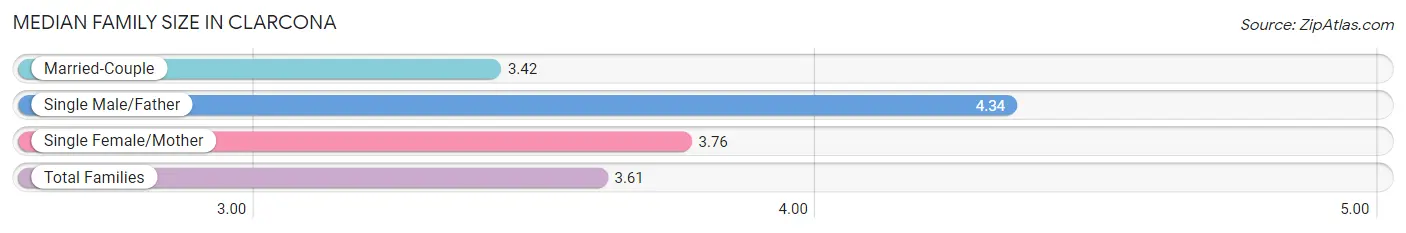
Median Family Size in Clarcona
The median family size in Clarcona is 3.61 persons per family, with single male/father families (122 | 12.8%) accounting for the largest median family size of 4.34 persons per family. On the other hand, married-couple families (648 | 68.2%) represent the smallest median family size with 3.42 persons per family.
| Family Type | # Families | Family Size |
| Married-Couple | 648 (68.2%) | 3.42 |
| Single Male/Father | 122 (12.8%) | 4.34 |
| Single Female/Mother | 180 (19.0%) | 3.76 |
| Total Families | 950 (100.0%) | 3.61 |
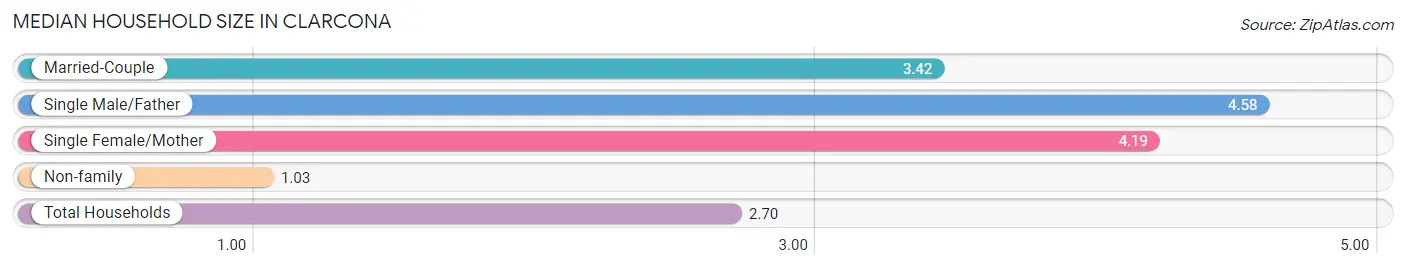
Median Household Size in Clarcona
The median household size in Clarcona is 2.70 persons per household, with single male/father households (122 | 8.0%) accounting for the largest median household size of 4.58 persons per household. non-family households (579 | 37.9%) represent the smallest median household size with 1.03 persons per household.
| Household Type | # Households | Household Size |
| Married-Couple | 648 (42.4%) | 3.42 |
| Single Male/Father | 122 (8.0%) | 4.58 |
| Single Female/Mother | 180 (11.8%) | 4.19 |
| Non-family | 579 (37.9%) | 1.03 |
| Total Households | 1,529 (100.0%) | 2.70 |
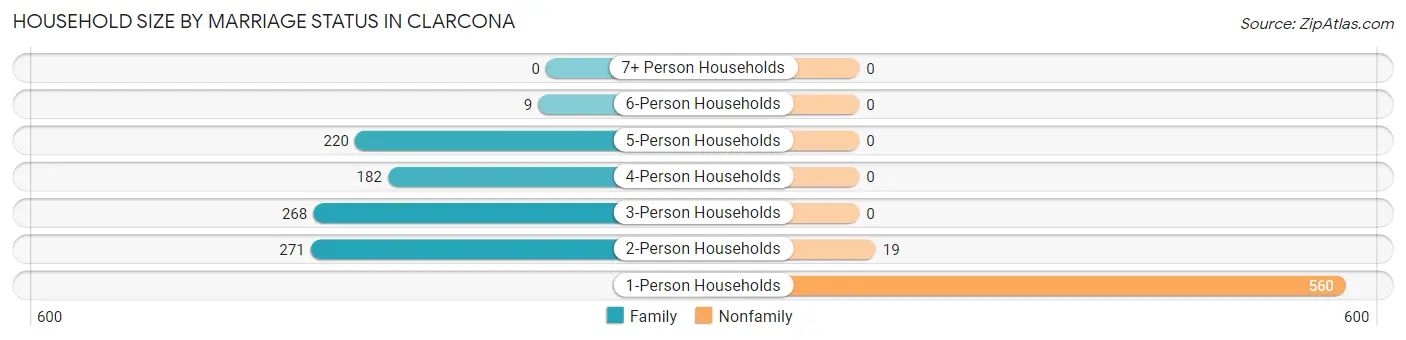
Household Size by Marriage Status in Clarcona
Out of a total of 1,529 households in Clarcona, 950 (62.1%) are family households, while 579 (37.9%) are nonfamily households. The most numerous type of family households are 2-person households, comprising 271, and the most common type of nonfamily households are 1-person households, comprising 560.
| Household Size | Family Households | Nonfamily Households |
| 1-Person Households | - | 560 (36.6%) |
| 2-Person Households | 271 (17.7%) | 19 (1.2%) |
| 3-Person Households | 268 (17.5%) | 0 (0.0%) |
| 4-Person Households | 182 (11.9%) | 0 (0.0%) |
| 5-Person Households | 220 (14.4%) | 0 (0.0%) |
| 6-Person Households | 9 (0.6%) | 0 (0.0%) |
| 7+ Person Households | 0 (0.0%) | 0 (0.0%) |
| Total | 950 (62.1%) | 579 (37.9%) |
Female Fertility in Clarcona
Fertility by Age in Clarcona
Average fertility rate in Clarcona is 57.0 births per 1,000 women. Women in the age bracket of 20 to 34 years have the highest fertility rate with 105.0 births per 1,000 women. Women in the age bracket of 20 to 34 years acount for 100.0% of all women with births.
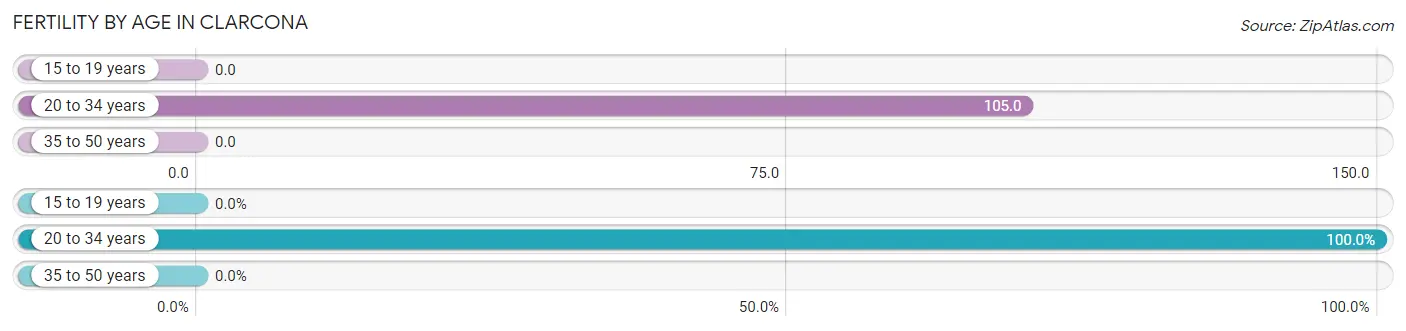
| Age Bracket | Women with Births | Births / 1,000 Women |
| 15 to 19 years | 0 (0.0%) | 0.0 |
| 20 to 34 years | 51 (100.0%) | 105.0 |
| 35 to 50 years | 0 (0.0%) | 0.0 |
| Total | 51 (100.0%) | 57.0 |
Fertility by Age by Marriage Status in Clarcona
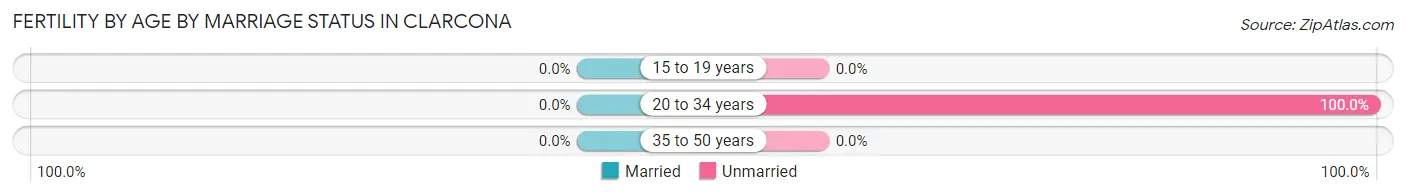
| Age Bracket | Married | Unmarried |
| 15 to 19 years | 0 (0.0%) | 0 (0.0%) |
| 20 to 34 years | 0 (0.0%) | 51 (100.0%) |
| 35 to 50 years | 0 (0.0%) | 0 (0.0%) |
| Total | 0 (0.0%) | 51 (100.0%) |
Fertility by Education in Clarcona
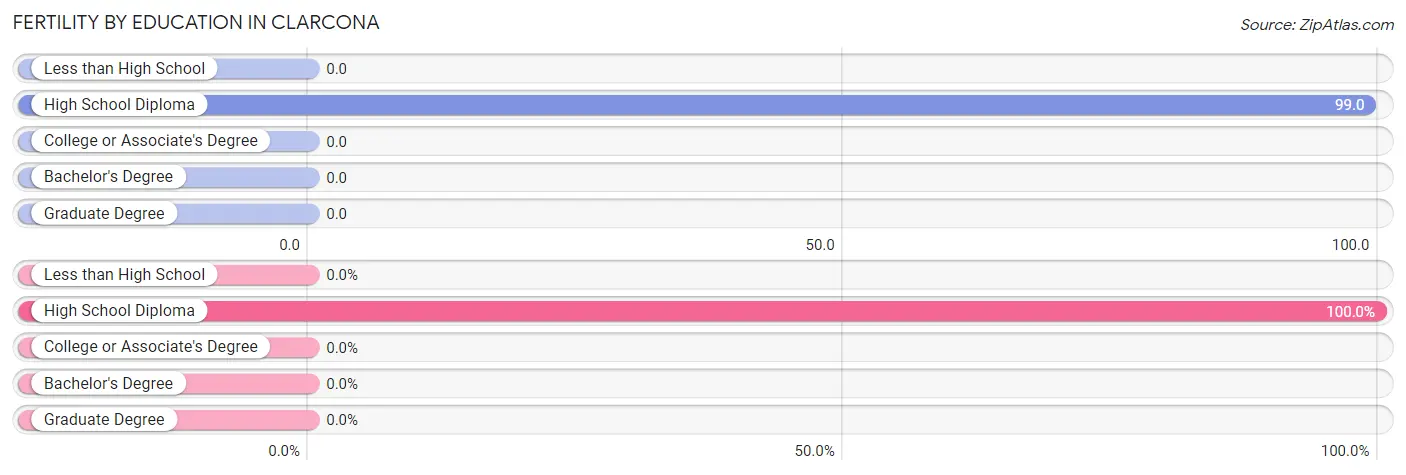
| Educational Attainment | Women with Births | Births / 1,000 Women |
| Less than High School | 0 (0.0%) | 0.0 |
| High School Diploma | 51 (100.0%) | 99.0 |
| College or Associate's Degree | 0 (0.0%) | 0.0 |
| Bachelor's Degree | 0 (0.0%) | 0.0 |
| Graduate Degree | 0 (0.0%) | 0.0 |
| Total | 51 (100.0%) | 57.0 |
Fertility by Education by Marriage Status in Clarcona
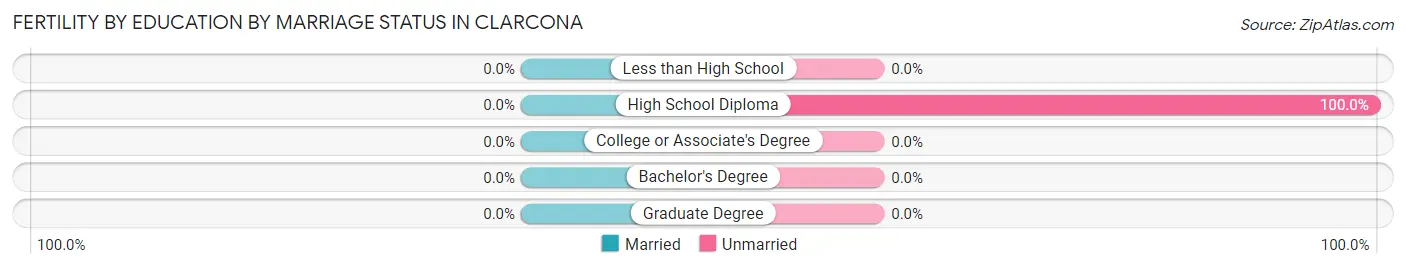
| Educational Attainment | Married | Unmarried |
| Less than High School | 0 (0.0%) | 0 (0.0%) |
| High School Diploma | 0 (0.0%) | 51 (100.0%) |
| College or Associate's Degree | 0 (0.0%) | 0 (0.0%) |
| Bachelor's Degree | 0 (0.0%) | 0 (0.0%) |
| Graduate Degree | 0 (0.0%) | 0 (0.0%) |
| Total | 0 (0.0%) | 51 (100.0%) |
Income in Clarcona
Income Overview in Clarcona
Per Capita Income in Clarcona is $28,744, while median incomes of families and households are $60,375 and $38,154 respectively.
| Characteristic | Number | Measure |
| Per Capita Income | 4,128 | $28,744 |
| Median Family Income | 950 | $60,375 |
| Mean Family Income | 950 | $107,787 |
| Median Household Income | 1,529 | $38,154 |
| Mean Household Income | 1,529 | $75,233 |
| Income Deficit | 950 | $0 |
| Wage / Income Gap (%) | 4,128 | 24.28% |
| Wage / Income Gap ($) | 4,128 | 75.72¢ per $1 |
| Gini / Inequality Index | 4,128 | 0.60 |
Earnings by Sex in Clarcona
Average Earnings in Clarcona are $28,179, $31,338 for men and $23,730 for women, a difference of 24.3%.
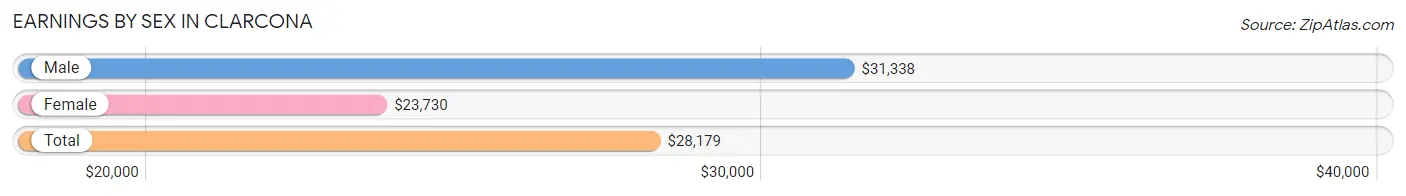
| Sex | Number | Average Earnings |
| Male | 779 (46.2%) | $31,338 |
| Female | 908 (53.8%) | $23,730 |
| Total | 1,687 (100.0%) | $28,179 |
Earnings by Sex by Income Bracket in Clarcona
The most common earnings brackets in Clarcona are $25,000 to $29,999 for men (142 | 18.2%) and $2,499 or less for women (163 | 17.9%).
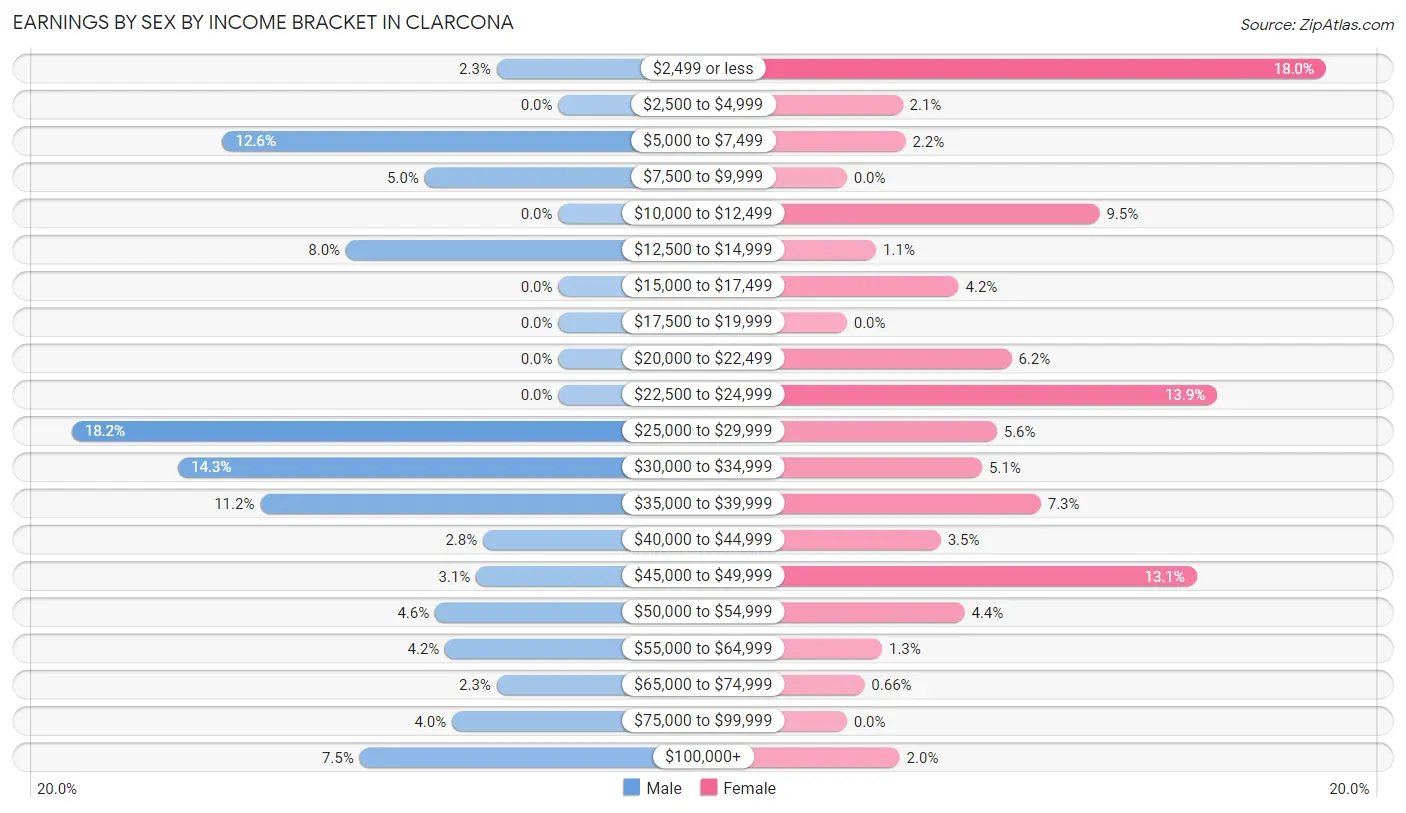
| Income | Male | Female |
| $2,499 or less | 18 (2.3%) | 163 (17.9%) |
| $2,500 to $4,999 | 0 (0.0%) | 19 (2.1%) |
| $5,000 to $7,499 | 98 (12.6%) | 20 (2.2%) |
| $7,500 to $9,999 | 39 (5.0%) | 0 (0.0%) |
| $10,000 to $12,499 | 0 (0.0%) | 86 (9.5%) |
| $12,500 to $14,999 | 62 (8.0%) | 10 (1.1%) |
| $15,000 to $17,499 | 0 (0.0%) | 38 (4.2%) |
| $17,500 to $19,999 | 0 (0.0%) | 0 (0.0%) |
| $20,000 to $22,499 | 0 (0.0%) | 56 (6.2%) |
| $22,500 to $24,999 | 0 (0.0%) | 126 (13.9%) |
| $25,000 to $29,999 | 142 (18.2%) | 51 (5.6%) |
| $30,000 to $34,999 | 111 (14.2%) | 46 (5.1%) |
| $35,000 to $39,999 | 87 (11.2%) | 66 (7.3%) |
| $40,000 to $44,999 | 22 (2.8%) | 32 (3.5%) |
| $45,000 to $49,999 | 24 (3.1%) | 119 (13.1%) |
| $50,000 to $54,999 | 36 (4.6%) | 40 (4.4%) |
| $55,000 to $64,999 | 33 (4.2%) | 12 (1.3%) |
| $65,000 to $74,999 | 18 (2.3%) | 6 (0.7%) |
| $75,000 to $99,999 | 31 (4.0%) | 0 (0.0%) |
| $100,000+ | 58 (7.4%) | 18 (2.0%) |
| Total | 779 (100.0%) | 908 (100.0%) |
Earnings by Sex by Educational Attainment in Clarcona
Average earnings in Clarcona are $31,118 for men and $32,799 for women, a difference of 5.1%. Men with an educational attainment of high school diploma enjoy the highest average annual earnings of $45,260, while those with graduate degree education earn the least with $26,461. Women with an educational attainment of bachelor's degree earn the most with the average annual earnings of $52,594, while those with high school diploma education have the smallest earnings of $29,142.
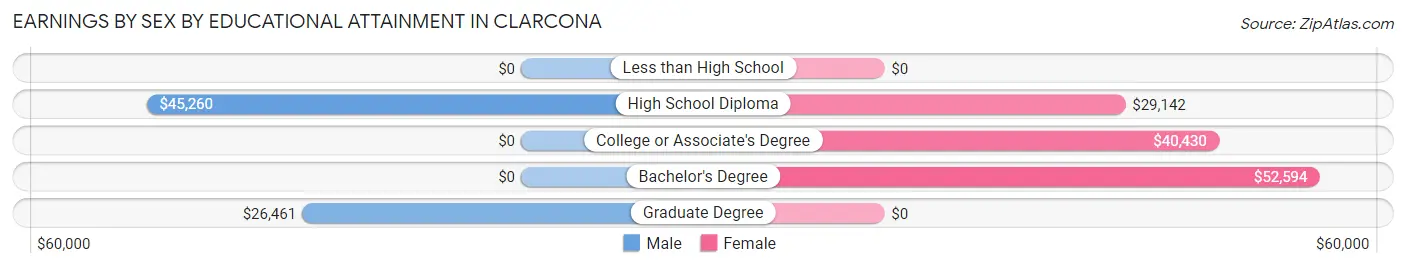
| Educational Attainment | Male Income | Female Income |
| Less than High School | - | - |
| High School Diploma | $45,260 | $29,142 |
| College or Associate's Degree | - | - |
| Bachelor's Degree | - | - |
| Graduate Degree | $26,461 | $0 |
| Total | $31,118 | $32,799 |
Family Income in Clarcona
Family Income Brackets in Clarcona
According to the Clarcona family income data, there are 214 families falling into the $100,000 to $149,999 income range, which is the most common income bracket and makes up 22.5% of all families.
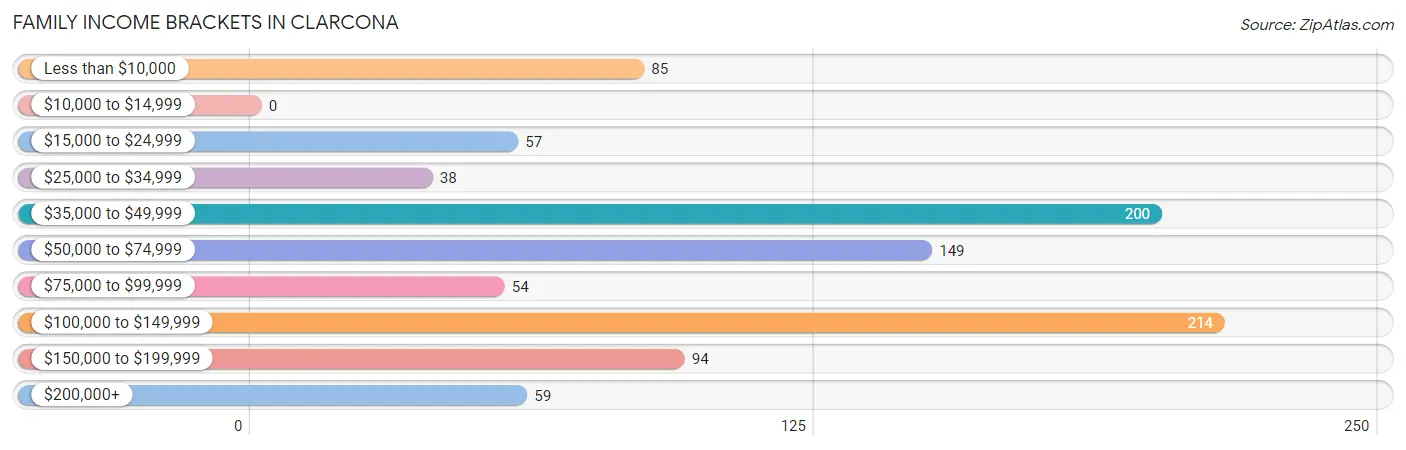
| Income Bracket | # Families | % Families |
| Less than $10,000 | 85 | 8.9% |
| $10,000 to $14,999 | 0 | 0.0% |
| $15,000 to $24,999 | 57 | 6.0% |
| $25,000 to $34,999 | 38 | 4.0% |
| $35,000 to $49,999 | 200 | 21.1% |
| $50,000 to $74,999 | 149 | 15.7% |
| $75,000 to $99,999 | 54 | 5.7% |
| $100,000 to $149,999 | 214 | 22.5% |
| $150,000 to $199,999 | 94 | 9.9% |
| $200,000+ | 59 | 6.2% |
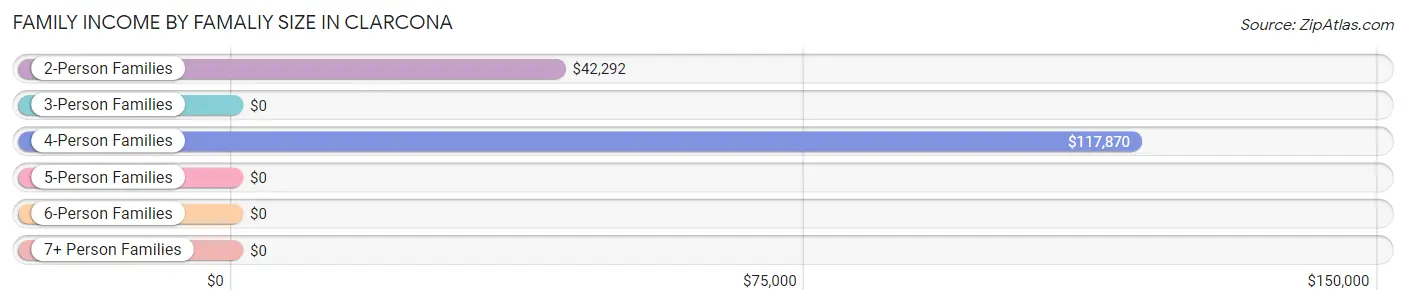
Family Income by Famaliy Size in Clarcona
4-person families (118 | 12.4%) account for the highest median family income in Clarcona with $117,870 per family, while 4-person families (118 | 12.4%) have the highest median income of $29,468 per family member.
| Income Bracket | # Families | Median Income |
| 2-Person Families | 300 (31.6%) | $42,292 |
| 3-Person Families | 303 (31.9%) | $0 |
| 4-Person Families | 118 (12.4%) | $117,870 |
| 5-Person Families | 220 (23.2%) | $0 |
| 6-Person Families | 9 (0.9%) | $0 |
| 7+ Person Families | 0 (0.0%) | $0 |
| Total | 950 (100.0%) | $60,375 |
Family Income by Number of Earners in Clarcona
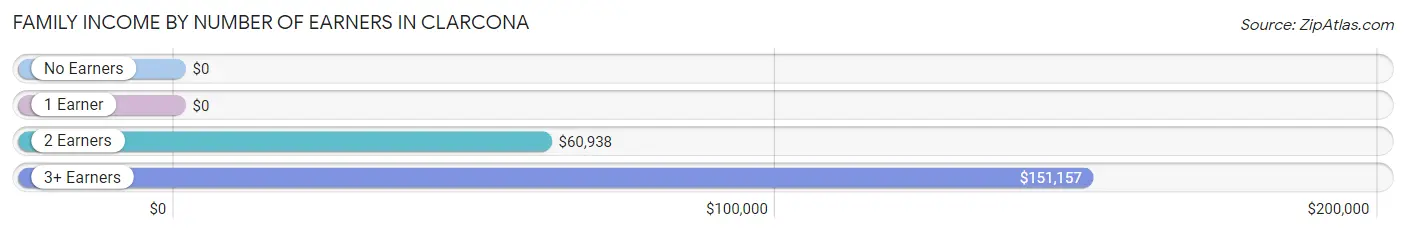
| Number of Earners | # Families | Median Income |
| No Earners | 177 (18.6%) | $0 |
| 1 Earner | 339 (35.7%) | $0 |
| 2 Earners | 355 (37.4%) | $60,938 |
| 3+ Earners | 79 (8.3%) | $151,157 |
| Total | 950 (100.0%) | $60,375 |
Household Income in Clarcona
Household Income Brackets in Clarcona
With 385 households falling in the category, the $10,000 to $14,999 income range is the most frequent in Clarcona, accounting for 25.2% of all households. In contrast, only 60 households (3.9%) fall into the $200,000+ income bracket, making it the least populous group.
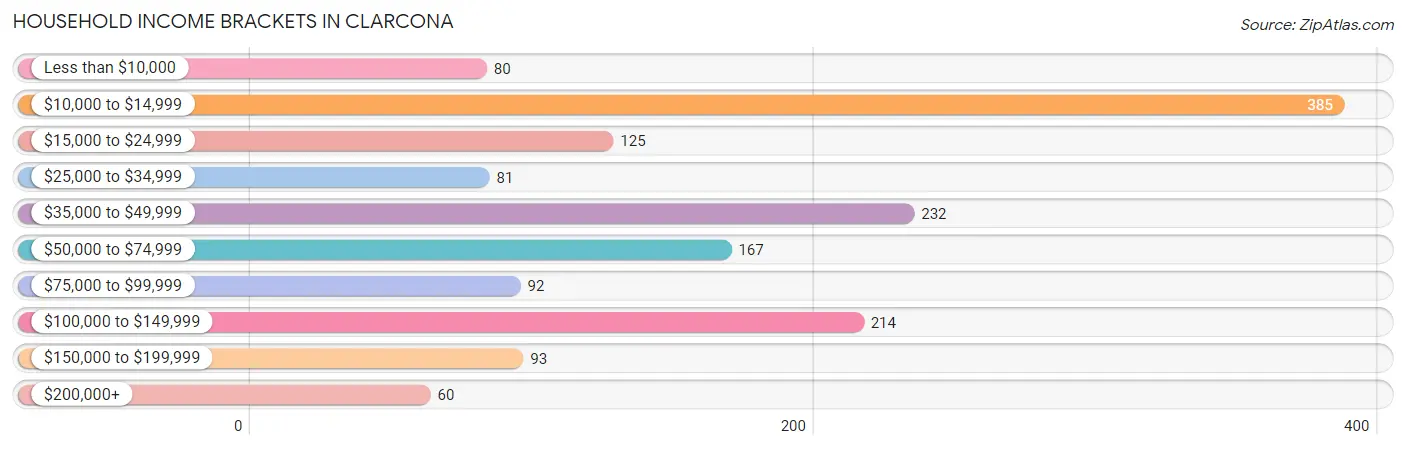
| Income Bracket | # Households | % Households |
| Less than $10,000 | 80 | 5.2% |
| $10,000 to $14,999 | 385 | 25.2% |
| $15,000 to $24,999 | 125 | 8.2% |
| $25,000 to $34,999 | 81 | 5.3% |
| $35,000 to $49,999 | 232 | 15.2% |
| $50,000 to $74,999 | 167 | 10.9% |
| $75,000 to $99,999 | 92 | 6.0% |
| $100,000 to $149,999 | 214 | 14.0% |
| $150,000 to $199,999 | 93 | 6.1% |
| $200,000+ | 60 | 3.9% |
Household Income by Householder Age in Clarcona
The median household income in Clarcona is $38,154, with the highest median household income of $41,094 found in the 65+ years age bracket for the primary householder. A total of 371 households (24.3%) fall into this category.
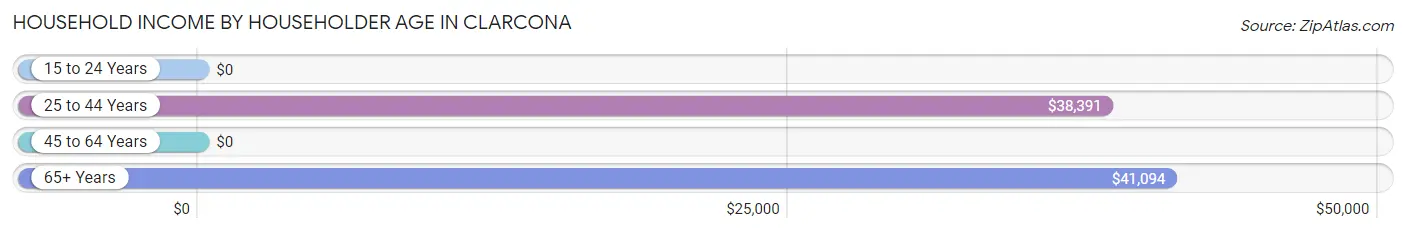
| Income Bracket | # Households | Median Income |
| 15 to 24 Years | 0 (0.0%) | $0 |
| 25 to 44 Years | 382 (25.0%) | $38,391 |
| 45 to 64 Years | 776 (50.7%) | $0 |
| 65+ Years | 371 (24.3%) | $41,094 |
| Total | 1,529 (100.0%) | $38,154 |
Poverty in Clarcona
Income Below Poverty by Sex and Age in Clarcona
With 5.9% poverty level for males and 25.7% for females among the residents of Clarcona, 55 to 64 year old males and 6 to 11 year old females are the most vulnerable to poverty, with 84 males (23.4%) and 64 females (61.0%) in their respective age groups living below the poverty level.
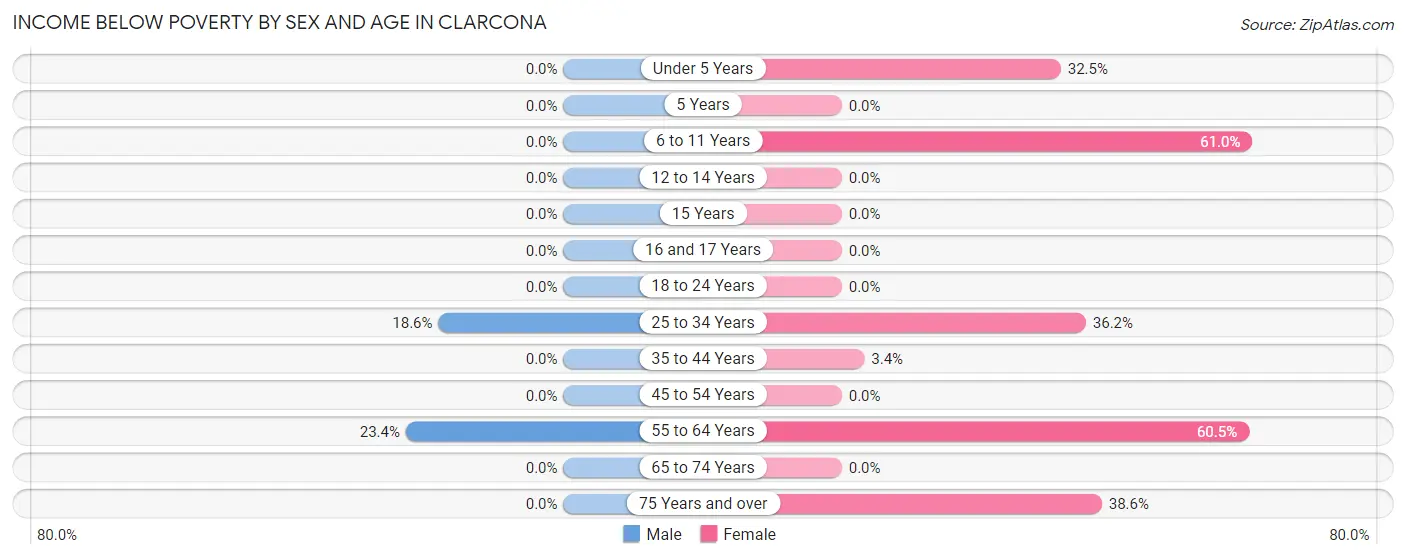
| Age Bracket | Male | Female |
| Under 5 Years | 0 (0.0%) | 80 (32.5%) |
| 5 Years | 0 (0.0%) | 0 (0.0%) |
| 6 to 11 Years | 0 (0.0%) | 64 (61.0%) |
| 12 to 14 Years | 0 (0.0%) | 0 (0.0%) |
| 15 Years | 0 (0.0%) | 0 (0.0%) |
| 16 and 17 Years | 0 (0.0%) | 0 (0.0%) |
| 18 to 24 Years | 0 (0.0%) | 0 (0.0%) |
| 25 to 34 Years | 18 (18.6%) | 83 (36.2%) |
| 35 to 44 Years | 0 (0.0%) | 8 (3.4%) |
| 45 to 54 Years | 0 (0.0%) | 0 (0.0%) |
| 55 to 64 Years | 84 (23.4%) | 344 (60.5%) |
| 65 to 74 Years | 0 (0.0%) | 0 (0.0%) |
| 75 Years and over | 0 (0.0%) | 39 (38.6%) |
| Total | 102 (5.9%) | 618 (25.7%) |
Income Above Poverty by Sex and Age in Clarcona
According to the poverty statistics in Clarcona, males aged under 5 years and females aged 5 years are the age groups that are most secure financially, with 100.0% of males and 100.0% of females in these age groups living above the poverty line.
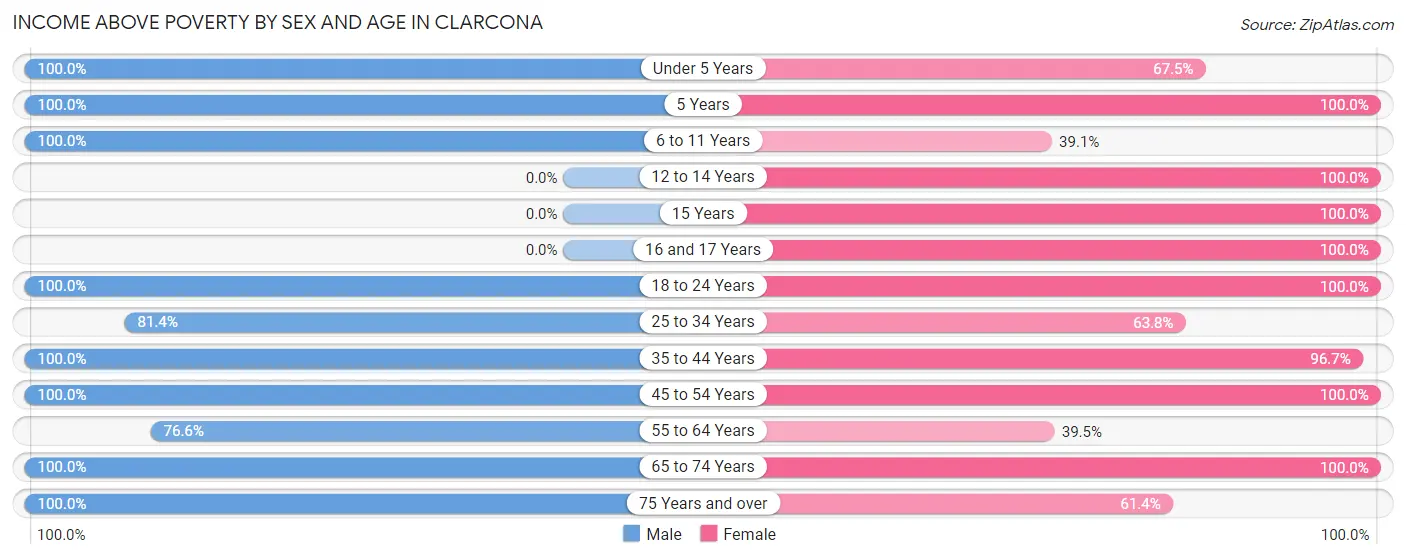
| Age Bracket | Male | Female |
| Under 5 Years | 183 (100.0%) | 166 (67.5%) |
| 5 Years | 131 (100.0%) | 77 (100.0%) |
| 6 to 11 Years | 121 (100.0%) | 41 (39.1%) |
| 12 to 14 Years | 0 (0.0%) | 136 (100.0%) |
| 15 Years | 0 (0.0%) | 24 (100.0%) |
| 16 and 17 Years | 0 (0.0%) | 8 (100.0%) |
| 18 to 24 Years | 40 (100.0%) | 279 (100.0%) |
| 25 to 34 Years | 79 (81.4%) | 146 (63.8%) |
| 35 to 44 Years | 397 (100.0%) | 231 (96.7%) |
| 45 to 54 Years | 89 (100.0%) | 148 (100.0%) |
| 55 to 64 Years | 275 (76.6%) | 225 (39.5%) |
| 65 to 74 Years | 171 (100.0%) | 248 (100.0%) |
| 75 Years and over | 131 (100.0%) | 62 (61.4%) |
| Total | 1,617 (94.1%) | 1,791 (74.4%) |
Income Below Poverty Among Married-Couple Families in Clarcona
The poverty statistics for married-couple families in Clarcona show that 3.2% or 21 of the total 648 families live below the poverty line. Families with no children have the highest poverty rate of 4.7%, comprising of 21 families. On the other hand, families with 1 or 2 children have the lowest poverty rate of 0.0%, which includes 0 families.
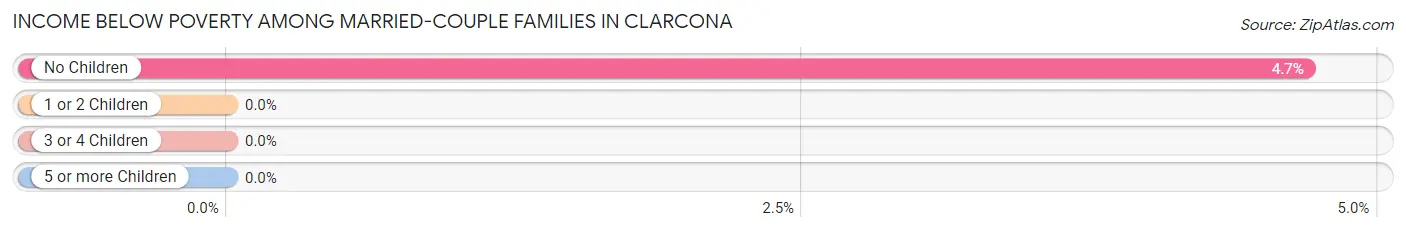
| Children | Above Poverty | Below Poverty |
| No Children | 427 (95.3%) | 21 (4.7%) |
| 1 or 2 Children | 157 (100.0%) | 0 (0.0%) |
| 3 or 4 Children | 43 (100.0%) | 0 (0.0%) |
| 5 or more Children | 0 (0.0%) | 0 (0.0%) |
| Total | 627 (96.8%) | 21 (3.2%) |
Income Below Poverty Among Single-Parent Households in Clarcona
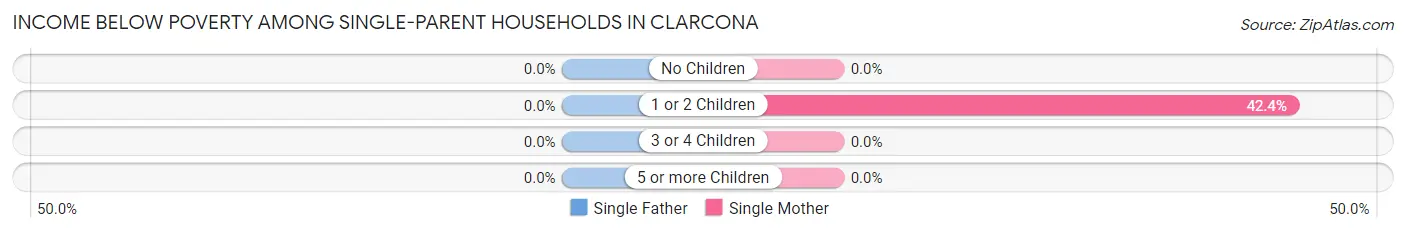
| Children | Single Father | Single Mother |
| No Children | 0 (0.0%) | 0 (0.0%) |
| 1 or 2 Children | 0 (0.0%) | 64 (42.4%) |
| 3 or 4 Children | 0 (0.0%) | 0 (0.0%) |
| 5 or more Children | 0 (0.0%) | 0 (0.0%) |
| Total | 0 (0.0%) | 64 (35.6%) |
Income Below Poverty Among Married-Couple vs Single-Parent Households in Clarcona
The poverty data for Clarcona shows that 21 of the married-couple family households (3.2%) and 64 of the single-parent households (21.2%) are living below the poverty level. Within the married-couple family households, those with no children have the highest poverty rate, with 21 households (4.7%) falling below the poverty line. Among the single-parent households, those with 1 or 2 children have the highest poverty rate, with 64 household (40.3%) living below poverty.
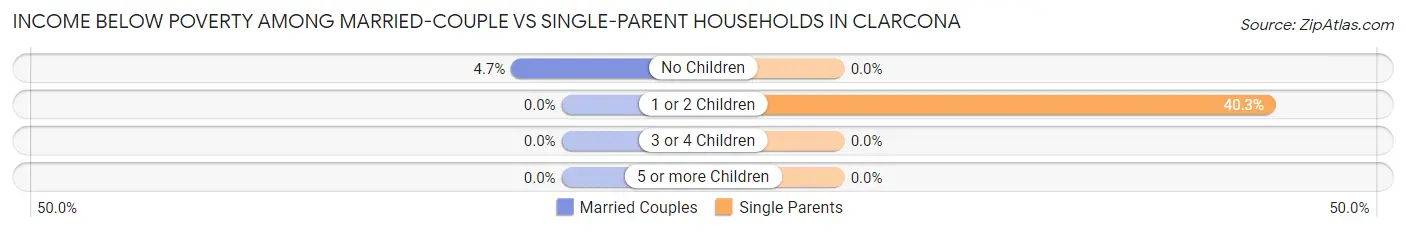
| Children | Married-Couple Families | Single-Parent Households |
| No Children | 21 (4.7%) | 0 (0.0%) |
| 1 or 2 Children | 0 (0.0%) | 64 (40.3%) |
| 3 or 4 Children | 0 (0.0%) | 0 (0.0%) |
| 5 or more Children | 0 (0.0%) | 0 (0.0%) |
| Total | 21 (3.2%) | 64 (21.2%) |
Employment Characteristics in Clarcona
Employment by Class of Employer in Clarcona
Among the 1,473 employed individuals in Clarcona, private company employees (1,254 | 85.1%), self-employed (not incorporated) (155 | 10.5%), and local government employees (50 | 3.4%) make up the most common classes of employment.
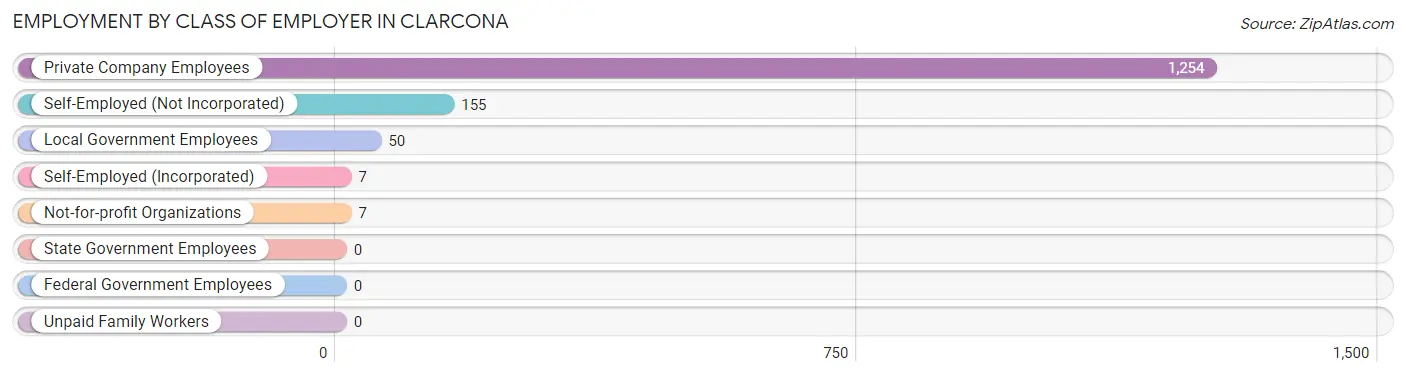
| Employer Class | # Employees | % Employees |
| Private Company Employees | 1,254 | 85.1% |
| Self-Employed (Incorporated) | 7 | 0.5% |
| Self-Employed (Not Incorporated) | 155 | 10.5% |
| Not-for-profit Organizations | 7 | 0.5% |
| Local Government Employees | 50 | 3.4% |
| State Government Employees | 0 | 0.0% |
| Federal Government Employees | 0 | 0.0% |
| Unpaid Family Workers | 0 | 0.0% |
| Total | 1,473 | 100.0% |
Employment Status by Age in Clarcona
According to the labor force statistics for Clarcona, out of the total population over 16 years of age (3,105), 48.3% or 1,500 individuals are in the labor force, with 1.3% or 20 of them unemployed. The age group with the highest labor force participation rate is 45 to 54 years, with 96.6% or 229 individuals in the labor force. Within the labor force, the 60 to 64 years age range has the highest percentage of unemployed individuals, with 25.8% or 8 of them being unemployed.
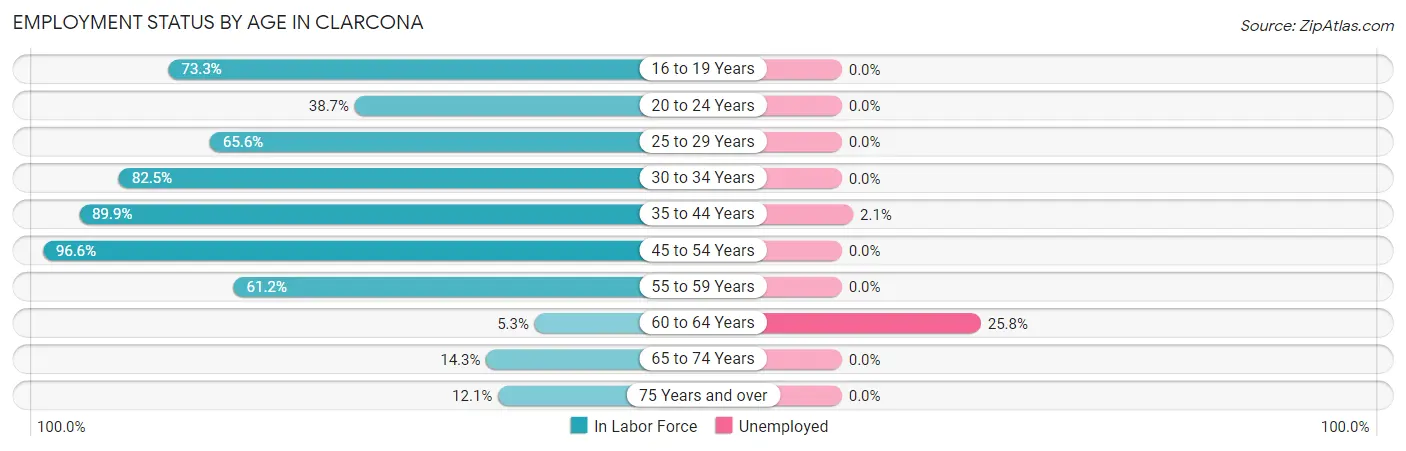
| Age Bracket | In Labor Force | Unemployed |
| 16 to 19 Years | 22 (73.3%) | 0 (0.0%) |
| 20 to 24 Years | 115 (38.7%) | 0 (0.0%) |
| 25 to 29 Years | 139 (65.6%) | 0 (0.0%) |
| 30 to 34 Years | 94 (82.5%) | 0 (0.0%) |
| 35 to 44 Years | 572 (89.9%) | 12 (2.1%) |
| 45 to 54 Years | 229 (96.6%) | 0 (0.0%) |
| 55 to 59 Years | 210 (61.2%) | 0 (0.0%) |
| 60 to 64 Years | 31 (5.3%) | 8 (25.8%) |
| 65 to 74 Years | 60 (14.3%) | 0 (0.0%) |
| 75 Years and over | 28 (12.1%) | 0 (0.0%) |
| Total | 1,500 (48.3%) | 20 (1.3%) |
Employment Status by Educational Attainment in Clarcona
According to labor force statistics for Clarcona, 59.9% of individuals (1,274) out of the total population between 25 and 64 years of age (2,127) are in the labor force, with 1.6% or 20 of them being unemployed. The group with the highest labor force participation rate are those with the educational attainment of bachelor's degree or higher, with 96.1% or 343 individuals in the labor force. Within the labor force, individuals with bachelor's degree or higher education have the highest percentage of unemployment, with 3.5% or 12 of them being unemployed.
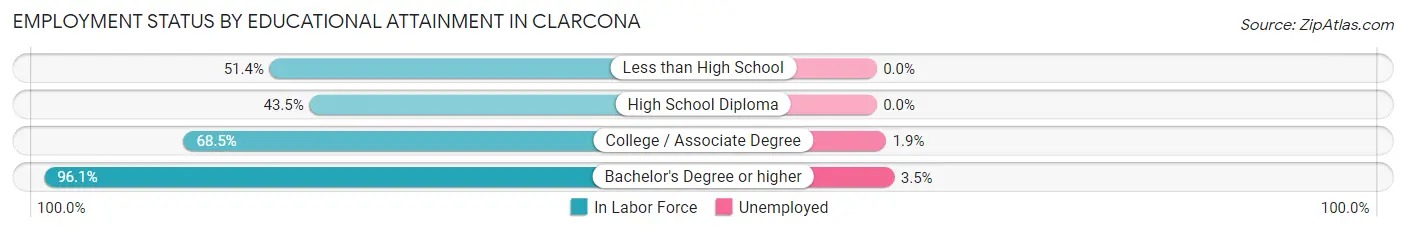
| Educational Attainment | In Labor Force | Unemployed |
| Less than High School | 74 (51.4%) | 0 (0.0%) |
| High School Diploma | 445 (43.5%) | 0 (0.0%) |
| College / Associate Degree | 413 (68.5%) | 11 (1.9%) |
| Bachelor's Degree or higher | 343 (96.1%) | 12 (3.5%) |
| Total | 1,274 (59.9%) | 34 (1.6%) |
Employment Occupations by Sex in Clarcona
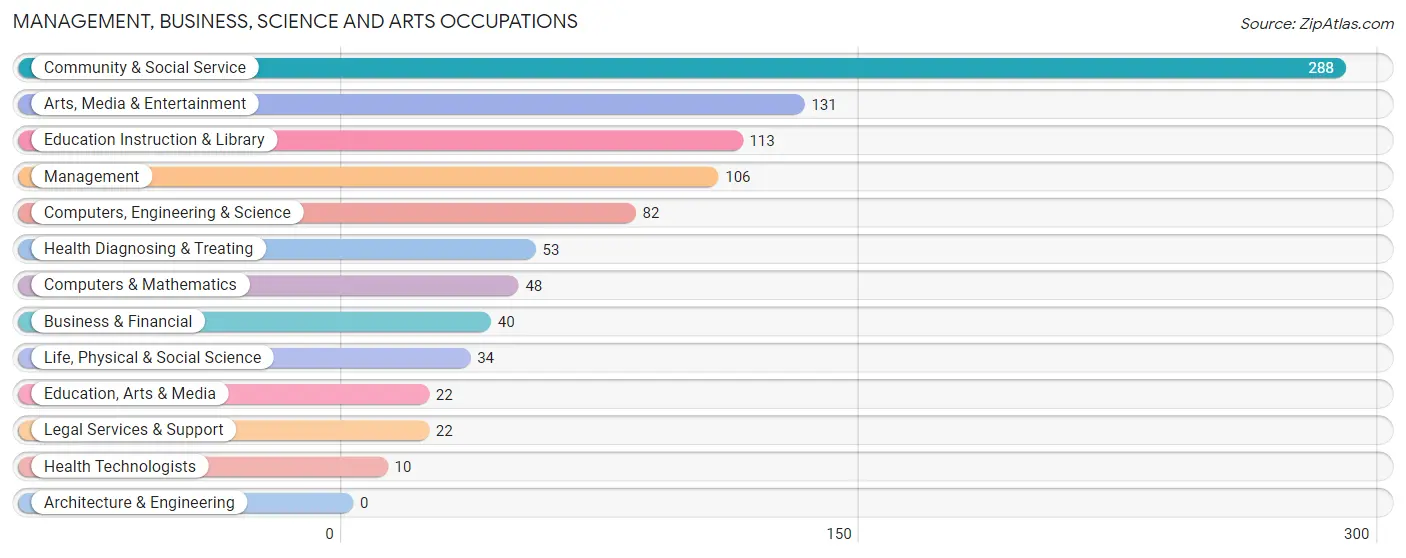
Management, Business, Science and Arts Occupations
The most common Management, Business, Science and Arts occupations in Clarcona are Community & Social Service (288 | 19.5%), Arts, Media & Entertainment (131 | 8.8%), Education Instruction & Library (113 | 7.6%), Management (106 | 7.2%), and Computers, Engineering & Science (82 | 5.5%).
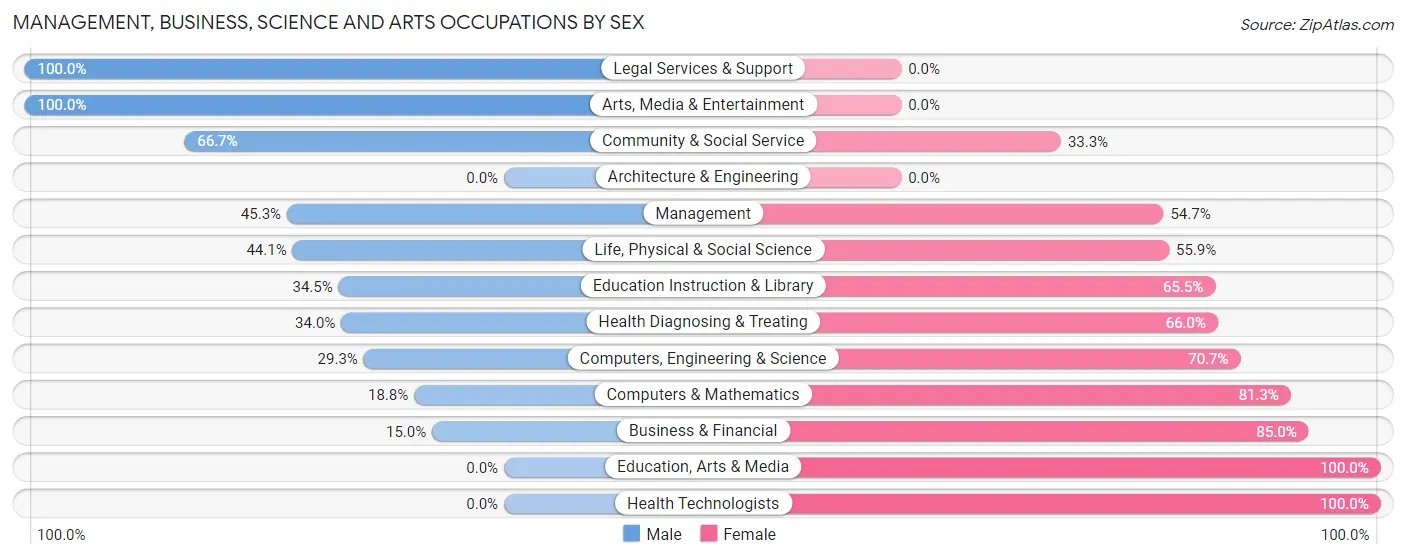
Management, Business, Science and Arts Occupations by Sex
Within the Management, Business, Science and Arts occupations in Clarcona, the most male-oriented occupations are Legal Services & Support (100.0%), Arts, Media & Entertainment (100.0%), and Community & Social Service (66.7%), while the most female-oriented occupations are Education, Arts & Media (100.0%), Health Technologists (100.0%), and Business & Financial (85.0%).
| Occupation | Male | Female |
| Management | 48 (45.3%) | 58 (54.7%) |
| Business & Financial | 6 (15.0%) | 34 (85.0%) |
| Computers, Engineering & Science | 24 (29.3%) | 58 (70.7%) |
| Computers & Mathematics | 9 (18.8%) | 39 (81.2%) |
| Architecture & Engineering | 0 (0.0%) | 0 (0.0%) |
| Life, Physical & Social Science | 15 (44.1%) | 19 (55.9%) |
| Community & Social Service | 192 (66.7%) | 96 (33.3%) |
| Education, Arts & Media | 0 (0.0%) | 22 (100.0%) |
| Legal Services & Support | 22 (100.0%) | 0 (0.0%) |
| Education Instruction & Library | 39 (34.5%) | 74 (65.5%) |
| Arts, Media & Entertainment | 131 (100.0%) | 0 (0.0%) |
| Health Diagnosing & Treating | 18 (34.0%) | 35 (66.0%) |
| Health Technologists | 0 (0.0%) | 10 (100.0%) |
| Total (Category) | 288 (50.6%) | 281 (49.4%) |
| Total (Overall) | 767 (51.8%) | 713 (48.2%) |
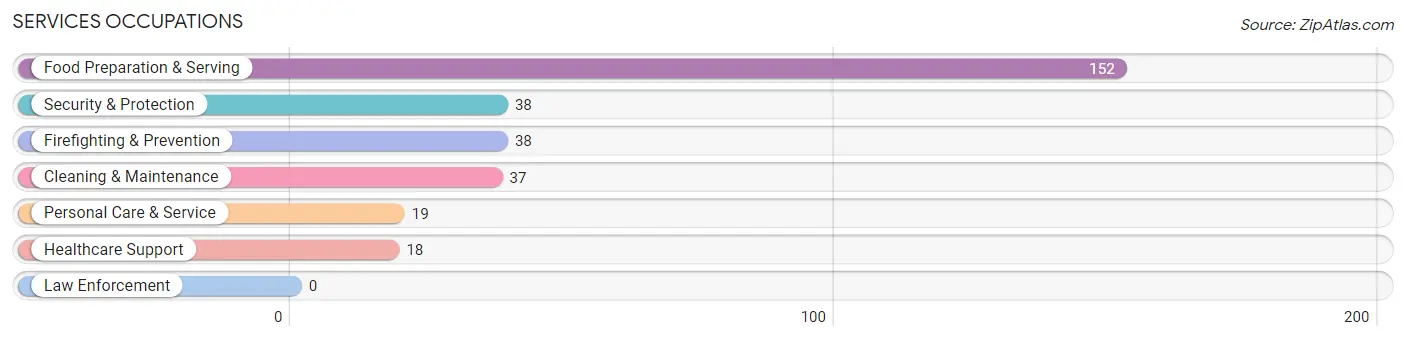
Services Occupations
The most common Services occupations in Clarcona are Food Preparation & Serving (152 | 10.3%), Security & Protection (38 | 2.6%), Firefighting & Prevention (38 | 2.6%), Cleaning & Maintenance (37 | 2.5%), and Personal Care & Service (19 | 1.3%).
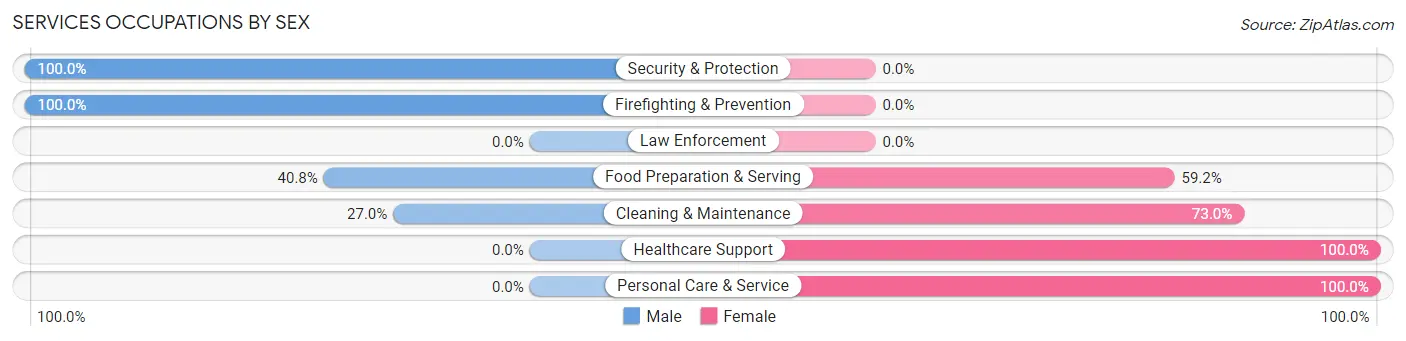
Services Occupations by Sex
Within the Services occupations in Clarcona, the most male-oriented occupations are Security & Protection (100.0%), Firefighting & Prevention (100.0%), and Food Preparation & Serving (40.8%), while the most female-oriented occupations are Healthcare Support (100.0%), Personal Care & Service (100.0%), and Cleaning & Maintenance (73.0%).
| Occupation | Male | Female |
| Healthcare Support | 0 (0.0%) | 18 (100.0%) |
| Security & Protection | 38 (100.0%) | 0 (0.0%) |
| Firefighting & Prevention | 38 (100.0%) | 0 (0.0%) |
| Law Enforcement | 0 (0.0%) | 0 (0.0%) |
| Food Preparation & Serving | 62 (40.8%) | 90 (59.2%) |
| Cleaning & Maintenance | 10 (27.0%) | 27 (73.0%) |
| Personal Care & Service | 0 (0.0%) | 19 (100.0%) |
| Total (Category) | 110 (41.7%) | 154 (58.3%) |
| Total (Overall) | 767 (51.8%) | 713 (48.2%) |
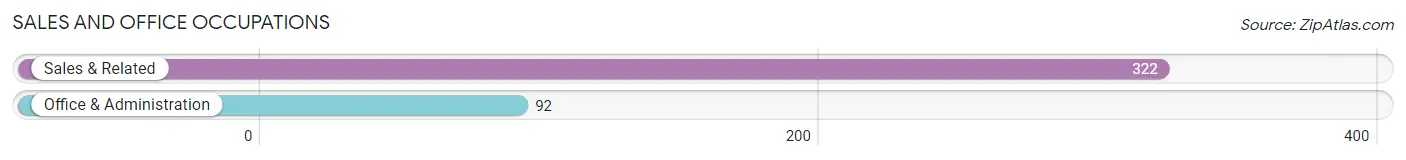
Sales and Office Occupations
The most common Sales and Office occupations in Clarcona are Sales & Related (322 | 21.8%), and Office & Administration (92 | 6.2%).
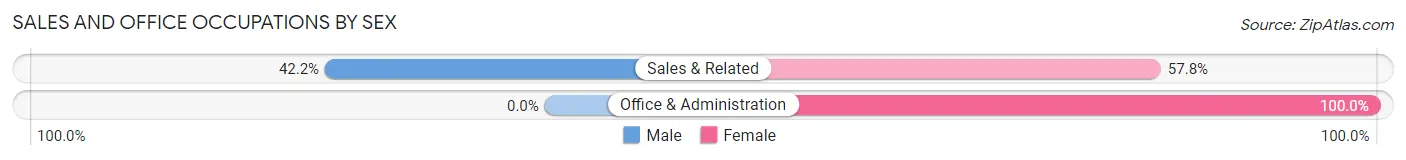
Sales and Office Occupations by Sex
| Occupation | Male | Female |
| Sales & Related | 136 (42.2%) | 186 (57.8%) |
| Office & Administration | 0 (0.0%) | 92 (100.0%) |
| Total (Category) | 136 (32.9%) | 278 (67.1%) |
| Total (Overall) | 767 (51.8%) | 713 (48.2%) |
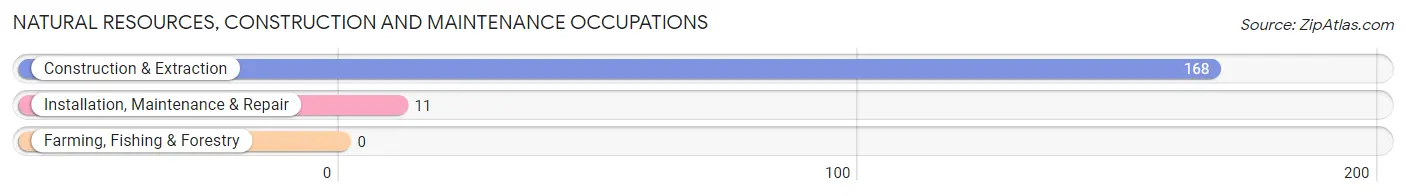
Natural Resources, Construction and Maintenance Occupations
The most common Natural Resources, Construction and Maintenance occupations in Clarcona are Construction & Extraction (168 | 11.4%), and Installation, Maintenance & Repair (11 | 0.7%).
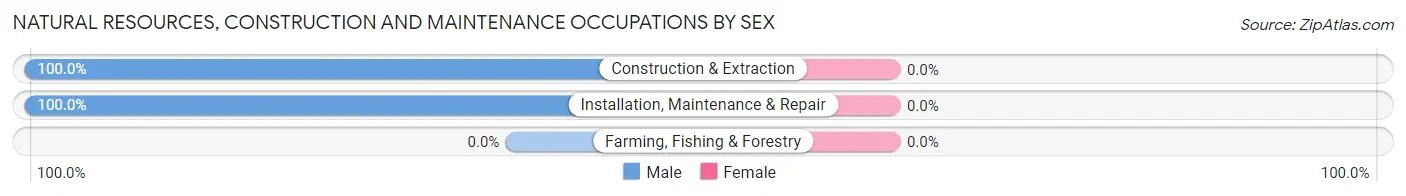
Natural Resources, Construction and Maintenance Occupations by Sex
| Occupation | Male | Female |
| Farming, Fishing & Forestry | 0 (0.0%) | 0 (0.0%) |
| Construction & Extraction | 168 (100.0%) | 0 (0.0%) |
| Installation, Maintenance & Repair | 11 (100.0%) | 0 (0.0%) |
| Total (Category) | 179 (100.0%) | 0 (0.0%) |
| Total (Overall) | 767 (51.8%) | 713 (48.2%) |
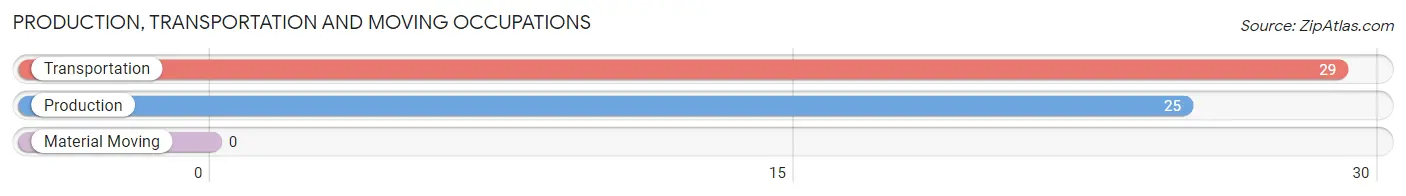
Production, Transportation and Moving Occupations
The most common Production, Transportation and Moving occupations in Clarcona are Transportation (29 | 2.0%), and Production (25 | 1.7%).
Production, Transportation and Moving Occupations by Sex
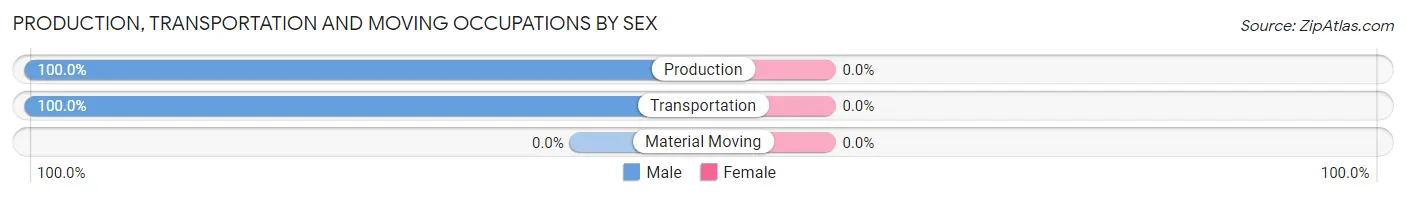
| Occupation | Male | Female |
| Production | 25 (100.0%) | 0 (0.0%) |
| Transportation | 29 (100.0%) | 0 (0.0%) |
| Material Moving | 0 (0.0%) | 0 (0.0%) |
| Total (Category) | 54 (100.0%) | 0 (0.0%) |
| Total (Overall) | 767 (51.8%) | 713 (48.2%) |
Employment Industries by Sex in Clarcona
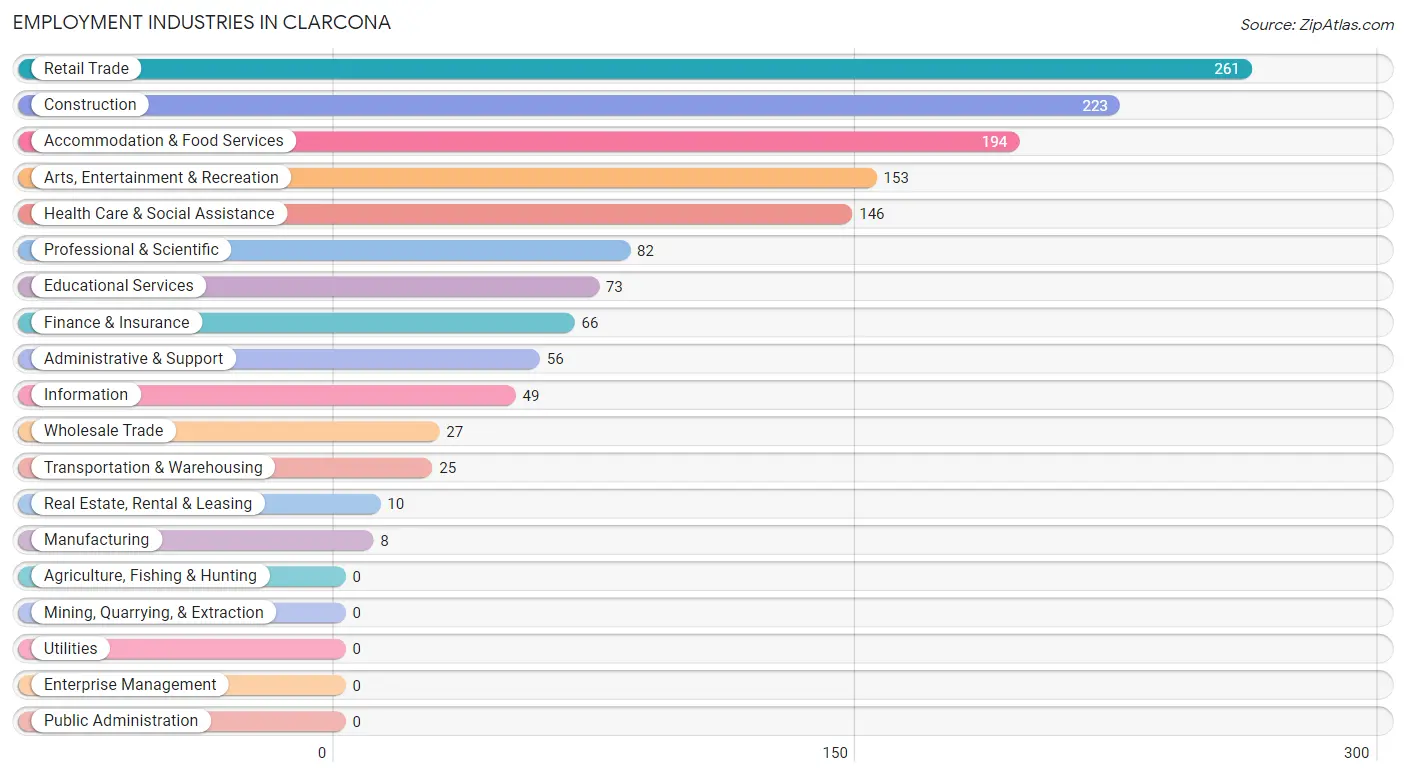
Employment Industries in Clarcona
The major employment industries in Clarcona include Retail Trade (261 | 17.6%), Construction (223 | 15.1%), Accommodation & Food Services (194 | 13.1%), Arts, Entertainment & Recreation (153 | 10.3%), and Health Care & Social Assistance (146 | 9.9%).
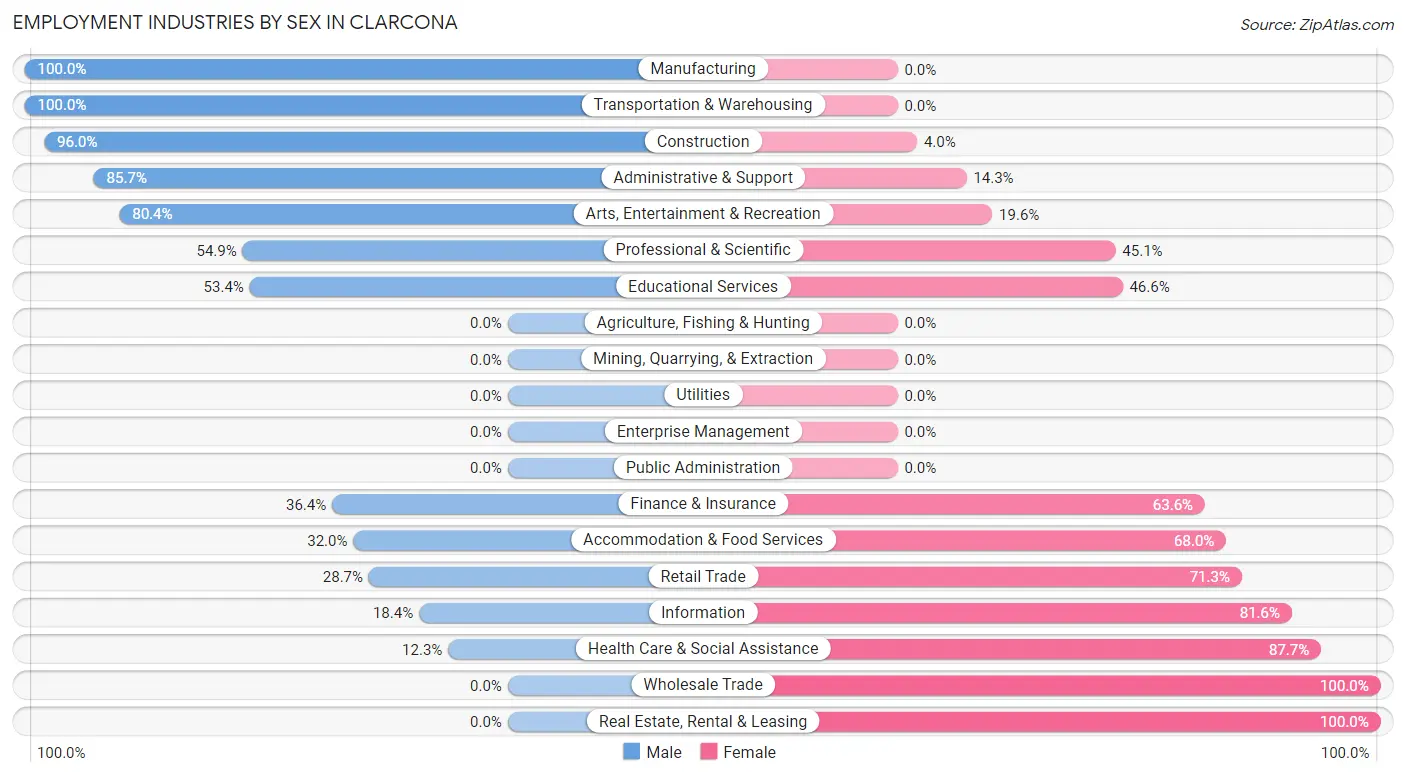
Employment Industries by Sex in Clarcona
The Clarcona industries that see more men than women are Manufacturing (100.0%), Transportation & Warehousing (100.0%), and Construction (96.0%), whereas the industries that tend to have a higher number of women are Wholesale Trade (100.0%), Real Estate, Rental & Leasing (100.0%), and Health Care & Social Assistance (87.7%).
| Industry | Male | Female |
| Agriculture, Fishing & Hunting | 0 (0.0%) | 0 (0.0%) |
| Mining, Quarrying, & Extraction | 0 (0.0%) | 0 (0.0%) |
| Construction | 214 (96.0%) | 9 (4.0%) |
| Manufacturing | 8 (100.0%) | 0 (0.0%) |
| Wholesale Trade | 0 (0.0%) | 27 (100.0%) |
| Retail Trade | 75 (28.7%) | 186 (71.3%) |
| Transportation & Warehousing | 25 (100.0%) | 0 (0.0%) |
| Utilities | 0 (0.0%) | 0 (0.0%) |
| Information | 9 (18.4%) | 40 (81.6%) |
| Finance & Insurance | 24 (36.4%) | 42 (63.6%) |
| Real Estate, Rental & Leasing | 0 (0.0%) | 10 (100.0%) |
| Professional & Scientific | 45 (54.9%) | 37 (45.1%) |
| Enterprise Management | 0 (0.0%) | 0 (0.0%) |
| Administrative & Support | 48 (85.7%) | 8 (14.3%) |
| Educational Services | 39 (53.4%) | 34 (46.6%) |
| Health Care & Social Assistance | 18 (12.3%) | 128 (87.7%) |
| Arts, Entertainment & Recreation | 123 (80.4%) | 30 (19.6%) |
| Accommodation & Food Services | 62 (32.0%) | 132 (68.0%) |
| Public Administration | 0 (0.0%) | 0 (0.0%) |
| Total | 767 (51.8%) | 713 (48.2%) |
Education in Clarcona
School Enrollment in Clarcona
The most common levels of schooling among the 775 students in Clarcona are elementary school (160 | 20.6%), kindergarten (153 | 19.7%), and middle school (143 | 18.4%).
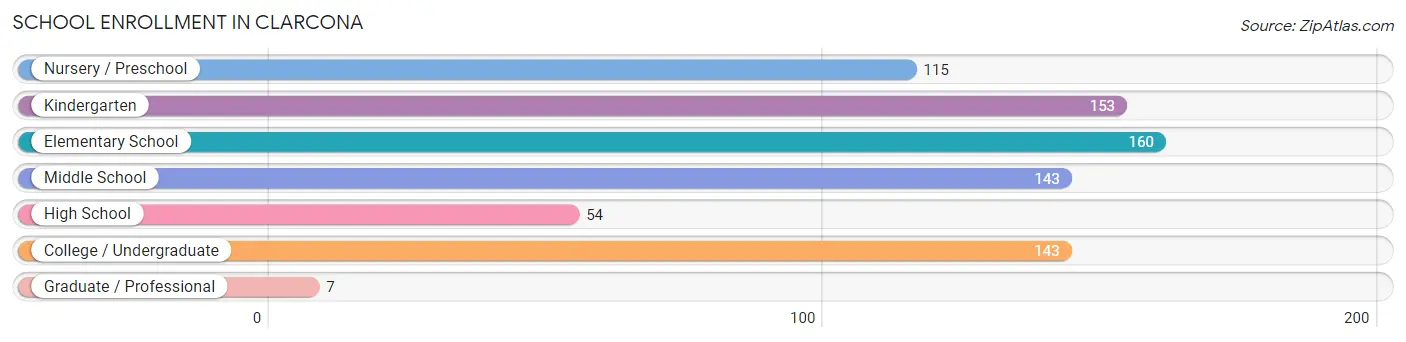
| School Level | # Students | % Students |
| Nursery / Preschool | 115 | 14.8% |
| Kindergarten | 153 | 19.7% |
| Elementary School | 160 | 20.6% |
| Middle School | 143 | 18.4% |
| High School | 54 | 7.0% |
| College / Undergraduate | 143 | 18.4% |
| Graduate / Professional | 7 | 0.9% |
| Total | 775 | 100.0% |
School Enrollment by Age by Funding Source in Clarcona
Out of a total of 775 students who are enrolled in schools in Clarcona, 87 (11.2%) attend a private institution, while the remaining 688 (88.8%) are enrolled in public schools. The age group of 35 years and over has the highest likelihood of being enrolled in private schools, with 30 (81.1% in the age bracket) enrolled. Conversely, the age group of 3 to 4 year olds has the lowest likelihood of being enrolled in a private school, with 23 (100.0% in the age bracket) attending a public institution.
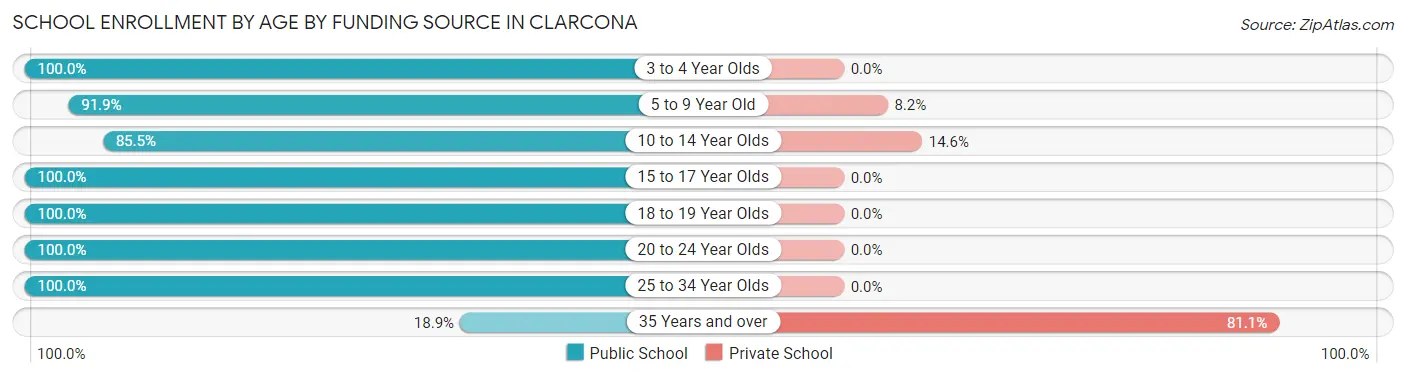
| Age Bracket | Public School | Private School |
| 3 to 4 Year Olds | 23 (100.0%) | 0 (0.0%) |
| 5 to 9 Year Old | 372 (91.8%) | 33 (8.2%) |
| 10 to 14 Year Olds | 141 (85.5%) | 24 (14.5%) |
| 15 to 17 Year Olds | 32 (100.0%) | 0 (0.0%) |
| 18 to 19 Year Olds | 22 (100.0%) | 0 (0.0%) |
| 20 to 24 Year Olds | 27 (100.0%) | 0 (0.0%) |
| 25 to 34 Year Olds | 64 (100.0%) | 0 (0.0%) |
| 35 Years and over | 7 (18.9%) | 30 (81.1%) |
| Total | 688 (88.8%) | 87 (11.2%) |
Educational Attainment by Field of Study in Clarcona
Business (149 | 27.4%), liberal arts & history (65 | 12.0%), psychology (62 | 11.4%), education (52 | 9.6%), and literature & languages (47 | 8.7%) are the most common fields of study among 543 individuals in Clarcona who have obtained a bachelor's degree or higher.
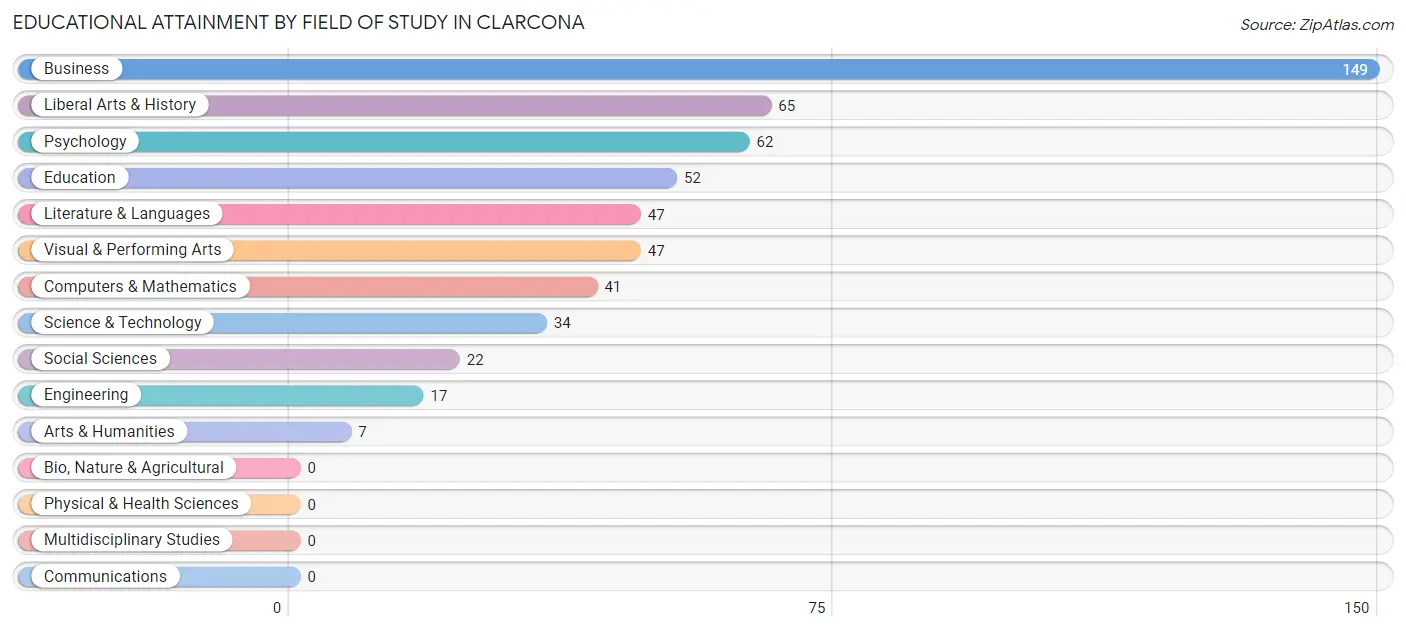
| Field of Study | # Graduates | % Graduates |
| Computers & Mathematics | 41 | 7.5% |
| Bio, Nature & Agricultural | 0 | 0.0% |
| Physical & Health Sciences | 0 | 0.0% |
| Psychology | 62 | 11.4% |
| Social Sciences | 22 | 4.1% |
| Engineering | 17 | 3.1% |
| Multidisciplinary Studies | 0 | 0.0% |
| Science & Technology | 34 | 6.3% |
| Business | 149 | 27.4% |
| Education | 52 | 9.6% |
| Literature & Languages | 47 | 8.7% |
| Liberal Arts & History | 65 | 12.0% |
| Visual & Performing Arts | 47 | 8.7% |
| Communications | 0 | 0.0% |
| Arts & Humanities | 7 | 1.3% |
| Total | 543 | 100.0% |
Transportation & Commute in Clarcona
Vehicle Availability by Sex in Clarcona
The most prevalent vehicle ownership categories in Clarcona are males with 1 vehicle (197, accounting for 25.7%) and females with 1 vehicle (115, making up 27.9%).
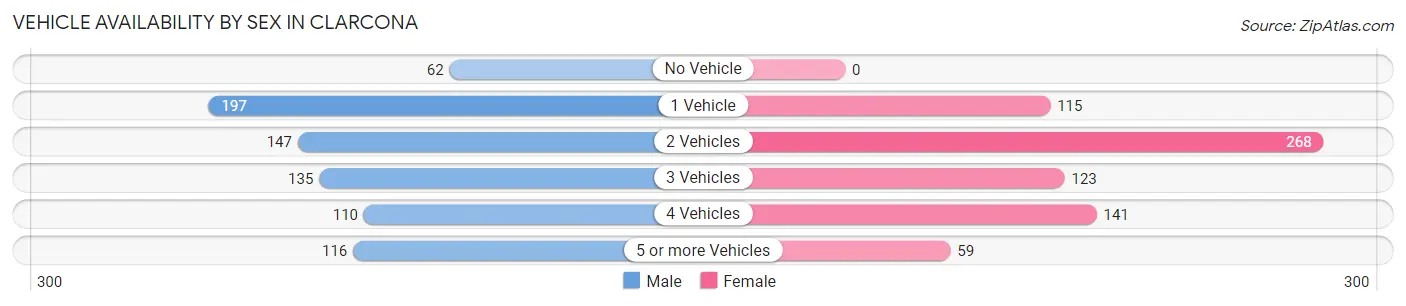
| Vehicles Available | Male | Female |
| No Vehicle | 62 (8.1%) | 0 (0.0%) |
| 1 Vehicle | 197 (25.7%) | 115 (16.3%) |
| 2 Vehicles | 147 (19.2%) | 268 (38.0%) |
| 3 Vehicles | 135 (17.6%) | 123 (17.4%) |
| 4 Vehicles | 110 (14.3%) | 141 (20.0%) |
| 5 or more Vehicles | 116 (15.1%) | 59 (8.4%) |
| Total | 767 (100.0%) | 706 (100.0%) |
Commute Time in Clarcona
The most frequently occuring commute durations in Clarcona are 15 to 19 minutes (262 commuters, 22.8%), 45 to 59 minutes (213 commuters, 18.6%), and 30 to 34 minutes (194 commuters, 16.9%).
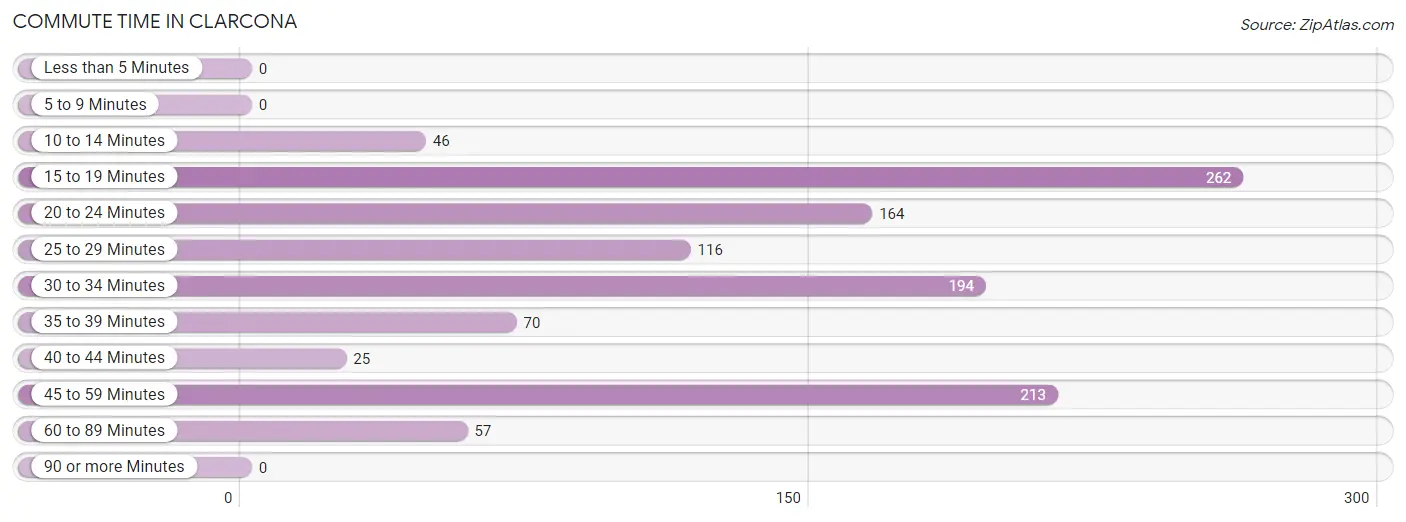
| Commute Time | # Commuters | % Commuters |
| Less than 5 Minutes | 0 | 0.0% |
| 5 to 9 Minutes | 0 | 0.0% |
| 10 to 14 Minutes | 46 | 4.0% |
| 15 to 19 Minutes | 262 | 22.8% |
| 20 to 24 Minutes | 164 | 14.3% |
| 25 to 29 Minutes | 116 | 10.1% |
| 30 to 34 Minutes | 194 | 16.9% |
| 35 to 39 Minutes | 70 | 6.1% |
| 40 to 44 Minutes | 25 | 2.2% |
| 45 to 59 Minutes | 213 | 18.6% |
| 60 to 89 Minutes | 57 | 5.0% |
| 90 or more Minutes | 0 | 0.0% |
Commute Time by Sex in Clarcona
The most common commute times in Clarcona are 15 to 19 minutes (134 commuters, 24.4%) for males and 20 to 24 minutes (133 commuters, 22.3%) for females.
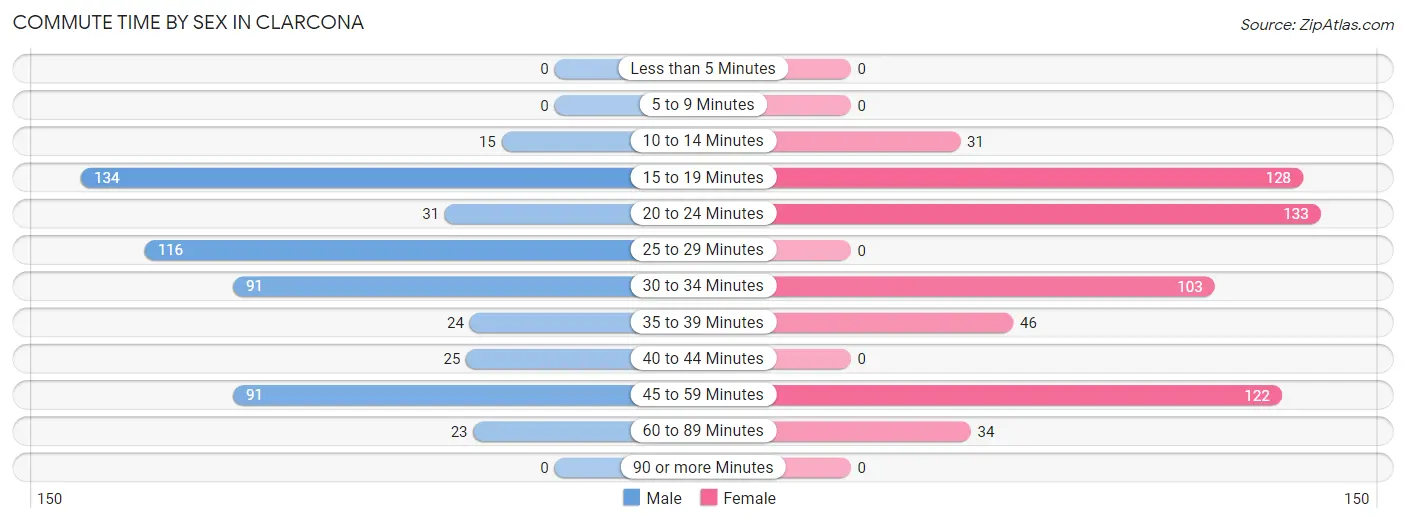
| Commute Time | Male | Female |
| Less than 5 Minutes | 0 (0.0%) | 0 (0.0%) |
| 5 to 9 Minutes | 0 (0.0%) | 0 (0.0%) |
| 10 to 14 Minutes | 15 (2.7%) | 31 (5.2%) |
| 15 to 19 Minutes | 134 (24.4%) | 128 (21.4%) |
| 20 to 24 Minutes | 31 (5.6%) | 133 (22.3%) |
| 25 to 29 Minutes | 116 (21.1%) | 0 (0.0%) |
| 30 to 34 Minutes | 91 (16.6%) | 103 (17.2%) |
| 35 to 39 Minutes | 24 (4.4%) | 46 (7.7%) |
| 40 to 44 Minutes | 25 (4.5%) | 0 (0.0%) |
| 45 to 59 Minutes | 91 (16.6%) | 122 (20.4%) |
| 60 to 89 Minutes | 23 (4.2%) | 34 (5.7%) |
| 90 or more Minutes | 0 (0.0%) | 0 (0.0%) |
Time of Departure to Work by Sex in Clarcona
The most frequent times of departure to work in Clarcona are 7:00 AM to 7:29 AM (160, 29.1%) for males and 12:00 PM to 3:59 PM (99, 16.6%) for females.
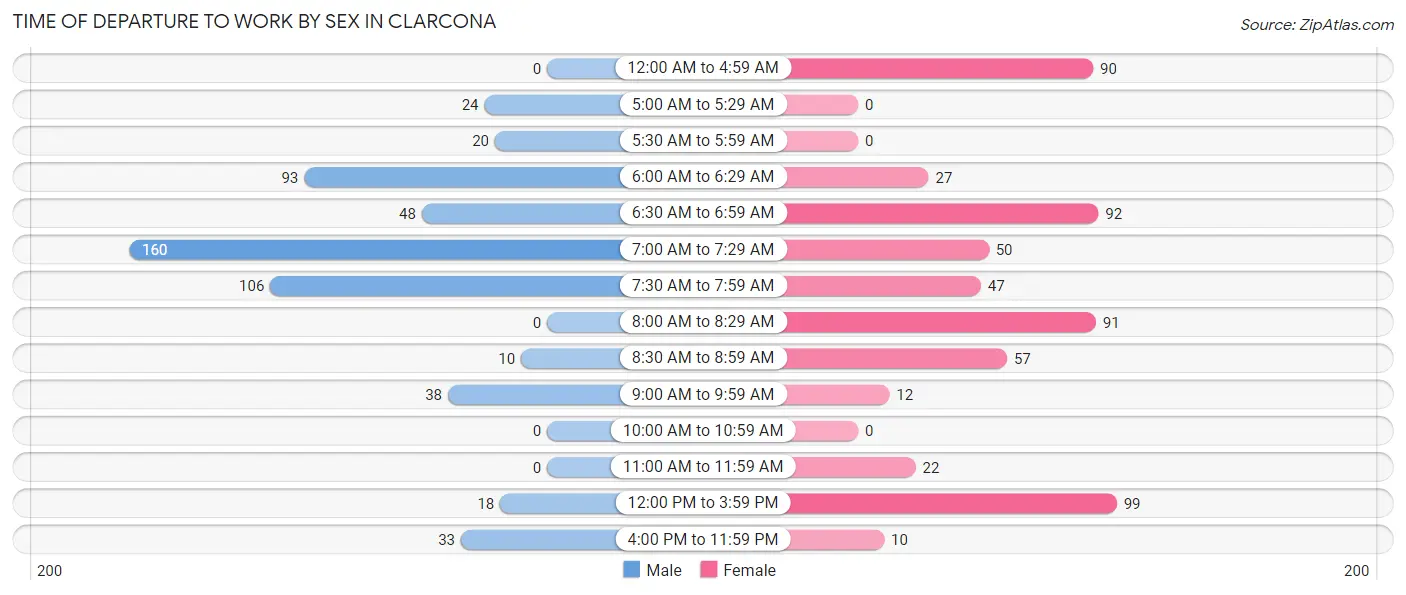
| Time of Departure | Male | Female |
| 12:00 AM to 4:59 AM | 0 (0.0%) | 90 (15.1%) |
| 5:00 AM to 5:29 AM | 24 (4.4%) | 0 (0.0%) |
| 5:30 AM to 5:59 AM | 20 (3.6%) | 0 (0.0%) |
| 6:00 AM to 6:29 AM | 93 (16.9%) | 27 (4.5%) |
| 6:30 AM to 6:59 AM | 48 (8.7%) | 92 (15.4%) |
| 7:00 AM to 7:29 AM | 160 (29.1%) | 50 (8.4%) |
| 7:30 AM to 7:59 AM | 106 (19.3%) | 47 (7.9%) |
| 8:00 AM to 8:29 AM | 0 (0.0%) | 91 (15.2%) |
| 8:30 AM to 8:59 AM | 10 (1.8%) | 57 (9.6%) |
| 9:00 AM to 9:59 AM | 38 (6.9%) | 12 (2.0%) |
| 10:00 AM to 10:59 AM | 0 (0.0%) | 0 (0.0%) |
| 11:00 AM to 11:59 AM | 0 (0.0%) | 22 (3.7%) |
| 12:00 PM to 3:59 PM | 18 (3.3%) | 99 (16.6%) |
| 4:00 PM to 11:59 PM | 33 (6.0%) | 10 (1.7%) |
| Total | 550 (100.0%) | 597 (100.0%) |
Housing Occupancy in Clarcona
Occupancy by Ownership in Clarcona
Of the total 1,529 dwellings in Clarcona, owner-occupied units account for 897 (58.7%), while renter-occupied units make up 632 (41.3%).
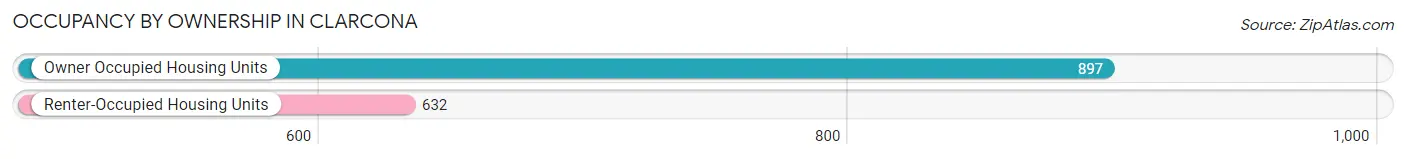
| Occupancy | # Housing Units | % Housing Units |
| Owner Occupied Housing Units | 897 | 58.7% |
| Renter-Occupied Housing Units | 632 | 41.3% |
| Total Occupied Housing Units | 1,529 | 100.0% |
Occupancy by Household Size in Clarcona
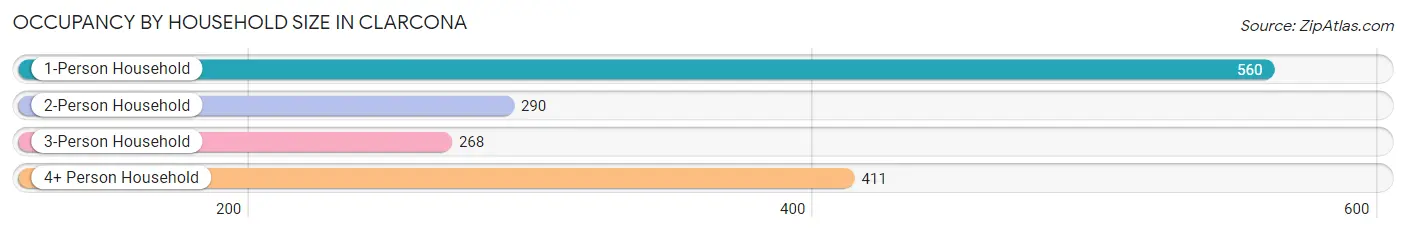
| Household Size | # Housing Units | % Housing Units |
| 1-Person Household | 560 | 36.6% |
| 2-Person Household | 290 | 19.0% |
| 3-Person Household | 268 | 17.5% |
| 4+ Person Household | 411 | 26.9% |
| Total Housing Units | 1,529 | 100.0% |
Occupancy by Ownership by Household Size in Clarcona
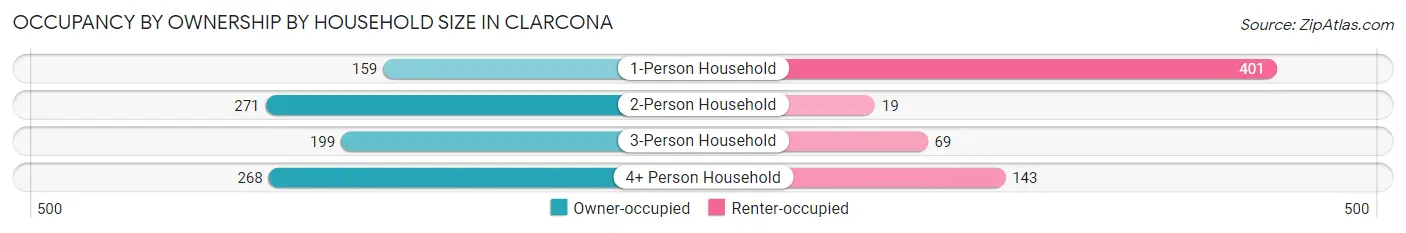
| Household Size | Owner-occupied | Renter-occupied |
| 1-Person Household | 159 (28.4%) | 401 (71.6%) |
| 2-Person Household | 271 (93.4%) | 19 (6.6%) |
| 3-Person Household | 199 (74.3%) | 69 (25.8%) |
| 4+ Person Household | 268 (65.2%) | 143 (34.8%) |
| Total Housing Units | 897 (58.7%) | 632 (41.3%) |
Occupancy by Educational Attainment in Clarcona
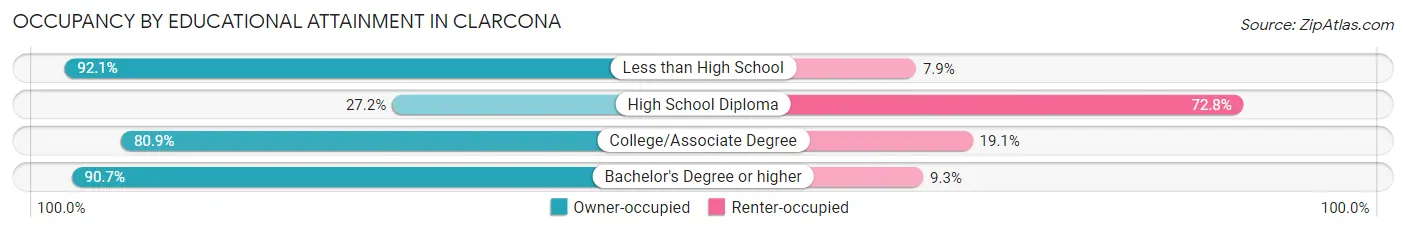
| Household Size | Owner-occupied | Renter-occupied |
| Less than High School | 140 (92.1%) | 12 (7.9%) |
| High School Diploma | 192 (27.2%) | 515 (72.8%) |
| College/Associate Degree | 351 (80.9%) | 83 (19.1%) |
| Bachelor's Degree or higher | 214 (90.7%) | 22 (9.3%) |
Occupancy by Age of Householder in Clarcona
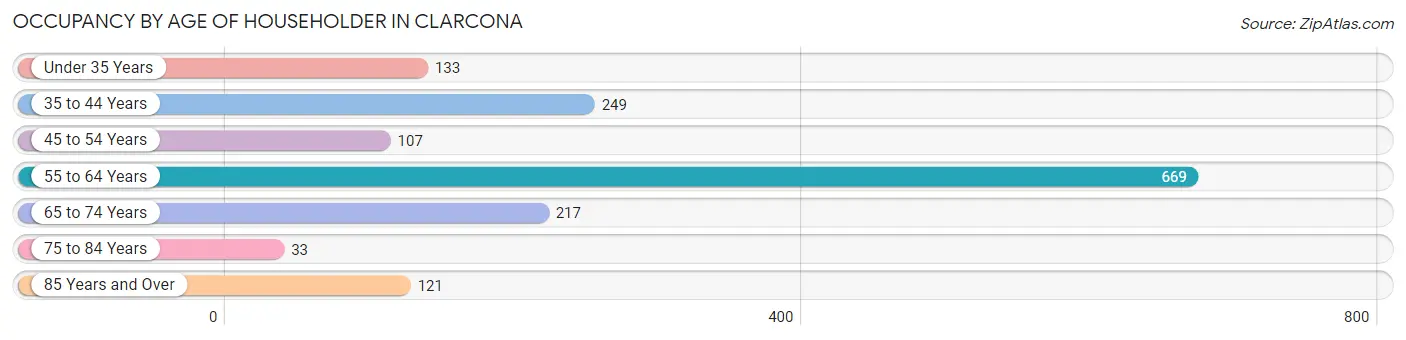
| Age Bracket | # Households | % Households |
| Under 35 Years | 133 | 8.7% |
| 35 to 44 Years | 249 | 16.3% |
| 45 to 54 Years | 107 | 7.0% |
| 55 to 64 Years | 669 | 43.8% |
| 65 to 74 Years | 217 | 14.2% |
| 75 to 84 Years | 33 | 2.2% |
| 85 Years and Over | 121 | 7.9% |
| Total | 1,529 | 100.0% |
Housing Finances in Clarcona
Median Income by Occupancy in Clarcona
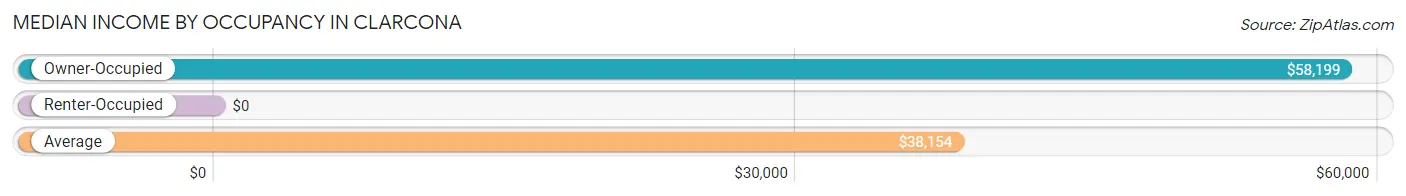
| Occupancy Type | # Households | Median Income |
| Owner-Occupied | 897 (58.7%) | $58,199 |
| Renter-Occupied | 632 (41.3%) | $0 |
| Average | 1,529 (100.0%) | $38,154 |
Occupancy by Householder Income Bracket in Clarcona
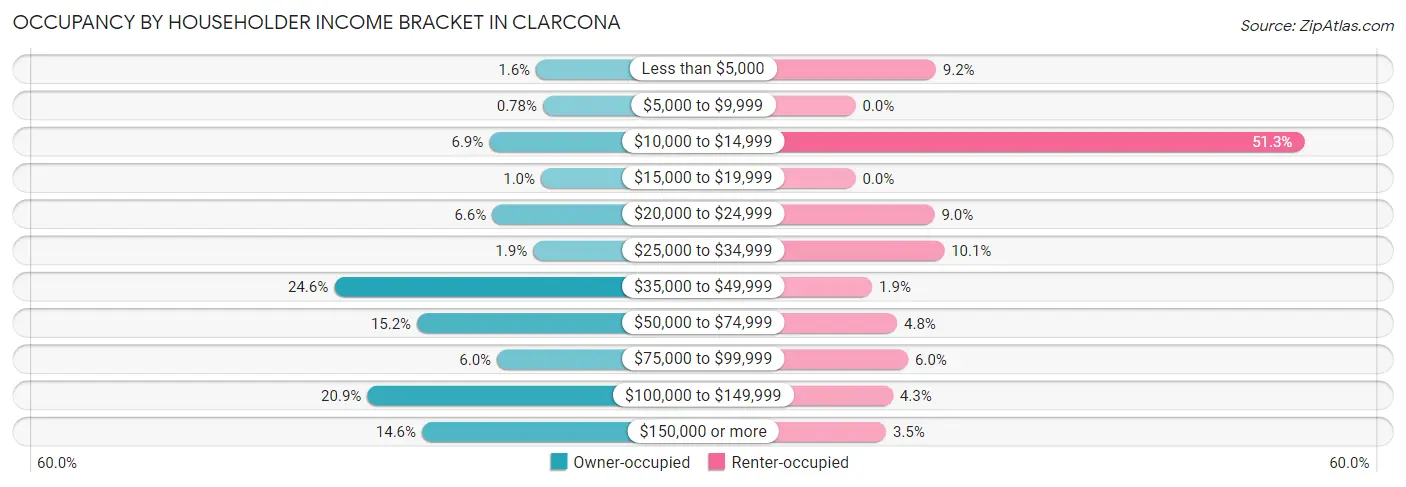
| Income Bracket | Owner-occupied | Renter-occupied |
| Less than $5,000 | 14 (1.6%) | 58 (9.2%) |
| $5,000 to $9,999 | 7 (0.8%) | 0 (0.0%) |
| $10,000 to $14,999 | 62 (6.9%) | 324 (51.3%) |
| $15,000 to $19,999 | 9 (1.0%) | 0 (0.0%) |
| $20,000 to $24,999 | 59 (6.6%) | 57 (9.0%) |
| $25,000 to $34,999 | 17 (1.9%) | 64 (10.1%) |
| $35,000 to $49,999 | 221 (24.6%) | 12 (1.9%) |
| $50,000 to $74,999 | 136 (15.2%) | 30 (4.8%) |
| $75,000 to $99,999 | 54 (6.0%) | 38 (6.0%) |
| $100,000 to $149,999 | 187 (20.8%) | 27 (4.3%) |
| $150,000 or more | 131 (14.6%) | 22 (3.5%) |
| Total | 897 (100.0%) | 632 (100.0%) |
Monthly Housing Cost Tiers in Clarcona
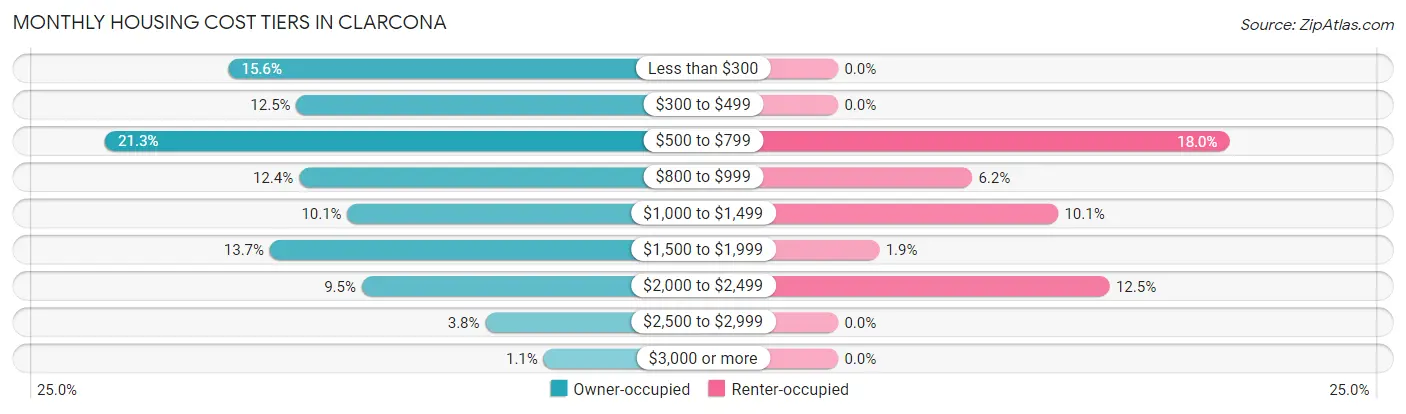
| Monthly Cost | Owner-occupied | Renter-occupied |
| Less than $300 | 140 (15.6%) | 0 (0.0%) |
| $300 to $499 | 112 (12.5%) | 0 (0.0%) |
| $500 to $799 | 191 (21.3%) | 114 (18.0%) |
| $800 to $999 | 111 (12.4%) | 39 (6.2%) |
| $1,000 to $1,499 | 91 (10.1%) | 64 (10.1%) |
| $1,500 to $1,999 | 123 (13.7%) | 12 (1.9%) |
| $2,000 to $2,499 | 85 (9.5%) | 79 (12.5%) |
| $2,500 to $2,999 | 34 (3.8%) | 0 (0.0%) |
| $3,000 or more | 10 (1.1%) | 0 (0.0%) |
| Total | 897 (100.0%) | 632 (100.0%) |
Physical Housing Characteristics in Clarcona
Housing Structures in Clarcona
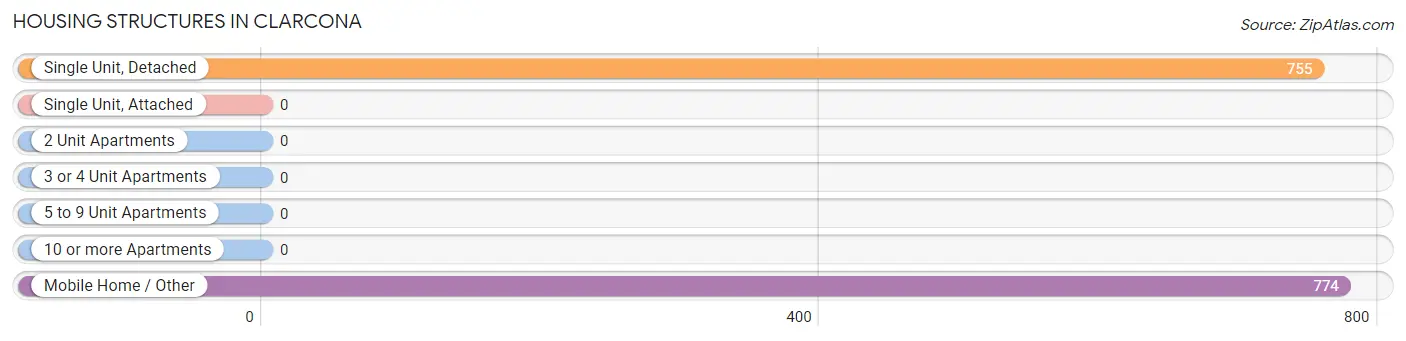
| Structure Type | # Housing Units | % Housing Units |
| Single Unit, Detached | 755 | 49.4% |
| Single Unit, Attached | 0 | 0.0% |
| 2 Unit Apartments | 0 | 0.0% |
| 3 or 4 Unit Apartments | 0 | 0.0% |
| 5 to 9 Unit Apartments | 0 | 0.0% |
| 10 or more Apartments | 0 | 0.0% |
| Mobile Home / Other | 774 | 50.6% |
| Total | 1,529 | 100.0% |
Housing Structures by Occupancy in Clarcona
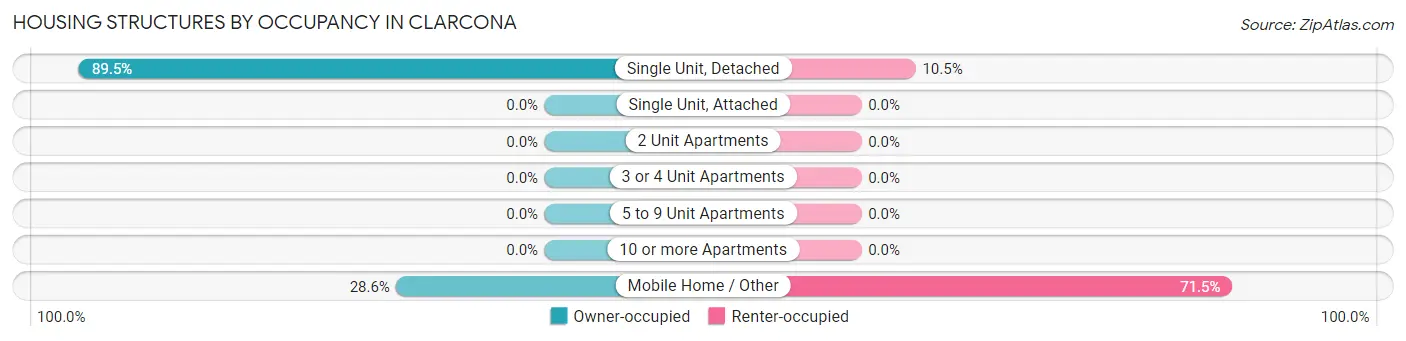
| Structure Type | Owner-occupied | Renter-occupied |
| Single Unit, Detached | 676 (89.5%) | 79 (10.5%) |
| Single Unit, Attached | 0 (0.0%) | 0 (0.0%) |
| 2 Unit Apartments | 0 (0.0%) | 0 (0.0%) |
| 3 or 4 Unit Apartments | 0 (0.0%) | 0 (0.0%) |
| 5 to 9 Unit Apartments | 0 (0.0%) | 0 (0.0%) |
| 10 or more Apartments | 0 (0.0%) | 0 (0.0%) |
| Mobile Home / Other | 221 (28.5%) | 553 (71.5%) |
| Total | 897 (58.7%) | 632 (41.3%) |
Housing Structures by Number of Rooms in Clarcona
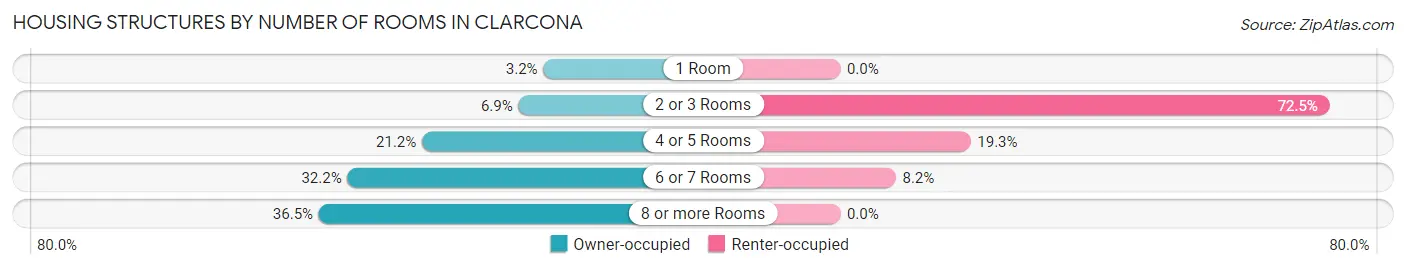
| Number of Rooms | Owner-occupied | Renter-occupied |
| 1 Room | 29 (3.2%) | 0 (0.0%) |
| 2 or 3 Rooms | 62 (6.9%) | 458 (72.5%) |
| 4 or 5 Rooms | 190 (21.2%) | 122 (19.3%) |
| 6 or 7 Rooms | 289 (32.2%) | 52 (8.2%) |
| 8 or more Rooms | 327 (36.4%) | 0 (0.0%) |
| Total | 897 (100.0%) | 632 (100.0%) |
Housing Structure by Heating Type in Clarcona
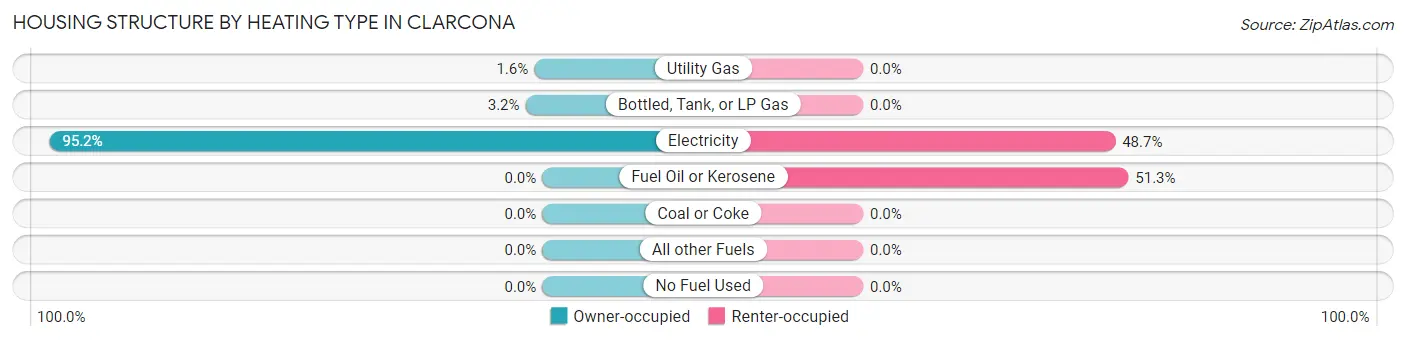
| Heating Type | Owner-occupied | Renter-occupied |
| Utility Gas | 14 (1.6%) | 0 (0.0%) |
| Bottled, Tank, or LP Gas | 29 (3.2%) | 0 (0.0%) |
| Electricity | 854 (95.2%) | 308 (48.7%) |
| Fuel Oil or Kerosene | 0 (0.0%) | 324 (51.3%) |
| Coal or Coke | 0 (0.0%) | 0 (0.0%) |
| All other Fuels | 0 (0.0%) | 0 (0.0%) |
| No Fuel Used | 0 (0.0%) | 0 (0.0%) |
| Total | 897 (100.0%) | 632 (100.0%) |
Household Vehicle Usage in Clarcona
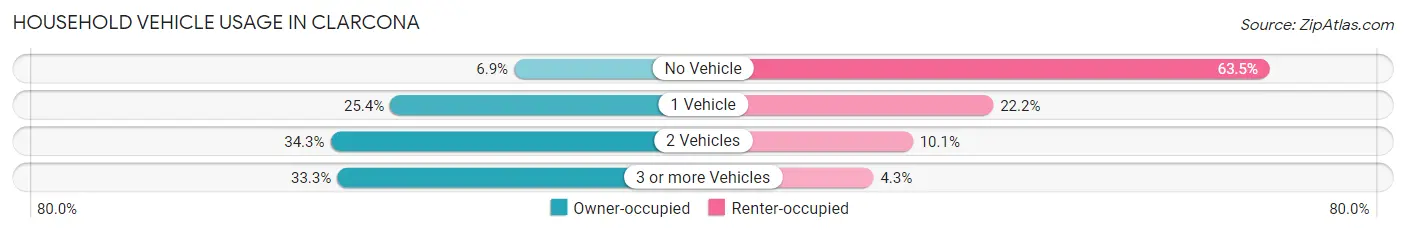
| Vehicles per Household | Owner-occupied | Renter-occupied |
| No Vehicle | 62 (6.9%) | 401 (63.4%) |
| 1 Vehicle | 228 (25.4%) | 140 (22.2%) |
| 2 Vehicles | 308 (34.3%) | 64 (10.1%) |
| 3 or more Vehicles | 299 (33.3%) | 27 (4.3%) |
| Total | 897 (100.0%) | 632 (100.0%) |
Real Estate & Mortgages in Clarcona
Real Estate and Mortgage Overview in Clarcona
| Characteristic | Without Mortgage | With Mortgage |
| Housing Units | 621 | 276 |
| Median Property Value | - | - |
| Median Household Income | $41,719 | $81 |
| Monthly Housing Costs | $554 | $10 |
| Real Estate Taxes | - | - |
Property Value by Mortgage Status in Clarcona
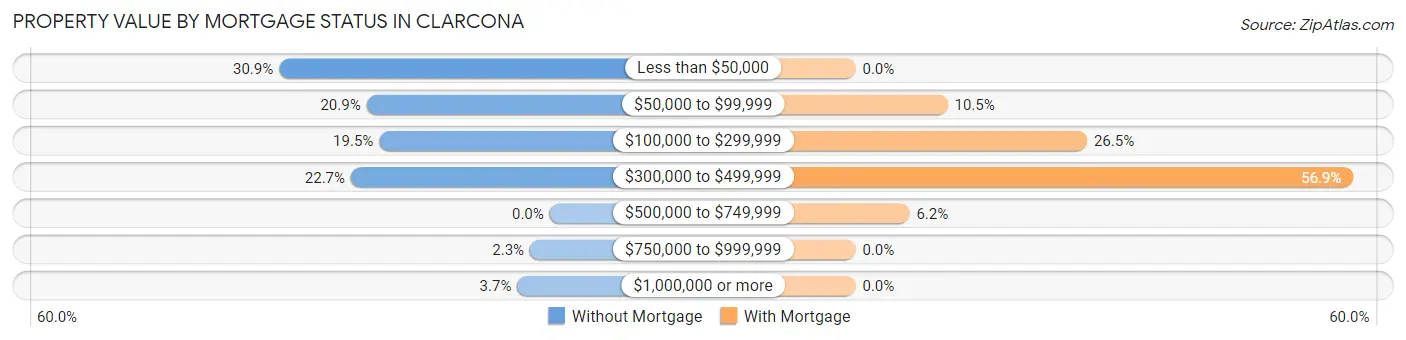
| Property Value | Without Mortgage | With Mortgage |
| Less than $50,000 | 192 (30.9%) | 0 (0.0%) |
| $50,000 to $99,999 | 130 (20.9%) | 29 (10.5%) |
| $100,000 to $299,999 | 121 (19.5%) | 73 (26.5%) |
| $300,000 to $499,999 | 141 (22.7%) | 157 (56.9%) |
| $500,000 to $749,999 | 0 (0.0%) | 17 (6.2%) |
| $750,000 to $999,999 | 14 (2.2%) | 0 (0.0%) |
| $1,000,000 or more | 23 (3.7%) | 0 (0.0%) |
| Total | 621 (100.0%) | 276 (100.0%) |
Household Income by Mortgage Status in Clarcona
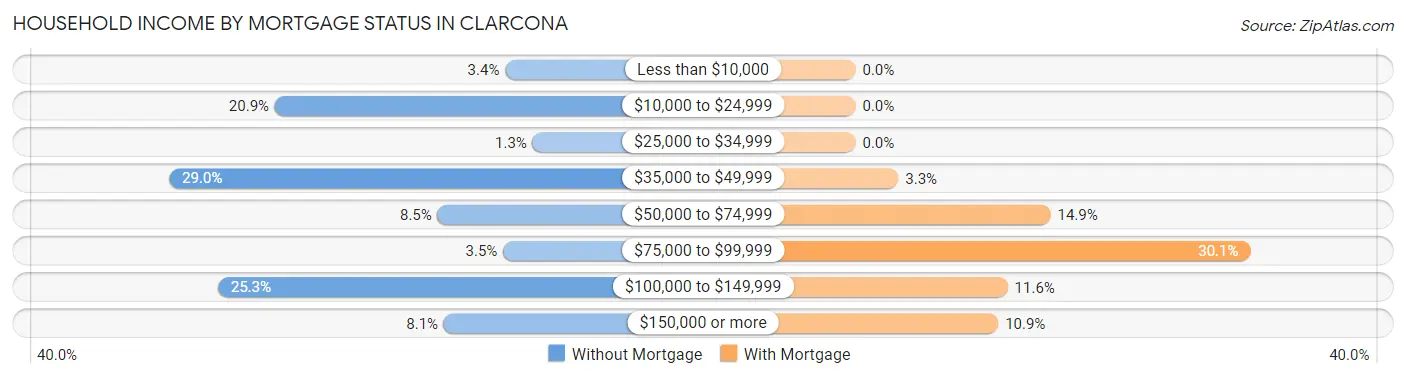
| Household Income | Without Mortgage | With Mortgage |
| Less than $10,000 | 21 (3.4%) | 0 (0.0%) |
| $10,000 to $24,999 | 130 (20.9%) | 0 (0.0%) |
| $25,000 to $34,999 | 8 (1.3%) | 0 (0.0%) |
| $35,000 to $49,999 | 180 (29.0%) | 9 (3.3%) |
| $50,000 to $74,999 | 53 (8.5%) | 41 (14.9%) |
| $75,000 to $99,999 | 22 (3.5%) | 83 (30.1%) |
| $100,000 to $149,999 | 157 (25.3%) | 32 (11.6%) |
| $150,000 or more | 50 (8.1%) | 30 (10.9%) |
| Total | 621 (100.0%) | 276 (100.0%) |
Property Value to Household Income Ratio in Clarcona
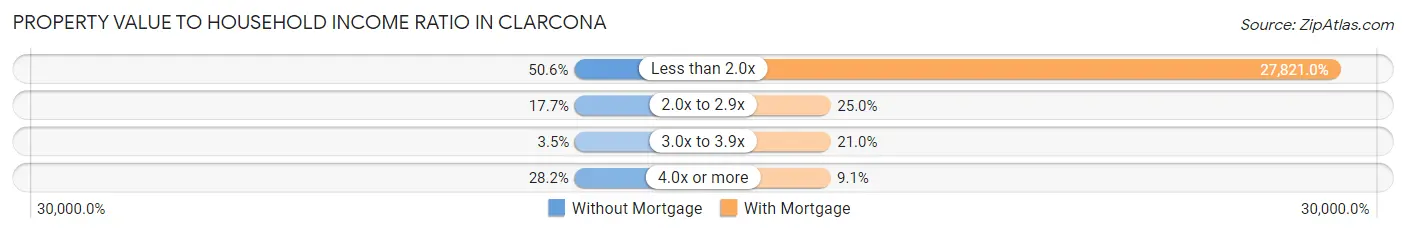
| Value-to-Income Ratio | Without Mortgage | With Mortgage |
| Less than 2.0x | 314 (50.6%) | 76,786 (27,821.0%) |
| 2.0x to 2.9x | 110 (17.7%) | 69 (25.0%) |
| 3.0x to 3.9x | 22 (3.5%) | 58 (21.0%) |
| 4.0x or more | 175 (28.2%) | 25 (9.1%) |
| Total | 621 (100.0%) | 276 (100.0%) |
Real Estate Taxes by Mortgage Status in Clarcona

| Property Taxes | Without Mortgage | With Mortgage |
| Less than $800 | 69 (11.1%) | 0 (0.0%) |
| $800 to $1,499 | 119 (19.2%) | 25 (9.1%) |
| $800 to $1,499 | 182 (29.3%) | 0 (0.0%) |
| Total | 621 (100.0%) | 276 (100.0%) |
Health & Disability in Clarcona
Health Insurance Coverage by Age in Clarcona
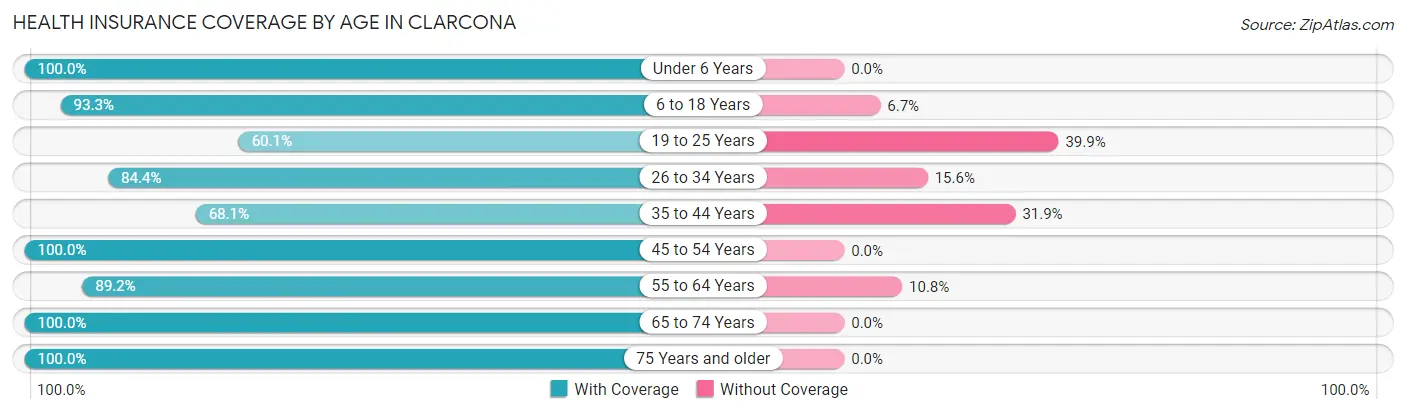
| Age Bracket | With Coverage | Without Coverage |
| Under 6 Years | 637 (100.0%) | 0 (0.0%) |
| 6 to 18 Years | 388 (93.3%) | 28 (6.7%) |
| 19 to 25 Years | 212 (60.1%) | 141 (39.9%) |
| 26 to 34 Years | 228 (84.4%) | 42 (15.6%) |
| 35 to 44 Years | 433 (68.1%) | 203 (31.9%) |
| 45 to 54 Years | 237 (100.0%) | 0 (0.0%) |
| 55 to 64 Years | 828 (89.2%) | 100 (10.8%) |
| 65 to 74 Years | 419 (100.0%) | 0 (0.0%) |
| 75 Years and older | 232 (100.0%) | 0 (0.0%) |
| Total | 3,614 (87.5%) | 514 (12.4%) |
Health Insurance Coverage by Citizenship Status in Clarcona
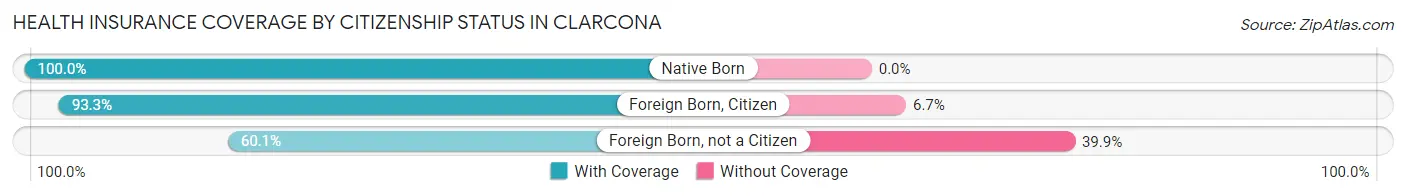
| Citizenship Status | With Coverage | Without Coverage |
| Native Born | 637 (100.0%) | 0 (0.0%) |
| Foreign Born, Citizen | 388 (93.3%) | 28 (6.7%) |
| Foreign Born, not a Citizen | 212 (60.1%) | 141 (39.9%) |
Health Insurance Coverage by Household Income in Clarcona
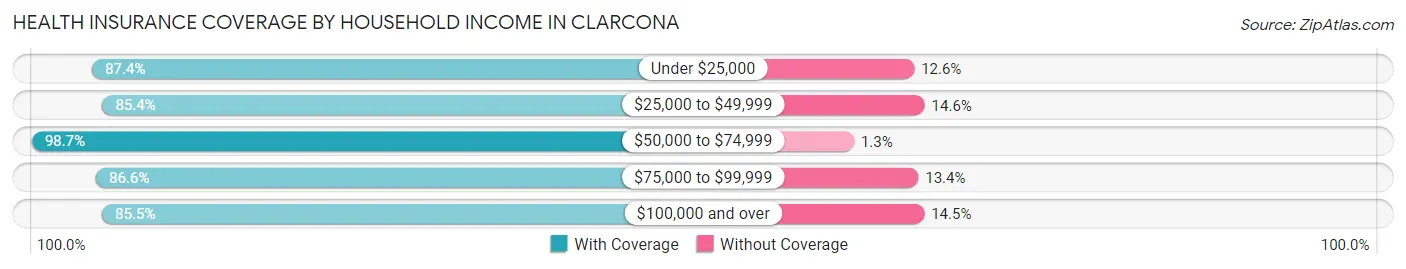
| Household Income | With Coverage | Without Coverage |
| Under $25,000 | 685 (87.4%) | 99 (12.6%) |
| $25,000 to $49,999 | 978 (85.4%) | 167 (14.6%) |
| $50,000 to $74,999 | 515 (98.7%) | 7 (1.3%) |
| $75,000 to $99,999 | 181 (86.6%) | 28 (13.4%) |
| $100,000 and over | 1,255 (85.5%) | 213 (14.5%) |
Public vs Private Health Insurance Coverage by Age in Clarcona
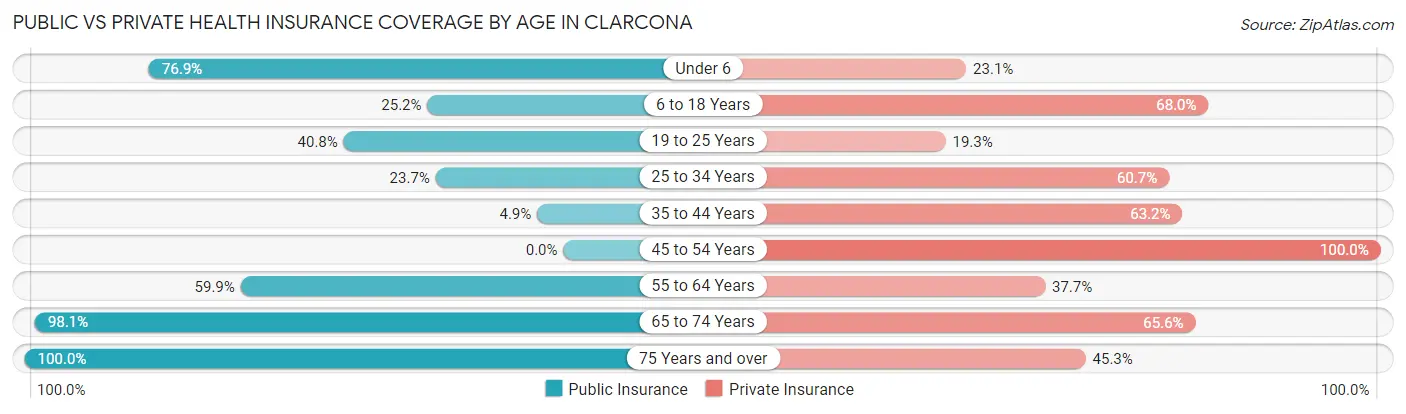
| Age Bracket | Public Insurance | Private Insurance |
| Under 6 | 490 (76.9%) | 147 (23.1%) |
| 6 to 18 Years | 105 (25.2%) | 283 (68.0%) |
| 19 to 25 Years | 144 (40.8%) | 68 (19.3%) |
| 25 to 34 Years | 64 (23.7%) | 164 (60.7%) |
| 35 to 44 Years | 31 (4.9%) | 402 (63.2%) |
| 45 to 54 Years | 0 (0.0%) | 237 (100.0%) |
| 55 to 64 Years | 556 (59.9%) | 350 (37.7%) |
| 65 to 74 Years | 411 (98.1%) | 275 (65.6%) |
| 75 Years and over | 232 (100.0%) | 105 (45.3%) |
| Total | 2,033 (49.2%) | 2,031 (49.2%) |
Disability Status by Sex by Age in Clarcona
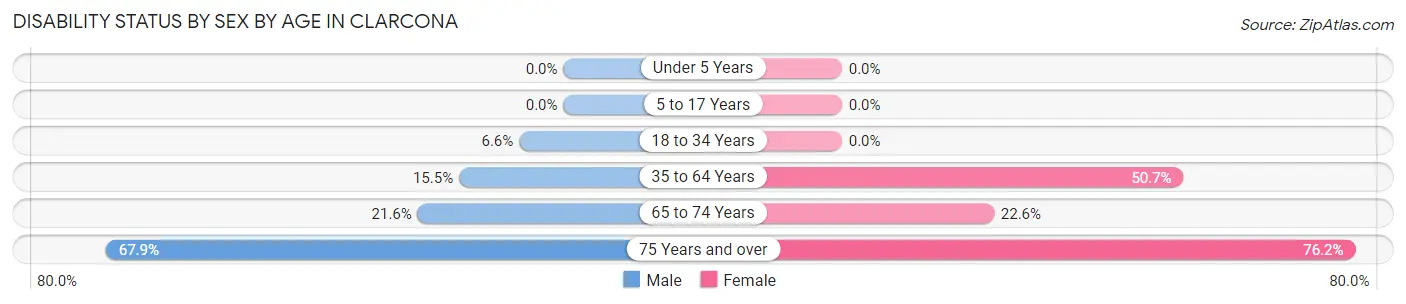
| Age Bracket | Male | Female |
| Under 5 Years | 0 (0.0%) | 0 (0.0%) |
| 5 to 17 Years | 0 (0.0%) | 0 (0.0%) |
| 18 to 34 Years | 9 (6.6%) | 0 (0.0%) |
| 35 to 64 Years | 131 (15.5%) | 485 (50.7%) |
| 65 to 74 Years | 37 (21.6%) | 56 (22.6%) |
| 75 Years and over | 89 (67.9%) | 77 (76.2%) |
Disability Class by Sex by Age in Clarcona
Disability Class: Hearing Difficulty
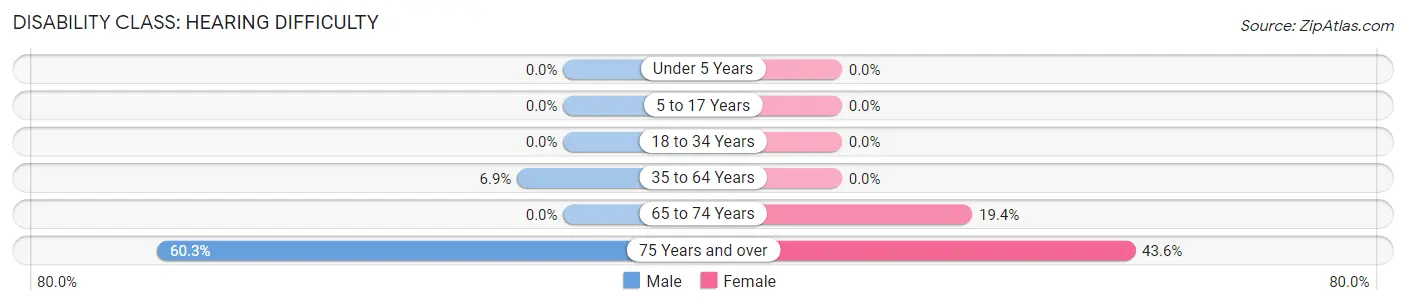
| Age Bracket | Male | Female |
| Under 5 Years | 0 (0.0%) | 0 (0.0%) |
| 5 to 17 Years | 0 (0.0%) | 0 (0.0%) |
| 18 to 34 Years | 0 (0.0%) | 0 (0.0%) |
| 35 to 64 Years | 58 (6.9%) | 0 (0.0%) |
| 65 to 74 Years | 0 (0.0%) | 48 (19.4%) |
| 75 Years and over | 79 (60.3%) | 44 (43.6%) |
Disability Class: Vision Difficulty
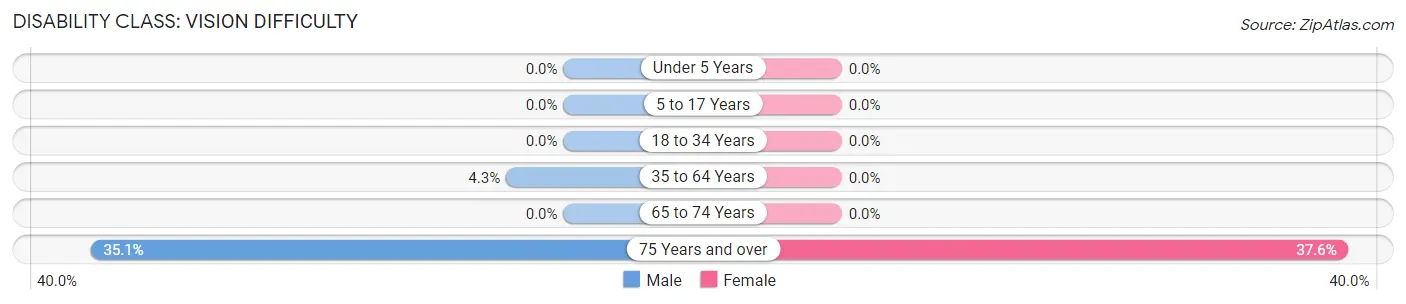
| Age Bracket | Male | Female |
| Under 5 Years | 0 (0.0%) | 0 (0.0%) |
| 5 to 17 Years | 0 (0.0%) | 0 (0.0%) |
| 18 to 34 Years | 0 (0.0%) | 0 (0.0%) |
| 35 to 64 Years | 36 (4.3%) | 0 (0.0%) |
| 65 to 74 Years | 0 (0.0%) | 0 (0.0%) |
| 75 Years and over | 46 (35.1%) | 38 (37.6%) |
Disability Class: Cognitive Difficulty
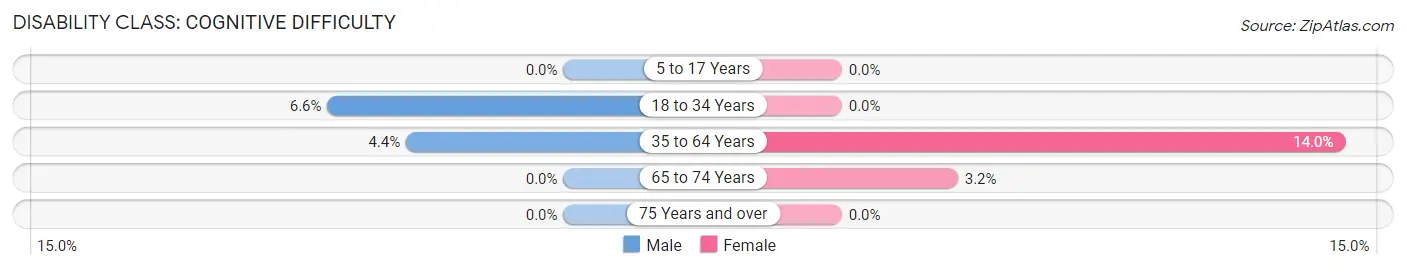
| Age Bracket | Male | Female |
| 5 to 17 Years | 0 (0.0%) | 0 (0.0%) |
| 18 to 34 Years | 9 (6.6%) | 0 (0.0%) |
| 35 to 64 Years | 37 (4.4%) | 134 (14.0%) |
| 65 to 74 Years | 0 (0.0%) | 8 (3.2%) |
| 75 Years and over | 0 (0.0%) | 0 (0.0%) |
Disability Class: Ambulatory Difficulty
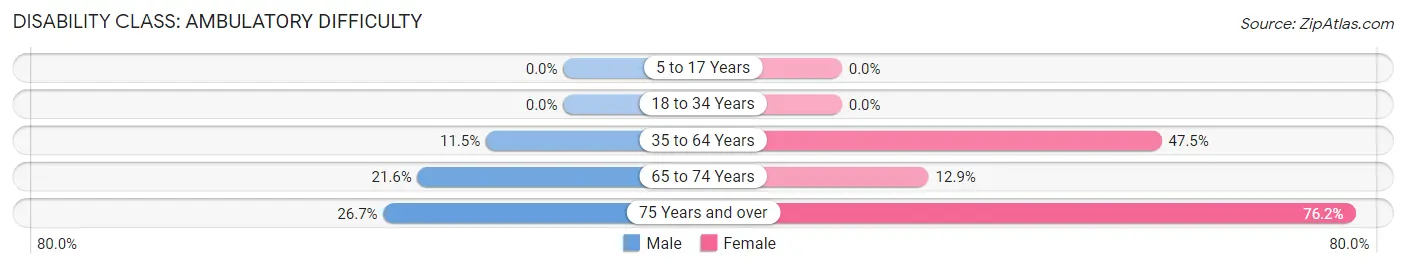
| Age Bracket | Male | Female |
| 5 to 17 Years | 0 (0.0%) | 0 (0.0%) |
| 18 to 34 Years | 0 (0.0%) | 0 (0.0%) |
| 35 to 64 Years | 97 (11.5%) | 454 (47.5%) |
| 65 to 74 Years | 37 (21.6%) | 32 (12.9%) |
| 75 Years and over | 35 (26.7%) | 77 (76.2%) |
Disability Class: Self-Care Difficulty
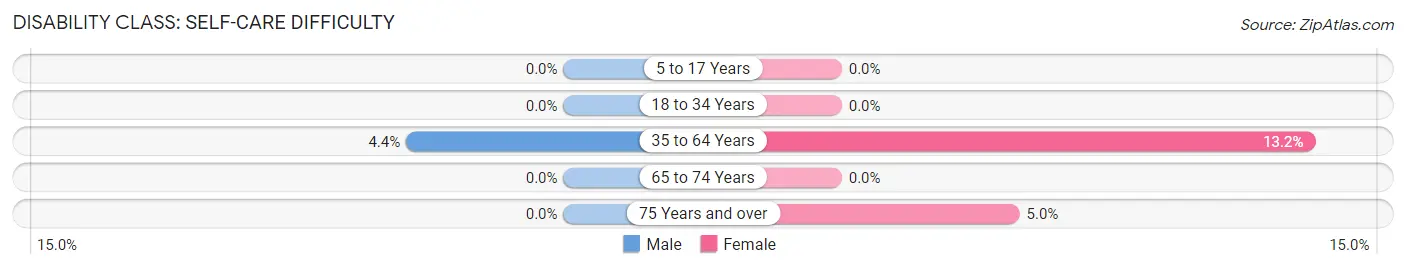
| Age Bracket | Male | Female |
| 5 to 17 Years | 0 (0.0%) | 0 (0.0%) |
| 18 to 34 Years | 0 (0.0%) | 0 (0.0%) |
| 35 to 64 Years | 37 (4.4%) | 126 (13.2%) |
| 65 to 74 Years | 0 (0.0%) | 0 (0.0%) |
| 75 Years and over | 0 (0.0%) | 5 (5.0%) |
Technology Access in Clarcona
Computing Device Access in Clarcona
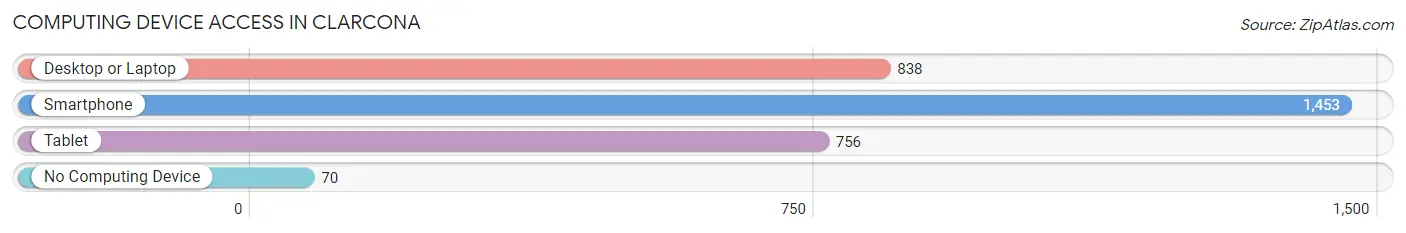
| Device Type | # Households | % Households |
| Desktop or Laptop | 838 | 54.8% |
| Smartphone | 1,453 | 95.0% |
| Tablet | 756 | 49.4% |
| No Computing Device | 70 | 4.6% |
| Total | 1,529 | 100.0% |
Internet Access in Clarcona
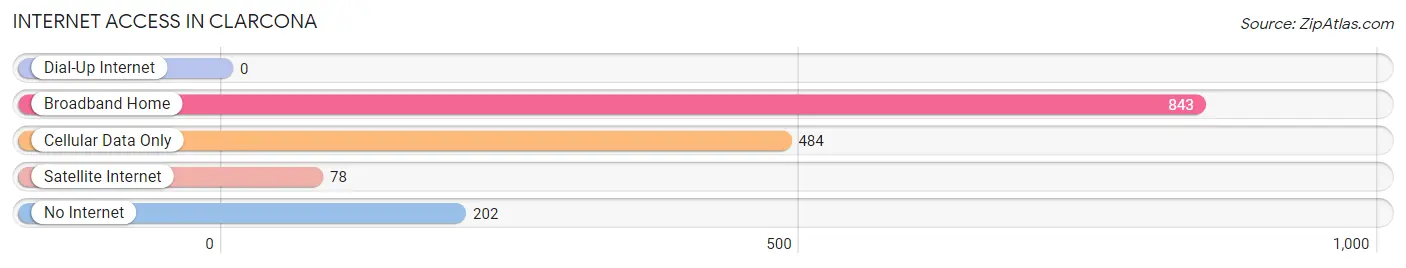
| Internet Type | # Households | % Households |
| Dial-Up Internet | 0 | 0.0% |
| Broadband Home | 843 | 55.1% |
| Cellular Data Only | 484 | 31.7% |
| Satellite Internet | 78 | 5.1% |
| No Internet | 202 | 13.2% |
| Total | 1,529 | 100.0% |
Clarcona Summary
Concorda, Florida is a small unincorporated community located in Orange County, Florida. It is situated in the northwest corner of the county, just south of Apopka and north of Ocoee. The population of Concorda was estimated to be around 2,000 in 2000.
Geography
Concorda is located in the northwest corner of Orange County, Florida. It is situated between Apopka and Ocoee, and is bordered by the cities of Winter Garden and Windermere. The community is located on the western edge of the Orlando metropolitan area, and is approximately 20 miles from downtown Orlando. The terrain of Concorda is mostly flat, with some rolling hills. The area is mostly rural, with some residential and commercial development.
History
Concorda was originally settled in the late 1800s by settlers from the nearby town of Apopka. The area was primarily used for farming and ranching, and the community was known as “Concorda” due to the peaceful nature of the area. In the early 1900s, the area began to experience rapid growth due to the development of the nearby Orlando area. The population of Concorda increased significantly, and the community began to develop into a small town.
In the 1950s, the area experienced a period of rapid growth due to the development of the nearby Walt Disney World Resort. This led to an influx of new residents and businesses, and the population of Concorda increased significantly. The community continued to grow throughout the late 20th century, and by 2000, the population was estimated to be around 2,000.
Economy
The economy of Concorda is primarily based on tourism and retail. The area is home to several tourist attractions, including the nearby Walt Disney World Resort, Universal Studios, and SeaWorld. The area is also home to several retail stores, restaurants, and other businesses. The area is also home to several industrial and manufacturing businesses, as well as a number of agricultural operations.
Demographics
As of the 2000 census, the population of Concorda was estimated to be around 2,000. The racial makeup of the community was 79.3% White, 14.2% African American, 0.7% Native American, 0.7% Asian, 0.1% Pacific Islander, and 4.9% from other races. The median household income was $37,500, and the median family income was $41,250. The per capita income was $17,845.
Conclusion
Concorda, Florida is a small unincorporated community located in Orange County, Florida. It is situated in the northwest corner of the county, just south of Apopka and north of Ocoee. The population of Concorda was estimated to be around 2,000 in 2000. The economy of Concorda is primarily based on tourism and retail, and the area is home to several tourist attractions, retail stores, restaurants, and other businesses. The racial makeup of the community was 79.3% White, 14.2% African American, 0.7% Native American, 0.7% Asian, 0.1% Pacific Islander, and 4.9% from other races. The median household income was $37,500, and the median family income was $41,250. The per capita income was $17,845.
Common Questions
What is the Total Population of Clarcona?
Total Population of Clarcona is 4,128.
What is the Total Male Population of Clarcona?
Total Male Population of Clarcona is 1,719.
What is the Total Female Population of Clarcona?
Total Female Population of Clarcona is 2,409.
What is the Ratio of Males per 100 Females in Clarcona?
There are 71.36 Males per 100 Females in Clarcona.
What is the Ratio of Females per 100 Males in Clarcona?
There are 140.14 Females per 100 Males in Clarcona.
What is the Median Population Age in Clarcona?
Median Population Age in Clarcona is 39.5 Years.
What is the Average Family Size in Clarcona
Average Family Size in Clarcona is 3.6 People.
What is the Average Household Size in Clarcona
Average Household Size in Clarcona is 2.7 People.
What is Per Capita Income in Clarcona?
Per Capita income in Clarcona is $28,744.
What is the Median Family Income in Clarcona?
Median Family Income in Clarcona is $60,375.
What is the Median Household income in Clarcona?
Median Household Income in Clarcona is $38,154.
What is Income or Wage Gap in Clarcona?
Income or Wage Gap in Clarcona is 24.3%.
Women in Clarcona earn 75.7 cents for every dollar earned by a man.
What is Inequality or Gini Index in Clarcona?
Inequality or Gini Index in Clarcona is 0.60.
How Large is the Labor Force in Clarcona?
There are 1,500 People in the Labor Forcein in Clarcona.
What is the Percentage of People in the Labor Force in Clarcona?
48.3% of People are in the Labor Force in Clarcona.
What is the Unemployment Rate in Clarcona?
Unemployment Rate in Clarcona is 1.3%.