Chumuckla, FL
Chumuckla Map
Chumuckla Overview
991
TOTAL POPULATION
575
MALE POPULATION
416
FEMALE POPULATION
138.22
MALES / 100 FEMALES
72.35
FEMALES / 100 MALES
36.9
MEDIAN AGE
3.6
AVG FAMILY SIZE
2.7
AVG HOUSEHOLD SIZE
$47,299
PER CAPITA INCOME
$119,130
AVG FAMILY INCOME
$103,727
AVG HOUSEHOLD INCOME
0.36
INEQUALITY / GINI INDEX
542
LABOR FORCE [ PEOPLE ]
66.8%
PERCENT IN LABOR FORCE
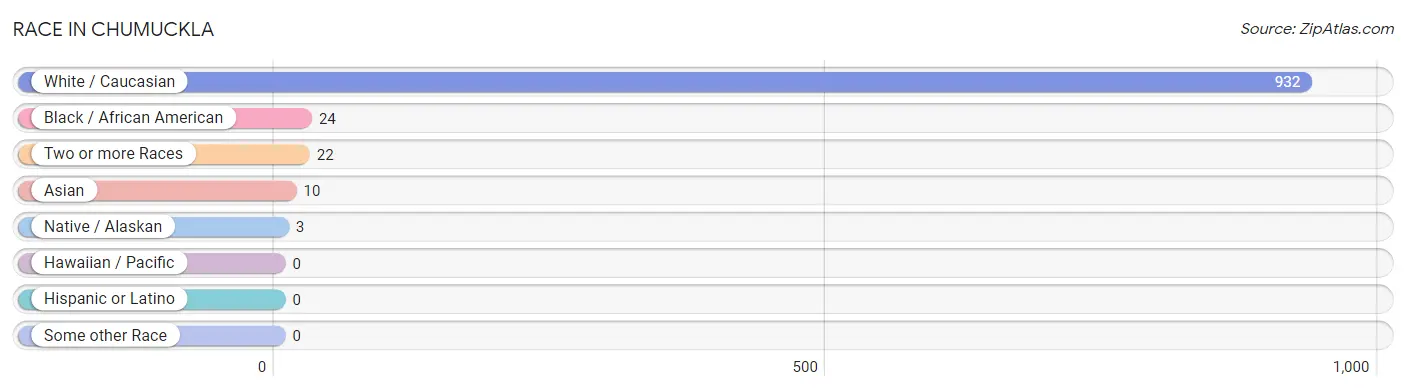
Race in Chumuckla
The most populous races in Chumuckla are White / Caucasian (932 | 94.1%), Black / African American (24 | 2.4%), and Two or more Races (22 | 2.2%).
| Race | # Population | % Population |
| Asian | 10 | 1.0% |
| Black / African American | 24 | 2.4% |
| Hawaiian / Pacific | 0 | 0.0% |
| Hispanic or Latino | 0 | 0.0% |
| Native / Alaskan | 3 | 0.3% |
| White / Caucasian | 932 | 94.1% |
| Two or more Races | 22 | 2.2% |
| Some other Race | 0 | 0.0% |
| Total | 991 | 100.0% |
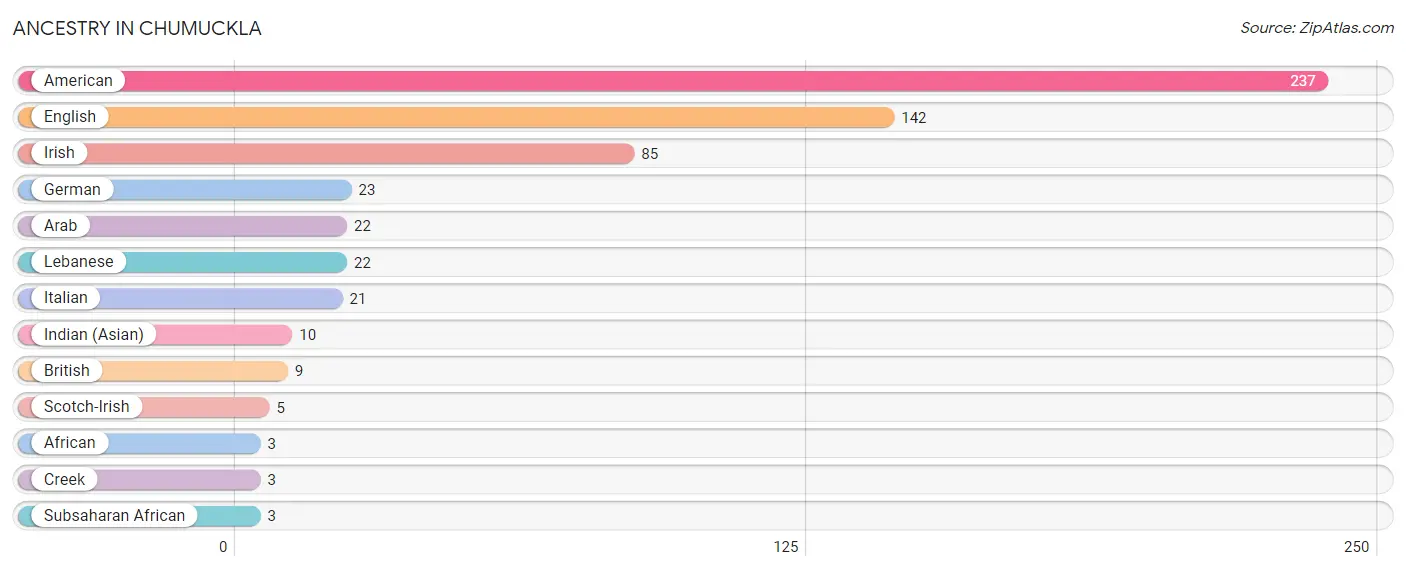
Ancestry in Chumuckla
The most populous ancestries reported in Chumuckla are American (237 | 23.9%), English (142 | 14.3%), Irish (85 | 8.6%), German (23 | 2.3%), and Arab (22 | 2.2%), together accounting for 51.4% of all Chumuckla residents.
| Ancestry | # Population | % Population |
| African | 3 | 0.3% |
| American | 237 | 23.9% |
| Arab | 22 | 2.2% |
| British | 9 | 0.9% |
| Creek | 3 | 0.3% |
| English | 142 | 14.3% |
| German | 23 | 2.3% |
| Indian (Asian) | 10 | 1.0% |
| Irish | 85 | 8.6% |
| Italian | 21 | 2.1% |
| Lebanese | 22 | 2.2% |
| Scotch-Irish | 5 | 0.5% |
| Subsaharan African | 3 | 0.3% | View All 13 Rows |
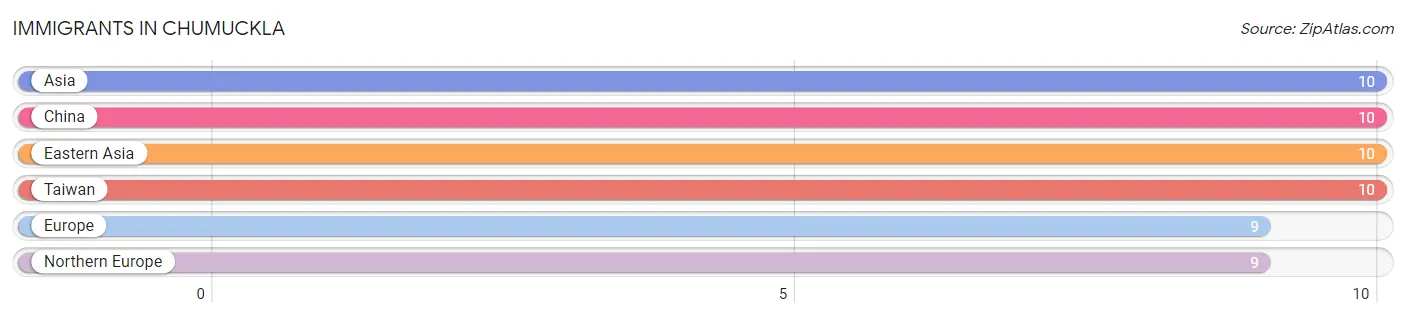
Immigrants in Chumuckla
The most numerous immigrant groups reported in Chumuckla came from Asia (10 | 1.0%), China (10 | 1.0%), Eastern Asia (10 | 1.0%), Taiwan (10 | 1.0%), and Europe (9 | 0.9%), together accounting for 5.0% of all Chumuckla residents.
| Immigration Origin | # Population | % Population |
| Asia | 10 | 1.0% |
| China | 10 | 1.0% |
| Eastern Asia | 10 | 1.0% |
| Europe | 9 | 0.9% |
| Northern Europe | 9 | 0.9% |
| Taiwan | 10 | 1.0% | View All 6 Rows |
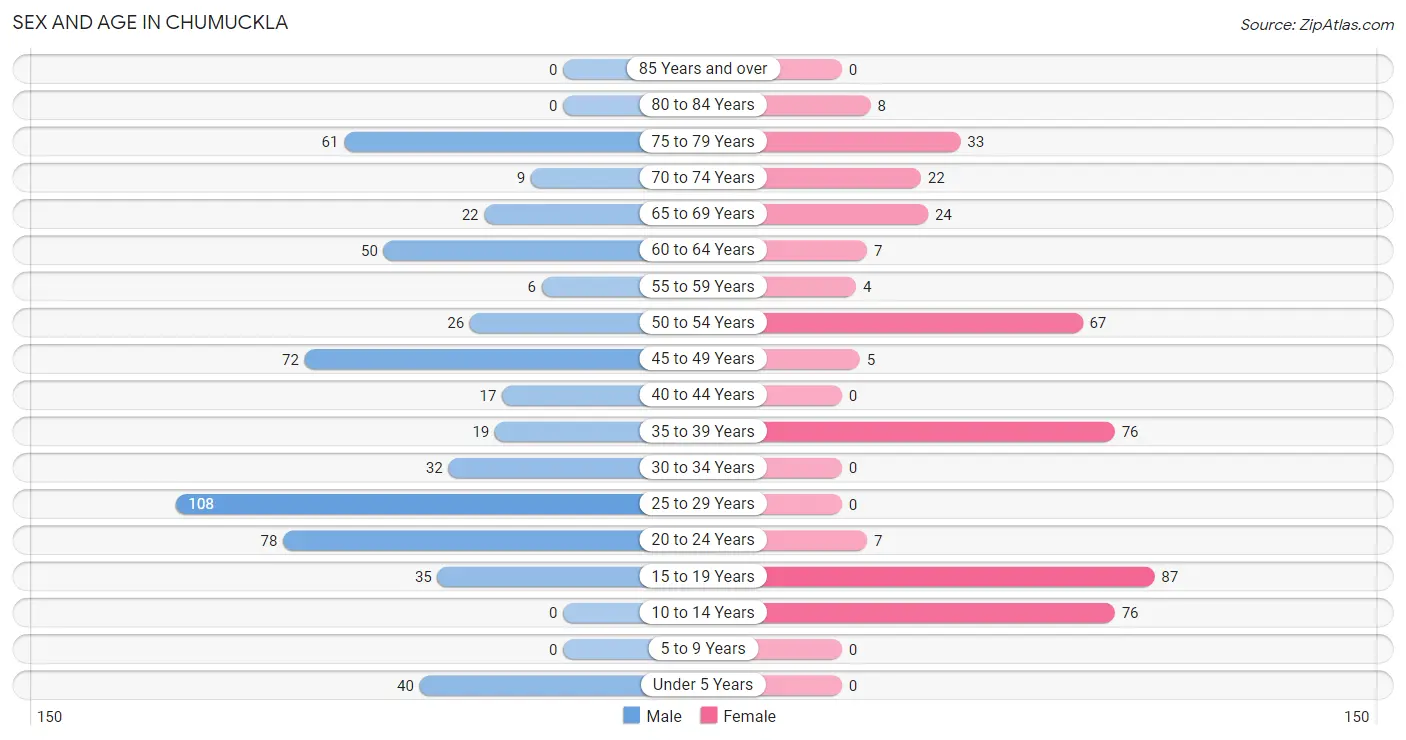
Sex and Age in Chumuckla
Sex and Age in Chumuckla
The most populous age groups in Chumuckla are 25 to 29 Years (108 | 18.8%) for men and 15 to 19 Years (87 | 20.9%) for women.
| Age Bracket | Male | Female |
| Under 5 Years | 40 (7.0%) | 0 (0.0%) |
| 5 to 9 Years | 0 (0.0%) | 0 (0.0%) |
| 10 to 14 Years | 0 (0.0%) | 76 (18.3%) |
| 15 to 19 Years | 35 (6.1%) | 87 (20.9%) |
| 20 to 24 Years | 78 (13.6%) | 7 (1.7%) |
| 25 to 29 Years | 108 (18.8%) | 0 (0.0%) |
| 30 to 34 Years | 32 (5.6%) | 0 (0.0%) |
| 35 to 39 Years | 19 (3.3%) | 76 (18.3%) |
| 40 to 44 Years | 17 (3.0%) | 0 (0.0%) |
| 45 to 49 Years | 72 (12.5%) | 5 (1.2%) |
| 50 to 54 Years | 26 (4.5%) | 67 (16.1%) |
| 55 to 59 Years | 6 (1.0%) | 4 (1.0%) |
| 60 to 64 Years | 50 (8.7%) | 7 (1.7%) |
| 65 to 69 Years | 22 (3.8%) | 24 (5.8%) |
| 70 to 74 Years | 9 (1.6%) | 22 (5.3%) |
| 75 to 79 Years | 61 (10.6%) | 33 (7.9%) |
| 80 to 84 Years | 0 (0.0%) | 8 (1.9%) |
| 85 Years and over | 0 (0.0%) | 0 (0.0%) |
| Total | 575 (100.0%) | 416 (100.0%) |
Families and Households in Chumuckla
Median Family Size in Chumuckla
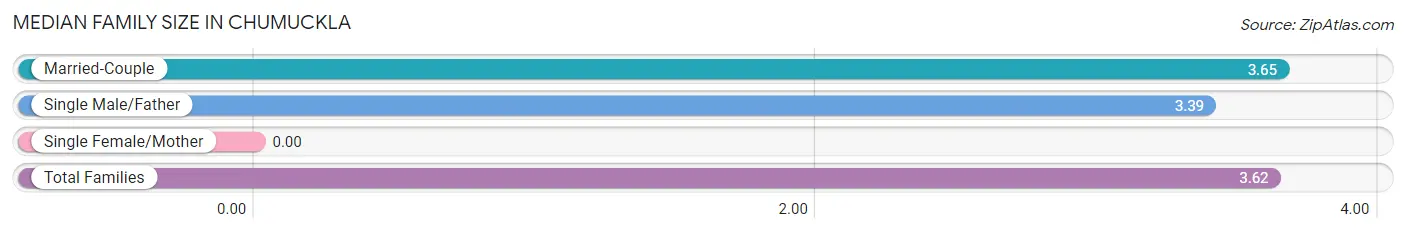
| Family Type | # Families | Family Size |
| Married-Couple | 197 (89.5%) | 3.65 |
| Single Male/Father | 23 (10.4%) | 3.39 |
| Single Female/Mother | 0 (0.0%) | - |
| Total Families | 220 (100.0%) | 3.62 |
Median Household Size in Chumuckla
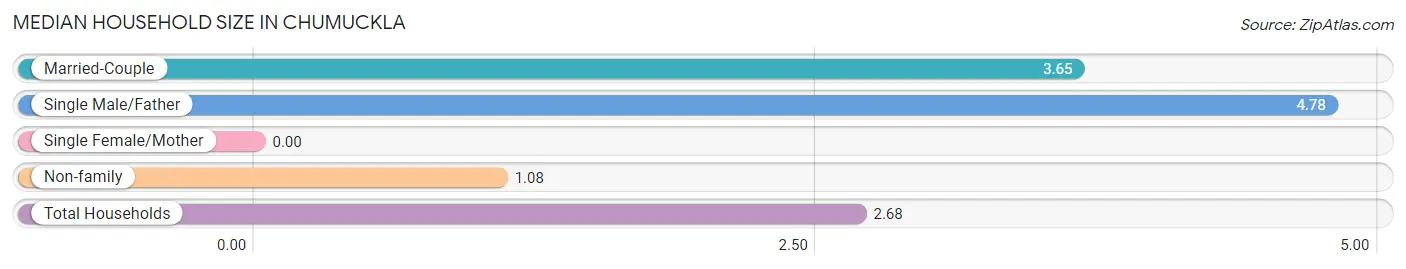
| Household Type | # Households | Household Size |
| Married-Couple | 197 (53.2%) | 3.65 |
| Single Male/Father | 23 (6.2%) | 4.78 |
| Single Female/Mother | 0 (0.0%) | - |
| Non-family | 150 (40.5%) | 1.08 |
| Total Households | 370 (100.0%) | 2.68 |
Household Size by Marriage Status in Chumuckla
Out of a total of 370 households in Chumuckla, 220 (59.5%) are family households, while 150 (40.5%) are nonfamily households. The most numerous type of family households are 2-person households, comprising 80, and the most common type of nonfamily households are 1-person households, comprising 144.
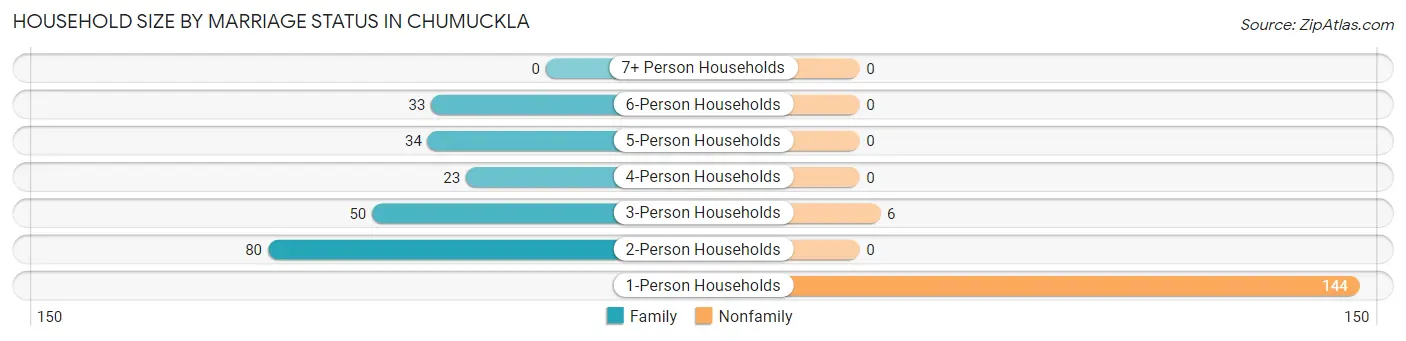
| Household Size | Family Households | Nonfamily Households |
| 1-Person Households | - | 144 (38.9%) |
| 2-Person Households | 80 (21.6%) | 0 (0.0%) |
| 3-Person Households | 50 (13.5%) | 6 (1.6%) |
| 4-Person Households | 23 (6.2%) | 0 (0.0%) |
| 5-Person Households | 34 (9.2%) | 0 (0.0%) |
| 6-Person Households | 33 (8.9%) | 0 (0.0%) |
| 7+ Person Households | 0 (0.0%) | 0 (0.0%) |
| Total | 220 (59.5%) | 150 (40.5%) |
Female Fertility in Chumuckla
Fertility by Age in Chumuckla
| Age Bracket | Women with Births | Births / 1,000 Women |
| 15 to 19 years | 0 (0.0%) | 0.0 |
| 20 to 34 years | 0 (0.0%) | 0.0 |
| 35 to 50 years | 0 (0.0%) | 0.0 |
| Total | 0 (0.0%) | 0.0 |
Fertility by Age by Marriage Status in Chumuckla
| Age Bracket | Married | Unmarried |
| 15 to 19 years | 0 (0.0%) | 0 (0.0%) |
| 20 to 34 years | 0 (0.0%) | 0 (0.0%) |
| 35 to 50 years | 0 (0.0%) | 0 (0.0%) |
| Total | 0 (0.0%) | 0 (0.0%) |
Fertility by Education in Chumuckla
| Educational Attainment | Women with Births | Births / 1,000 Women |
| Less than High School | 0 (0.0%) | 0.0 |
| High School Diploma | 0 (0.0%) | 0.0 |
| College or Associate's Degree | 0 (0.0%) | 0.0 |
| Bachelor's Degree | 0 (0.0%) | 0.0 |
| Graduate Degree | 0 (0.0%) | 0.0 |
| Total | 0 (0.0%) | 0.0 |
Fertility by Education by Marriage Status in Chumuckla
| Educational Attainment | Married | Unmarried |
| Less than High School | 0 (0.0%) | 0 (0.0%) |
| High School Diploma | 0 (0.0%) | 0 (0.0%) |
| College or Associate's Degree | 0 (0.0%) | 0 (0.0%) |
| Bachelor's Degree | 0 (0.0%) | 0 (0.0%) |
| Graduate Degree | 0 (0.0%) | 0 (0.0%) |
| Total | 0 (0.0%) | 0 (0.0%) |
Income in Chumuckla
Income Overview in Chumuckla
Per Capita Income in Chumuckla is $47,299, while median incomes of families and households are $119,130 and $103,727 respectively.
| Characteristic | Number | Measure |
| Per Capita Income | 991 | $47,299 |
| Median Family Income | 220 | $119,130 |
| Mean Family Income | 220 | $145,222 |
| Median Household Income | 370 | $103,727 |
| Mean Household Income | 370 | $122,941 |
| Income Deficit | 220 | $0 |
| Wage / Income Gap (%) | 991 | 0.00% |
| Wage / Income Gap ($) | 991 | 100.00¢ per $1 |
| Gini / Inequality Index | 991 | 0.36 |
Earnings by Sex in Chumuckla
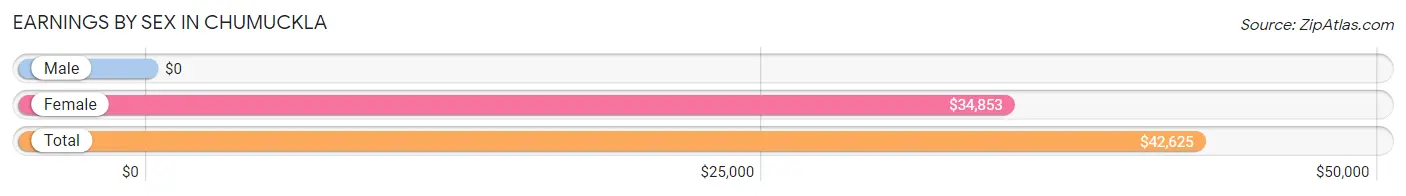
| Sex | Number | Average Earnings |
| Male | 459 (79.5%) | $0 |
| Female | 118 (20.4%) | $34,853 |
| Total | 577 (100.0%) | $42,625 |
Earnings by Sex by Income Bracket in Chumuckla
The most common earnings brackets in Chumuckla are $100,000+ for men (149 | 32.5%) and $20,000 to $22,499 for women (43 | 36.4%).
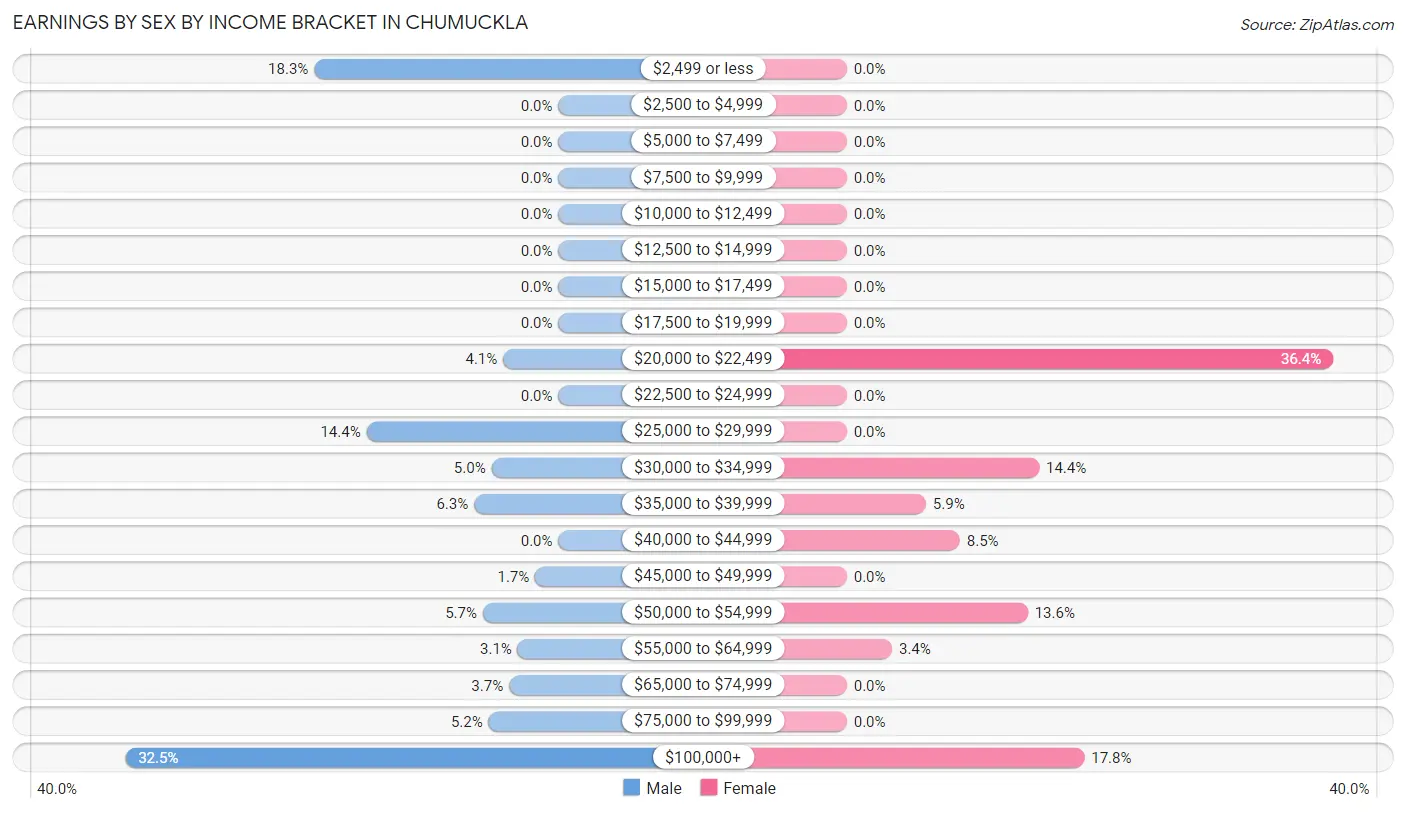
| Income | Male | Female |
| $2,499 or less | 84 (18.3%) | 0 (0.0%) |
| $2,500 to $4,999 | 0 (0.0%) | 0 (0.0%) |
| $5,000 to $7,499 | 0 (0.0%) | 0 (0.0%) |
| $7,500 to $9,999 | 0 (0.0%) | 0 (0.0%) |
| $10,000 to $12,499 | 0 (0.0%) | 0 (0.0%) |
| $12,500 to $14,999 | 0 (0.0%) | 0 (0.0%) |
| $15,000 to $17,499 | 0 (0.0%) | 0 (0.0%) |
| $17,500 to $19,999 | 0 (0.0%) | 0 (0.0%) |
| $20,000 to $22,499 | 19 (4.1%) | 43 (36.4%) |
| $22,500 to $24,999 | 0 (0.0%) | 0 (0.0%) |
| $25,000 to $29,999 | 66 (14.4%) | 0 (0.0%) |
| $30,000 to $34,999 | 23 (5.0%) | 17 (14.4%) |
| $35,000 to $39,999 | 29 (6.3%) | 7 (5.9%) |
| $40,000 to $44,999 | 0 (0.0%) | 10 (8.5%) |
| $45,000 to $49,999 | 8 (1.7%) | 0 (0.0%) |
| $50,000 to $54,999 | 26 (5.7%) | 16 (13.6%) |
| $55,000 to $64,999 | 14 (3.0%) | 4 (3.4%) |
| $65,000 to $74,999 | 17 (3.7%) | 0 (0.0%) |
| $75,000 to $99,999 | 24 (5.2%) | 0 (0.0%) |
| $100,000+ | 149 (32.5%) | 21 (17.8%) |
| Total | 459 (100.0%) | 118 (100.0%) |
Earnings by Sex by Educational Attainment in Chumuckla
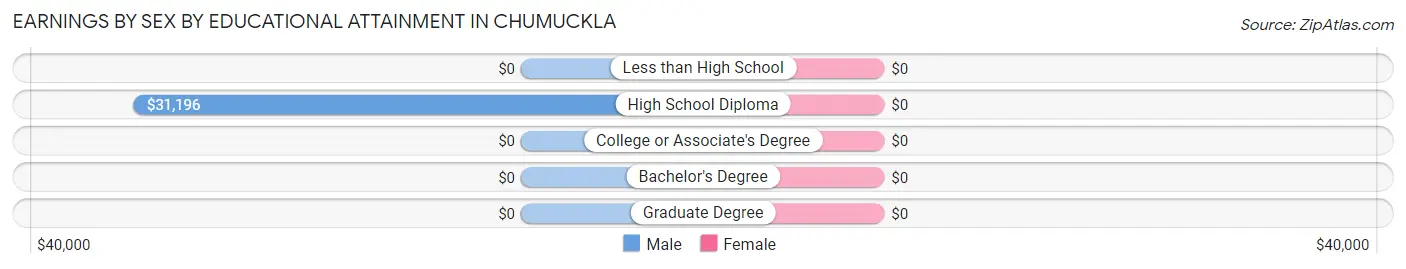
| Educational Attainment | Male Income | Female Income |
| Less than High School | - | - |
| High School Diploma | $31,196 | $0 |
| College or Associate's Degree | - | - |
| Bachelor's Degree | - | - |
| Graduate Degree | - | - |
| Total | $80,000 | $34,338 |
Family Income in Chumuckla
Family Income Brackets in Chumuckla
According to the Chumuckla family income data, there are 72 families falling into the $50,000 to $74,999 income range, which is the most common income bracket and makes up 32.7% of all families.
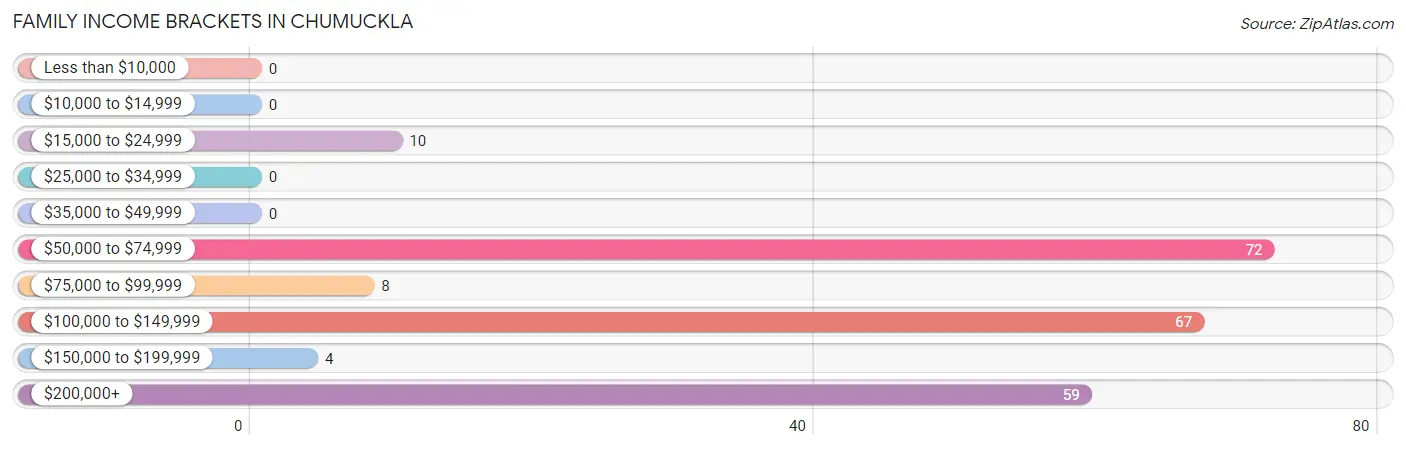
| Income Bracket | # Families | % Families |
| Less than $10,000 | 0 | 0.0% |
| $10,000 to $14,999 | 0 | 0.0% |
| $15,000 to $24,999 | 10 | 4.5% |
| $25,000 to $34,999 | 0 | 0.0% |
| $35,000 to $49,999 | 0 | 0.0% |
| $50,000 to $74,999 | 72 | 32.7% |
| $75,000 to $99,999 | 8 | 3.6% |
| $100,000 to $149,999 | 67 | 30.5% |
| $150,000 to $199,999 | 4 | 1.8% |
| $200,000+ | 59 | 26.8% |
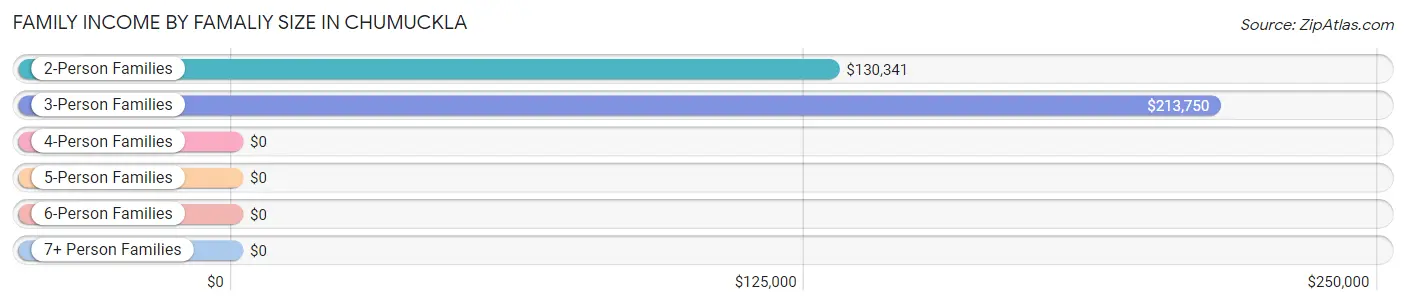
Family Income by Famaliy Size in Chumuckla
3-person families (73 | 33.2%) account for the highest median family income in Chumuckla with $213,750 per family, while 3-person families (73 | 33.2%) have the highest median income of $71,250 per family member.
| Income Bracket | # Families | Median Income |
| 2-Person Families | 80 (36.4%) | $130,341 |
| 3-Person Families | 73 (33.2%) | $213,750 |
| 4-Person Families | 0 (0.0%) | $0 |
| 5-Person Families | 34 (15.4%) | $0 |
| 6-Person Families | 33 (15.0%) | $0 |
| 7+ Person Families | 0 (0.0%) | $0 |
| Total | 220 (100.0%) | $119,130 |
Family Income by Number of Earners in Chumuckla
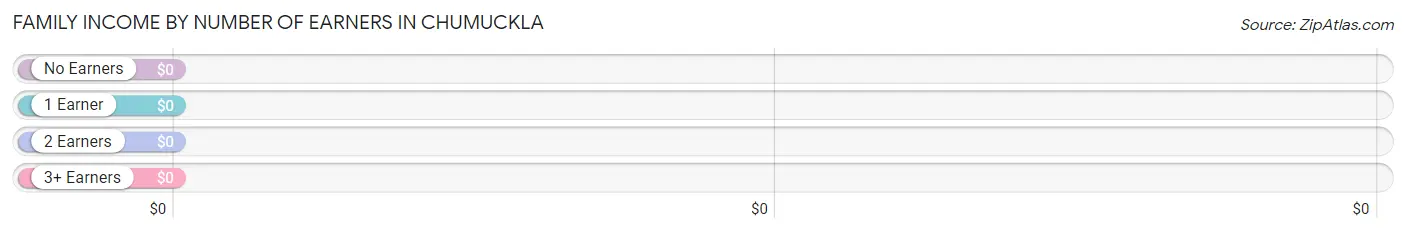
| Number of Earners | # Families | Median Income |
| No Earners | 32 (14.5%) | $0 |
| 1 Earner | 30 (13.6%) | $0 |
| 2 Earners | 135 (61.4%) | $0 |
| 3+ Earners | 23 (10.4%) | $0 |
| Total | 220 (100.0%) | $119,130 |
Household Income in Chumuckla
Household Income Brackets in Chumuckla
With 175 households falling in the category, the $100,000 to $149,999 income range is the most frequent in Chumuckla, accounting for 47.3% of all households.
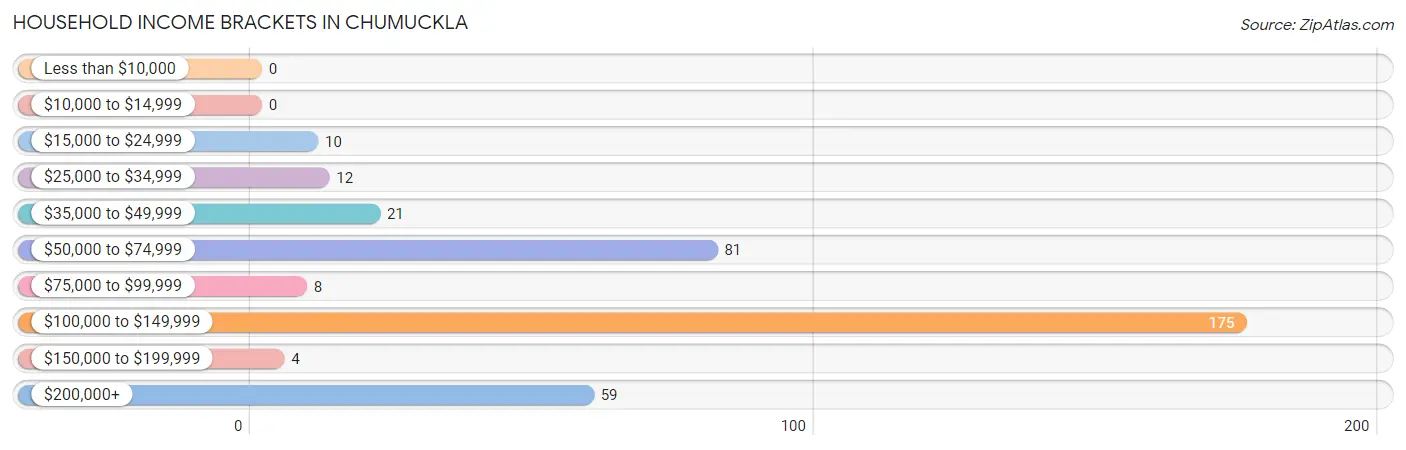
| Income Bracket | # Households | % Households |
| Less than $10,000 | 0 | 0.0% |
| $10,000 to $14,999 | 0 | 0.0% |
| $15,000 to $24,999 | 10 | 2.7% |
| $25,000 to $34,999 | 12 | 3.2% |
| $35,000 to $49,999 | 21 | 5.7% |
| $50,000 to $74,999 | 81 | 21.9% |
| $75,000 to $99,999 | 8 | 2.2% |
| $100,000 to $149,999 | 175 | 47.3% |
| $150,000 to $199,999 | 4 | 1.1% |
| $200,000+ | 59 | 15.9% |
Household Income by Householder Age in Chumuckla
The median household income in Chumuckla is $103,727, with the highest median household income of $165,000 found in the 45 to 64 years age bracket for the primary householder. A total of 126 households (34.1%) fall into this category. Meanwhile, the 15 to 24 years age bracket for the primary householder has the lowest median household income of $0, with 7 households (1.9%) in this group.
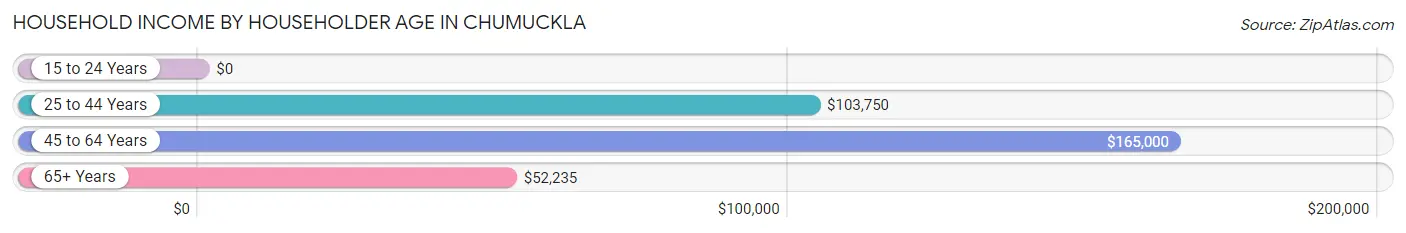
| Income Bracket | # Households | Median Income |
| 15 to 24 Years | 7 (1.9%) | $0 |
| 25 to 44 Years | 142 (38.4%) | $103,750 |
| 45 to 64 Years | 126 (34.1%) | $165,000 |
| 65+ Years | 95 (25.7%) | $52,235 |
| Total | 370 (100.0%) | $103,727 |
Poverty in Chumuckla
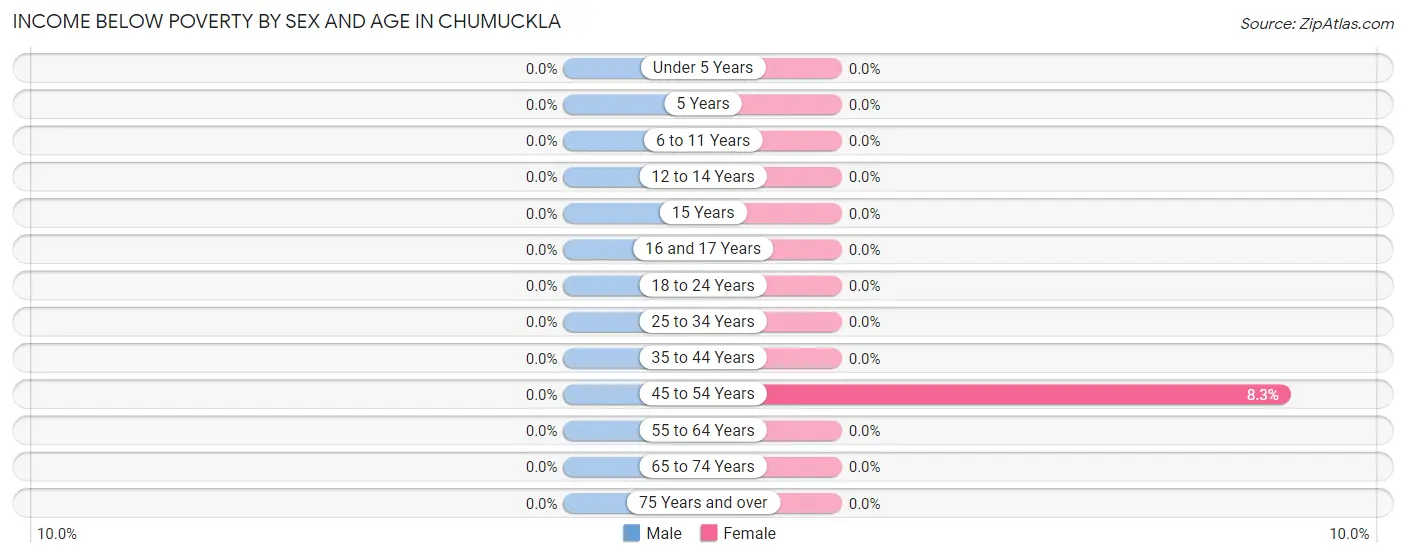
Income Below Poverty by Sex and Age in Chumuckla
| Age Bracket | Male | Female |
| Under 5 Years | 0 (0.0%) | 0 (0.0%) |
| 5 Years | 0 (0.0%) | 0 (0.0%) |
| 6 to 11 Years | 0 (0.0%) | 0 (0.0%) |
| 12 to 14 Years | 0 (0.0%) | 0 (0.0%) |
| 15 Years | 0 (0.0%) | 0 (0.0%) |
| 16 and 17 Years | 0 (0.0%) | 0 (0.0%) |
| 18 to 24 Years | 0 (0.0%) | 0 (0.0%) |
| 25 to 34 Years | 0 (0.0%) | 0 (0.0%) |
| 35 to 44 Years | 0 (0.0%) | 0 (0.0%) |
| 45 to 54 Years | 0 (0.0%) | 6 (8.3%) |
| 55 to 64 Years | 0 (0.0%) | 0 (0.0%) |
| 65 to 74 Years | 0 (0.0%) | 0 (0.0%) |
| 75 Years and over | 0 (0.0%) | 0 (0.0%) |
| Total | 0 (0.0%) | 6 (1.5%) |
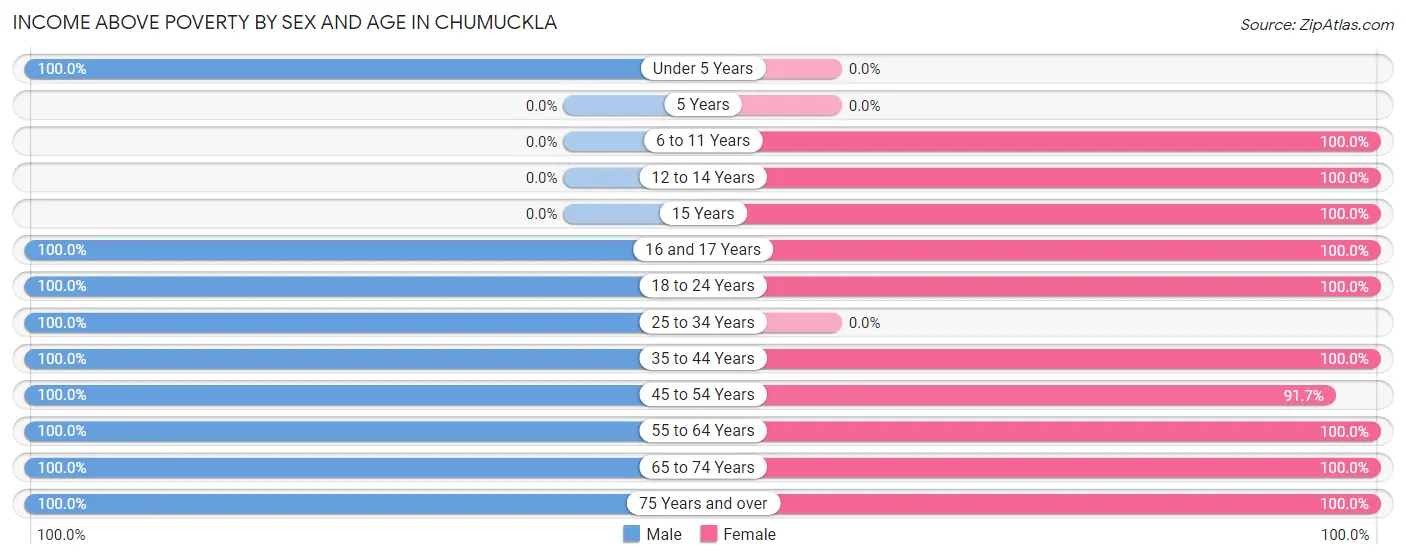
Income Above Poverty by Sex and Age in Chumuckla
According to the poverty statistics in Chumuckla, males aged under 5 years and females aged 6 to 11 years are the age groups that are most secure financially, with 100.0% of males and 100.0% of females in these age groups living above the poverty line.
| Age Bracket | Male | Female |
| Under 5 Years | 40 (100.0%) | 0 (0.0%) |
| 5 Years | 0 (0.0%) | 0 (0.0%) |
| 6 to 11 Years | 0 (0.0%) | 54 (100.0%) |
| 12 to 14 Years | 0 (0.0%) | 16 (100.0%) |
| 15 Years | 0 (0.0%) | 64 (100.0%) |
| 16 and 17 Years | 35 (100.0%) | 23 (100.0%) |
| 18 to 24 Years | 78 (100.0%) | 7 (100.0%) |
| 25 to 34 Years | 140 (100.0%) | 0 (0.0%) |
| 35 to 44 Years | 36 (100.0%) | 76 (100.0%) |
| 45 to 54 Years | 98 (100.0%) | 66 (91.7%) |
| 55 to 64 Years | 56 (100.0%) | 11 (100.0%) |
| 65 to 74 Years | 31 (100.0%) | 46 (100.0%) |
| 75 Years and over | 61 (100.0%) | 41 (100.0%) |
| Total | 575 (100.0%) | 404 (98.5%) |
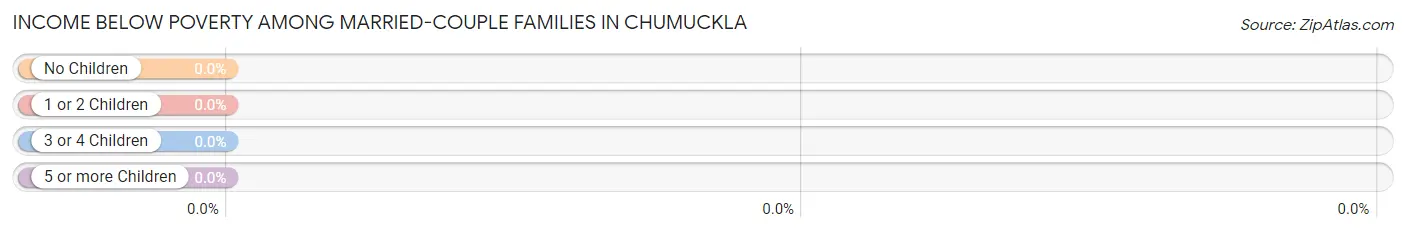
Income Below Poverty Among Married-Couple Families in Chumuckla
| Children | Above Poverty | Below Poverty |
| No Children | 126 (100.0%) | 0 (0.0%) |
| 1 or 2 Children | 4 (100.0%) | 0 (0.0%) |
| 3 or 4 Children | 67 (100.0%) | 0 (0.0%) |
| 5 or more Children | 0 (0.0%) | 0 (0.0%) |
| Total | 197 (100.0%) | 0 (0.0%) |
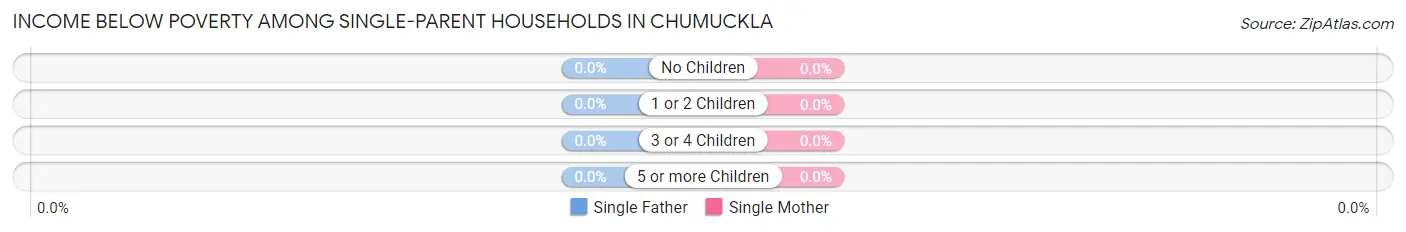
Income Below Poverty Among Single-Parent Households in Chumuckla
| Children | Single Father | Single Mother |
| No Children | 0 (0.0%) | 0 (0.0%) |
| 1 or 2 Children | 0 (0.0%) | 0 (0.0%) |
| 3 or 4 Children | 0 (0.0%) | 0 (0.0%) |
| 5 or more Children | 0 (0.0%) | 0 (0.0%) |
| Total | 0 (0.0%) | 0 (0.0%) |
Income Below Poverty Among Married-Couple vs Single-Parent Households in Chumuckla
| Children | Married-Couple Families | Single-Parent Households |
| No Children | 0 (0.0%) | 0 (0.0%) |
| 1 or 2 Children | 0 (0.0%) | 0 (0.0%) |
| 3 or 4 Children | 0 (0.0%) | 0 (0.0%) |
| 5 or more Children | 0 (0.0%) | 0 (0.0%) |
| Total | 0 (0.0%) | 0 (0.0%) |
Employment Characteristics in Chumuckla
Employment by Class of Employer in Chumuckla
Among the 542 employed individuals in Chumuckla, private company employees (308 | 56.8%), federal government employees (113 | 20.8%), and state government employees (50 | 9.2%) make up the most common classes of employment.
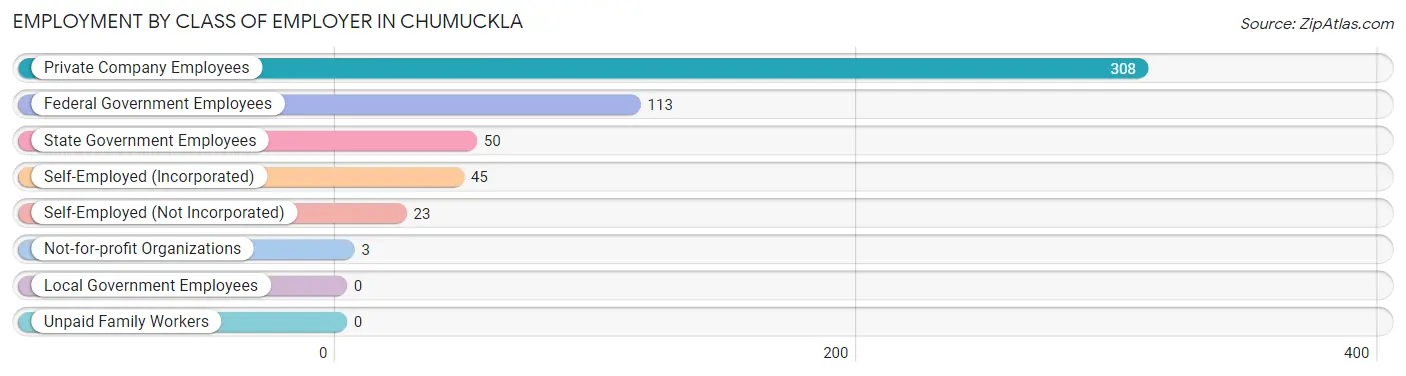
| Employer Class | # Employees | % Employees |
| Private Company Employees | 308 | 56.8% |
| Self-Employed (Incorporated) | 45 | 8.3% |
| Self-Employed (Not Incorporated) | 23 | 4.2% |
| Not-for-profit Organizations | 3 | 0.5% |
| Local Government Employees | 0 | 0.0% |
| State Government Employees | 50 | 9.2% |
| Federal Government Employees | 113 | 20.8% |
| Unpaid Family Workers | 0 | 0.0% |
| Total | 542 | 100.0% |
Employment Status by Age in Chumuckla
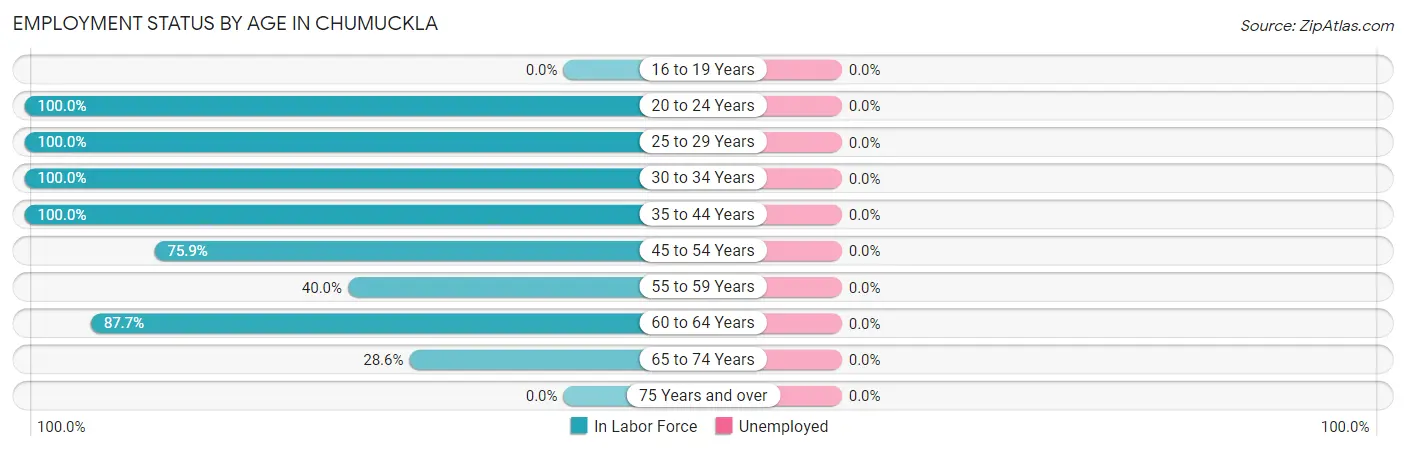
| Age Bracket | In Labor Force | Unemployed |
| 16 to 19 Years | 0 (0.0%) | 0 (0.0%) |
| 20 to 24 Years | 85 (100.0%) | 0 (0.0%) |
| 25 to 29 Years | 108 (100.0%) | 0 (0.0%) |
| 30 to 34 Years | 32 (100.0%) | 0 (0.0%) |
| 35 to 44 Years | 112 (100.0%) | 0 (0.0%) |
| 45 to 54 Years | 129 (75.9%) | 0 (0.0%) |
| 55 to 59 Years | 4 (40.0%) | 0 (0.0%) |
| 60 to 64 Years | 50 (87.7%) | 0 (0.0%) |
| 65 to 74 Years | 22 (28.6%) | 0 (0.0%) |
| 75 Years and over | 0 (0.0%) | 0 (0.0%) |
| Total | 542 (66.8%) | 0 (0.0%) |
Employment Status by Educational Attainment in Chumuckla
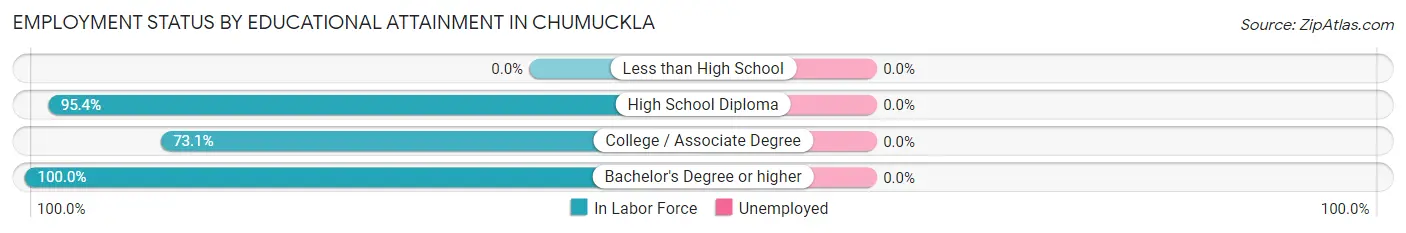
| Educational Attainment | In Labor Force | Unemployed |
| Less than High School | 0 (0.0%) | 0 (0.0%) |
| High School Diploma | 186 (95.4%) | 0 (0.0%) |
| College / Associate Degree | 95 (73.1%) | 0 (0.0%) |
| Bachelor's Degree or higher | 154 (100.0%) | 0 (0.0%) |
| Total | 435 (89.0%) | 0 (0.0%) |
Employment Occupations by Sex in Chumuckla
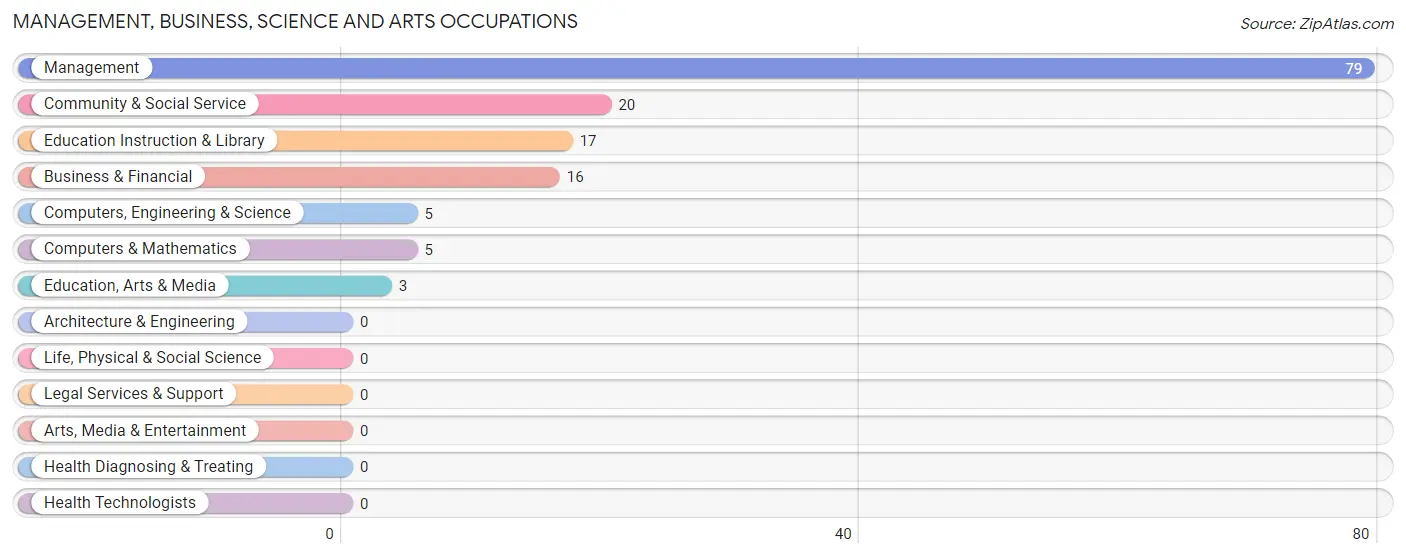
Management, Business, Science and Arts Occupations
The most common Management, Business, Science and Arts occupations in Chumuckla are Management (79 | 18.2%), Community & Social Service (20 | 4.6%), Education Instruction & Library (17 | 3.9%), Business & Financial (16 | 3.7%), and Computers, Engineering & Science (5 | 1.1%).
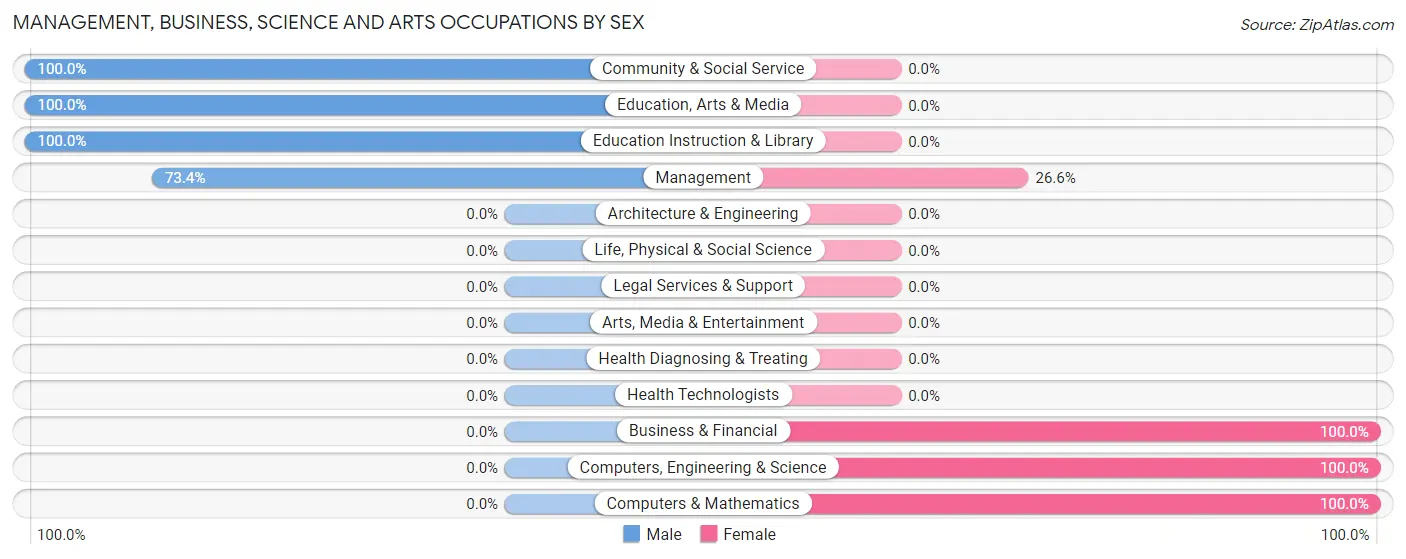
Management, Business, Science and Arts Occupations by Sex
Within the Management, Business, Science and Arts occupations in Chumuckla, the most male-oriented occupations are Community & Social Service (100.0%), Education, Arts & Media (100.0%), and Education Instruction & Library (100.0%), while the most female-oriented occupations are Business & Financial (100.0%), Computers, Engineering & Science (100.0%), and Computers & Mathematics (100.0%).
| Occupation | Male | Female |
| Management | 58 (73.4%) | 21 (26.6%) |
| Business & Financial | 0 (0.0%) | 16 (100.0%) |
| Computers, Engineering & Science | 0 (0.0%) | 5 (100.0%) |
| Computers & Mathematics | 0 (0.0%) | 5 (100.0%) |
| Architecture & Engineering | 0 (0.0%) | 0 (0.0%) |
| Life, Physical & Social Science | 0 (0.0%) | 0 (0.0%) |
| Community & Social Service | 20 (100.0%) | 0 (0.0%) |
| Education, Arts & Media | 3 (100.0%) | 0 (0.0%) |
| Legal Services & Support | 0 (0.0%) | 0 (0.0%) |
| Education Instruction & Library | 17 (100.0%) | 0 (0.0%) |
| Arts, Media & Entertainment | 0 (0.0%) | 0 (0.0%) |
| Health Diagnosing & Treating | 0 (0.0%) | 0 (0.0%) |
| Health Technologists | 0 (0.0%) | 0 (0.0%) |
| Total (Category) | 78 (65.0%) | 42 (35.0%) |
| Total (Overall) | 316 (72.8%) | 118 (27.2%) |
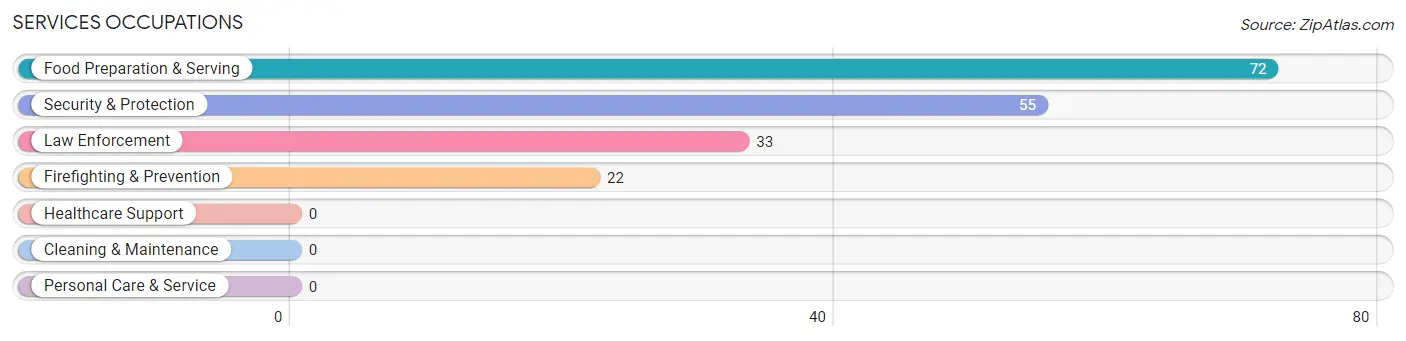
Services Occupations
The most common Services occupations in Chumuckla are Food Preparation & Serving (72 | 16.6%), Security & Protection (55 | 12.7%), Law Enforcement (33 | 7.6%), and Firefighting & Prevention (22 | 5.1%).
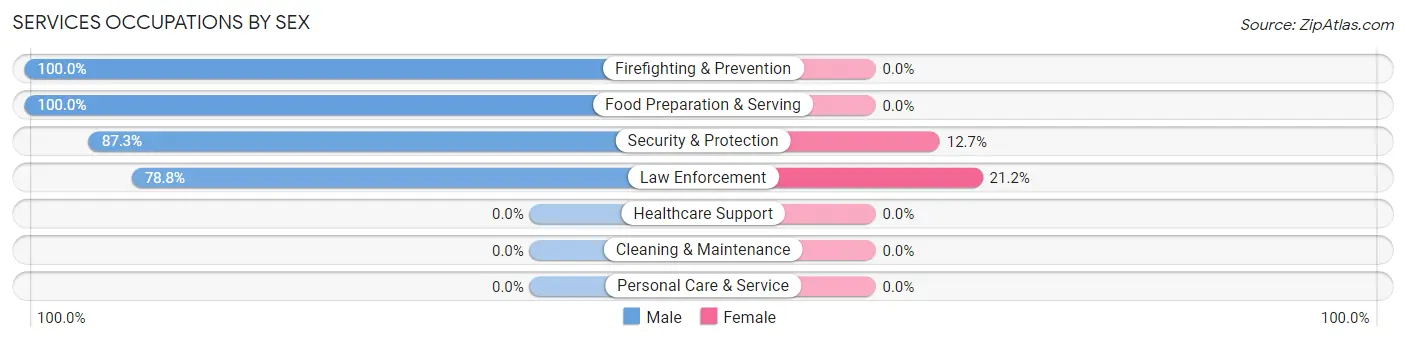
Services Occupations by Sex
Within the Services occupations in Chumuckla, the most male-oriented occupations are Firefighting & Prevention (100.0%), Food Preparation & Serving (100.0%), and Security & Protection (87.3%), while the most female-oriented occupations are Law Enforcement (21.2%), and Security & Protection (12.7%).
| Occupation | Male | Female |
| Healthcare Support | 0 (0.0%) | 0 (0.0%) |
| Security & Protection | 48 (87.3%) | 7 (12.7%) |
| Firefighting & Prevention | 22 (100.0%) | 0 (0.0%) |
| Law Enforcement | 26 (78.8%) | 7 (21.2%) |
| Food Preparation & Serving | 72 (100.0%) | 0 (0.0%) |
| Cleaning & Maintenance | 0 (0.0%) | 0 (0.0%) |
| Personal Care & Service | 0 (0.0%) | 0 (0.0%) |
| Total (Category) | 120 (94.5%) | 7 (5.5%) |
| Total (Overall) | 316 (72.8%) | 118 (27.2%) |
Sales and Office Occupations
The most common Sales and Office occupations in Chumuckla are Office & Administration (28 | 6.5%), and Sales & Related (17 | 3.9%).
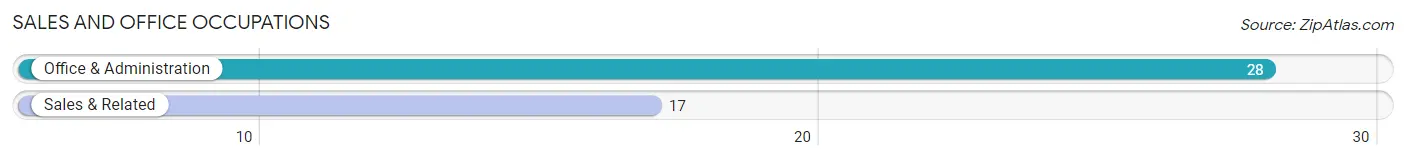
Sales and Office Occupations by Sex
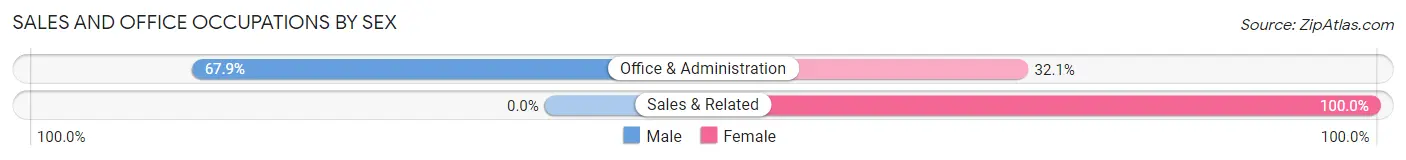
| Occupation | Male | Female |
| Sales & Related | 0 (0.0%) | 17 (100.0%) |
| Office & Administration | 19 (67.9%) | 9 (32.1%) |
| Total (Category) | 19 (42.2%) | 26 (57.8%) |
| Total (Overall) | 316 (72.8%) | 118 (27.2%) |
Natural Resources, Construction and Maintenance Occupations
The most common Natural Resources, Construction and Maintenance occupations in Chumuckla are Farming, Fishing & Forestry (75 | 17.3%), Construction & Extraction (9 | 2.1%), and Installation, Maintenance & Repair (9 | 2.1%).
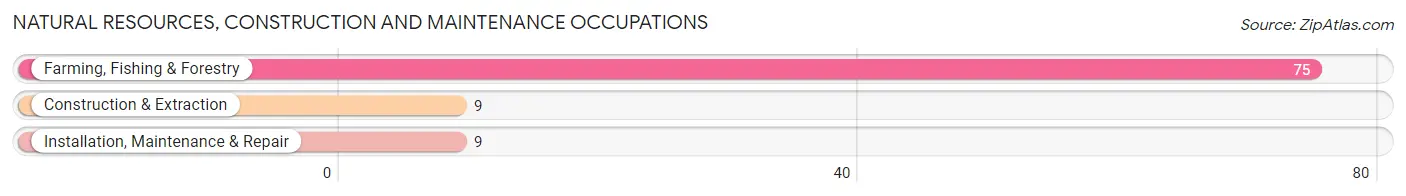
Natural Resources, Construction and Maintenance Occupations by Sex
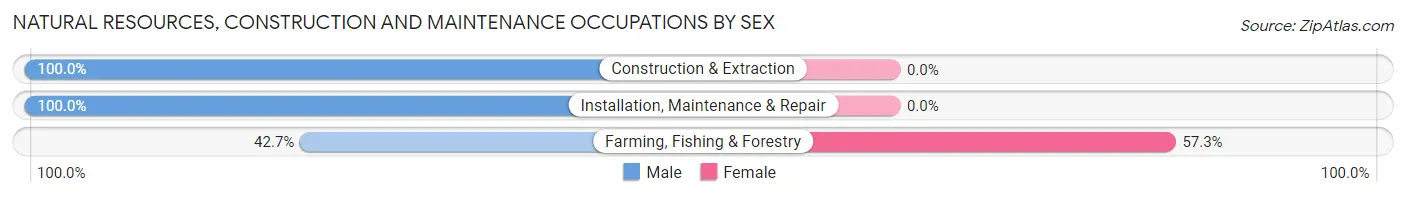
| Occupation | Male | Female |
| Farming, Fishing & Forestry | 32 (42.7%) | 43 (57.3%) |
| Construction & Extraction | 9 (100.0%) | 0 (0.0%) |
| Installation, Maintenance & Repair | 9 (100.0%) | 0 (0.0%) |
| Total (Category) | 50 (53.8%) | 43 (46.2%) |
| Total (Overall) | 316 (72.8%) | 118 (27.2%) |
Production, Transportation and Moving Occupations
The most common Production, Transportation and Moving occupations in Chumuckla are Material Moving (29 | 6.7%), and Transportation (20 | 4.6%).
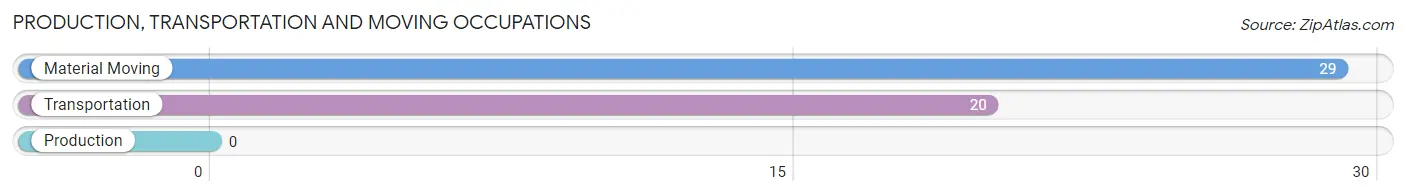
Production, Transportation and Moving Occupations by Sex
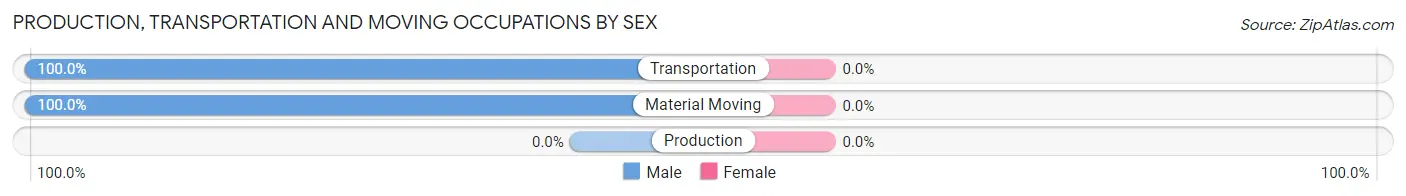
| Occupation | Male | Female |
| Production | 0 (0.0%) | 0 (0.0%) |
| Transportation | 20 (100.0%) | 0 (0.0%) |
| Material Moving | 29 (100.0%) | 0 (0.0%) |
| Total (Category) | 49 (100.0%) | 0 (0.0%) |
| Total (Overall) | 316 (72.8%) | 118 (27.2%) |
Employment Industries by Sex in Chumuckla
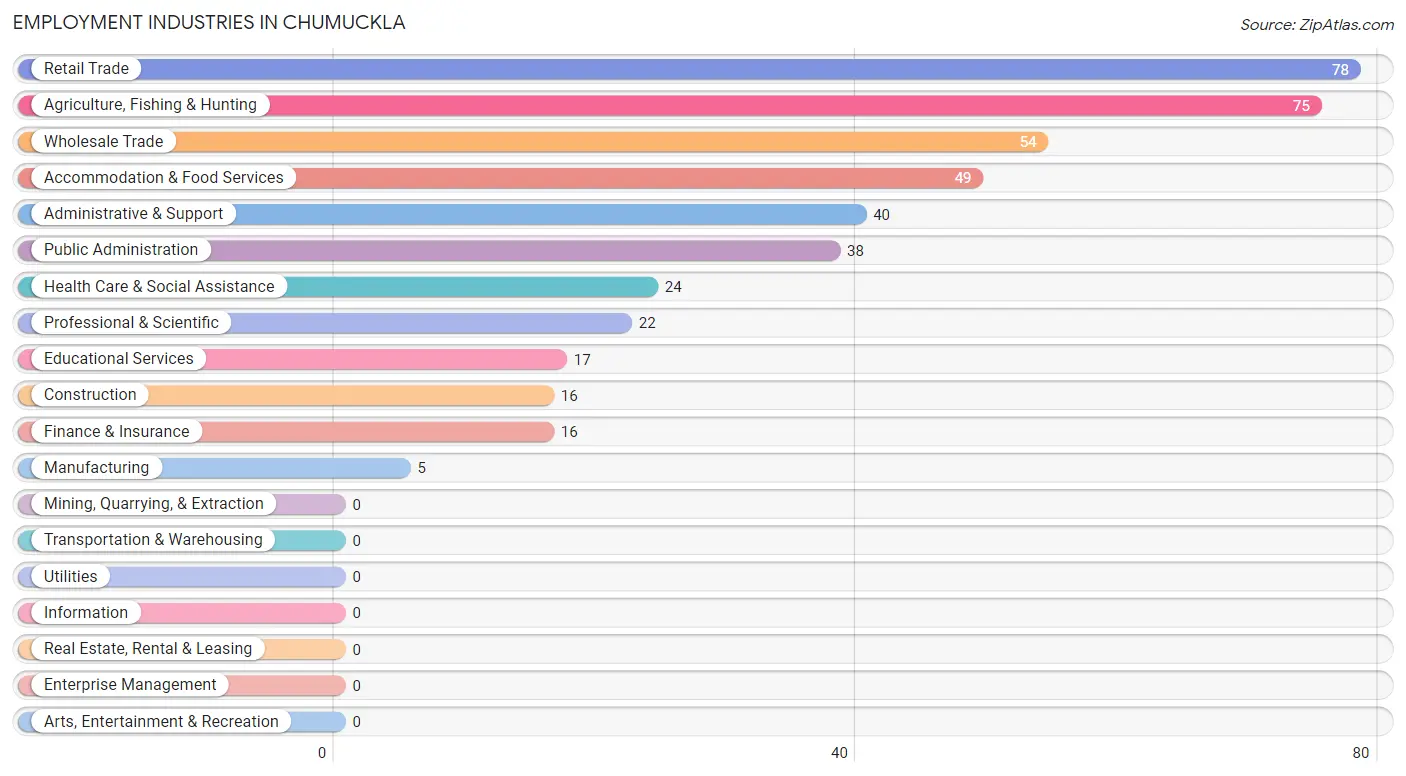
Employment Industries in Chumuckla
The major employment industries in Chumuckla include Retail Trade (78 | 18.0%), Agriculture, Fishing & Hunting (75 | 17.3%), Wholesale Trade (54 | 12.4%), Accommodation & Food Services (49 | 11.3%), and Administrative & Support (40 | 9.2%).
Employment Industries by Sex in Chumuckla
The Chumuckla industries that see more men than women are Manufacturing (100.0%), Professional & Scientific (100.0%), and Administrative & Support (100.0%), whereas the industries that tend to have a higher number of women are Finance & Insurance (100.0%), Health Care & Social Assistance (87.5%), and Agriculture, Fishing & Hunting (57.3%).
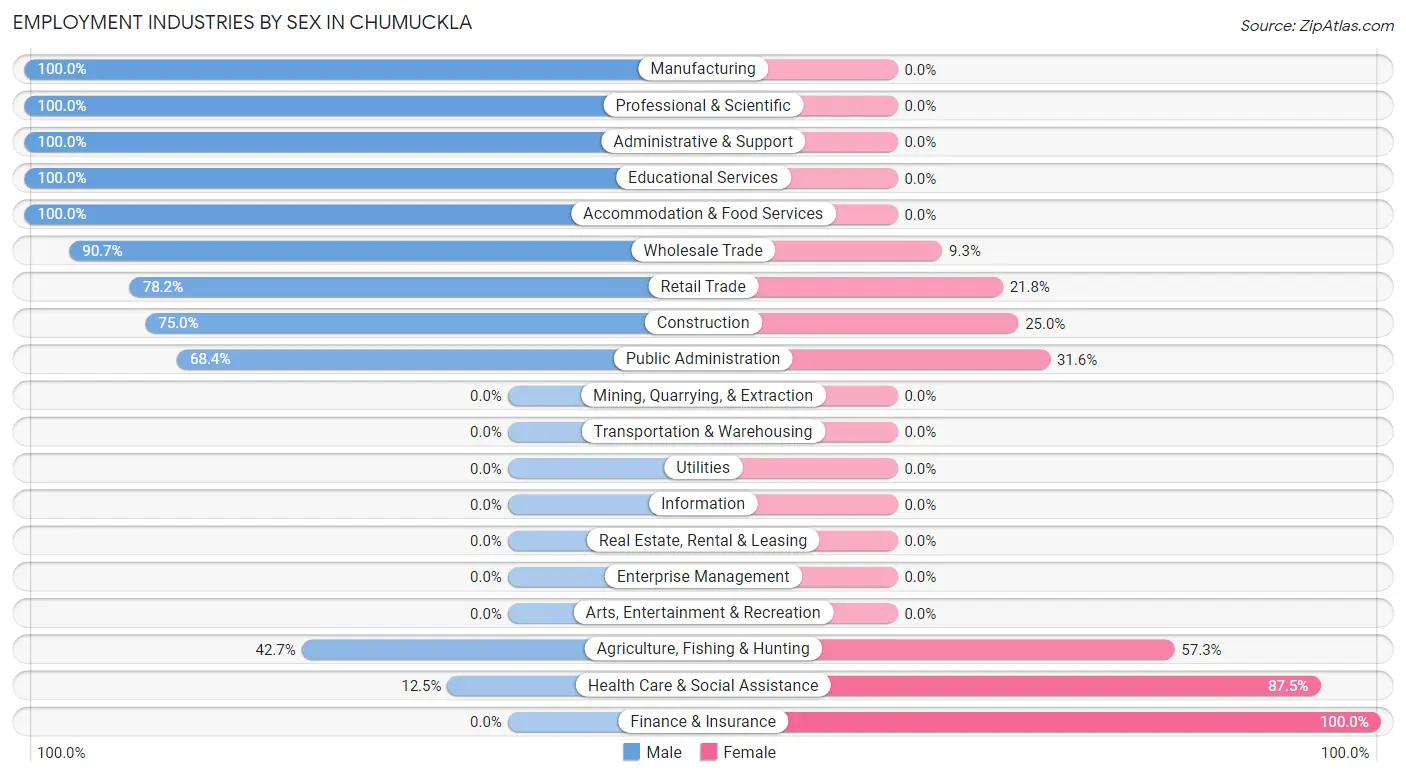
| Industry | Male | Female |
| Agriculture, Fishing & Hunting | 32 (42.7%) | 43 (57.3%) |
| Mining, Quarrying, & Extraction | 0 (0.0%) | 0 (0.0%) |
| Construction | 12 (75.0%) | 4 (25.0%) |
| Manufacturing | 5 (100.0%) | 0 (0.0%) |
| Wholesale Trade | 49 (90.7%) | 5 (9.3%) |
| Retail Trade | 61 (78.2%) | 17 (21.8%) |
| Transportation & Warehousing | 0 (0.0%) | 0 (0.0%) |
| Utilities | 0 (0.0%) | 0 (0.0%) |
| Information | 0 (0.0%) | 0 (0.0%) |
| Finance & Insurance | 0 (0.0%) | 16 (100.0%) |
| Real Estate, Rental & Leasing | 0 (0.0%) | 0 (0.0%) |
| Professional & Scientific | 22 (100.0%) | 0 (0.0%) |
| Enterprise Management | 0 (0.0%) | 0 (0.0%) |
| Administrative & Support | 40 (100.0%) | 0 (0.0%) |
| Educational Services | 17 (100.0%) | 0 (0.0%) |
| Health Care & Social Assistance | 3 (12.5%) | 21 (87.5%) |
| Arts, Entertainment & Recreation | 0 (0.0%) | 0 (0.0%) |
| Accommodation & Food Services | 49 (100.0%) | 0 (0.0%) |
| Public Administration | 26 (68.4%) | 12 (31.6%) |
| Total | 316 (72.8%) | 118 (27.2%) |
Education in Chumuckla
School Enrollment in Chumuckla
The most common levels of schooling among the 247 students in Chumuckla are high school (122 | 49.4%), college / undergraduate (49 | 19.8%), and middle school (39 | 15.8%).
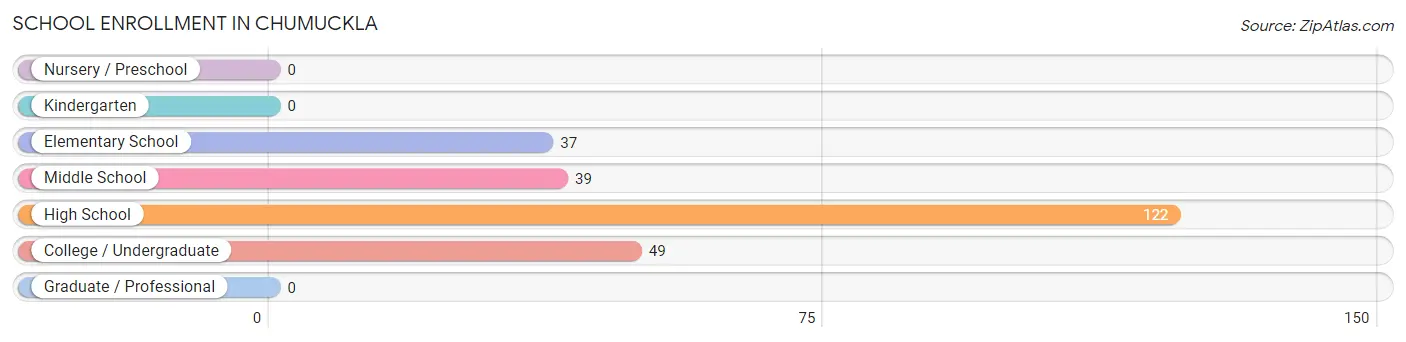
| School Level | # Students | % Students |
| Nursery / Preschool | 0 | 0.0% |
| Kindergarten | 0 | 0.0% |
| Elementary School | 37 | 15.0% |
| Middle School | 39 | 15.8% |
| High School | 122 | 49.4% |
| College / Undergraduate | 49 | 19.8% |
| Graduate / Professional | 0 | 0.0% |
| Total | 247 | 100.0% |
School Enrollment by Age by Funding Source in Chumuckla
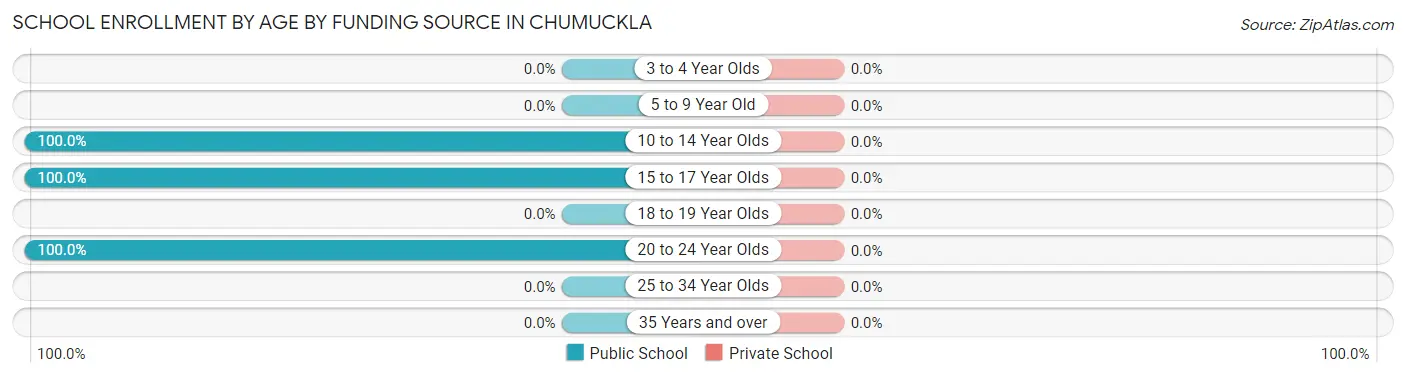
| Age Bracket | Public School | Private School |
| 3 to 4 Year Olds | 0 (0.0%) | 0 (0.0%) |
| 5 to 9 Year Old | 0 (0.0%) | 0 (0.0%) |
| 10 to 14 Year Olds | 76 (100.0%) | 0 (0.0%) |
| 15 to 17 Year Olds | 122 (100.0%) | 0 (0.0%) |
| 18 to 19 Year Olds | 0 (0.0%) | 0 (0.0%) |
| 20 to 24 Year Olds | 49 (100.0%) | 0 (0.0%) |
| 25 to 34 Year Olds | 0 (0.0%) | 0 (0.0%) |
| 35 Years and over | 0 (0.0%) | 0 (0.0%) |
| Total | 247 (100.0%) | 0 (0.0%) |
Educational Attainment by Field of Study in Chumuckla
Business (113 | 73.4%), communications (21 | 13.6%), education (17 | 11.0%), and arts & humanities (3 | 1.9%) are the most common fields of study among 154 individuals in Chumuckla who have obtained a bachelor's degree or higher.
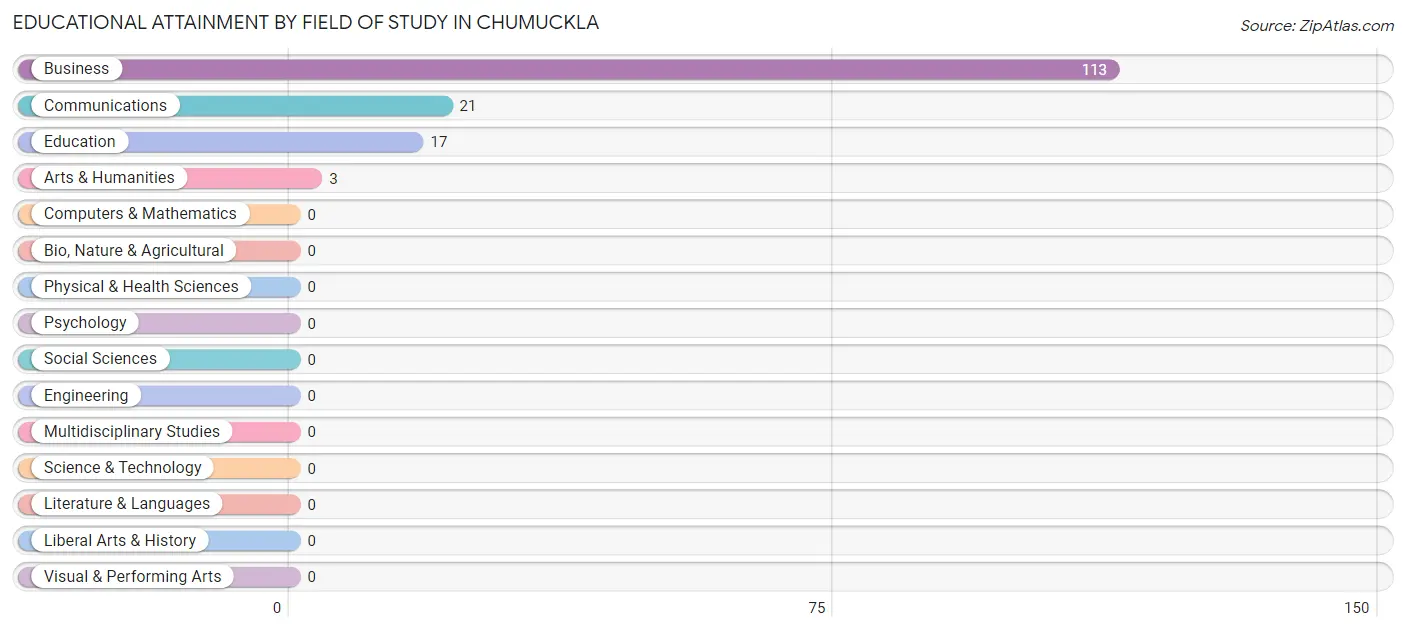
| Field of Study | # Graduates | % Graduates |
| Computers & Mathematics | 0 | 0.0% |
| Bio, Nature & Agricultural | 0 | 0.0% |
| Physical & Health Sciences | 0 | 0.0% |
| Psychology | 0 | 0.0% |
| Social Sciences | 0 | 0.0% |
| Engineering | 0 | 0.0% |
| Multidisciplinary Studies | 0 | 0.0% |
| Science & Technology | 0 | 0.0% |
| Business | 113 | 73.4% |
| Education | 17 | 11.0% |
| Literature & Languages | 0 | 0.0% |
| Liberal Arts & History | 0 | 0.0% |
| Visual & Performing Arts | 0 | 0.0% |
| Communications | 21 | 13.6% |
| Arts & Humanities | 3 | 1.9% |
| Total | 154 | 100.0% |
Transportation & Commute in Chumuckla
Vehicle Availability by Sex in Chumuckla
The most prevalent vehicle ownership categories in Chumuckla are males with 2 vehicles (268, accounting for 63.2%) and females with 2 vehicles (38, making up 227.1%).
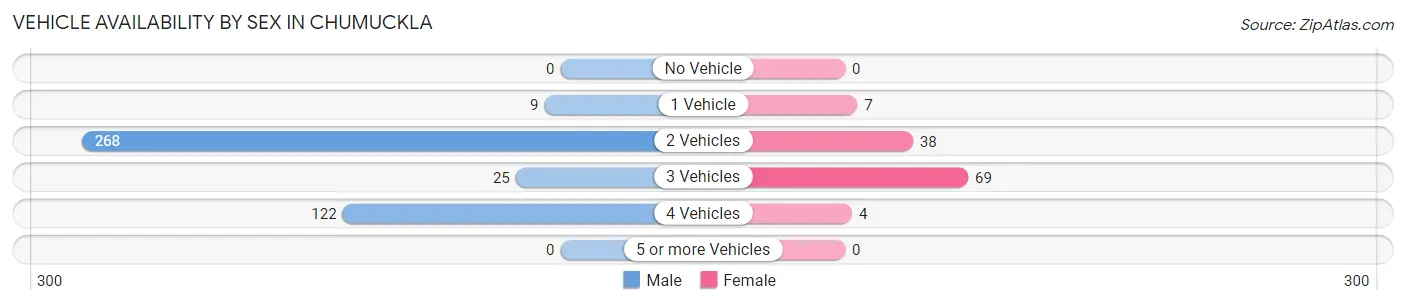
| Vehicles Available | Male | Female |
| No Vehicle | 0 (0.0%) | 0 (0.0%) |
| 1 Vehicle | 9 (2.1%) | 7 (5.9%) |
| 2 Vehicles | 268 (63.2%) | 38 (32.2%) |
| 3 Vehicles | 25 (5.9%) | 69 (58.5%) |
| 4 Vehicles | 122 (28.8%) | 4 (3.4%) |
| 5 or more Vehicles | 0 (0.0%) | 0 (0.0%) |
| Total | 424 (100.0%) | 118 (100.0%) |
Commute Time in Chumuckla
The most frequently occuring commute durations in Chumuckla are 30 to 34 minutes (128 commuters, 31.1%), 15 to 19 minutes (100 commuters, 24.3%), and 20 to 24 minutes (57 commuters, 13.8%).
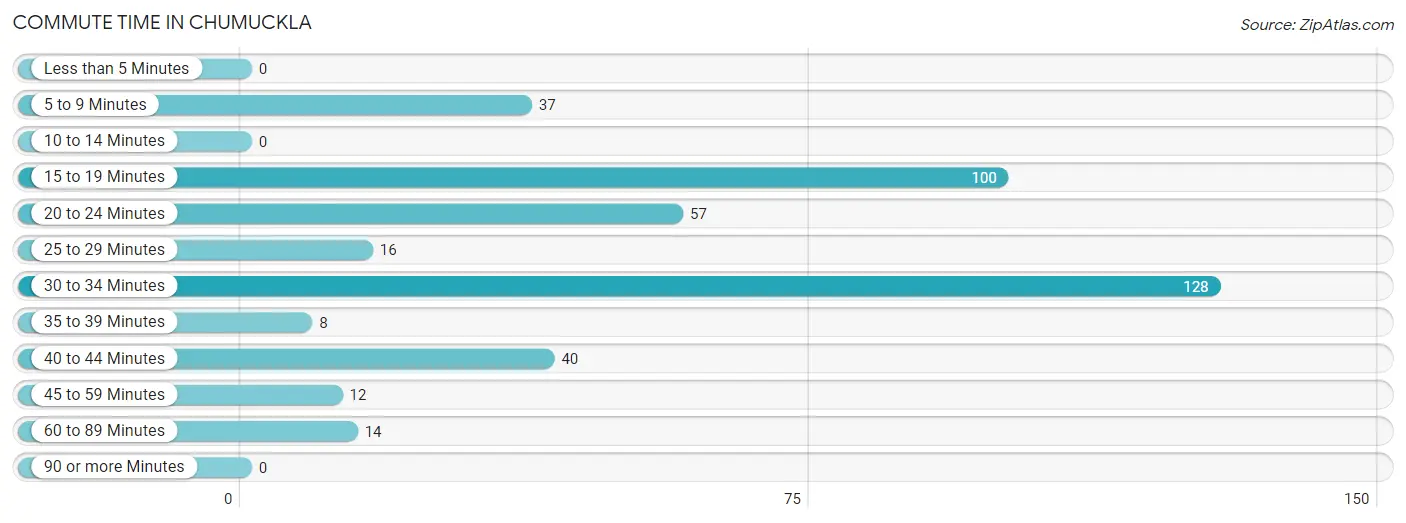
| Commute Time | # Commuters | % Commuters |
| Less than 5 Minutes | 0 | 0.0% |
| 5 to 9 Minutes | 37 | 9.0% |
| 10 to 14 Minutes | 0 | 0.0% |
| 15 to 19 Minutes | 100 | 24.3% |
| 20 to 24 Minutes | 57 | 13.8% |
| 25 to 29 Minutes | 16 | 3.9% |
| 30 to 34 Minutes | 128 | 31.1% |
| 35 to 39 Minutes | 8 | 1.9% |
| 40 to 44 Minutes | 40 | 9.7% |
| 45 to 59 Minutes | 12 | 2.9% |
| 60 to 89 Minutes | 14 | 3.4% |
| 90 or more Minutes | 0 | 0.0% |
Commute Time by Sex in Chumuckla
The most common commute times in Chumuckla are 30 to 34 minutes (78 commuters, 26.5%) for males and 30 to 34 minutes (50 commuters, 42.4%) for females.
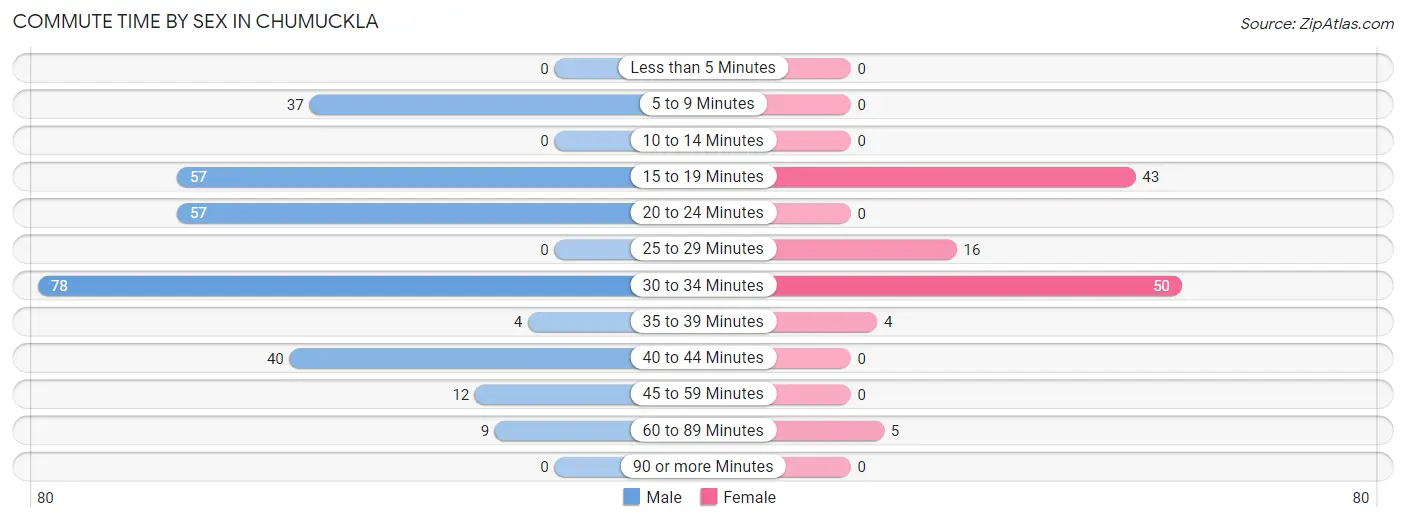
| Commute Time | Male | Female |
| Less than 5 Minutes | 0 (0.0%) | 0 (0.0%) |
| 5 to 9 Minutes | 37 (12.6%) | 0 (0.0%) |
| 10 to 14 Minutes | 0 (0.0%) | 0 (0.0%) |
| 15 to 19 Minutes | 57 (19.4%) | 43 (36.4%) |
| 20 to 24 Minutes | 57 (19.4%) | 0 (0.0%) |
| 25 to 29 Minutes | 0 (0.0%) | 16 (13.6%) |
| 30 to 34 Minutes | 78 (26.5%) | 50 (42.4%) |
| 35 to 39 Minutes | 4 (1.4%) | 4 (3.4%) |
| 40 to 44 Minutes | 40 (13.6%) | 0 (0.0%) |
| 45 to 59 Minutes | 12 (4.1%) | 0 (0.0%) |
| 60 to 89 Minutes | 9 (3.1%) | 5 (4.2%) |
| 90 or more Minutes | 0 (0.0%) | 0 (0.0%) |
Time of Departure to Work by Sex in Chumuckla
The most frequent times of departure to work in Chumuckla are 7:00 AM to 7:29 AM (95, 32.3%) for males and 7:30 AM to 7:59 AM (54, 45.8%) for females.
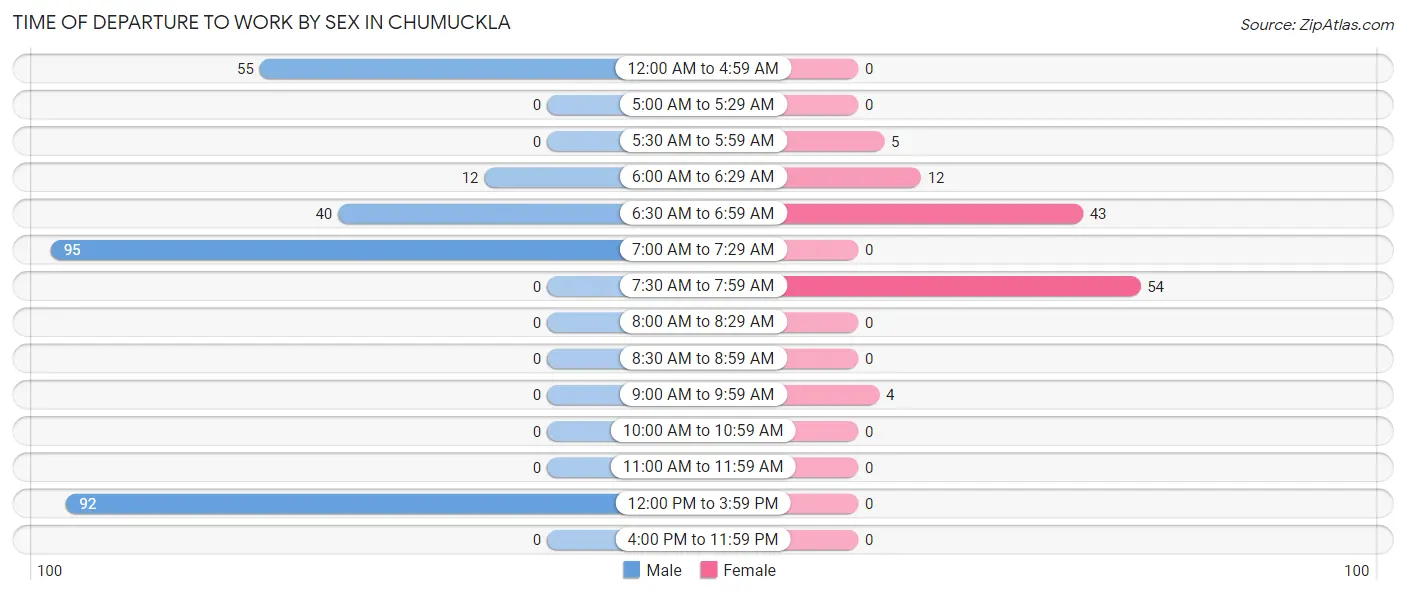
| Time of Departure | Male | Female |
| 12:00 AM to 4:59 AM | 55 (18.7%) | 0 (0.0%) |
| 5:00 AM to 5:29 AM | 0 (0.0%) | 0 (0.0%) |
| 5:30 AM to 5:59 AM | 0 (0.0%) | 5 (4.2%) |
| 6:00 AM to 6:29 AM | 12 (4.1%) | 12 (10.2%) |
| 6:30 AM to 6:59 AM | 40 (13.6%) | 43 (36.4%) |
| 7:00 AM to 7:29 AM | 95 (32.3%) | 0 (0.0%) |
| 7:30 AM to 7:59 AM | 0 (0.0%) | 54 (45.8%) |
| 8:00 AM to 8:29 AM | 0 (0.0%) | 0 (0.0%) |
| 8:30 AM to 8:59 AM | 0 (0.0%) | 0 (0.0%) |
| 9:00 AM to 9:59 AM | 0 (0.0%) | 4 (3.4%) |
| 10:00 AM to 10:59 AM | 0 (0.0%) | 0 (0.0%) |
| 11:00 AM to 11:59 AM | 0 (0.0%) | 0 (0.0%) |
| 12:00 PM to 3:59 PM | 92 (31.3%) | 0 (0.0%) |
| 4:00 PM to 11:59 PM | 0 (0.0%) | 0 (0.0%) |
| Total | 294 (100.0%) | 118 (100.0%) |
Housing Occupancy in Chumuckla
Occupancy by Ownership in Chumuckla
Of the total 370 dwellings in Chumuckla, owner-occupied units account for 328 (88.6%), while renter-occupied units make up 42 (11.4%).
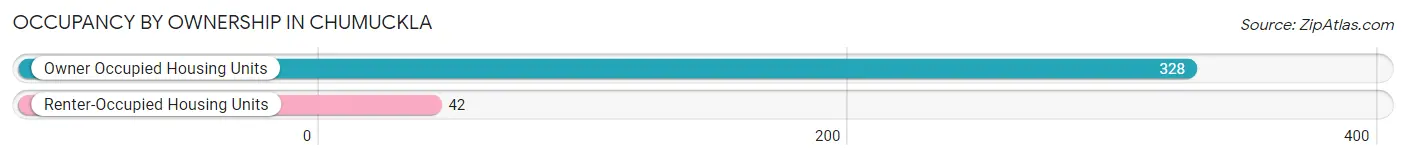
| Occupancy | # Housing Units | % Housing Units |
| Owner Occupied Housing Units | 328 | 88.6% |
| Renter-Occupied Housing Units | 42 | 11.4% |
| Total Occupied Housing Units | 370 | 100.0% |
Occupancy by Household Size in Chumuckla
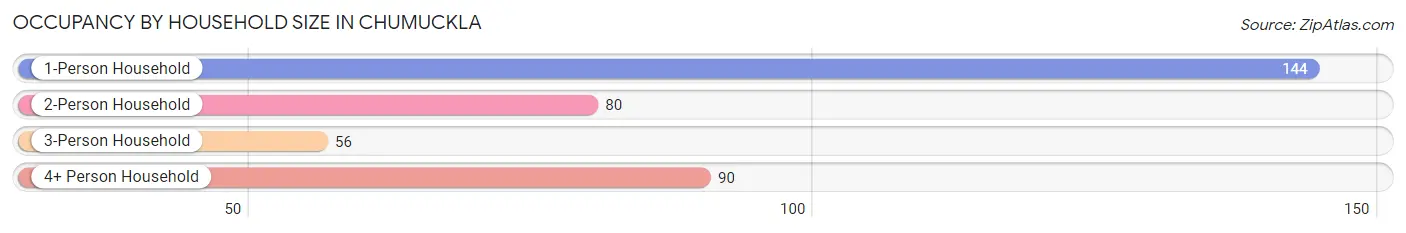
| Household Size | # Housing Units | % Housing Units |
| 1-Person Household | 144 | 38.9% |
| 2-Person Household | 80 | 21.6% |
| 3-Person Household | 56 | 15.1% |
| 4+ Person Household | 90 | 24.3% |
| Total Housing Units | 370 | 100.0% |
Occupancy by Ownership by Household Size in Chumuckla
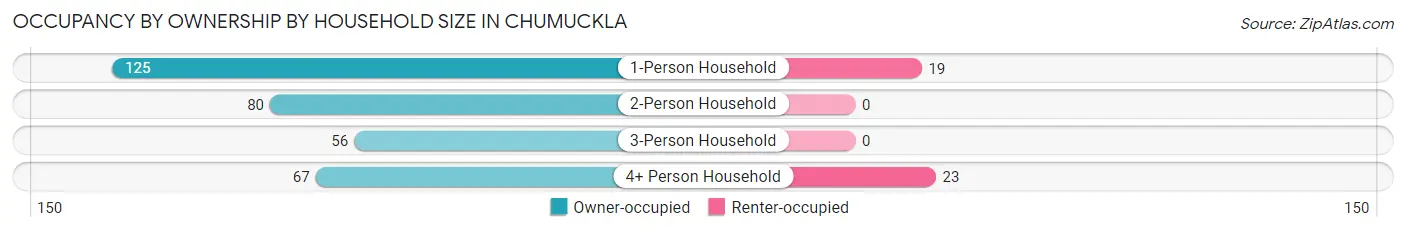
| Household Size | Owner-occupied | Renter-occupied |
| 1-Person Household | 125 (86.8%) | 19 (13.2%) |
| 2-Person Household | 80 (100.0%) | 0 (0.0%) |
| 3-Person Household | 56 (100.0%) | 0 (0.0%) |
| 4+ Person Household | 67 (74.4%) | 23 (25.6%) |
| Total Housing Units | 328 (88.6%) | 42 (11.4%) |
Occupancy by Educational Attainment in Chumuckla
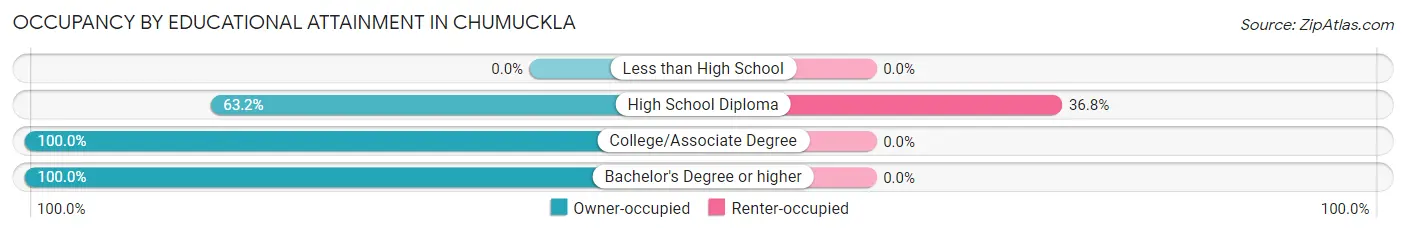
| Household Size | Owner-occupied | Renter-occupied |
| Less than High School | 0 (0.0%) | 0 (0.0%) |
| High School Diploma | 72 (63.2%) | 42 (36.8%) |
| College/Associate Degree | 107 (100.0%) | 0 (0.0%) |
| Bachelor's Degree or higher | 149 (100.0%) | 0 (0.0%) |
Occupancy by Age of Householder in Chumuckla

| Age Bracket | # Households | % Households |
| Under 35 Years | 115 | 31.1% |
| 35 to 44 Years | 34 | 9.2% |
| 45 to 54 Years | 87 | 23.5% |
| 55 to 64 Years | 39 | 10.5% |
| 65 to 74 Years | 54 | 14.6% |
| 75 to 84 Years | 41 | 11.1% |
| 85 Years and Over | 0 | 0.0% |
| Total | 370 | 100.0% |
Housing Finances in Chumuckla
Median Income by Occupancy in Chumuckla
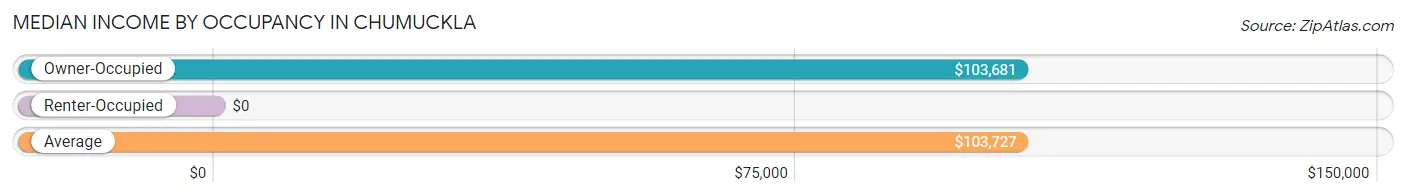
| Occupancy Type | # Households | Median Income |
| Owner-Occupied | 328 (88.6%) | $103,681 |
| Renter-Occupied | 42 (11.4%) | $0 |
| Average | 370 (100.0%) | $103,727 |
Occupancy by Householder Income Bracket in Chumuckla
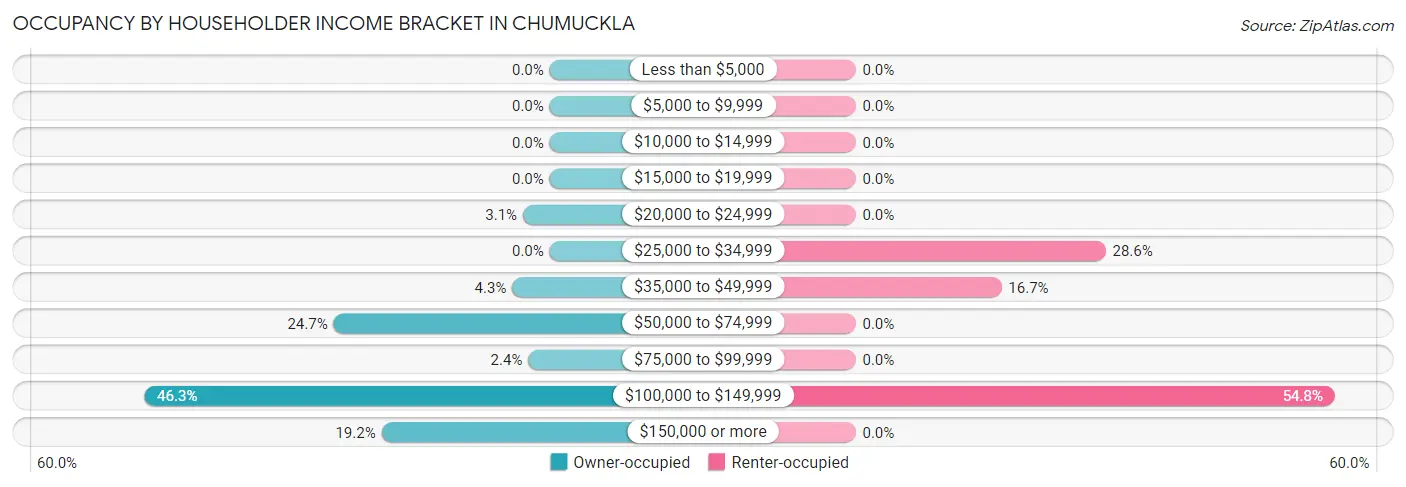
| Income Bracket | Owner-occupied | Renter-occupied |
| Less than $5,000 | 0 (0.0%) | 0 (0.0%) |
| $5,000 to $9,999 | 0 (0.0%) | 0 (0.0%) |
| $10,000 to $14,999 | 0 (0.0%) | 0 (0.0%) |
| $15,000 to $19,999 | 0 (0.0%) | 0 (0.0%) |
| $20,000 to $24,999 | 10 (3.0%) | 0 (0.0%) |
| $25,000 to $34,999 | 0 (0.0%) | 12 (28.6%) |
| $35,000 to $49,999 | 14 (4.3%) | 7 (16.7%) |
| $50,000 to $74,999 | 81 (24.7%) | 0 (0.0%) |
| $75,000 to $99,999 | 8 (2.4%) | 0 (0.0%) |
| $100,000 to $149,999 | 152 (46.3%) | 23 (54.8%) |
| $150,000 or more | 63 (19.2%) | 0 (0.0%) |
| Total | 328 (100.0%) | 42 (100.0%) |
Monthly Housing Cost Tiers in Chumuckla
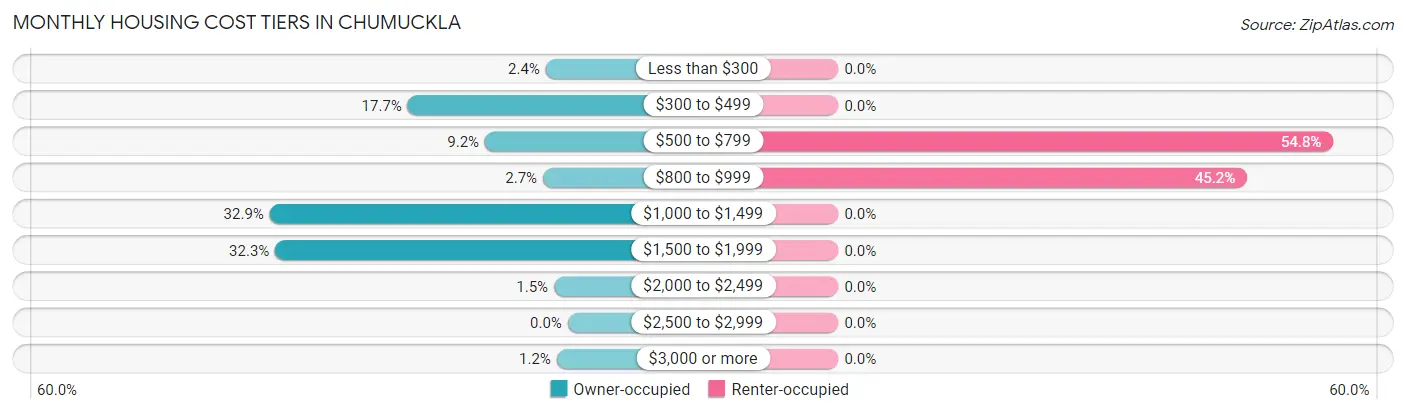
| Monthly Cost | Owner-occupied | Renter-occupied |
| Less than $300 | 8 (2.4%) | 0 (0.0%) |
| $300 to $499 | 58 (17.7%) | 0 (0.0%) |
| $500 to $799 | 30 (9.1%) | 23 (54.8%) |
| $800 to $999 | 9 (2.7%) | 19 (45.2%) |
| $1,000 to $1,499 | 108 (32.9%) | 0 (0.0%) |
| $1,500 to $1,999 | 106 (32.3%) | 0 (0.0%) |
| $2,000 to $2,499 | 5 (1.5%) | 0 (0.0%) |
| $2,500 to $2,999 | 0 (0.0%) | 0 (0.0%) |
| $3,000 or more | 4 (1.2%) | 0 (0.0%) |
| Total | 328 (100.0%) | 42 (100.0%) |
Physical Housing Characteristics in Chumuckla
Housing Structures in Chumuckla
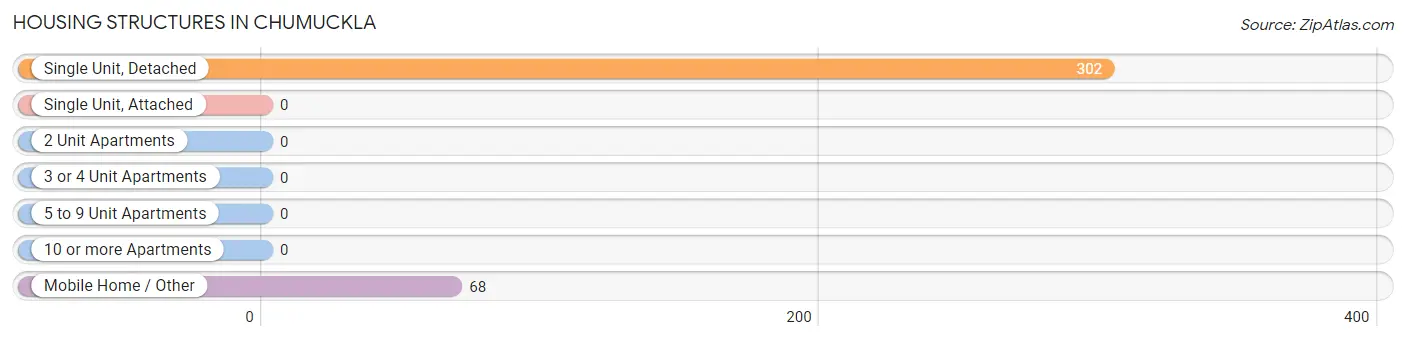
| Structure Type | # Housing Units | % Housing Units |
| Single Unit, Detached | 302 | 81.6% |
| Single Unit, Attached | 0 | 0.0% |
| 2 Unit Apartments | 0 | 0.0% |
| 3 or 4 Unit Apartments | 0 | 0.0% |
| 5 to 9 Unit Apartments | 0 | 0.0% |
| 10 or more Apartments | 0 | 0.0% |
| Mobile Home / Other | 68 | 18.4% |
| Total | 370 | 100.0% |
Housing Structures by Occupancy in Chumuckla
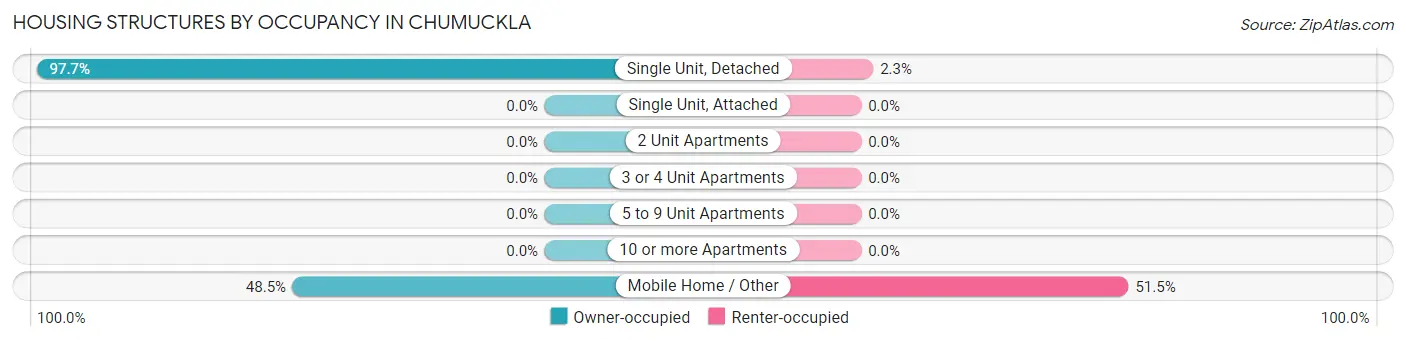
| Structure Type | Owner-occupied | Renter-occupied |
| Single Unit, Detached | 295 (97.7%) | 7 (2.3%) |
| Single Unit, Attached | 0 (0.0%) | 0 (0.0%) |
| 2 Unit Apartments | 0 (0.0%) | 0 (0.0%) |
| 3 or 4 Unit Apartments | 0 (0.0%) | 0 (0.0%) |
| 5 to 9 Unit Apartments | 0 (0.0%) | 0 (0.0%) |
| 10 or more Apartments | 0 (0.0%) | 0 (0.0%) |
| Mobile Home / Other | 33 (48.5%) | 35 (51.5%) |
| Total | 328 (88.6%) | 42 (11.4%) |
Housing Structures by Number of Rooms in Chumuckla
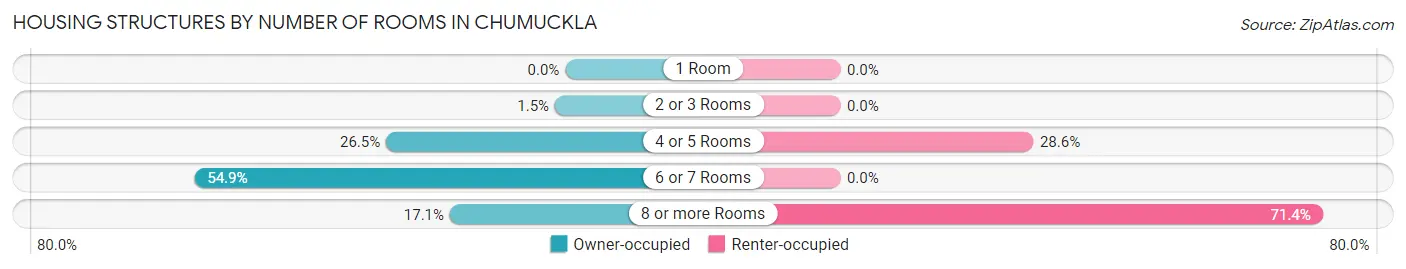
| Number of Rooms | Owner-occupied | Renter-occupied |
| 1 Room | 0 (0.0%) | 0 (0.0%) |
| 2 or 3 Rooms | 5 (1.5%) | 0 (0.0%) |
| 4 or 5 Rooms | 87 (26.5%) | 12 (28.6%) |
| 6 or 7 Rooms | 180 (54.9%) | 0 (0.0%) |
| 8 or more Rooms | 56 (17.1%) | 30 (71.4%) |
| Total | 328 (100.0%) | 42 (100.0%) |
Housing Structure by Heating Type in Chumuckla
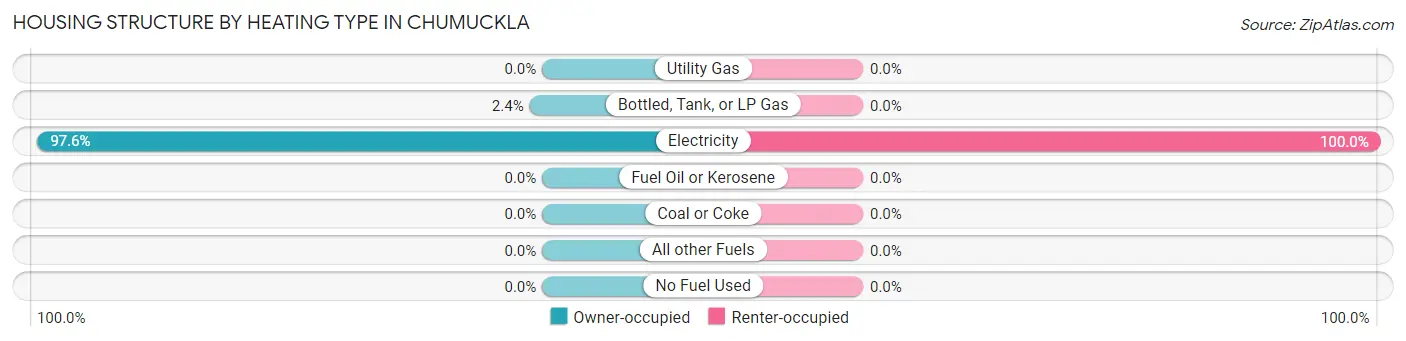
| Heating Type | Owner-occupied | Renter-occupied |
| Utility Gas | 0 (0.0%) | 0 (0.0%) |
| Bottled, Tank, or LP Gas | 8 (2.4%) | 0 (0.0%) |
| Electricity | 320 (97.6%) | 42 (100.0%) |
| Fuel Oil or Kerosene | 0 (0.0%) | 0 (0.0%) |
| Coal or Coke | 0 (0.0%) | 0 (0.0%) |
| All other Fuels | 0 (0.0%) | 0 (0.0%) |
| No Fuel Used | 0 (0.0%) | 0 (0.0%) |
| Total | 328 (100.0%) | 42 (100.0%) |
Household Vehicle Usage in Chumuckla
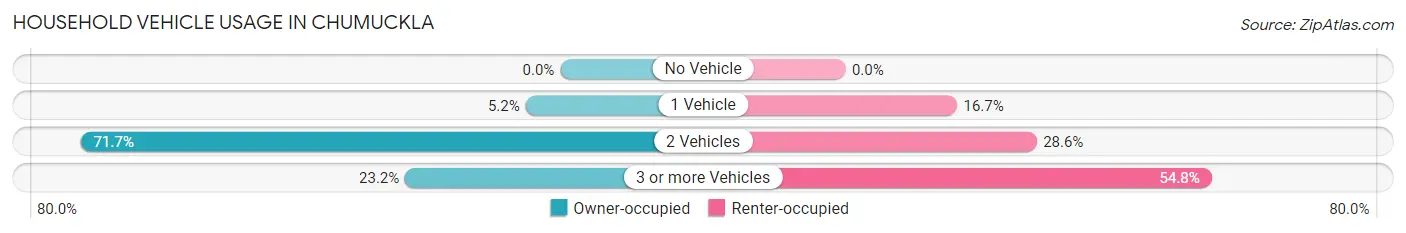
| Vehicles per Household | Owner-occupied | Renter-occupied |
| No Vehicle | 0 (0.0%) | 0 (0.0%) |
| 1 Vehicle | 17 (5.2%) | 7 (16.7%) |
| 2 Vehicles | 235 (71.7%) | 12 (28.6%) |
| 3 or more Vehicles | 76 (23.2%) | 23 (54.8%) |
| Total | 328 (100.0%) | 42 (100.0%) |
Real Estate & Mortgages in Chumuckla
Real Estate and Mortgage Overview in Chumuckla
| Characteristic | Without Mortgage | With Mortgage |
| Housing Units | 96 | 232 |
| Median Property Value | - | - |
| Median Household Income | $58,295 | $60 |
| Monthly Housing Costs | $428 | $4 |
| Real Estate Taxes | - | - |
Property Value by Mortgage Status in Chumuckla
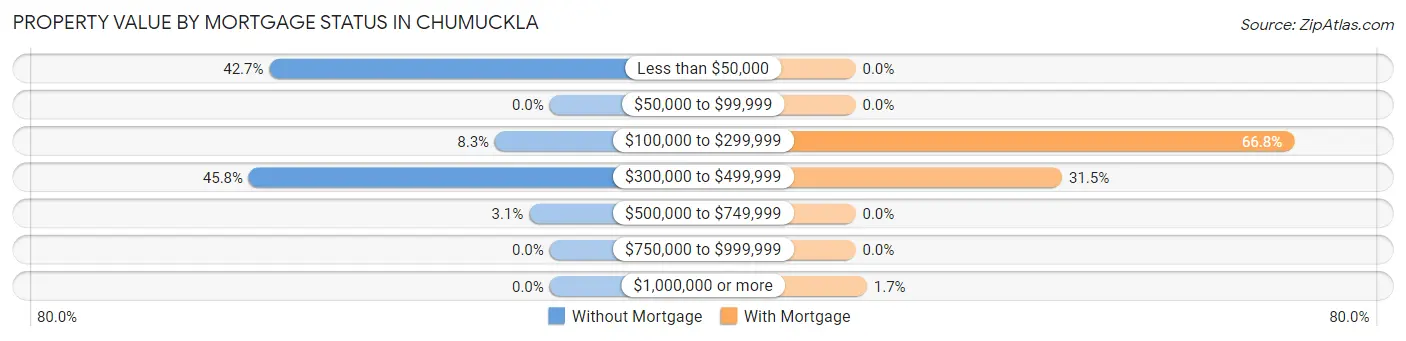
| Property Value | Without Mortgage | With Mortgage |
| Less than $50,000 | 41 (42.7%) | 0 (0.0%) |
| $50,000 to $99,999 | 0 (0.0%) | 0 (0.0%) |
| $100,000 to $299,999 | 8 (8.3%) | 155 (66.8%) |
| $300,000 to $499,999 | 44 (45.8%) | 73 (31.5%) |
| $500,000 to $749,999 | 3 (3.1%) | 0 (0.0%) |
| $750,000 to $999,999 | 0 (0.0%) | 0 (0.0%) |
| $1,000,000 or more | 0 (0.0%) | 4 (1.7%) |
| Total | 96 (100.0%) | 232 (100.0%) |
Household Income by Mortgage Status in Chumuckla
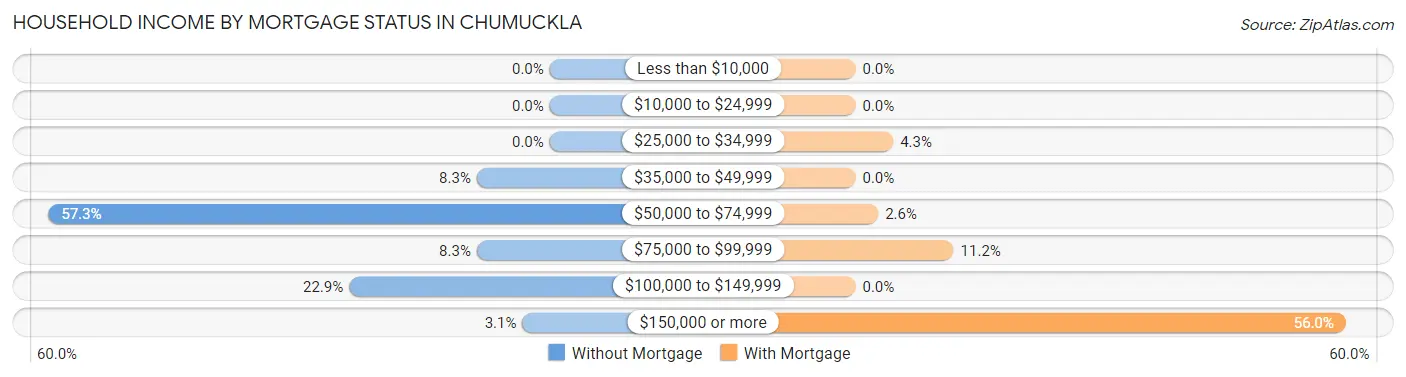
| Household Income | Without Mortgage | With Mortgage |
| Less than $10,000 | 0 (0.0%) | 0 (0.0%) |
| $10,000 to $24,999 | 0 (0.0%) | 0 (0.0%) |
| $25,000 to $34,999 | 0 (0.0%) | 10 (4.3%) |
| $35,000 to $49,999 | 8 (8.3%) | 0 (0.0%) |
| $50,000 to $74,999 | 55 (57.3%) | 6 (2.6%) |
| $75,000 to $99,999 | 8 (8.3%) | 26 (11.2%) |
| $100,000 to $149,999 | 22 (22.9%) | 0 (0.0%) |
| $150,000 or more | 3 (3.1%) | 130 (56.0%) |
| Total | 96 (100.0%) | 232 (100.0%) |
Property Value to Household Income Ratio in Chumuckla
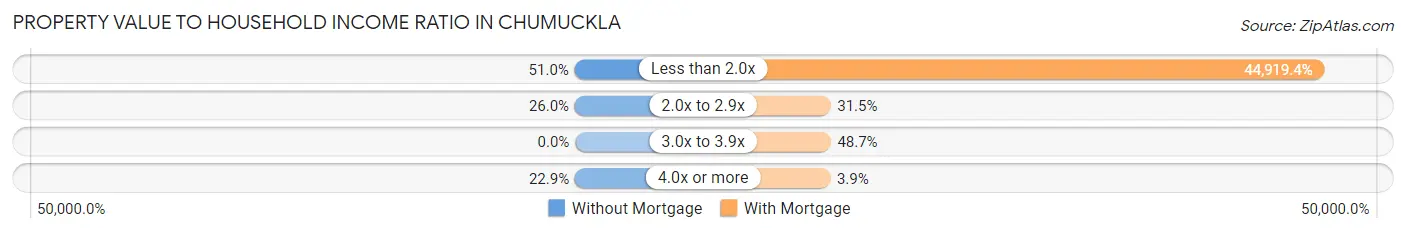
| Value-to-Income Ratio | Without Mortgage | With Mortgage |
| Less than 2.0x | 49 (51.0%) | 104,213 (44,919.4%) |
| 2.0x to 2.9x | 25 (26.0%) | 73 (31.5%) |
| 3.0x to 3.9x | 0 (0.0%) | 113 (48.7%) |
| 4.0x or more | 22 (22.9%) | 9 (3.9%) |
| Total | 96 (100.0%) | 232 (100.0%) |
Real Estate Taxes by Mortgage Status in Chumuckla
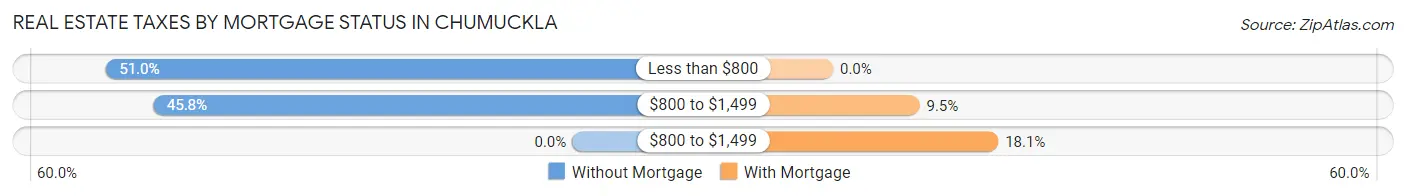
| Property Taxes | Without Mortgage | With Mortgage |
| Less than $800 | 49 (51.0%) | 0 (0.0%) |
| $800 to $1,499 | 44 (45.8%) | 22 (9.5%) |
| $800 to $1,499 | 0 (0.0%) | 42 (18.1%) |
| Total | 96 (100.0%) | 232 (100.0%) |
Health & Disability in Chumuckla
Health Insurance Coverage by Age in Chumuckla
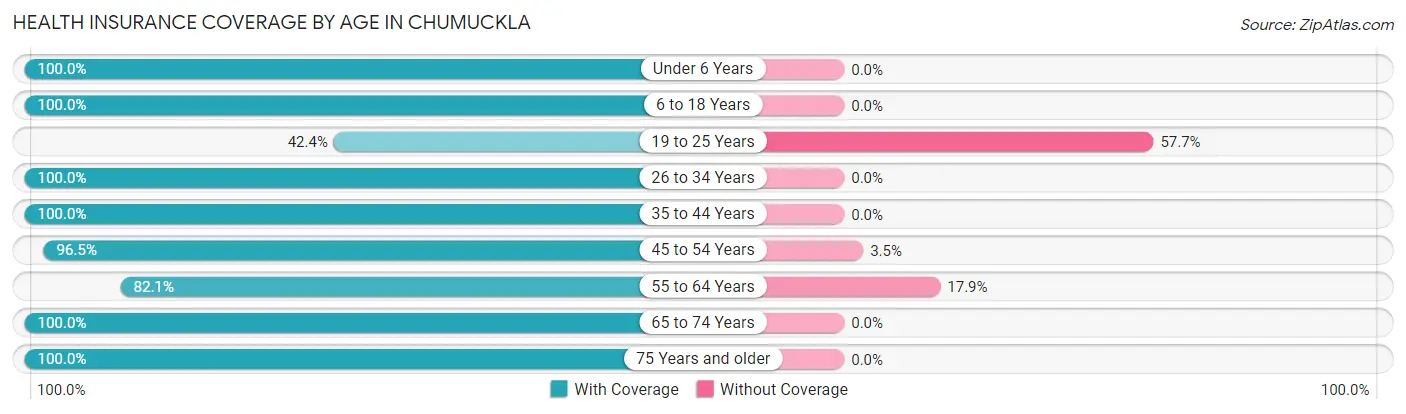
| Age Bracket | With Coverage | Without Coverage |
| Under 6 Years | 40 (100.0%) | 0 (0.0%) |
| 6 to 18 Years | 198 (100.0%) | 0 (0.0%) |
| 19 to 25 Years | 36 (42.3%) | 49 (57.7%) |
| 26 to 34 Years | 32 (100.0%) | 0 (0.0%) |
| 35 to 44 Years | 112 (100.0%) | 0 (0.0%) |
| 45 to 54 Years | 164 (96.5%) | 6 (3.5%) |
| 55 to 64 Years | 55 (82.1%) | 12 (17.9%) |
| 65 to 74 Years | 77 (100.0%) | 0 (0.0%) |
| 75 Years and older | 102 (100.0%) | 0 (0.0%) |
| Total | 816 (92.4%) | 67 (7.6%) |
Health Insurance Coverage by Citizenship Status in Chumuckla
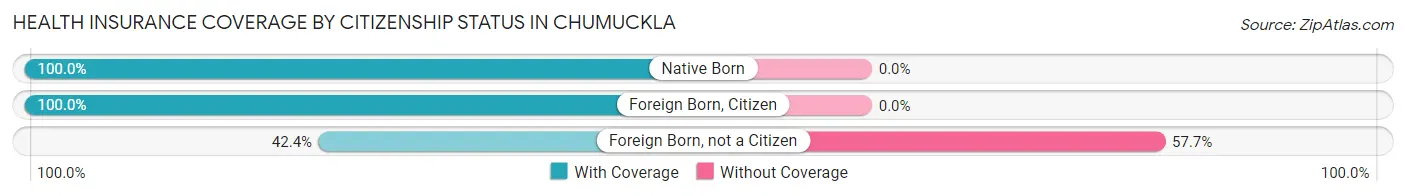
| Citizenship Status | With Coverage | Without Coverage |
| Native Born | 40 (100.0%) | 0 (0.0%) |
| Foreign Born, Citizen | 198 (100.0%) | 0 (0.0%) |
| Foreign Born, not a Citizen | 36 (42.3%) | 49 (57.7%) |
Health Insurance Coverage by Household Income in Chumuckla
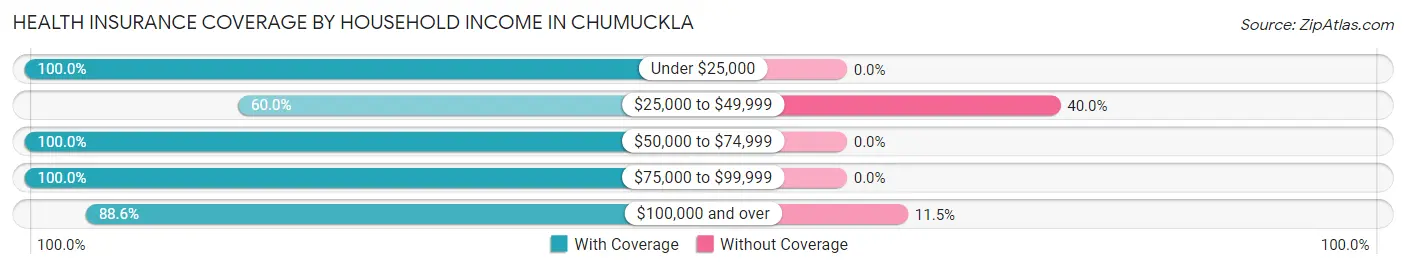
| Household Income | With Coverage | Without Coverage |
| Under $25,000 | 19 (100.0%) | 0 (0.0%) |
| $25,000 to $49,999 | 27 (60.0%) | 18 (40.0%) |
| $50,000 to $74,999 | 372 (100.0%) | 0 (0.0%) |
| $75,000 to $99,999 | 19 (100.0%) | 0 (0.0%) |
| $100,000 and over | 379 (88.5%) | 49 (11.5%) |
Public vs Private Health Insurance Coverage by Age in Chumuckla
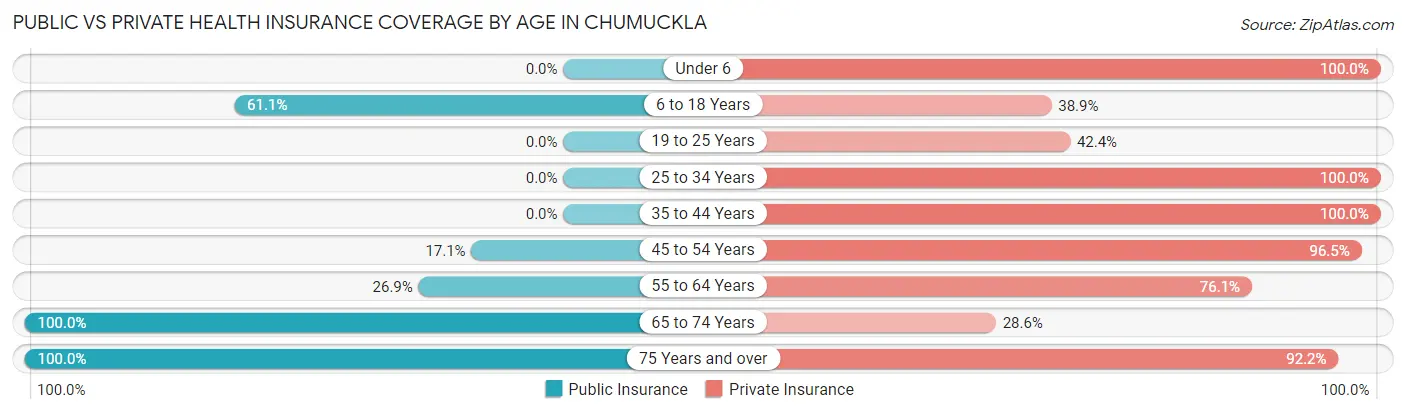
| Age Bracket | Public Insurance | Private Insurance |
| Under 6 | 0 (0.0%) | 40 (100.0%) |
| 6 to 18 Years | 121 (61.1%) | 77 (38.9%) |
| 19 to 25 Years | 0 (0.0%) | 36 (42.3%) |
| 25 to 34 Years | 0 (0.0%) | 32 (100.0%) |
| 35 to 44 Years | 0 (0.0%) | 112 (100.0%) |
| 45 to 54 Years | 29 (17.1%) | 164 (96.5%) |
| 55 to 64 Years | 18 (26.9%) | 51 (76.1%) |
| 65 to 74 Years | 77 (100.0%) | 22 (28.6%) |
| 75 Years and over | 102 (100.0%) | 94 (92.2%) |
| Total | 347 (39.3%) | 628 (71.1%) |
Disability Status by Sex by Age in Chumuckla
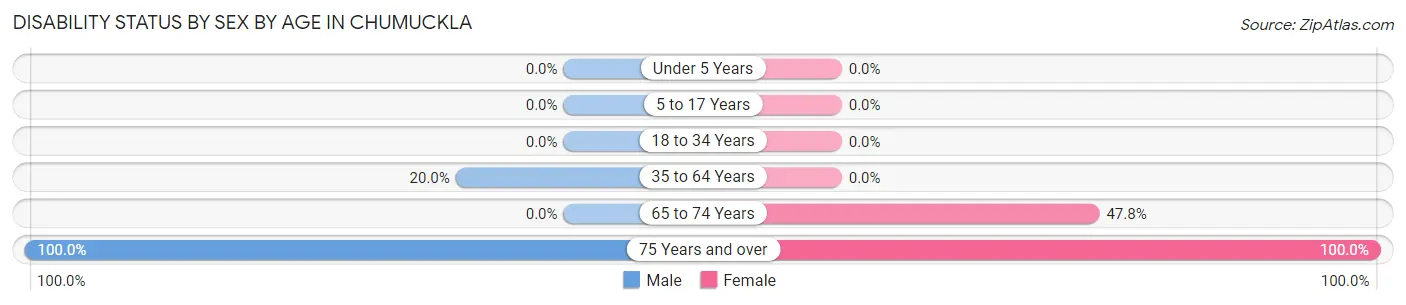
| Age Bracket | Male | Female |
| Under 5 Years | 0 (0.0%) | 0 (0.0%) |
| 5 to 17 Years | 0 (0.0%) | 0 (0.0%) |
| 18 to 34 Years | 0 (0.0%) | 0 (0.0%) |
| 35 to 64 Years | 38 (20.0%) | 0 (0.0%) |
| 65 to 74 Years | 0 (0.0%) | 22 (47.8%) |
| 75 Years and over | 61 (100.0%) | 41 (100.0%) |
Disability Class by Sex by Age in Chumuckla
Disability Class: Hearing Difficulty
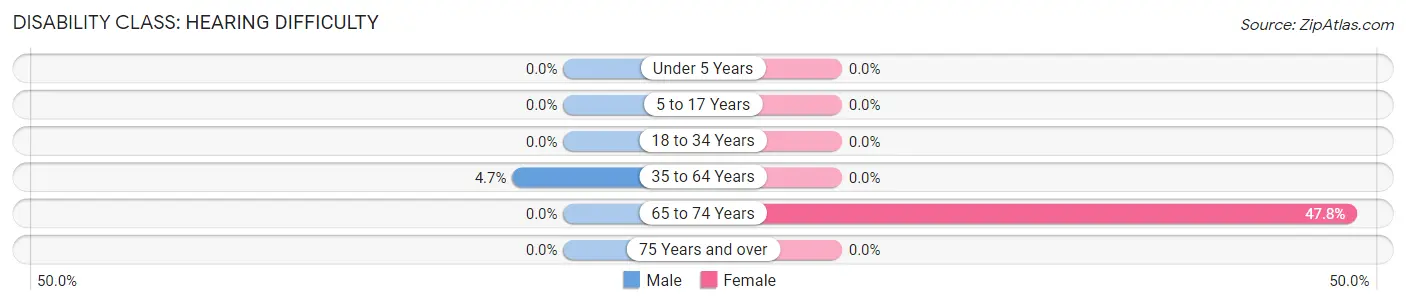
| Age Bracket | Male | Female |
| Under 5 Years | 0 (0.0%) | 0 (0.0%) |
| 5 to 17 Years | 0 (0.0%) | 0 (0.0%) |
| 18 to 34 Years | 0 (0.0%) | 0 (0.0%) |
| 35 to 64 Years | 9 (4.7%) | 0 (0.0%) |
| 65 to 74 Years | 0 (0.0%) | 22 (47.8%) |
| 75 Years and over | 0 (0.0%) | 0 (0.0%) |
Disability Class: Vision Difficulty
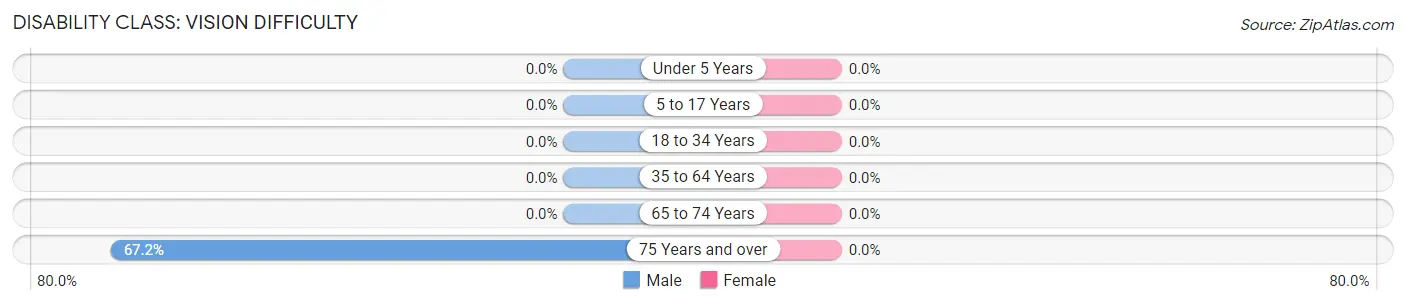
| Age Bracket | Male | Female |
| Under 5 Years | 0 (0.0%) | 0 (0.0%) |
| 5 to 17 Years | 0 (0.0%) | 0 (0.0%) |
| 18 to 34 Years | 0 (0.0%) | 0 (0.0%) |
| 35 to 64 Years | 0 (0.0%) | 0 (0.0%) |
| 65 to 74 Years | 0 (0.0%) | 0 (0.0%) |
| 75 Years and over | 41 (67.2%) | 0 (0.0%) |
Disability Class: Cognitive Difficulty
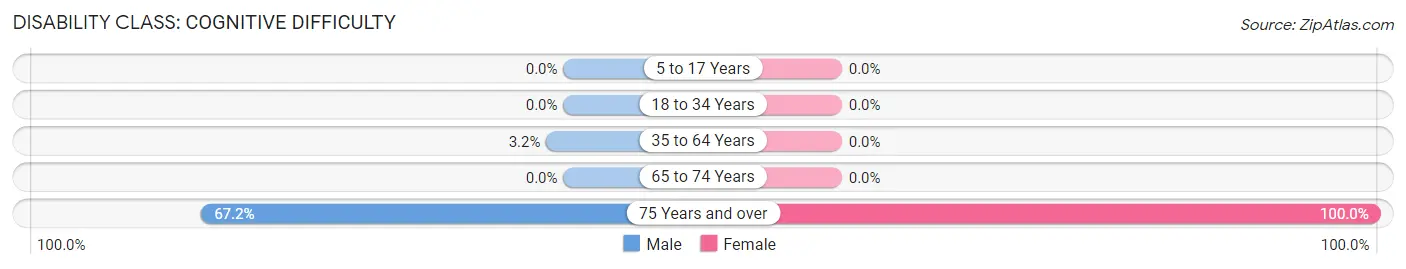
| Age Bracket | Male | Female |
| 5 to 17 Years | 0 (0.0%) | 0 (0.0%) |
| 18 to 34 Years | 0 (0.0%) | 0 (0.0%) |
| 35 to 64 Years | 6 (3.2%) | 0 (0.0%) |
| 65 to 74 Years | 0 (0.0%) | 0 (0.0%) |
| 75 Years and over | 41 (67.2%) | 41 (100.0%) |
Disability Class: Ambulatory Difficulty
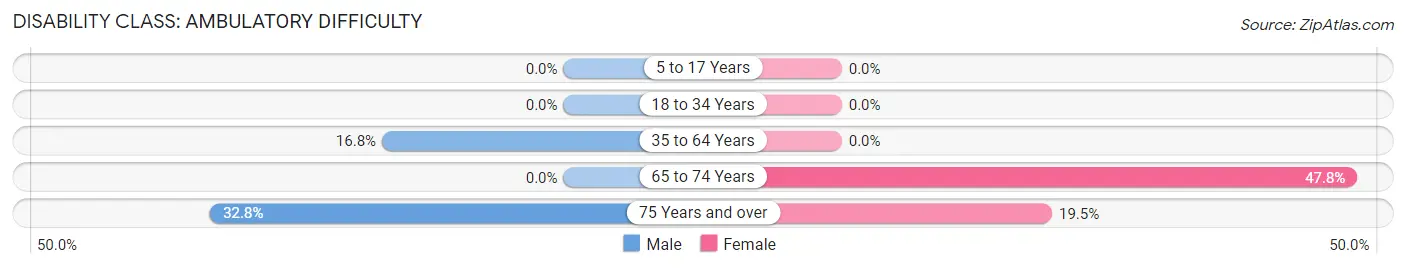
| Age Bracket | Male | Female |
| 5 to 17 Years | 0 (0.0%) | 0 (0.0%) |
| 18 to 34 Years | 0 (0.0%) | 0 (0.0%) |
| 35 to 64 Years | 32 (16.8%) | 0 (0.0%) |
| 65 to 74 Years | 0 (0.0%) | 22 (47.8%) |
| 75 Years and over | 20 (32.8%) | 8 (19.5%) |
Disability Class: Self-Care Difficulty
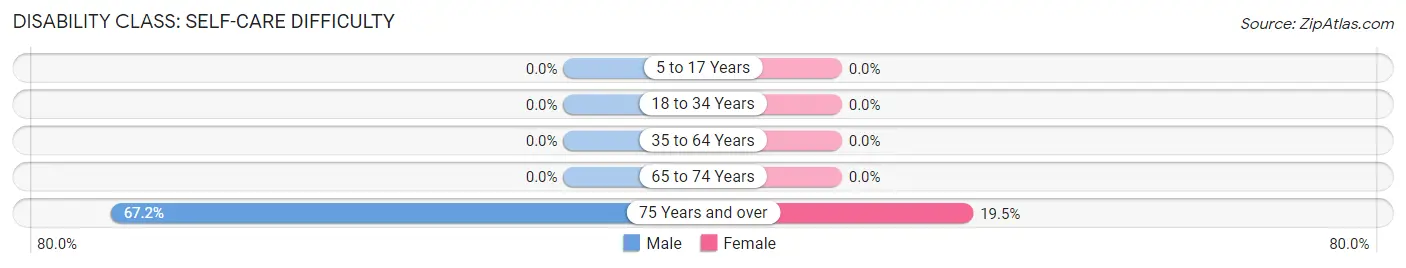
| Age Bracket | Male | Female |
| 5 to 17 Years | 0 (0.0%) | 0 (0.0%) |
| 18 to 34 Years | 0 (0.0%) | 0 (0.0%) |
| 35 to 64 Years | 0 (0.0%) | 0 (0.0%) |
| 65 to 74 Years | 0 (0.0%) | 0 (0.0%) |
| 75 Years and over | 41 (67.2%) | 8 (19.5%) |
Technology Access in Chumuckla
Computing Device Access in Chumuckla
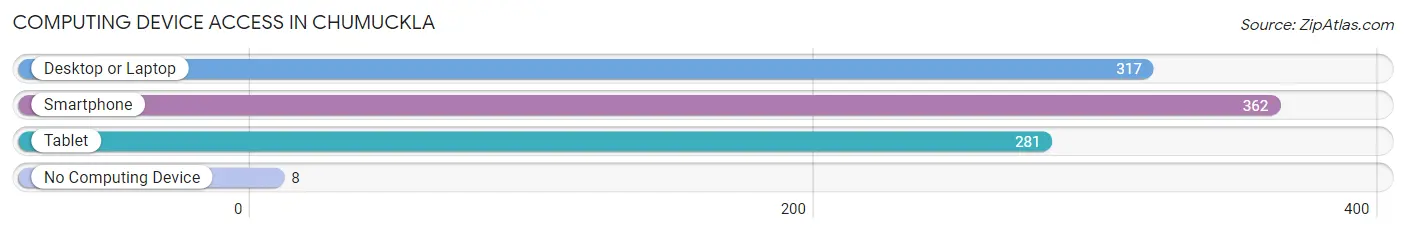
| Device Type | # Households | % Households |
| Desktop or Laptop | 317 | 85.7% |
| Smartphone | 362 | 97.8% |
| Tablet | 281 | 75.9% |
| No Computing Device | 8 | 2.2% |
| Total | 370 | 100.0% |
Internet Access in Chumuckla
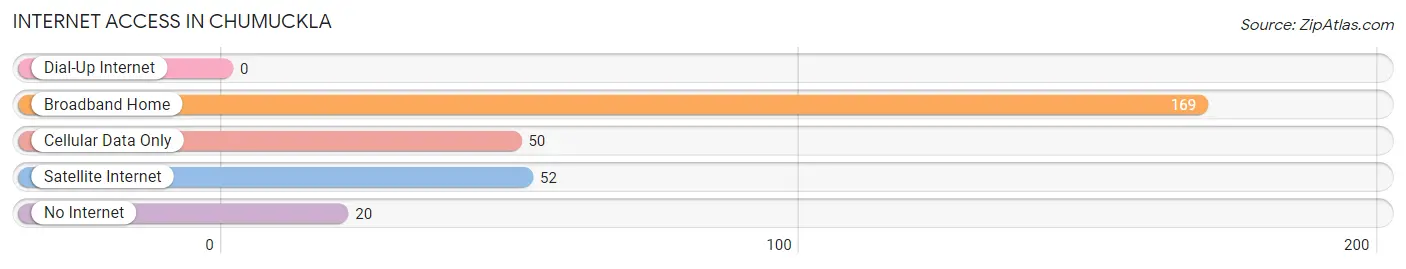
| Internet Type | # Households | % Households |
| Dial-Up Internet | 0 | 0.0% |
| Broadband Home | 169 | 45.7% |
| Cellular Data Only | 50 | 13.5% |
| Satellite Internet | 52 | 14.1% |
| No Internet | 20 | 5.4% |
| Total | 370 | 100.0% |
Chumuckla Summary
Chumuckla is an unincorporated community located in Santa Rosa County, Florida, United States. It is located on the north side of the county, about 10 miles east of Milton and about 20 miles west of Pensacola. The community is part of the Pensacola–Ferry Pass–Brent Metropolitan Statistical Area.
History
Chumuckla was first settled in the early 1800s by settlers from Georgia and Alabama. The community was named after a creek that ran through the area. The creek was named after a Native American chief who lived in the area. The first post office in Chumuckla was established in 1854.
Geography
Chumuckla is located at 30°37'25" North, 87°2'25" West (30.623, -87.040). The elevation is 98 feet (30 m).
The community is located in the northern part of Santa Rosa County, about 10 miles east of Milton and about 20 miles west of Pensacola. It is bordered by the Blackwater River to the north and the Escambia River to the south.
Economy
The economy of Chumuckla is largely based on agriculture. The area is known for its production of corn, soybeans, cotton, and peanuts. The community also has a number of small businesses, including a general store, a gas station, and a few restaurants.
Demographics
As of the 2010 census, the population of Chumuckla was 1,845. The racial makeup of the community was 79.3% White, 17.2% African American, 0.7% Native American, 0.3% Asian, 0.1% Pacific Islander, 1.2% from other races, and 1.4% from two or more races. Hispanic or Latino of any race were 3.2% of the population.
The median household income in Chumuckla was $37,917, and the median family income was $45,938. The per capita income was $18,945. About 17.2% of families and 20.3% of the population were below the poverty line, including 28.2% of those under age 18 and 11.2% of those age 65 or over.
Conclusion
Chumuckla is a small unincorporated community located in Santa Rosa County, Florida. It has a long history, dating back to the early 1800s, and is known for its agricultural production. The population of Chumuckla is largely white, with a small percentage of African Americans, Native Americans, Asians, and Pacific Islanders. The median household income is slightly below the national average, and the poverty rate is higher than the national average. Despite this, Chumuckla is a vibrant community with a strong sense of identity and pride.
Common Questions
What is the Total Population of Chumuckla?
Total Population of Chumuckla is 991.
What is the Total Male Population of Chumuckla?
Total Male Population of Chumuckla is 575.
What is the Total Female Population of Chumuckla?
Total Female Population of Chumuckla is 416.
What is the Ratio of Males per 100 Females in Chumuckla?
There are 138.22 Males per 100 Females in Chumuckla.
What is the Ratio of Females per 100 Males in Chumuckla?
There are 72.35 Females per 100 Males in Chumuckla.
What is the Median Population Age in Chumuckla?
Median Population Age in Chumuckla is 36.9 Years.
What is the Average Family Size in Chumuckla
Average Family Size in Chumuckla is 3.6 People.
What is the Average Household Size in Chumuckla
Average Household Size in Chumuckla is 2.7 People.
What is Per Capita Income in Chumuckla?
Per Capita income in Chumuckla is $47,299.
What is the Median Family Income in Chumuckla?
Median Family Income in Chumuckla is $119,130.
What is the Median Household income in Chumuckla?
Median Household Income in Chumuckla is $103,727.
What is Inequality or Gini Index in Chumuckla?
Inequality or Gini Index in Chumuckla is 0.36.
How Large is the Labor Force in Chumuckla?
There are 542 People in the Labor Forcein in Chumuckla.
What is the Percentage of People in the Labor Force in Chumuckla?
66.8% of People are in the Labor Force in Chumuckla.