Alachua County, FL
Alachua County Map
Alachua County Overview
279,729
TOTAL POPULATION
135,121
MALE POPULATION
144,608
FEMALE POPULATION
93.44
MALES / 100 FEMALES
107.02
FEMALES / 100 MALES
31.7
MEDIAN AGE
3.2
AVG FAMILY SIZE
2.4
AVG HOUSEHOLD SIZE
$35,684
PER CAPITA INCOME
$89,713
AVG FAMILY INCOME
$57,566
AVG HOUSEHOLD INCOME
17.2%
WAGE / INCOME GAP [ % ]
82.8¢/ $1
WAGE / INCOME GAP [ $ ]
$10,728
FAMILY INCOME DEFICIT
0.52
INEQUALITY / GINI INDEX
140,425
LABOR FORCE [ PEOPLE ]
59.7%
PERCENT IN LABOR FORCE
5.1%
UNEMPLOYMENT RATE
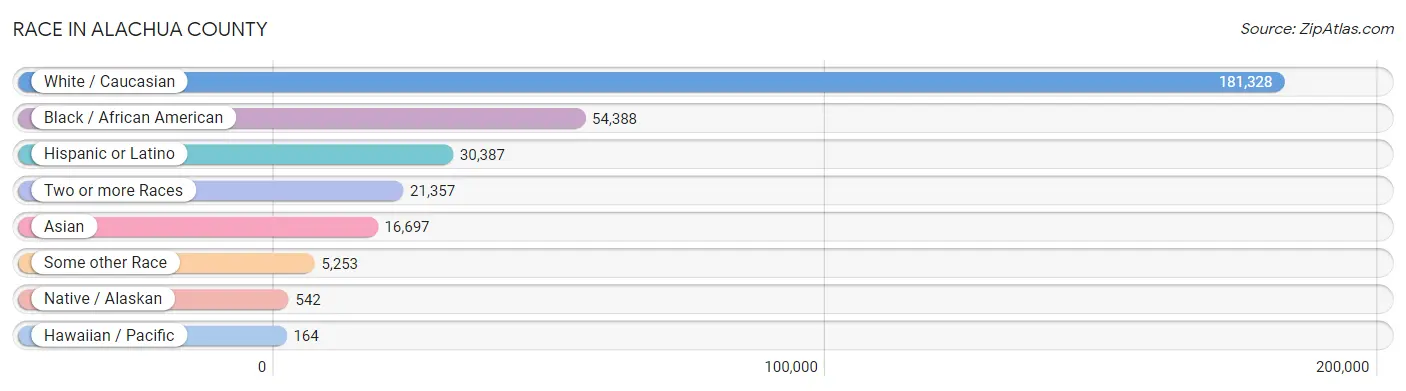
Race in Alachua County
The most populous races in Alachua County are White / Caucasian (181,328 | 64.8%), Black / African American (54,388 | 19.4%), and Hispanic or Latino (30,387 | 10.9%).
| Race | # Population | % Population |
| Asian | 16,697 | 6.0% |
| Black / African American | 54,388 | 19.4% |
| Hawaiian / Pacific | 164 | 0.1% |
| Hispanic or Latino | 30,387 | 10.9% |
| Native / Alaskan | 542 | 0.2% |
| White / Caucasian | 181,328 | 64.8% |
| Two or more Races | 21,357 | 7.6% |
| Some other Race | 5,253 | 1.9% |
| Total | 279,729 | 100.0% |
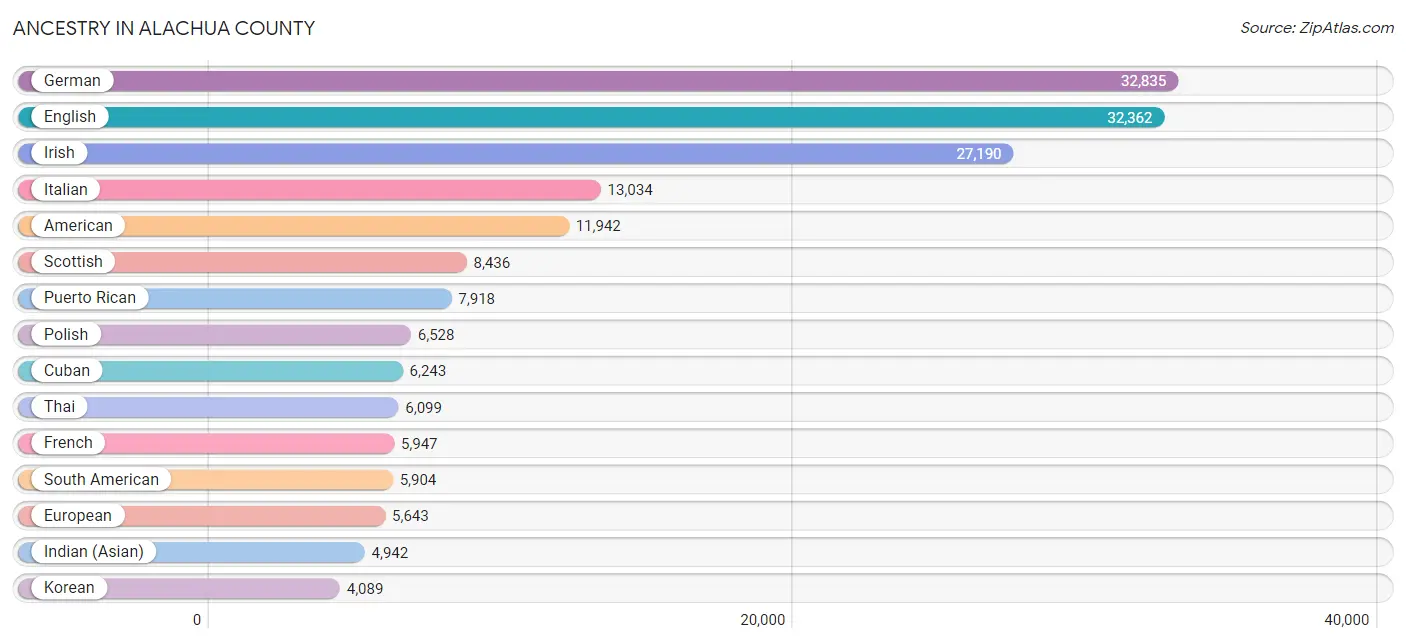
Ancestry in Alachua County
The most populous ancestries reported in Alachua County are German (32,835 | 11.7%), English (32,362 | 11.6%), Irish (27,190 | 9.7%), Italian (13,034 | 4.7%), and American (11,942 | 4.3%), together accounting for 42.0% of all Alachua County residents.
| Ancestry | # Population | % Population |
| Afghan | 4 | 0.0% |
| African | 989 | 0.4% |
| Alaskan Athabascan | 12 | 0.0% |
| Albanian | 399 | 0.1% |
| Alsatian | 6 | 0.0% |
| American | 11,942 | 4.3% |
| Apache | 12 | 0.0% |
| Arab | 2,606 | 0.9% |
| Argentinean | 571 | 0.2% |
| Armenian | 143 | 0.1% |
| Australian | 86 | 0.0% |
| Austrian | 616 | 0.2% |
| Bahamian | 333 | 0.1% |
| Basque | 22 | 0.0% |
| Belgian | 396 | 0.1% |
| Belizean | 48 | 0.0% |
| Bhutanese | 823 | 0.3% |
| Blackfeet | 67 | 0.0% |
| Bolivian | 282 | 0.1% |
| Brazilian | 1,130 | 0.4% |
| British | 2,631 | 0.9% |
| Bulgarian | 161 | 0.1% |
| Burmese | 1,900 | 0.7% |
| Cajun | 26 | 0.0% |
| Canadian | 899 | 0.3% |
| Cape Verdean | 4 | 0.0% |
| Celtic | 41 | 0.0% |
| Central American | 3,102 | 1.1% |
| Central American Indian | 159 | 0.1% |
| Cherokee | 575 | 0.2% |
| Chickasaw | 68 | 0.0% |
| Chilean | 189 | 0.1% |
| Chippewa | 103 | 0.0% |
| Choctaw | 126 | 0.1% |
| Colombian | 1,775 | 0.6% |
| Comanche | 1 | 0.0% |
| Costa Rican | 283 | 0.1% |
| Creek | 38 | 0.0% |
| Croatian | 223 | 0.1% |
| Cuban | 6,243 | 2.2% |
| Czech | 504 | 0.2% |
| Czechoslovakian | 219 | 0.1% |
| Danish | 832 | 0.3% |
| Delaware | 20 | 0.0% |
| Dominican | 950 | 0.3% |
| Dutch | 2,323 | 0.8% |
| Eastern European | 955 | 0.3% |
| Ecuadorian | 458 | 0.2% |
| Egyptian | 639 | 0.2% |
| English | 32,362 | 11.6% |
| Ethiopian | 246 | 0.1% |
| European | 5,643 | 2.0% |
| Filipino | 282 | 0.1% |
| Finnish | 416 | 0.2% |
| French | 5,947 | 2.1% |
| French Canadian | 1,539 | 0.5% |
| German | 32,835 | 11.7% |
| German Russian | 9 | 0.0% |
| Ghanaian | 19 | 0.0% |
| Greek | 1,160 | 0.4% |
| Guamanian / Chamorro | 73 | 0.0% |
| Guatemalan | 483 | 0.2% |
| Guyanese | 160 | 0.1% |
| Haitian | 1,028 | 0.4% |
| Honduran | 788 | 0.3% |
| Hungarian | 1,328 | 0.5% |
| Indian (Asian) | 4,942 | 1.8% |
| Indonesian | 115 | 0.0% |
| Iranian | 926 | 0.3% |
| Iraqi | 82 | 0.0% |
| Irish | 27,190 | 9.7% |
| Iroquois | 62 | 0.0% |
| Israeli | 267 | 0.1% |
| Italian | 13,034 | 4.7% |
| Jamaican | 1,934 | 0.7% |
| Japanese | 46 | 0.0% |
| Jordanian | 125 | 0.0% |
| Kenyan | 124 | 0.0% |
| Korean | 4,089 | 1.5% |
| Laotian | 301 | 0.1% |
| Latvian | 61 | 0.0% |
| Lebanese | 583 | 0.2% |
| Lithuanian | 551 | 0.2% |
| Lumbee | 55 | 0.0% |
| Luxembourger | 219 | 0.1% |
| Macedonian | 45 | 0.0% |
| Malaysian | 96 | 0.0% |
| Mexican | 3,697 | 1.3% |
| Mexican American Indian | 168 | 0.1% |
| Mongolian | 7 | 0.0% |
| Moroccan | 3 | 0.0% |
| Native Hawaiian | 375 | 0.1% |
| Navajo | 66 | 0.0% |
| New Zealander | 12 | 0.0% |
| Nicaraguan | 582 | 0.2% |
| Nigerian | 127 | 0.1% |
| Northern European | 514 | 0.2% |
| Norwegian | 2,046 | 0.7% |
| Pakistani | 100 | 0.0% |
| Palestinian | 247 | 0.1% |
| Panamanian | 294 | 0.1% |
| Paraguayan | 203 | 0.1% |
| Pennsylvania German | 112 | 0.0% |
| Peruvian | 756 | 0.3% |
| Polish | 6,528 | 2.3% |
| Portuguese | 1,017 | 0.4% |
| Potawatomi | 35 | 0.0% |
| Pueblo | 114 | 0.0% |
| Puerto Rican | 7,918 | 2.8% |
| Puget Sound Salish | 6 | 0.0% |
| Romanian | 233 | 0.1% |
| Russian | 2,225 | 0.8% |
| Salvadoran | 672 | 0.2% |
| Samoan | 32 | 0.0% |
| Scandinavian | 971 | 0.4% |
| Scotch-Irish | 3,191 | 1.1% |
| Scottish | 8,436 | 3.0% |
| Seminole | 23 | 0.0% |
| Serbian | 98 | 0.0% |
| Sioux | 53 | 0.0% |
| Slavic | 26 | 0.0% |
| Slovak | 327 | 0.1% |
| Slovene | 538 | 0.2% |
| South African | 209 | 0.1% |
| South American | 5,904 | 2.1% |
| South American Indian | 298 | 0.1% |
| Spaniard | 1,051 | 0.4% |
| Spanish | 374 | 0.1% |
| Spanish American | 14 | 0.0% |
| Sri Lankan | 1,687 | 0.6% |
| Subsaharan African | 1,806 | 0.6% |
| Swedish | 2,570 | 0.9% |
| Swiss | 553 | 0.2% |
| Syrian | 263 | 0.1% |
| Thai | 6,099 | 2.2% |
| Tongan | 75 | 0.0% |
| Trinidadian and Tobagonian | 297 | 0.1% |
| Turkish | 756 | 0.3% |
| U.S. Virgin Islander | 336 | 0.1% |
| Ukrainian | 727 | 0.3% |
| Uruguayan | 37 | 0.0% |
| Venezuelan | 1,568 | 0.6% |
| Vietnamese | 234 | 0.1% |
| Welsh | 1,925 | 0.7% |
| West Indian | 263 | 0.1% |
| Yugoslavian | 206 | 0.1% | View All 146 Rows |
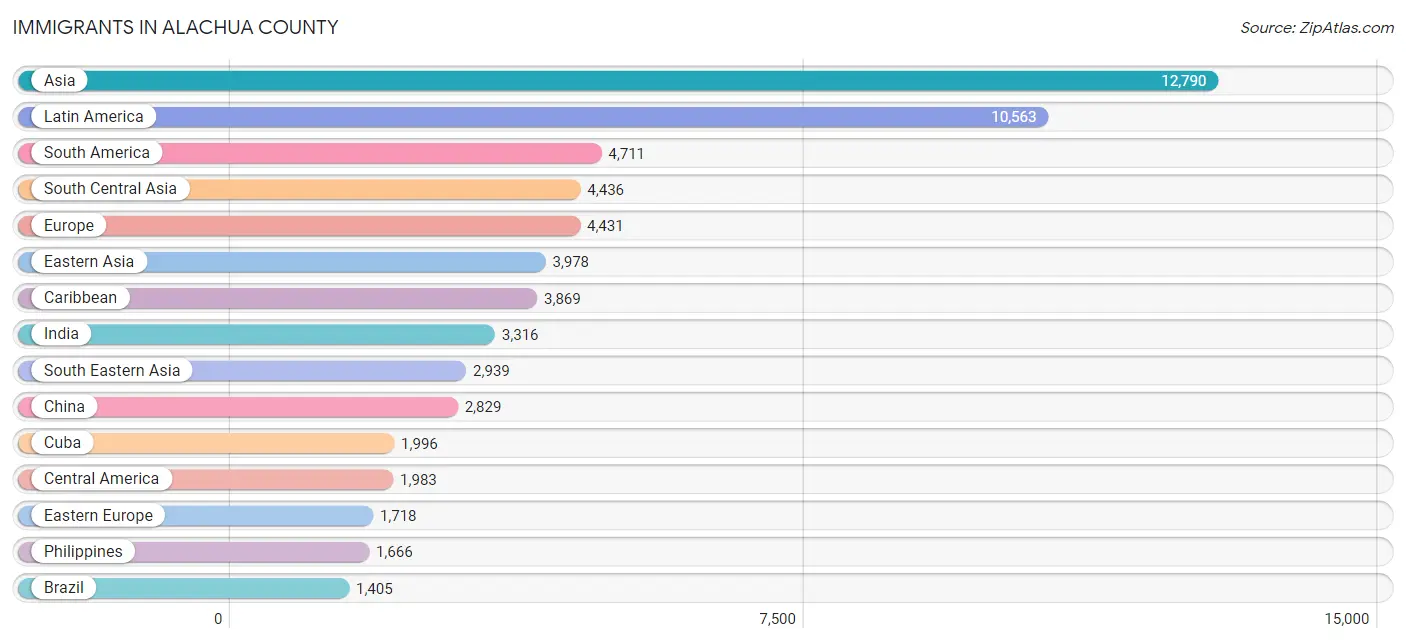
Immigrants in Alachua County
The most numerous immigrant groups reported in Alachua County came from Asia (12,790 | 4.6%), Latin America (10,563 | 3.8%), South America (4,711 | 1.7%), South Central Asia (4,436 | 1.6%), and Europe (4,431 | 1.6%), together accounting for 13.2% of all Alachua County residents.
| Immigration Origin | # Population | % Population |
| Africa | 1,061 | 0.4% |
| Albania | 282 | 0.1% |
| Argentina | 342 | 0.1% |
| Asia | 12,790 | 4.6% |
| Australia | 15 | 0.0% |
| Austria | 18 | 0.0% |
| Bahamas | 65 | 0.0% |
| Bangladesh | 272 | 0.1% |
| Belarus | 35 | 0.0% |
| Belgium | 151 | 0.1% |
| Belize | 7 | 0.0% |
| Bolivia | 14 | 0.0% |
| Bosnia and Herzegovina | 20 | 0.0% |
| Brazil | 1,405 | 0.5% |
| Bulgaria | 75 | 0.0% |
| Cambodia | 24 | 0.0% |
| Cameroon | 83 | 0.0% |
| Canada | 1,234 | 0.4% |
| Caribbean | 3,869 | 1.4% |
| Central America | 1,983 | 0.7% |
| Chile | 32 | 0.0% |
| China | 2,829 | 1.0% |
| Colombia | 1,128 | 0.4% |
| Congo | 3 | 0.0% |
| Costa Rica | 78 | 0.0% |
| Croatia | 6 | 0.0% |
| Cuba | 1,996 | 0.7% |
| Czechoslovakia | 94 | 0.0% |
| Dominica | 15 | 0.0% |
| Dominican Republic | 168 | 0.1% |
| Eastern Africa | 298 | 0.1% |
| Eastern Asia | 3,978 | 1.4% |
| Eastern Europe | 1,718 | 0.6% |
| Ecuador | 206 | 0.1% |
| Egypt | 145 | 0.1% |
| El Salvador | 298 | 0.1% |
| England | 301 | 0.1% |
| Ethiopia | 168 | 0.1% |
| Europe | 4,431 | 1.6% |
| Fiji | 15 | 0.0% |
| France | 268 | 0.1% |
| Germany | 491 | 0.2% |
| Ghana | 19 | 0.0% |
| Greece | 16 | 0.0% |
| Guatemala | 281 | 0.1% |
| Guyana | 77 | 0.0% |
| Haiti | 470 | 0.2% |
| Honduras | 270 | 0.1% |
| Hong Kong | 97 | 0.0% |
| Hungary | 35 | 0.0% |
| India | 3,316 | 1.2% |
| Indonesia | 165 | 0.1% |
| Iran | 634 | 0.2% |
| Iraq | 78 | 0.0% |
| Ireland | 220 | 0.1% |
| Israel | 259 | 0.1% |
| Italy | 186 | 0.1% |
| Jamaica | 713 | 0.3% |
| Japan | 187 | 0.1% |
| Jordan | 70 | 0.0% |
| Kenya | 91 | 0.0% |
| Korea | 962 | 0.3% |
| Kuwait | 57 | 0.0% |
| Laos | 41 | 0.0% |
| Latin America | 10,563 | 3.8% |
| Latvia | 35 | 0.0% |
| Lebanon | 50 | 0.0% |
| Malaysia | 87 | 0.0% |
| Mexico | 816 | 0.3% |
| Middle Africa | 138 | 0.1% |
| Morocco | 17 | 0.0% |
| Nepal | 47 | 0.0% |
| Netherlands | 270 | 0.1% |
| Nicaragua | 190 | 0.1% |
| Nigeria | 92 | 0.0% |
| Northern Africa | 162 | 0.1% |
| Northern Europe | 980 | 0.4% |
| Norway | 96 | 0.0% |
| Oceania | 120 | 0.0% |
| Pakistan | 149 | 0.1% |
| Panama | 43 | 0.0% |
| Peru | 222 | 0.1% |
| Philippines | 1,666 | 0.6% |
| Poland | 123 | 0.0% |
| Portugal | 3 | 0.0% |
| Romania | 75 | 0.0% |
| Russia | 406 | 0.2% |
| Saudi Arabia | 248 | 0.1% |
| Scotland | 27 | 0.0% |
| Serbia | 6 | 0.0% |
| Singapore | 36 | 0.0% |
| South Africa | 214 | 0.1% |
| South America | 4,711 | 1.7% |
| South Central Asia | 4,436 | 1.6% |
| South Eastern Asia | 2,939 | 1.1% |
| Southern Europe | 510 | 0.2% |
| Spain | 305 | 0.1% |
| Sri Lanka | 18 | 0.0% |
| Sweden | 39 | 0.0% |
| Switzerland | 25 | 0.0% |
| Taiwan | 171 | 0.1% |
| Thailand | 83 | 0.0% |
| Trinidad and Tobago | 238 | 0.1% |
| Turkey | 432 | 0.2% |
| Uganda | 26 | 0.0% |
| Ukraine | 217 | 0.1% |
| Uruguay | 21 | 0.0% |
| Venezuela | 1,074 | 0.4% |
| Vietnam | 837 | 0.3% |
| Western Africa | 207 | 0.1% |
| Western Asia | 1,306 | 0.5% |
| Western Europe | 1,223 | 0.4% |
| Yemen | 98 | 0.0% |
| Zaire | 52 | 0.0% | View All 114 Rows |
Sex and Age in Alachua County
Sex and Age in Alachua County
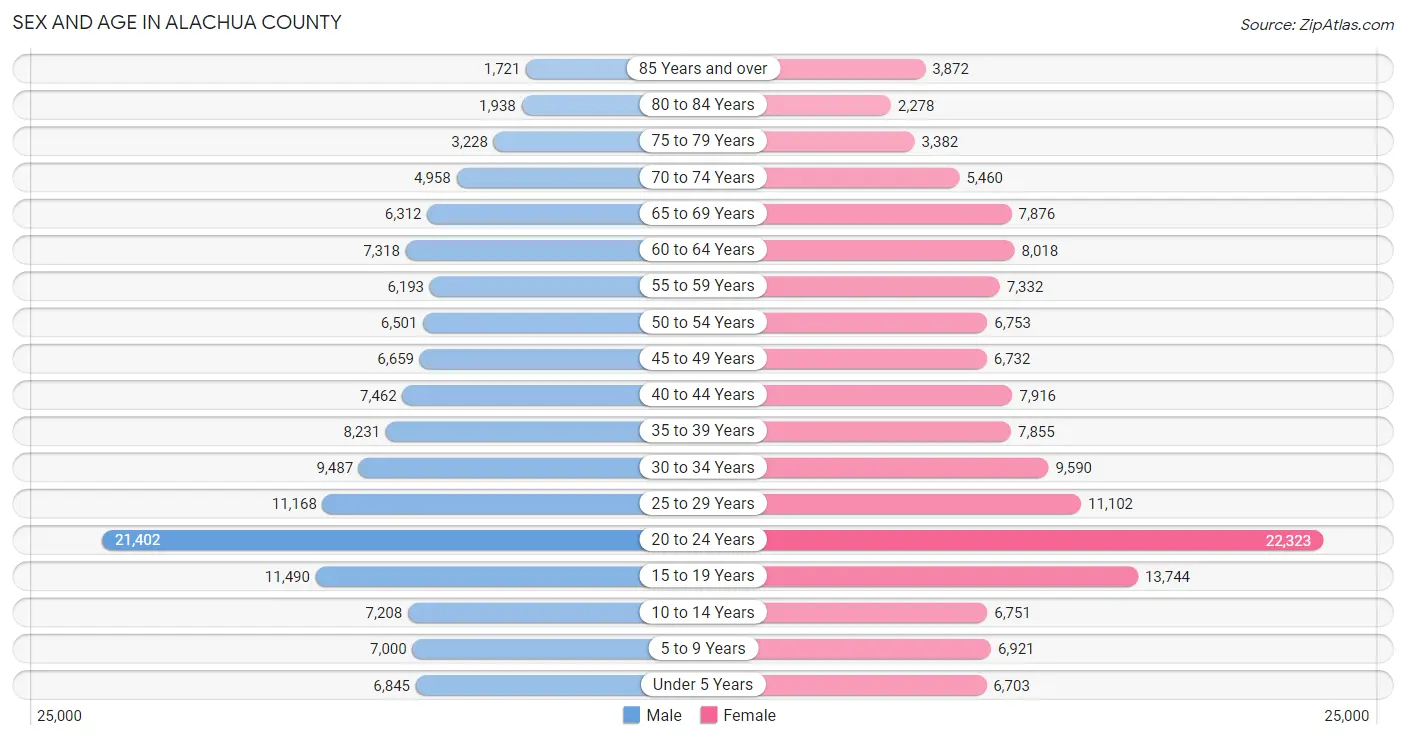
The most populous age groups in Alachua County are 20 to 24 Years (21,402 | 15.8%) for men and 20 to 24 Years (22,323 | 15.4%) for women.
| Age Bracket | Male | Female |
| Under 5 Years | 6,845 (5.1%) | 6,703 (4.6%) |
| 5 to 9 Years | 7,000 (5.2%) | 6,921 (4.8%) |
| 10 to 14 Years | 7,208 (5.3%) | 6,751 (4.7%) |
| 15 to 19 Years | 11,490 (8.5%) | 13,744 (9.5%) |
| 20 to 24 Years | 21,402 (15.8%) | 22,323 (15.4%) |
| 25 to 29 Years | 11,168 (8.3%) | 11,102 (7.7%) |
| 30 to 34 Years | 9,487 (7.0%) | 9,590 (6.6%) |
| 35 to 39 Years | 8,231 (6.1%) | 7,855 (5.4%) |
| 40 to 44 Years | 7,462 (5.5%) | 7,916 (5.5%) |
| 45 to 49 Years | 6,659 (4.9%) | 6,732 (4.7%) |
| 50 to 54 Years | 6,501 (4.8%) | 6,753 (4.7%) |
| 55 to 59 Years | 6,193 (4.6%) | 7,332 (5.1%) |
| 60 to 64 Years | 7,318 (5.4%) | 8,018 (5.5%) |
| 65 to 69 Years | 6,312 (4.7%) | 7,876 (5.4%) |
| 70 to 74 Years | 4,958 (3.7%) | 5,460 (3.8%) |
| 75 to 79 Years | 3,228 (2.4%) | 3,382 (2.3%) |
| 80 to 84 Years | 1,938 (1.4%) | 2,278 (1.6%) |
| 85 Years and over | 1,721 (1.3%) | 3,872 (2.7%) |
| Total | 135,121 (100.0%) | 144,608 (100.0%) |
Families and Households in Alachua County
Median Family Size in Alachua County
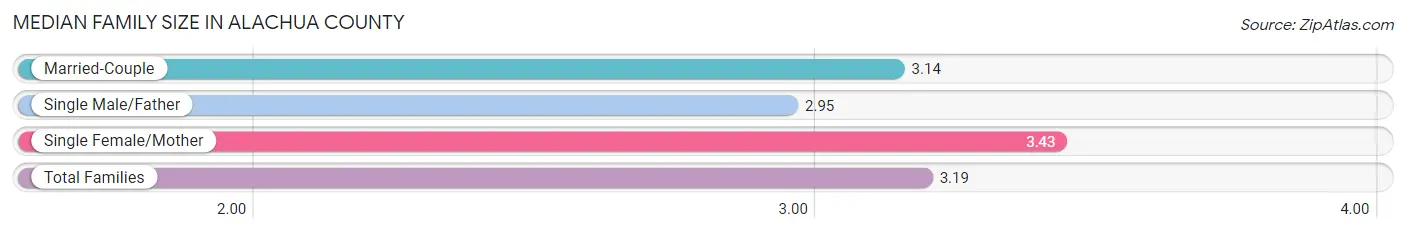
The median family size in Alachua County is 3.19 persons per family, with single female/mother families (11,279 | 20.4%) accounting for the largest median family size of 3.43 persons per family. On the other hand, single male/father families (3,384 | 6.1%) represent the smallest median family size with 2.95 persons per family.
| Family Type | # Families | Family Size |
| Married-Couple | 40,550 (73.4%) | 3.14 |
| Single Male/Father | 3,384 (6.1%) | 2.95 |
| Single Female/Mother | 11,279 (20.4%) | 3.43 |
| Total Families | 55,213 (100.0%) | 3.19 |
Median Household Size in Alachua County
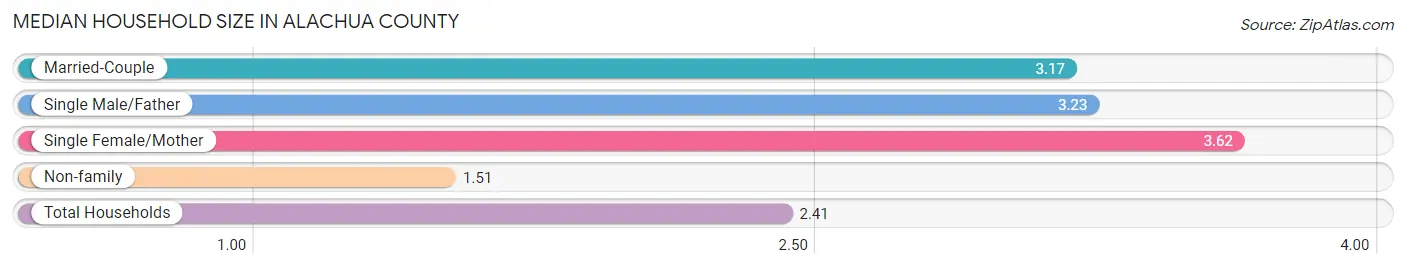
The median household size in Alachua County is 2.41 persons per household, with single female/mother households (11,279 | 10.4%) accounting for the largest median household size of 3.62 persons per household. non-family households (53,384 | 49.2%) represent the smallest median household size with 1.51 persons per household.
| Household Type | # Households | Household Size |
| Married-Couple | 40,550 (37.3%) | 3.17 |
| Single Male/Father | 3,384 (3.1%) | 3.23 |
| Single Female/Mother | 11,279 (10.4%) | 3.62 |
| Non-family | 53,384 (49.2%) | 1.51 |
| Total Households | 108,597 (100.0%) | 2.41 |
Household Size by Marriage Status in Alachua County
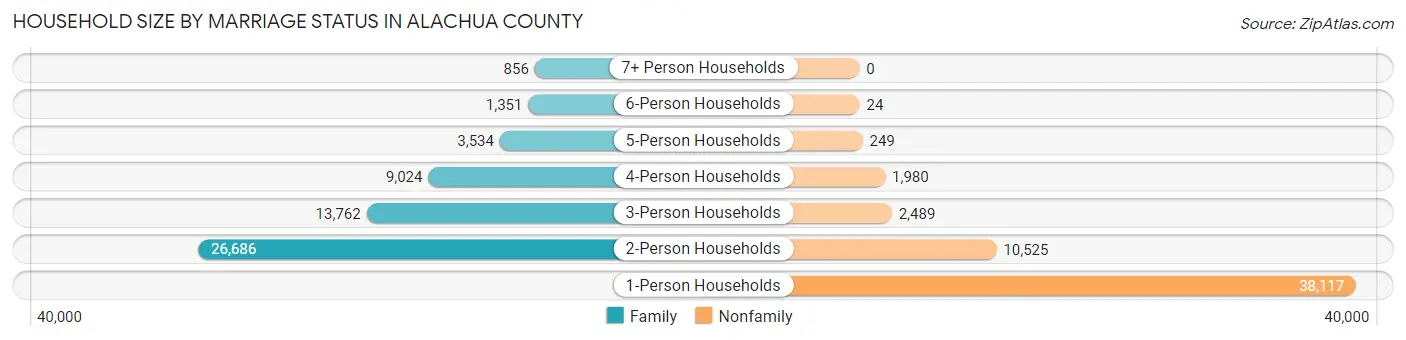
Out of a total of 108,597 households in Alachua County, 55,213 (50.8%) are family households, while 53,384 (49.2%) are nonfamily households. The most numerous type of family households are 2-person households, comprising 26,686, and the most common type of nonfamily households are 1-person households, comprising 38,117.
| Household Size | Family Households | Nonfamily Households |
| 1-Person Households | - | 38,117 (35.1%) |
| 2-Person Households | 26,686 (24.6%) | 10,525 (9.7%) |
| 3-Person Households | 13,762 (12.7%) | 2,489 (2.3%) |
| 4-Person Households | 9,024 (8.3%) | 1,980 (1.8%) |
| 5-Person Households | 3,534 (3.3%) | 249 (0.2%) |
| 6-Person Households | 1,351 (1.2%) | 24 (0.0%) |
| 7+ Person Households | 856 (0.8%) | 0 (0.0%) |
| Total | 55,213 (50.8%) | 53,384 (49.2%) |
Female Fertility in Alachua County
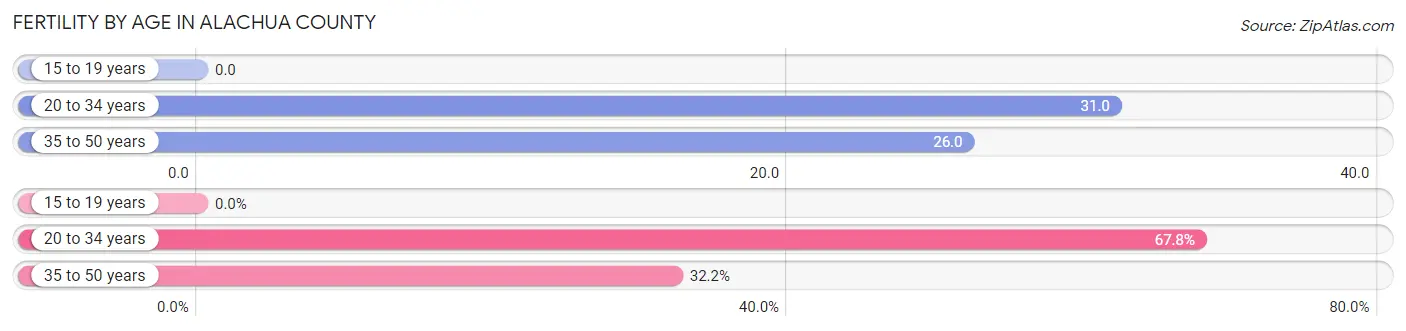
Fertility by Age in Alachua County
Average fertility rate in Alachua County is 24.0 births per 1,000 women. Women in the age bracket of 20 to 34 years have the highest fertility rate with 31.0 births per 1,000 women. Women in the age bracket of 20 to 34 years acount for 67.8% of all women with births.
| Age Bracket | Women with Births | Births / 1,000 Women |
| 15 to 19 years | 0 (0.0%) | 0.0 |
| 20 to 34 years | 1,319 (67.8%) | 31.0 |
| 35 to 50 years | 627 (32.2%) | 26.0 |
| Total | 1,946 (100.0%) | 24.0 |
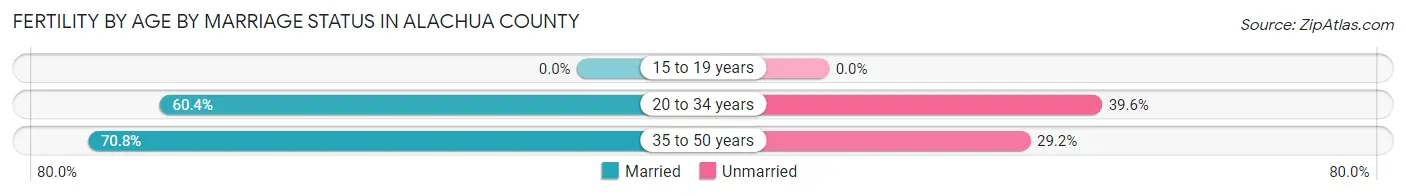
Fertility by Age by Marriage Status in Alachua County
63.8% of women with births (1,946) in Alachua County are married. The highest percentage of unmarried women with births falls into 20 to 34 years age bracket with 39.6% of them unmarried at the time of birth, while the lowest percentage of unmarried women with births belong to 35 to 50 years age bracket with 29.2% of them unmarried.
| Age Bracket | Married | Unmarried |
| 15 to 19 years | 0 (0.0%) | 0 (0.0%) |
| 20 to 34 years | 797 (60.4%) | 522 (39.6%) |
| 35 to 50 years | 444 (70.8%) | 183 (29.2%) |
| Total | 1,242 (63.8%) | 704 (36.2%) |
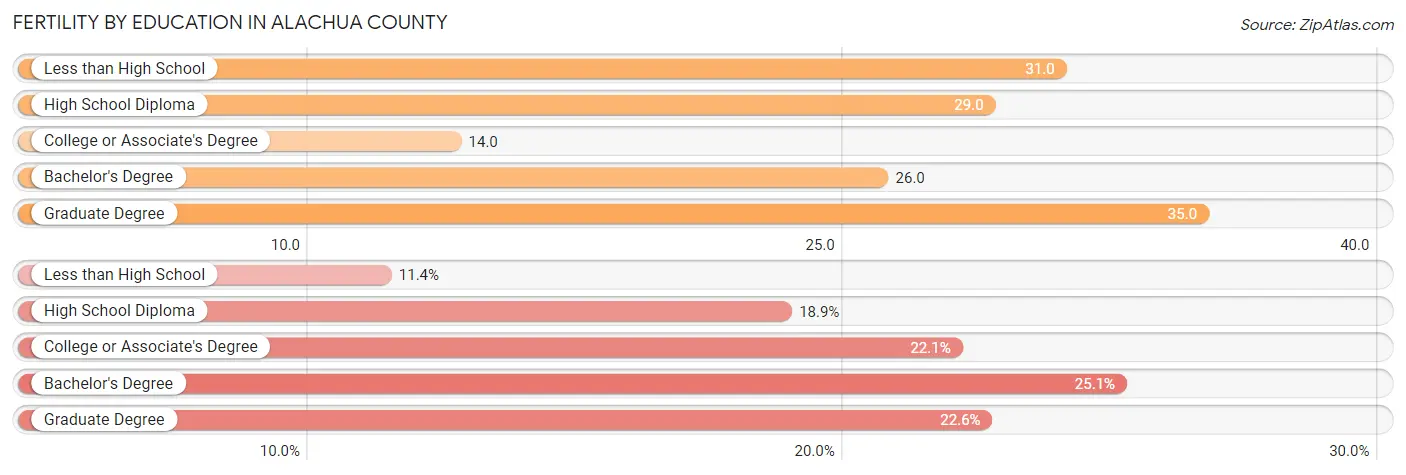
Fertility by Education in Alachua County
Average fertility rate in Alachua County is 24.0 births per 1,000 women. Women with the education attainment of graduate degree have the highest fertility rate of 35.0 births per 1,000 women, while women with the education attainment of college or associate's degree have the lowest fertility at 14.0 births per 1,000 women. Women with the education attainment of bachelor's degree represent 25.1% of all women with births.
| Educational Attainment | Women with Births | Births / 1,000 Women |
| Less than High School | 221 (11.4%) | 31.0 |
| High School Diploma | 367 (18.9%) | 29.0 |
| College or Associate's Degree | 429 (22.1%) | 14.0 |
| Bachelor's Degree | 489 (25.1%) | 26.0 |
| Graduate Degree | 440 (22.6%) | 35.0 |
| Total | 1,946 (100.0%) | 24.0 |
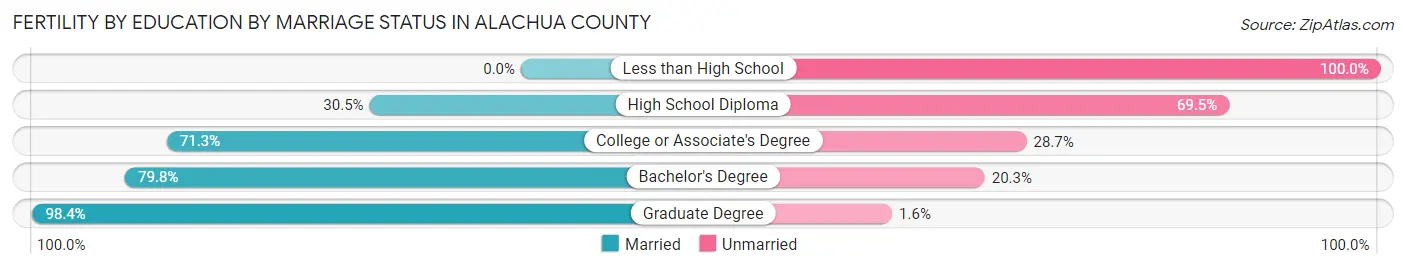
Fertility by Education by Marriage Status in Alachua County
36.2% of women with births in Alachua County are unmarried. Women with the educational attainment of graduate degree are most likely to be married with 98.4% of them married at childbirth, while women with the educational attainment of less than high school are least likely to be married with 100.0% of them unmarried at childbirth.
| Educational Attainment | Married | Unmarried |
| Less than High School | 0 (0.0%) | 221 (100.0%) |
| High School Diploma | 112 (30.5%) | 255 (69.5%) |
| College or Associate's Degree | 306 (71.3%) | 123 (28.7%) |
| Bachelor's Degree | 390 (79.7%) | 99 (20.3%) |
| Graduate Degree | 433 (98.4%) | 7 (1.6%) |
| Total | 1,242 (63.8%) | 704 (36.2%) |
Income in Alachua County
Income Overview in Alachua County
Per Capita Income in Alachua County is $35,684, while median incomes of families and households are $89,713 and $57,566 respectively.
| Characteristic | Number | Measure |
| Per Capita Income | 279,729 | $35,684 |
| Median Family Income | 55,213 | $89,713 |
| Mean Family Income | 55,213 | $121,598 |
| Median Household Income | 108,597 | $57,566 |
| Mean Household Income | 108,597 | $87,691 |
| Income Deficit | 55,213 | $10,728 |
| Wage / Income Gap (%) | 279,729 | 17.21% |
| Wage / Income Gap ($) | 279,729 | 82.79¢ per $1 |
| Gini / Inequality Index | 279,729 | 0.52 |
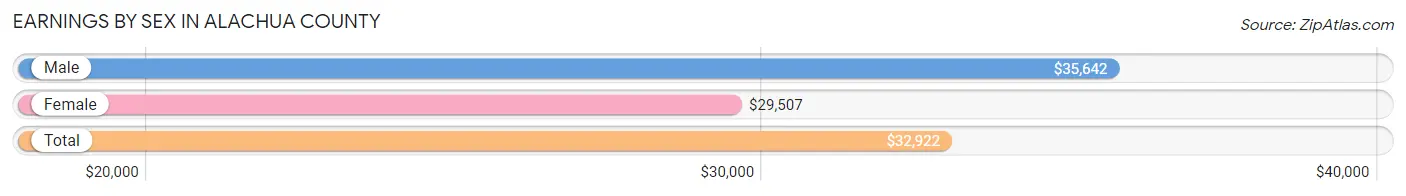
Earnings by Sex in Alachua County
Average Earnings in Alachua County are $32,922, $35,642 for men and $29,507 for women, a difference of 17.2%.
| Sex | Number | Average Earnings |
| Male | 76,312 (50.0%) | $35,642 |
| Female | 76,276 (50.0%) | $29,507 |
| Total | 152,588 (100.0%) | $32,922 |
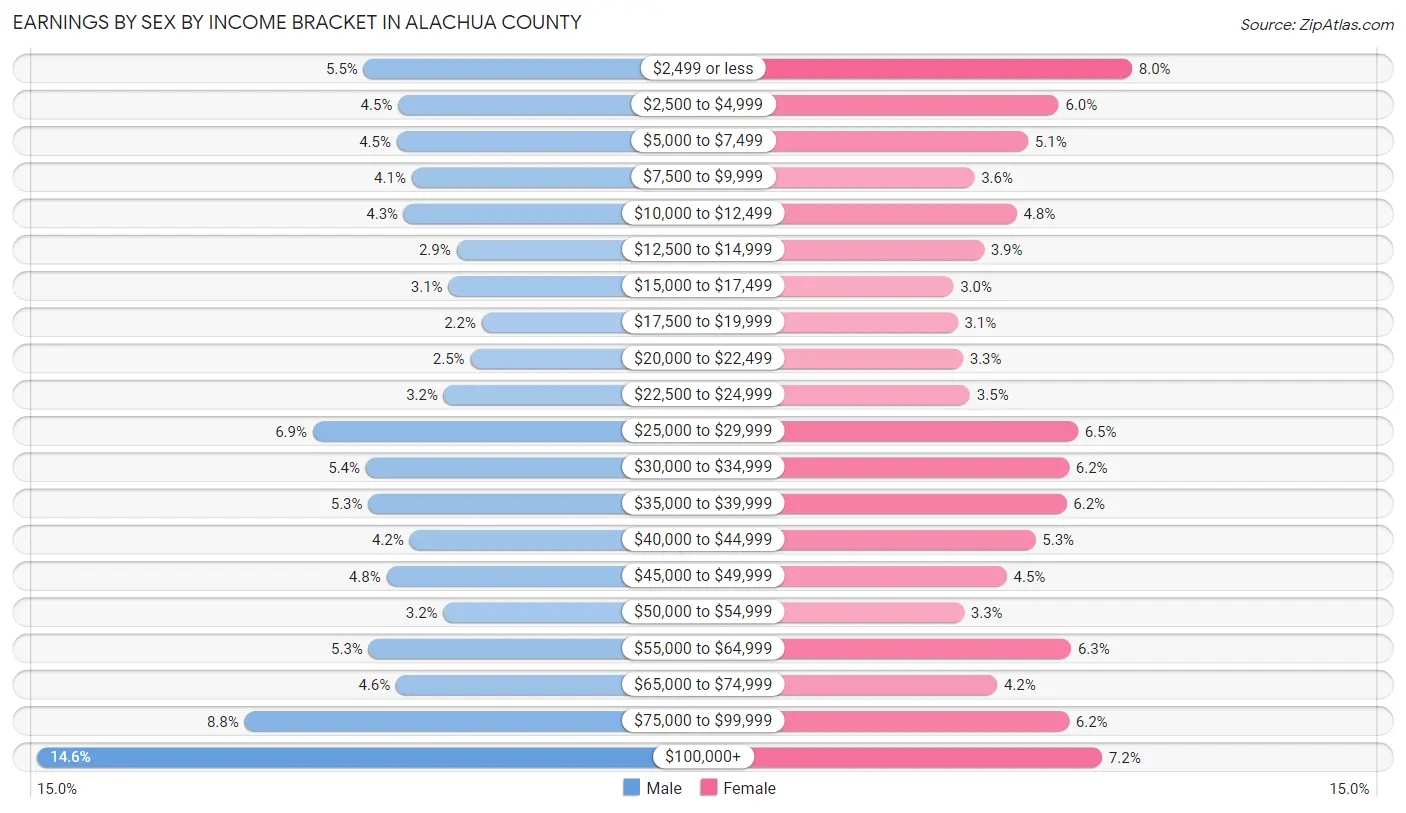
Earnings by Sex by Income Bracket in Alachua County
The most common earnings brackets in Alachua County are $100,000+ for men (11,173 | 14.6%) and $2,499 or less for women (6,113 | 8.0%).
| Income | Male | Female |
| $2,499 or less | 4,176 (5.5%) | 6,113 (8.0%) |
| $2,500 to $4,999 | 3,434 (4.5%) | 4,535 (5.9%) |
| $5,000 to $7,499 | 3,468 (4.5%) | 3,884 (5.1%) |
| $7,500 to $9,999 | 3,146 (4.1%) | 2,734 (3.6%) |
| $10,000 to $12,499 | 3,311 (4.3%) | 3,640 (4.8%) |
| $12,500 to $14,999 | 2,180 (2.9%) | 2,938 (3.8%) |
| $15,000 to $17,499 | 2,360 (3.1%) | 2,283 (3.0%) |
| $17,500 to $19,999 | 1,643 (2.1%) | 2,373 (3.1%) |
| $20,000 to $22,499 | 1,887 (2.5%) | 2,487 (3.3%) |
| $22,500 to $24,999 | 2,459 (3.2%) | 2,637 (3.5%) |
| $25,000 to $29,999 | 5,263 (6.9%) | 4,948 (6.5%) |
| $30,000 to $34,999 | 4,125 (5.4%) | 4,762 (6.2%) |
| $35,000 to $39,999 | 4,073 (5.3%) | 4,710 (6.2%) |
| $40,000 to $44,999 | 3,188 (4.2%) | 4,043 (5.3%) |
| $45,000 to $49,999 | 3,683 (4.8%) | 3,427 (4.5%) |
| $50,000 to $54,999 | 2,467 (3.2%) | 2,512 (3.3%) |
| $55,000 to $64,999 | 4,068 (5.3%) | 4,802 (6.3%) |
| $65,000 to $74,999 | 3,481 (4.6%) | 3,222 (4.2%) |
| $75,000 to $99,999 | 6,727 (8.8%) | 4,756 (6.2%) |
| $100,000+ | 11,173 (14.6%) | 5,470 (7.2%) |
| Total | 76,312 (100.0%) | 76,276 (100.0%) |
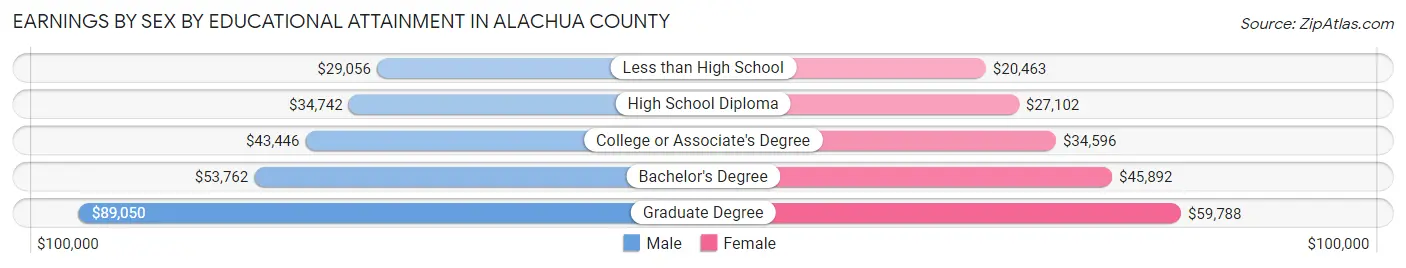
Earnings by Sex by Educational Attainment in Alachua County
Average earnings in Alachua County are $48,285 for men and $40,276 for women, a difference of 16.6%. Men with an educational attainment of graduate degree enjoy the highest average annual earnings of $89,050, while those with less than high school education earn the least with $29,056. Women with an educational attainment of graduate degree earn the most with the average annual earnings of $59,788, while those with less than high school education have the smallest earnings of $20,463.
| Educational Attainment | Male Income | Female Income |
| Less than High School | $29,056 | $20,463 |
| High School Diploma | $34,742 | $27,102 |
| College or Associate's Degree | $43,446 | $34,596 |
| Bachelor's Degree | $53,762 | $45,892 |
| Graduate Degree | $89,050 | $59,788 |
| Total | $48,285 | $40,276 |
Family Income in Alachua County
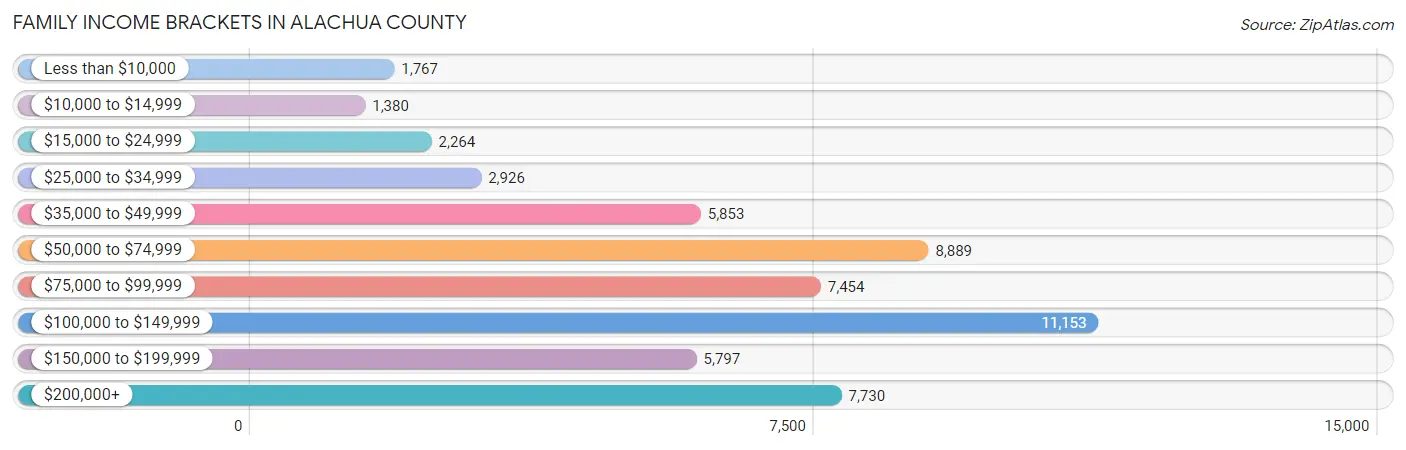
Family Income Brackets in Alachua County
According to the Alachua County family income data, there are 11,153 families falling into the $100,000 to $149,999 income range, which is the most common income bracket and makes up 20.2% of all families. Conversely, the $10,000 to $14,999 income bracket is the least frequent group with only 1,380 families (2.5%) belonging to this category.
| Income Bracket | # Families | % Families |
| Less than $10,000 | 1,767 | 3.2% |
| $10,000 to $14,999 | 1,380 | 2.5% |
| $15,000 to $24,999 | 2,264 | 4.1% |
| $25,000 to $34,999 | 2,926 | 5.3% |
| $35,000 to $49,999 | 5,853 | 10.6% |
| $50,000 to $74,999 | 8,889 | 16.1% |
| $75,000 to $99,999 | 7,454 | 13.5% |
| $100,000 to $149,999 | 11,153 | 20.2% |
| $150,000 to $199,999 | 5,797 | 10.5% |
| $200,000+ | 7,730 | 14.0% |
Family Income by Famaliy Size in Alachua County
6-person families (1,159 | 2.1%) account for the highest median family income in Alachua County with $123,631 per family, while 2-person families (28,480 | 51.6%) have the highest median income of $40,224 per family member.
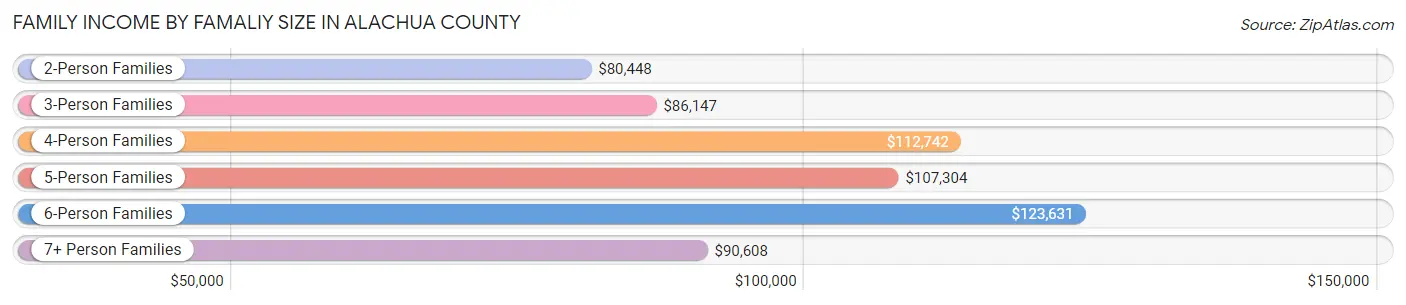
| Income Bracket | # Families | Median Income |
| 2-Person Families | 28,480 (51.6%) | $80,448 |
| 3-Person Families | 12,769 (23.1%) | $86,147 |
| 4-Person Families | 8,635 (15.6%) | $112,742 |
| 5-Person Families | 3,428 (6.2%) | $107,304 |
| 6-Person Families | 1,159 (2.1%) | $123,631 |
| 7+ Person Families | 742 (1.3%) | $90,608 |
| Total | 55,213 (100.0%) | $89,713 |
Family Income by Number of Earners in Alachua County
The median family income in Alachua County is $89,713, with families comprising 3+ earners (4,525) having the highest median family income of $134,616, while families with 1 earner (19,180) have the lowest median family income of $60,630, accounting for 8.2% and 34.7% of families, respectively.
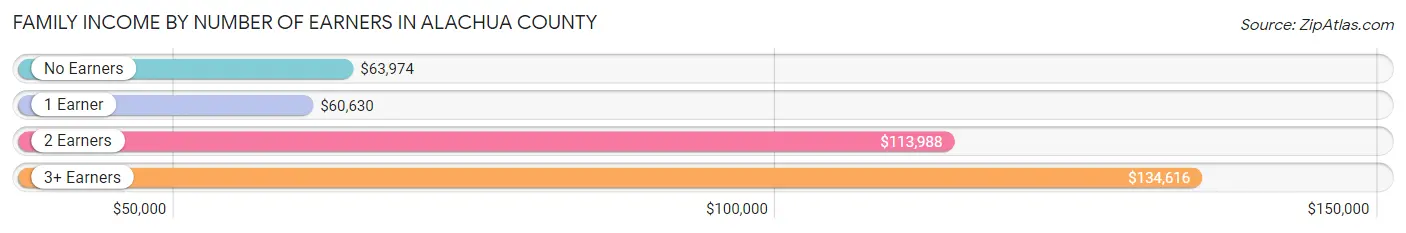
| Number of Earners | # Families | Median Income |
| No Earners | 8,565 (15.5%) | $63,974 |
| 1 Earner | 19,180 (34.7%) | $60,630 |
| 2 Earners | 22,943 (41.5%) | $113,988 |
| 3+ Earners | 4,525 (8.2%) | $134,616 |
| Total | 55,213 (100.0%) | $89,713 |
Household Income in Alachua County
Household Income Brackets in Alachua County
With 16,724 households falling in the category, the $50,000 to $74,999 income range is the most frequent in Alachua County, accounting for 15.4% of all households. In contrast, only 5,756 households (5.3%) fall into the $10,000 to $14,999 income bracket, making it the least populous group.
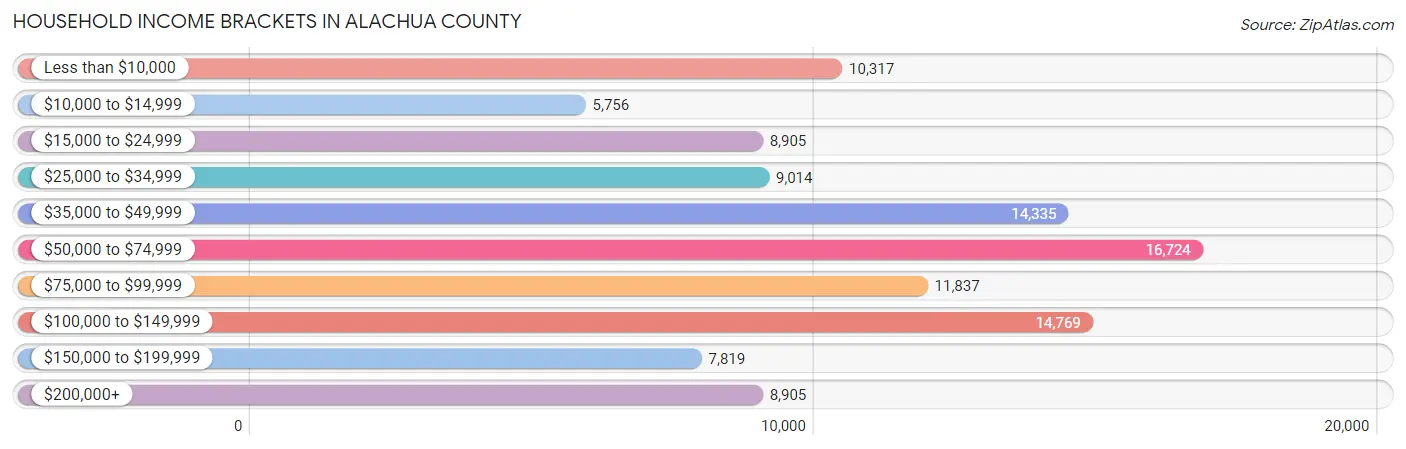
| Income Bracket | # Households | % Households |
| Less than $10,000 | 10,317 | 9.5% |
| $10,000 to $14,999 | 5,756 | 5.3% |
| $15,000 to $24,999 | 8,905 | 8.2% |
| $25,000 to $34,999 | 9,014 | 8.3% |
| $35,000 to $49,999 | 14,335 | 13.2% |
| $50,000 to $74,999 | 16,724 | 15.4% |
| $75,000 to $99,999 | 11,837 | 10.9% |
| $100,000 to $149,999 | 14,769 | 13.6% |
| $150,000 to $199,999 | 7,819 | 7.2% |
| $200,000+ | 8,905 | 8.2% |
Household Income by Householder Age in Alachua County
The median household income in Alachua County is $57,566, with the highest median household income of $77,483 found in the 45 to 64 years age bracket for the primary householder. A total of 32,620 households (30.0%) fall into this category. Meanwhile, the 15 to 24 years age bracket for the primary householder has the lowest median household income of $18,663, with 14,576 households (13.4%) in this group.
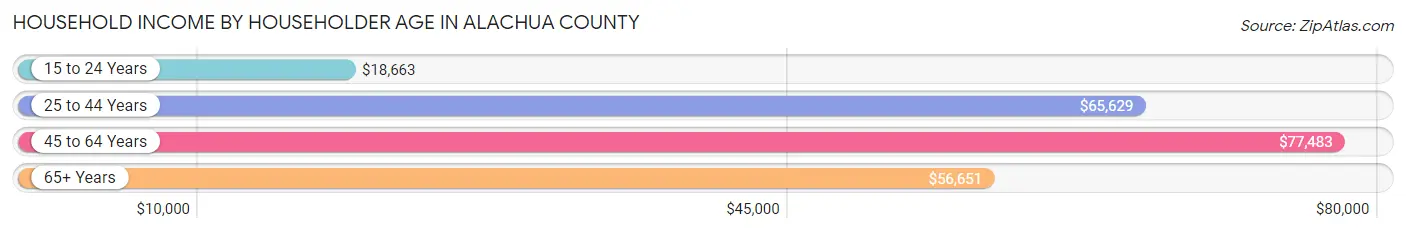
| Income Bracket | # Households | Median Income |
| 15 to 24 Years | 14,576 (13.4%) | $18,663 |
| 25 to 44 Years | 35,990 (33.1%) | $65,629 |
| 45 to 64 Years | 32,620 (30.0%) | $77,483 |
| 65+ Years | 25,411 (23.4%) | $56,651 |
| Total | 108,597 (100.0%) | $57,566 |
Poverty in Alachua County
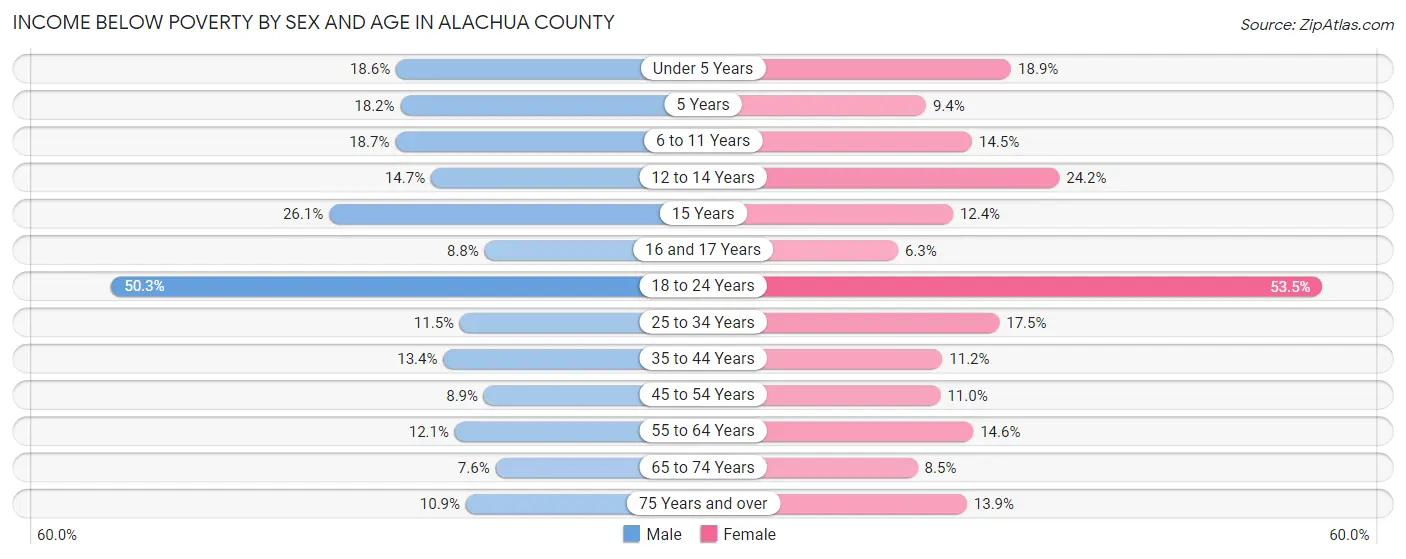
Income Below Poverty by Sex and Age in Alachua County
With 19.4% poverty level for males and 20.9% for females among the residents of Alachua County, 18 to 24 year old males and 18 to 24 year old females are the most vulnerable to poverty, with 11,800 males (50.3%) and 12,884 females (53.5%) in their respective age groups living below the poverty level.
| Age Bracket | Male | Female |
| Under 5 Years | 1,267 (18.6%) | 1,250 (18.9%) |
| 5 Years | 210 (18.1%) | 106 (9.4%) |
| 6 to 11 Years | 1,503 (18.7%) | 1,134 (14.5%) |
| 12 to 14 Years | 681 (14.7%) | 1,108 (24.2%) |
| 15 Years | 434 (26.1%) | 175 (12.4%) |
| 16 and 17 Years | 181 (8.8%) | 161 (6.3%) |
| 18 to 24 Years | 11,800 (50.3%) | 12,884 (53.5%) |
| 25 to 34 Years | 2,335 (11.5%) | 3,623 (17.5%) |
| 35 to 44 Years | 2,066 (13.4%) | 1,761 (11.2%) |
| 45 to 54 Years | 1,154 (8.8%) | 1,477 (11.0%) |
| 55 to 64 Years | 1,627 (12.1%) | 2,239 (14.6%) |
| 65 to 74 Years | 834 (7.6%) | 1,120 (8.5%) |
| 75 Years and over | 715 (10.9%) | 1,225 (13.9%) |
| Total | 24,807 (19.4%) | 28,263 (20.9%) |
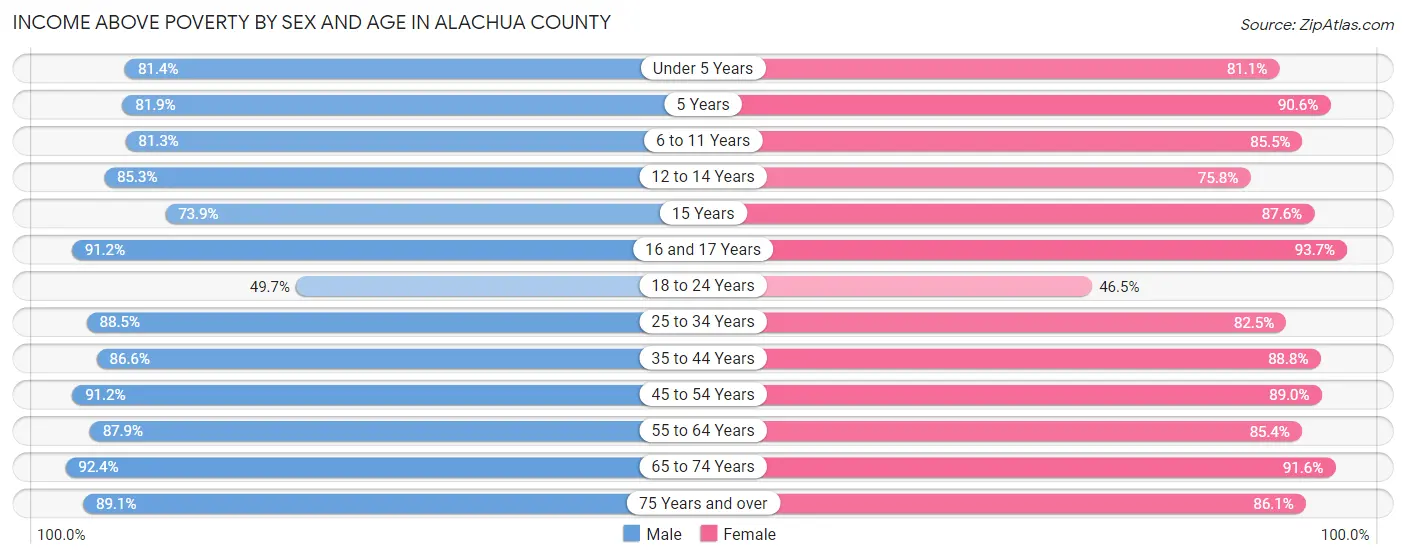
Income Above Poverty by Sex and Age in Alachua County
According to the poverty statistics in Alachua County, males aged 65 to 74 years and females aged 16 and 17 years are the age groups that are most secure financially, with 92.4% of males and 93.7% of females in these age groups living above the poverty line.
| Age Bracket | Male | Female |
| Under 5 Years | 5,530 (81.4%) | 5,377 (81.1%) |
| 5 Years | 947 (81.9%) | 1,024 (90.6%) |
| 6 to 11 Years | 6,527 (81.3%) | 6,683 (85.5%) |
| 12 to 14 Years | 3,938 (85.3%) | 3,466 (75.8%) |
| 15 Years | 1,229 (73.9%) | 1,238 (87.6%) |
| 16 and 17 Years | 1,882 (91.2%) | 2,410 (93.7%) |
| 18 to 24 Years | 11,640 (49.7%) | 11,187 (46.5%) |
| 25 to 34 Years | 17,926 (88.5%) | 17,036 (82.5%) |
| 35 to 44 Years | 13,384 (86.6%) | 13,965 (88.8%) |
| 45 to 54 Years | 11,880 (91.1%) | 11,967 (89.0%) |
| 55 to 64 Years | 11,826 (87.9%) | 13,056 (85.4%) |
| 65 to 74 Years | 10,193 (92.4%) | 12,131 (91.5%) |
| 75 Years and over | 5,871 (89.1%) | 7,567 (86.1%) |
| Total | 102,773 (80.6%) | 107,107 (79.1%) |
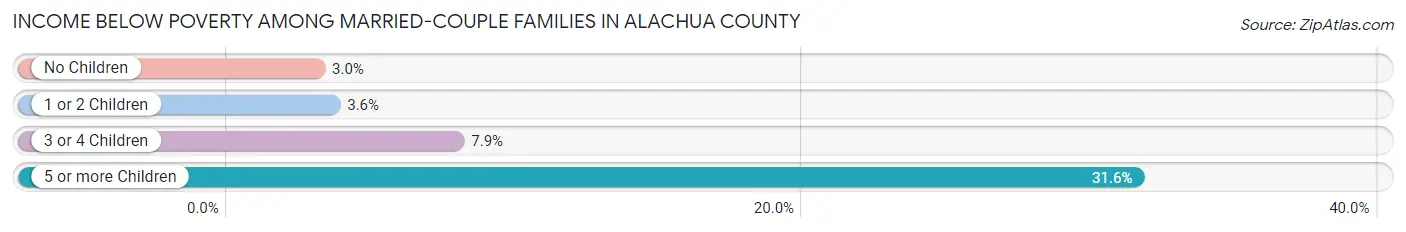
Income Below Poverty Among Married-Couple Families in Alachua County
The poverty statistics for married-couple families in Alachua County show that 3.8% or 1,539 of the total 40,550 families live below the poverty line. Families with 5 or more children have the highest poverty rate of 31.6%, comprising of 130 families. On the other hand, families with no children have the lowest poverty rate of 3.0%, which includes 753 families.
| Children | Above Poverty | Below Poverty |
| No Children | 24,120 (97.0%) | 753 (3.0%) |
| 1 or 2 Children | 12,214 (96.4%) | 451 (3.6%) |
| 3 or 4 Children | 2,395 (92.1%) | 205 (7.9%) |
| 5 or more Children | 282 (68.4%) | 130 (31.6%) |
| Total | 39,011 (96.2%) | 1,539 (3.8%) |
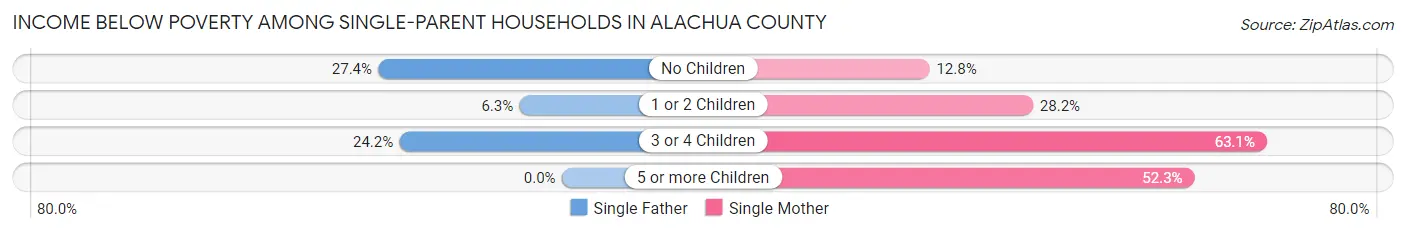
Income Below Poverty Among Single-Parent Households in Alachua County
According to the poverty data in Alachua County, 17.7% or 599 single-father households and 24.3% or 2,744 single-mother households are living below the poverty line. Among single-father households, those with no children have the highest poverty rate, with 450 households (27.4%) experiencing poverty. Likewise, among single-mother households, those with 3 or 4 children have the highest poverty rate, with 471 households (63.0%) falling below the poverty line.
| Children | Single Father | Single Mother |
| No Children | 450 (27.4%) | 610 (12.8%) |
| 1 or 2 Children | 96 (6.3%) | 1,582 (28.2%) |
| 3 or 4 Children | 53 (24.2%) | 471 (63.0%) |
| 5 or more Children | 0 (0.0%) | 81 (52.3%) |
| Total | 599 (17.7%) | 2,744 (24.3%) |
Income Below Poverty Among Married-Couple vs Single-Parent Households in Alachua County
The poverty data for Alachua County shows that 1,539 of the married-couple family households (3.8%) and 3,343 of the single-parent households (22.8%) are living below the poverty level. Within the married-couple family households, those with 5 or more children have the highest poverty rate, with 130 households (31.6%) falling below the poverty line. Among the single-parent households, those with 3 or 4 children have the highest poverty rate, with 524 household (54.2%) living below poverty.
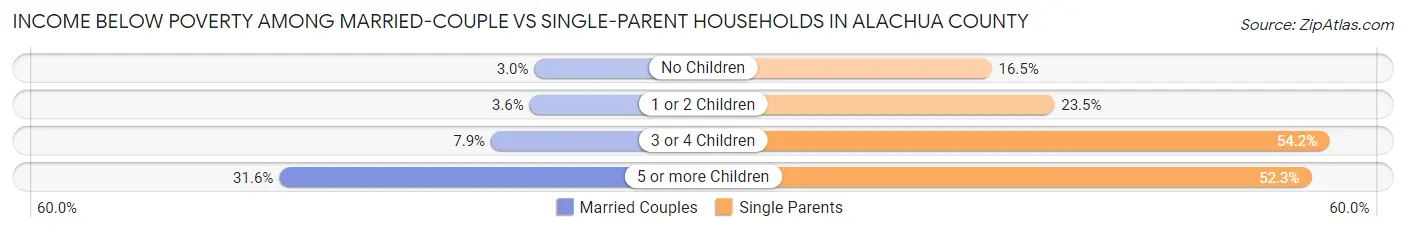
| Children | Married-Couple Families | Single-Parent Households |
| No Children | 753 (3.0%) | 1,060 (16.5%) |
| 1 or 2 Children | 451 (3.6%) | 1,678 (23.5%) |
| 3 or 4 Children | 205 (7.9%) | 524 (54.2%) |
| 5 or more Children | 130 (31.6%) | 81 (52.3%) |
| Total | 1,539 (3.8%) | 3,343 (22.8%) |
Employment Characteristics in Alachua County
Employment by Class of Employer in Alachua County
Among the 130,463 employed individuals in Alachua County, private company employees (71,922 | 55.1%), state government employees (21,767 | 16.7%), and not-for-profit organizations (12,146 | 9.3%) make up the most common classes of employment.
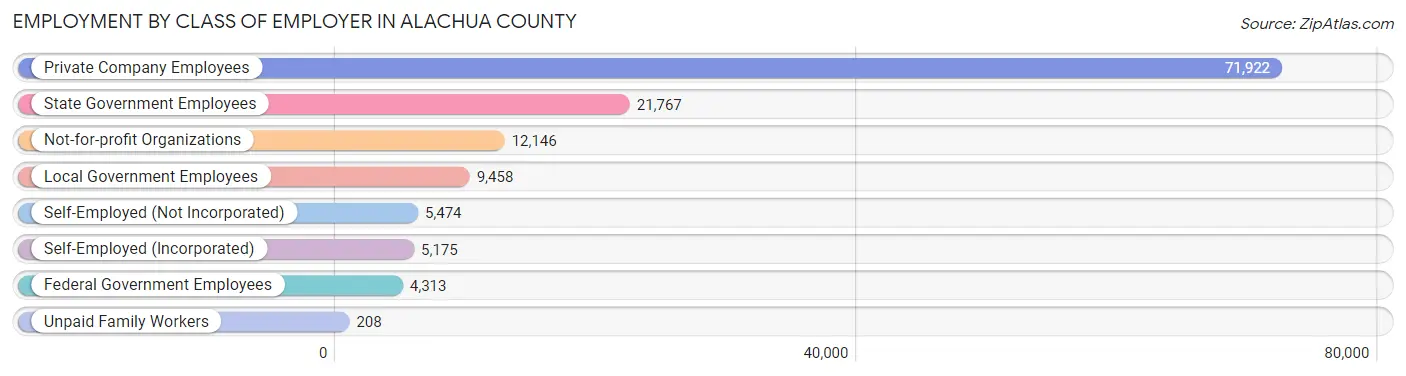
| Employer Class | # Employees | % Employees |
| Private Company Employees | 71,922 | 55.1% |
| Self-Employed (Incorporated) | 5,175 | 4.0% |
| Self-Employed (Not Incorporated) | 5,474 | 4.2% |
| Not-for-profit Organizations | 12,146 | 9.3% |
| Local Government Employees | 9,458 | 7.2% |
| State Government Employees | 21,767 | 16.7% |
| Federal Government Employees | 4,313 | 3.3% |
| Unpaid Family Workers | 208 | 0.2% |
| Total | 130,463 | 100.0% |
Employment Status by Age in Alachua County
According to the labor force statistics for Alachua County, out of the total population over 16 years of age (235,217), 59.7% or 140,425 individuals are in the labor force, with 5.1% or 7,162 of them unemployed. The age group with the highest labor force participation rate is 35 to 44 years, with 84.1% or 26,461 individuals in the labor force. Within the labor force, the 16 to 19 years age range has the highest percentage of unemployed individuals, with 13.2% or 807 of them being unemployed.
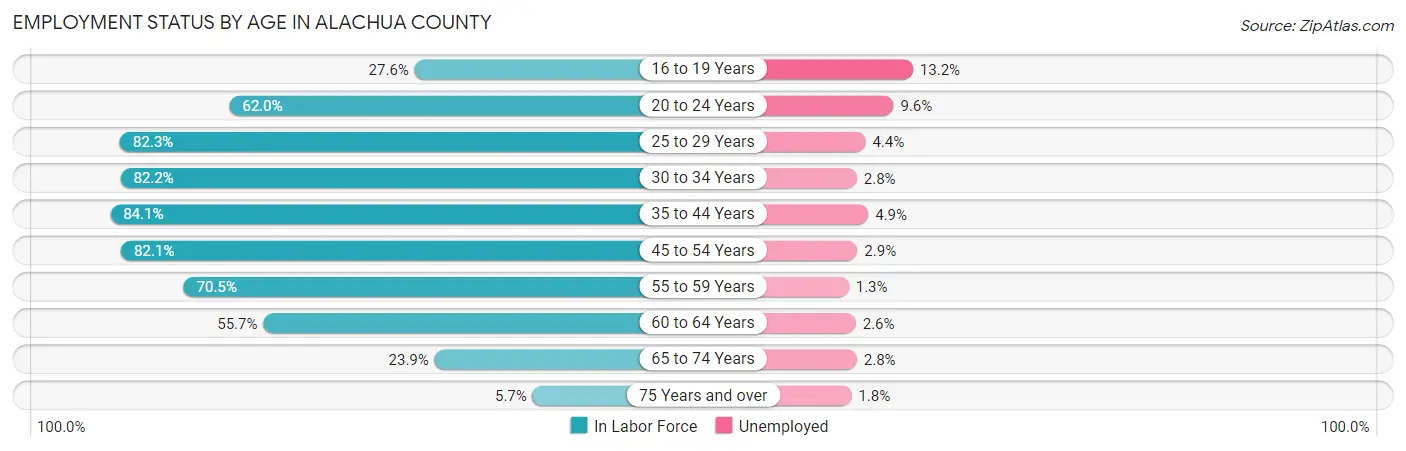
| Age Bracket | In Labor Force | Unemployed |
| 16 to 19 Years | 6,113 (27.6%) | 807 (13.2%) |
| 20 to 24 Years | 27,110 (62.0%) | 2,603 (9.6%) |
| 25 to 29 Years | 18,328 (82.3%) | 806 (4.4%) |
| 30 to 34 Years | 15,681 (82.2%) | 439 (2.8%) |
| 35 to 44 Years | 26,461 (84.1%) | 1,297 (4.9%) |
| 45 to 54 Years | 21,876 (82.1%) | 634 (2.9%) |
| 55 to 59 Years | 9,535 (70.5%) | 124 (1.3%) |
| 60 to 64 Years | 8,542 (55.7%) | 222 (2.6%) |
| 65 to 74 Years | 5,881 (23.9%) | 165 (2.8%) |
| 75 Years and over | 936 (5.7%) | 17 (1.8%) |
| Total | 140,425 (59.7%) | 7,162 (5.1%) |
Employment Status by Educational Attainment in Alachua County
According to labor force statistics for Alachua County, 78.3% of individuals (100,472) out of the total population between 25 and 64 years of age (128,317) are in the labor force, with 3.5% or 3,517 of them being unemployed. The group with the highest labor force participation rate are those with the educational attainment of bachelor's degree or higher, with 84.3% or 52,328 individuals in the labor force. Within the labor force, individuals with less than high school education have the highest percentage of unemployment, with 12.3% or 476 of them being unemployed.
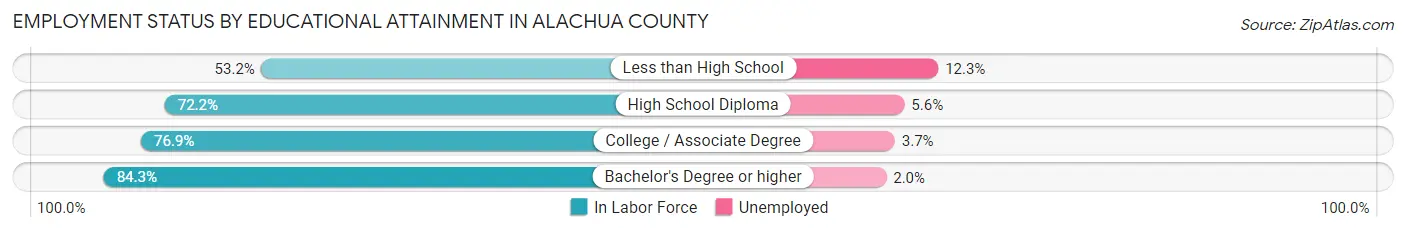
| Educational Attainment | In Labor Force | Unemployed |
| Less than High School | 3,869 (53.2%) | 894 (12.3%) |
| High School Diploma | 17,436 (72.2%) | 1,352 (5.6%) |
| College / Associate Degree | 26,779 (76.9%) | 1,288 (3.7%) |
| Bachelor's Degree or higher | 52,328 (84.3%) | 1,241 (2.0%) |
| Total | 100,472 (78.3%) | 4,491 (3.5%) |
Employment Occupations by Sex in Alachua County
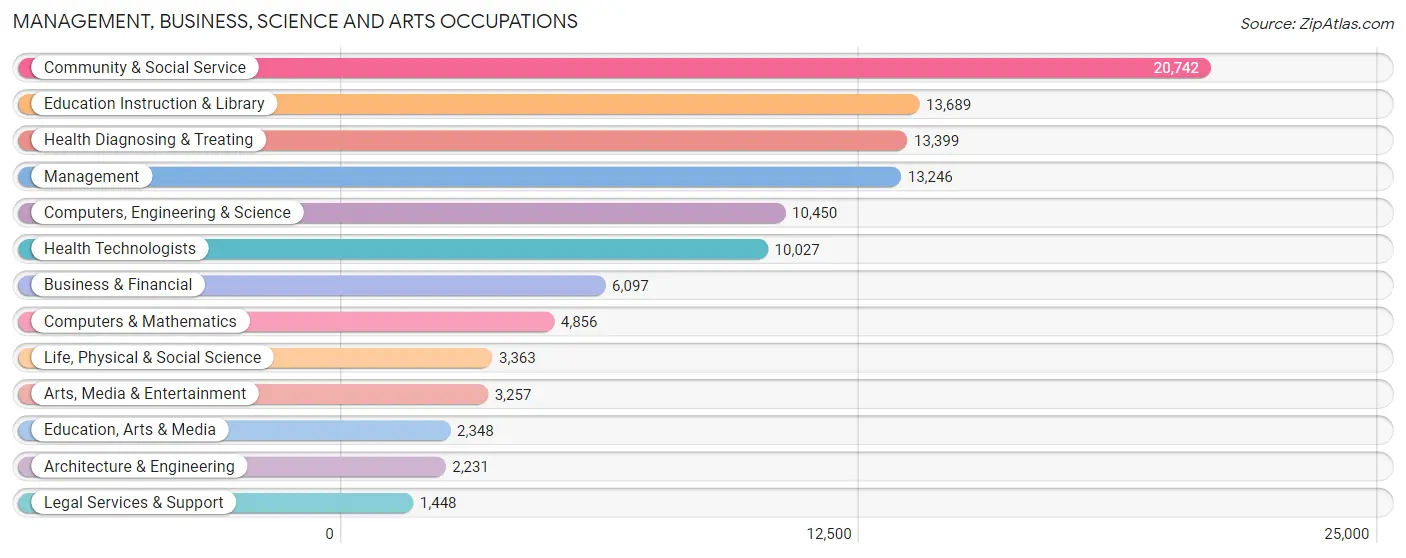
Management, Business, Science and Arts Occupations
The most common Management, Business, Science and Arts occupations in Alachua County are Community & Social Service (20,742 | 15.6%), Education Instruction & Library (13,689 | 10.3%), Health Diagnosing & Treating (13,399 | 10.1%), Management (13,246 | 9.9%), and Computers, Engineering & Science (10,450 | 7.8%).
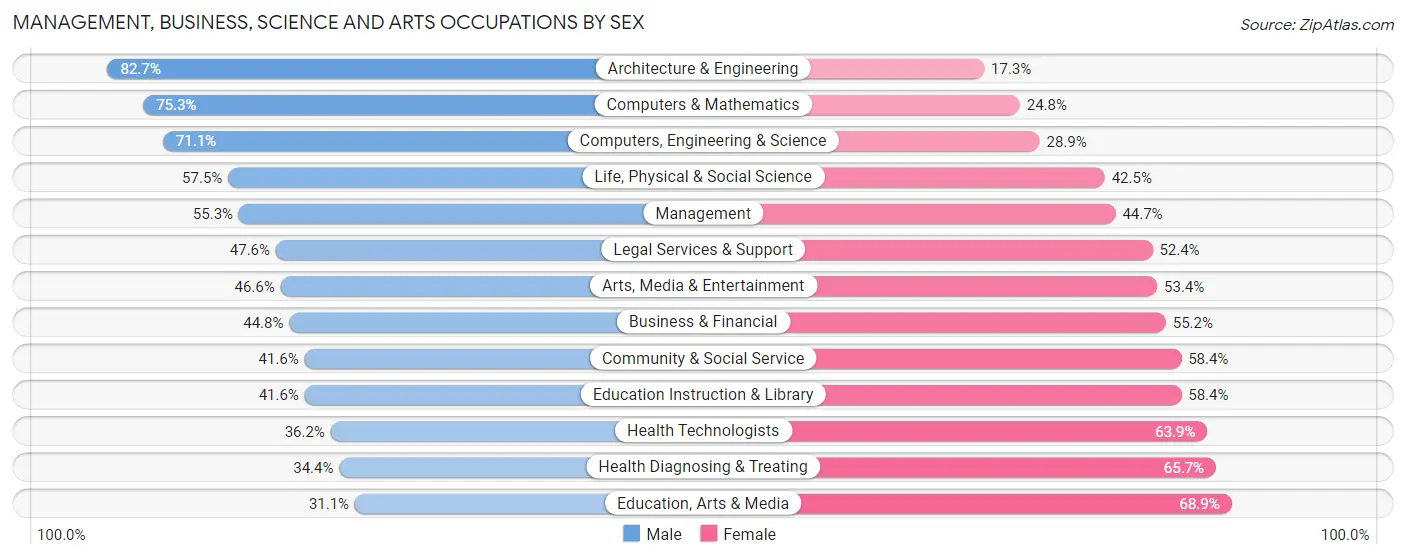
Management, Business, Science and Arts Occupations by Sex
Within the Management, Business, Science and Arts occupations in Alachua County, the most male-oriented occupations are Architecture & Engineering (82.7%), Computers & Mathematics (75.2%), and Computers, Engineering & Science (71.1%), while the most female-oriented occupations are Education, Arts & Media (68.9%), Health Diagnosing & Treating (65.6%), and Health Technologists (63.8%).
| Occupation | Male | Female |
| Management | 7,325 (55.3%) | 5,921 (44.7%) |
| Business & Financial | 2,731 (44.8%) | 3,366 (55.2%) |
| Computers, Engineering & Science | 7,434 (71.1%) | 3,016 (28.9%) |
| Computers & Mathematics | 3,654 (75.2%) | 1,202 (24.7%) |
| Architecture & Engineering | 1,845 (82.7%) | 386 (17.3%) |
| Life, Physical & Social Science | 1,935 (57.5%) | 1,428 (42.5%) |
| Community & Social Service | 8,627 (41.6%) | 12,115 (58.4%) |
| Education, Arts & Media | 730 (31.1%) | 1,618 (68.9%) |
| Legal Services & Support | 689 (47.6%) | 759 (52.4%) |
| Education Instruction & Library | 5,690 (41.6%) | 7,999 (58.4%) |
| Arts, Media & Entertainment | 1,518 (46.6%) | 1,739 (53.4%) |
| Health Diagnosing & Treating | 4,603 (34.4%) | 8,796 (65.6%) |
| Health Technologists | 3,625 (36.1%) | 6,402 (63.8%) |
| Total (Category) | 30,720 (48.0%) | 33,214 (51.9%) |
| Total (Overall) | 67,292 (50.5%) | 65,933 (49.5%) |
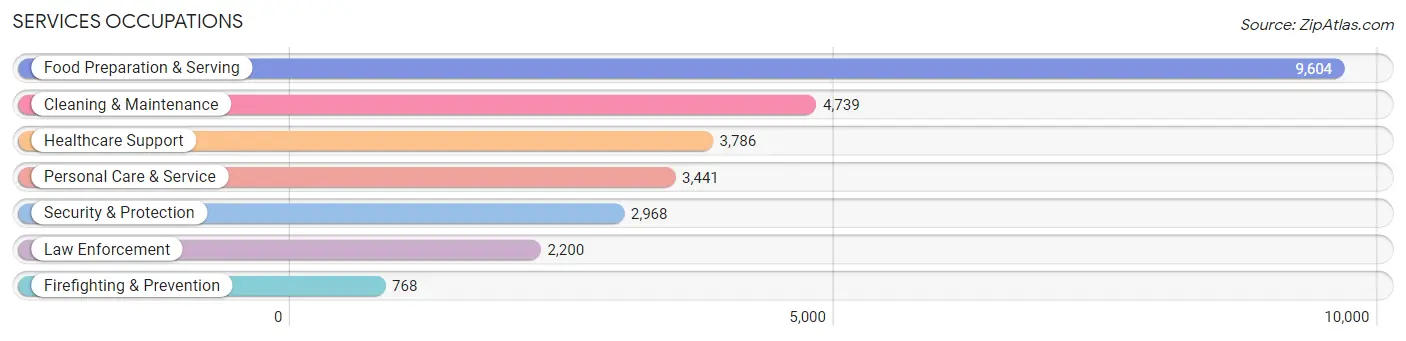
Services Occupations
The most common Services occupations in Alachua County are Food Preparation & Serving (9,604 | 7.2%), Cleaning & Maintenance (4,739 | 3.6%), Healthcare Support (3,786 | 2.8%), Personal Care & Service (3,441 | 2.6%), and Security & Protection (2,968 | 2.2%).
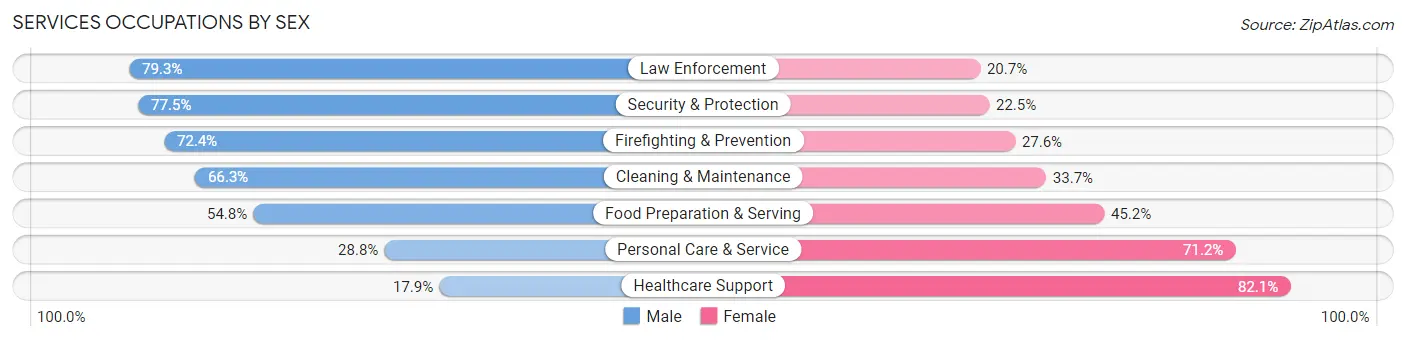
Services Occupations by Sex
Within the Services occupations in Alachua County, the most male-oriented occupations are Law Enforcement (79.3%), Security & Protection (77.5%), and Firefighting & Prevention (72.4%), while the most female-oriented occupations are Healthcare Support (82.1%), Personal Care & Service (71.2%), and Food Preparation & Serving (45.2%).
| Occupation | Male | Female |
| Healthcare Support | 679 (17.9%) | 3,107 (82.1%) |
| Security & Protection | 2,301 (77.5%) | 667 (22.5%) |
| Firefighting & Prevention | 556 (72.4%) | 212 (27.6%) |
| Law Enforcement | 1,745 (79.3%) | 455 (20.7%) |
| Food Preparation & Serving | 5,259 (54.8%) | 4,345 (45.2%) |
| Cleaning & Maintenance | 3,140 (66.3%) | 1,599 (33.7%) |
| Personal Care & Service | 991 (28.8%) | 2,450 (71.2%) |
| Total (Category) | 12,370 (50.4%) | 12,168 (49.6%) |
| Total (Overall) | 67,292 (50.5%) | 65,933 (49.5%) |
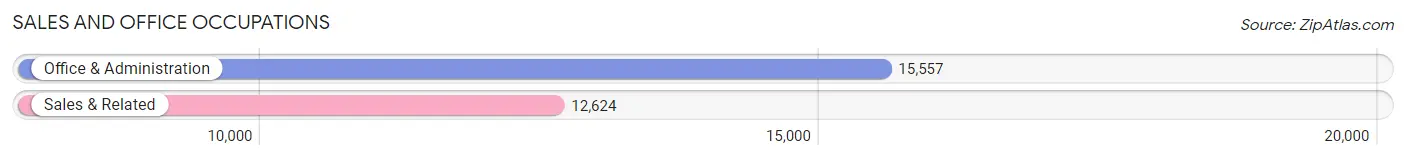
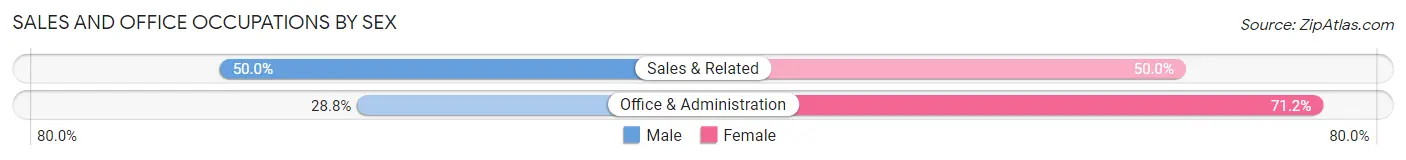
Sales and Office Occupations
The most common Sales and Office occupations in Alachua County are Office & Administration (15,557 | 11.7%), and Sales & Related (12,624 | 9.5%).
Sales and Office Occupations by Sex
| Occupation | Male | Female |
| Sales & Related | 6,308 (50.0%) | 6,316 (50.0%) |
| Office & Administration | 4,486 (28.8%) | 11,071 (71.2%) |
| Total (Category) | 10,794 (38.3%) | 17,387 (61.7%) |
| Total (Overall) | 67,292 (50.5%) | 65,933 (49.5%) |
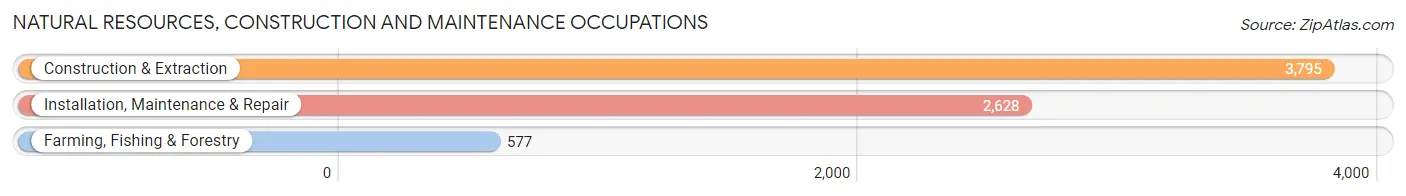
Natural Resources, Construction and Maintenance Occupations
The most common Natural Resources, Construction and Maintenance occupations in Alachua County are Construction & Extraction (3,795 | 2.9%), Installation, Maintenance & Repair (2,628 | 2.0%), and Farming, Fishing & Forestry (577 | 0.4%).
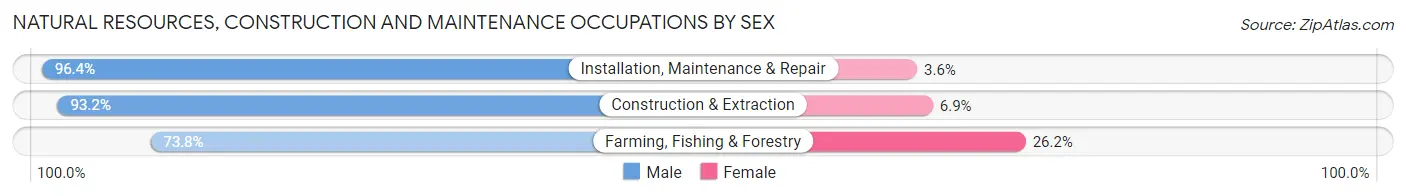
Natural Resources, Construction and Maintenance Occupations by Sex
| Occupation | Male | Female |
| Farming, Fishing & Forestry | 426 (73.8%) | 151 (26.2%) |
| Construction & Extraction | 3,535 (93.1%) | 260 (6.9%) |
| Installation, Maintenance & Repair | 2,534 (96.4%) | 94 (3.6%) |
| Total (Category) | 6,495 (92.8%) | 505 (7.2%) |
| Total (Overall) | 67,292 (50.5%) | 65,933 (49.5%) |
Production, Transportation and Moving Occupations
The most common Production, Transportation and Moving occupations in Alachua County are Production (3,659 | 2.8%), Material Moving (3,173 | 2.4%), and Transportation (2,740 | 2.1%).
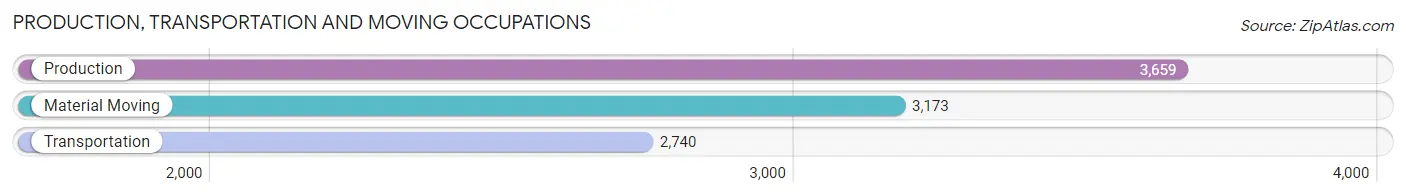
Production, Transportation and Moving Occupations by Sex
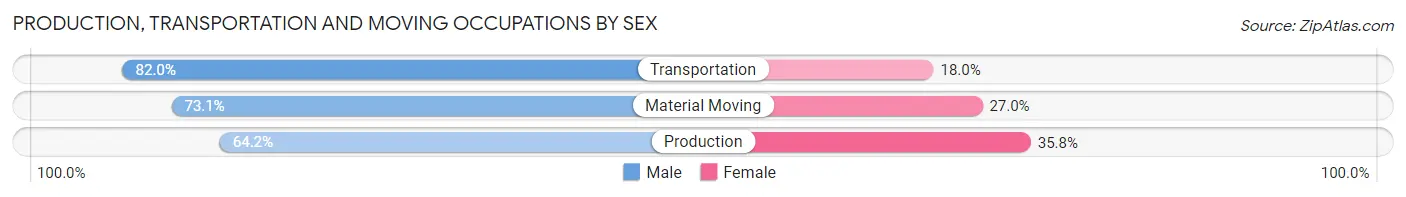
| Occupation | Male | Female |
| Production | 2,348 (64.2%) | 1,311 (35.8%) |
| Transportation | 2,247 (82.0%) | 493 (18.0%) |
| Material Moving | 2,318 (73.1%) | 855 (27.0%) |
| Total (Category) | 6,913 (72.2%) | 2,659 (27.8%) |
| Total (Overall) | 67,292 (50.5%) | 65,933 (49.5%) |
Employment Industries by Sex in Alachua County
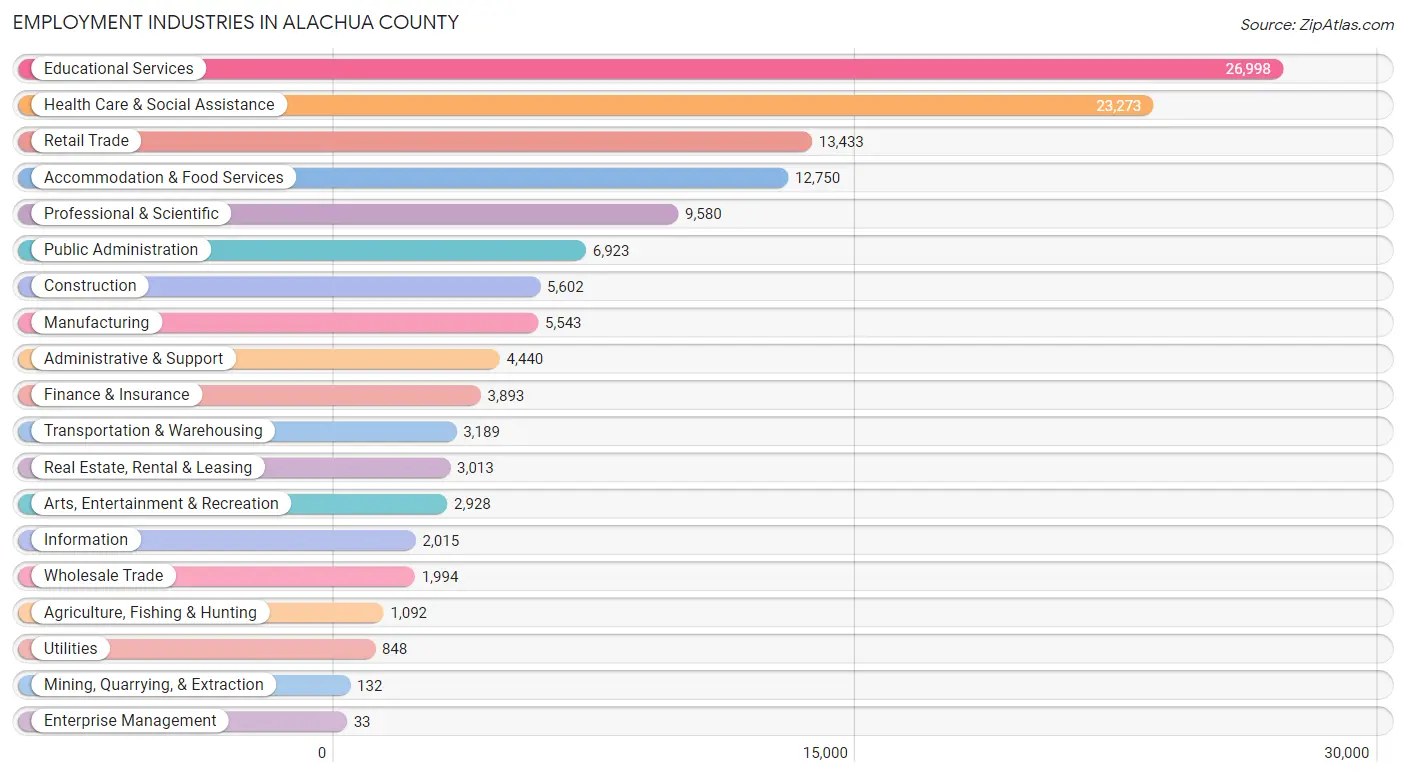
Employment Industries in Alachua County
The major employment industries in Alachua County include Educational Services (26,998 | 20.3%), Health Care & Social Assistance (23,273 | 17.5%), Retail Trade (13,433 | 10.1%), Accommodation & Food Services (12,750 | 9.6%), and Professional & Scientific (9,580 | 7.2%).
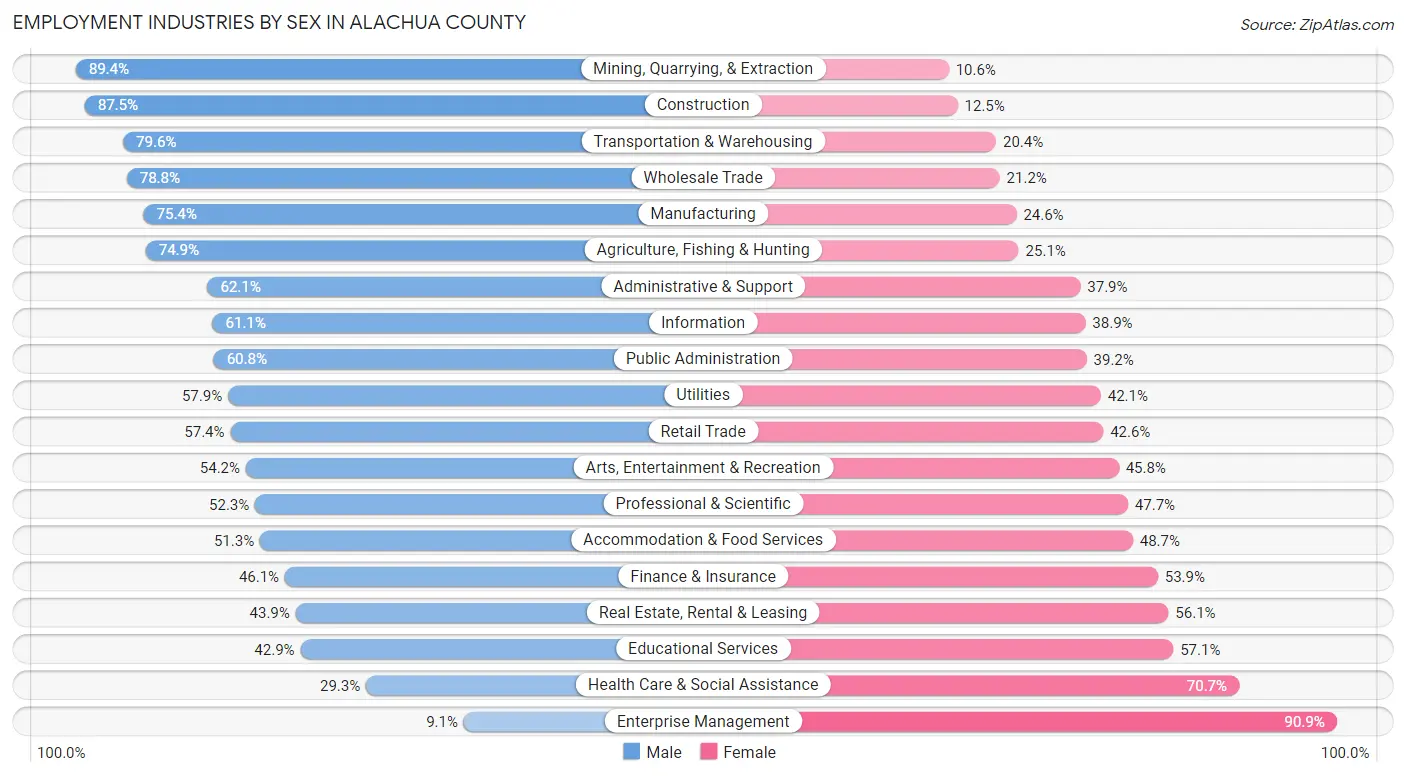
Employment Industries by Sex in Alachua County
The Alachua County industries that see more men than women are Mining, Quarrying, & Extraction (89.4%), Construction (87.5%), and Transportation & Warehousing (79.6%), whereas the industries that tend to have a higher number of women are Enterprise Management (90.9%), Health Care & Social Assistance (70.7%), and Educational Services (57.1%).
| Industry | Male | Female |
| Agriculture, Fishing & Hunting | 818 (74.9%) | 274 (25.1%) |
| Mining, Quarrying, & Extraction | 118 (89.4%) | 14 (10.6%) |
| Construction | 4,904 (87.5%) | 698 (12.5%) |
| Manufacturing | 4,177 (75.4%) | 1,366 (24.6%) |
| Wholesale Trade | 1,572 (78.8%) | 422 (21.2%) |
| Retail Trade | 7,712 (57.4%) | 5,721 (42.6%) |
| Transportation & Warehousing | 2,538 (79.6%) | 651 (20.4%) |
| Utilities | 491 (57.9%) | 357 (42.1%) |
| Information | 1,231 (61.1%) | 784 (38.9%) |
| Finance & Insurance | 1,795 (46.1%) | 2,098 (53.9%) |
| Real Estate, Rental & Leasing | 1,323 (43.9%) | 1,690 (56.1%) |
| Professional & Scientific | 5,009 (52.3%) | 4,571 (47.7%) |
| Enterprise Management | 3 (9.1%) | 30 (90.9%) |
| Administrative & Support | 2,759 (62.1%) | 1,681 (37.9%) |
| Educational Services | 11,586 (42.9%) | 15,412 (57.1%) |
| Health Care & Social Assistance | 6,827 (29.3%) | 16,446 (70.7%) |
| Arts, Entertainment & Recreation | 1,587 (54.2%) | 1,341 (45.8%) |
| Accommodation & Food Services | 6,538 (51.3%) | 6,212 (48.7%) |
| Public Administration | 4,212 (60.8%) | 2,711 (39.2%) |
| Total | 67,292 (50.5%) | 65,933 (49.5%) |
Education in Alachua County
School Enrollment in Alachua County
The most common levels of schooling among the 97,763 students in Alachua County are college / undergraduate (45,870 | 46.9%), graduate / professional (13,986 | 14.3%), and elementary school (11,351 | 11.6%).
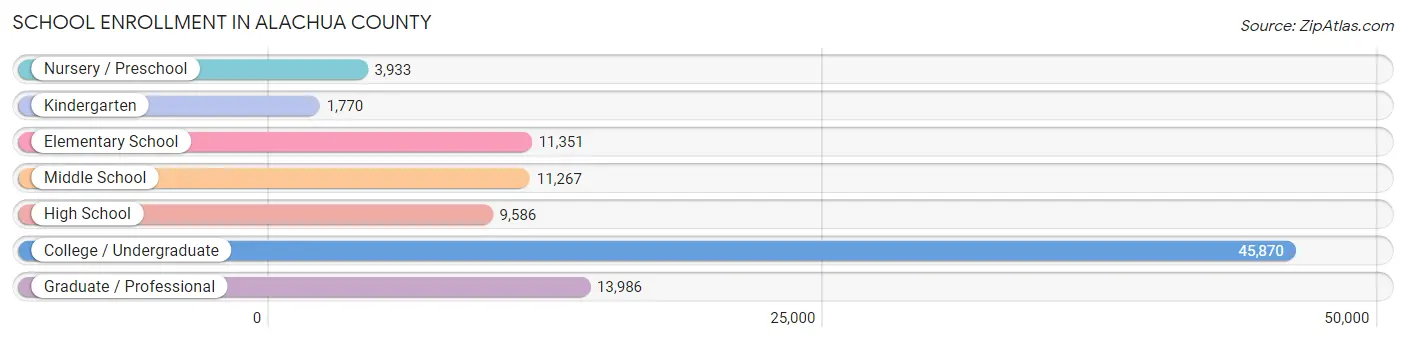
| School Level | # Students | % Students |
| Nursery / Preschool | 3,933 | 4.0% |
| Kindergarten | 1,770 | 1.8% |
| Elementary School | 11,351 | 11.6% |
| Middle School | 11,267 | 11.5% |
| High School | 9,586 | 9.8% |
| College / Undergraduate | 45,870 | 46.9% |
| Graduate / Professional | 13,986 | 14.3% |
| Total | 97,763 | 100.0% |
School Enrollment by Age by Funding Source in Alachua County
Out of a total of 97,763 students who are enrolled in schools in Alachua County, 11,438 (11.7%) attend a private institution, while the remaining 86,325 (88.3%) are enrolled in public schools. The age group of 3 to 4 year olds has the highest likelihood of being enrolled in private schools, with 1,466 (51.7% in the age bracket) enrolled. Conversely, the age group of 18 to 19 year olds has the lowest likelihood of being enrolled in a private school, with 15,899 (98.4% in the age bracket) attending a public institution.
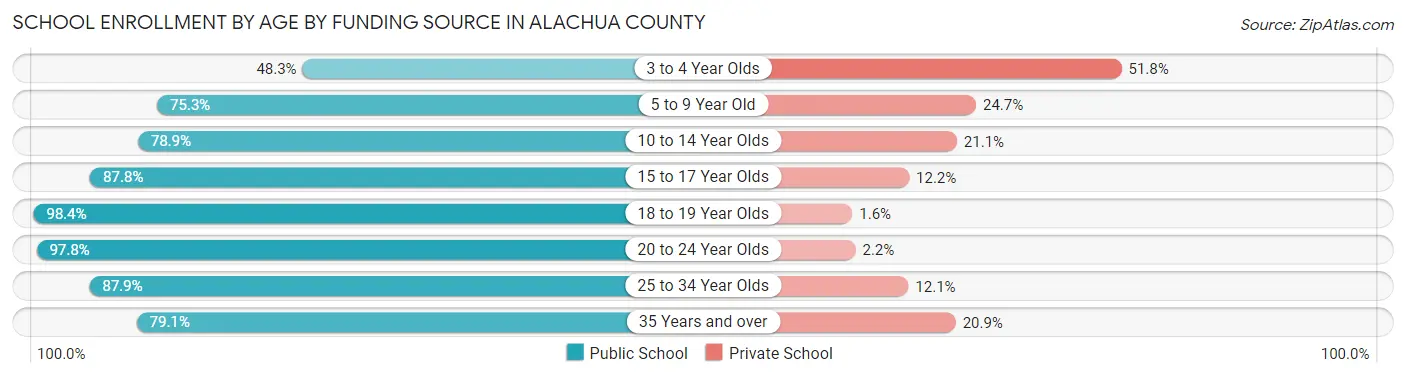
| Age Bracket | Public School | Private School |
| 3 to 4 Year Olds | 1,367 (48.2%) | 1,466 (51.7%) |
| 5 to 9 Year Old | 9,953 (75.3%) | 3,257 (24.7%) |
| 10 to 14 Year Olds | 10,126 (78.9%) | 2,707 (21.1%) |
| 15 to 17 Year Olds | 6,387 (87.8%) | 887 (12.2%) |
| 18 to 19 Year Olds | 15,899 (98.4%) | 261 (1.6%) |
| 20 to 24 Year Olds | 30,056 (97.8%) | 679 (2.2%) |
| 25 to 34 Year Olds | 9,265 (87.9%) | 1,270 (12.1%) |
| 35 Years and over | 3,310 (79.1%) | 873 (20.9%) |
| Total | 86,325 (88.3%) | 11,438 (11.7%) |
Educational Attainment by Field of Study in Alachua County
Bio, nature & agricultural (12,255 | 14.2%), business (10,993 | 12.8%), science & technology (10,188 | 11.8%), education (7,378 | 8.6%), and engineering (6,383 | 7.4%) are the most common fields of study among 86,035 individuals in Alachua County who have obtained a bachelor's degree or higher.
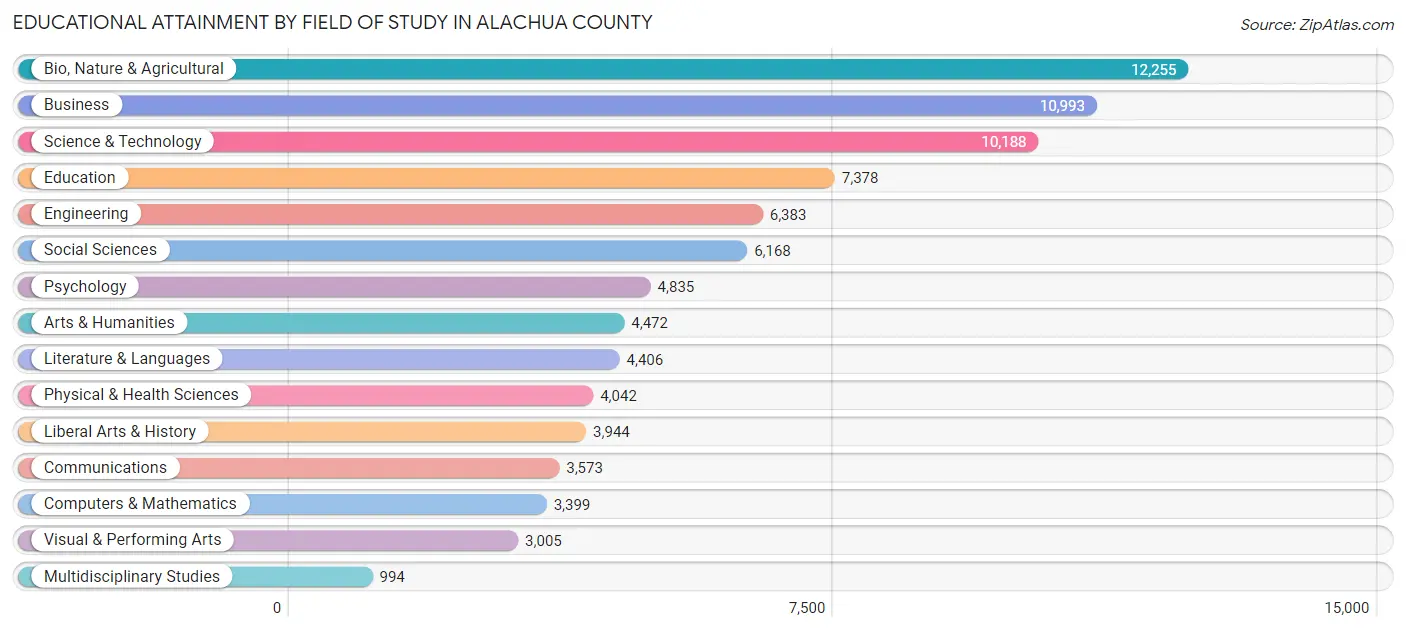
| Field of Study | # Graduates | % Graduates |
| Computers & Mathematics | 3,399 | 4.0% |
| Bio, Nature & Agricultural | 12,255 | 14.2% |
| Physical & Health Sciences | 4,042 | 4.7% |
| Psychology | 4,835 | 5.6% |
| Social Sciences | 6,168 | 7.2% |
| Engineering | 6,383 | 7.4% |
| Multidisciplinary Studies | 994 | 1.2% |
| Science & Technology | 10,188 | 11.8% |
| Business | 10,993 | 12.8% |
| Education | 7,378 | 8.6% |
| Literature & Languages | 4,406 | 5.1% |
| Liberal Arts & History | 3,944 | 4.6% |
| Visual & Performing Arts | 3,005 | 3.5% |
| Communications | 3,573 | 4.2% |
| Arts & Humanities | 4,472 | 5.2% |
| Total | 86,035 | 100.0% |
Transportation & Commute in Alachua County
Vehicle Availability by Sex in Alachua County
The most prevalent vehicle ownership categories in Alachua County are males with 2 vehicles (26,885, accounting for 41.3%) and females with 2 vehicles (25,585, making up 43.1%).
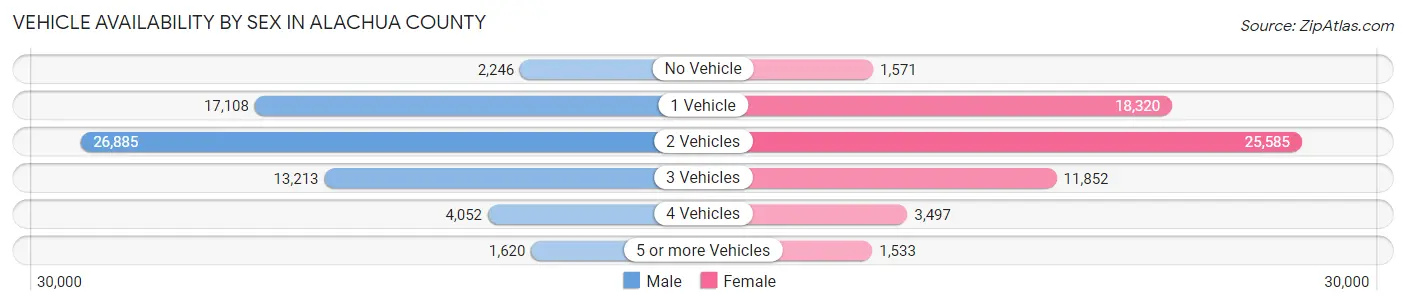
| Vehicles Available | Male | Female |
| No Vehicle | 2,246 (3.5%) | 1,571 (2.5%) |
| 1 Vehicle | 17,108 (26.3%) | 18,320 (29.4%) |
| 2 Vehicles | 26,885 (41.3%) | 25,585 (41.0%) |
| 3 Vehicles | 13,213 (20.3%) | 11,852 (19.0%) |
| 4 Vehicles | 4,052 (6.2%) | 3,497 (5.6%) |
| 5 or more Vehicles | 1,620 (2.5%) | 1,533 (2.5%) |
| Total | 65,124 (100.0%) | 62,358 (100.0%) |
Commute Time in Alachua County
The most frequently occuring commute durations in Alachua County are 20 to 24 minutes (24,969 commuters, 21.4%), 15 to 19 minutes (24,792 commuters, 21.3%), and 10 to 14 minutes (16,686 commuters, 14.3%).
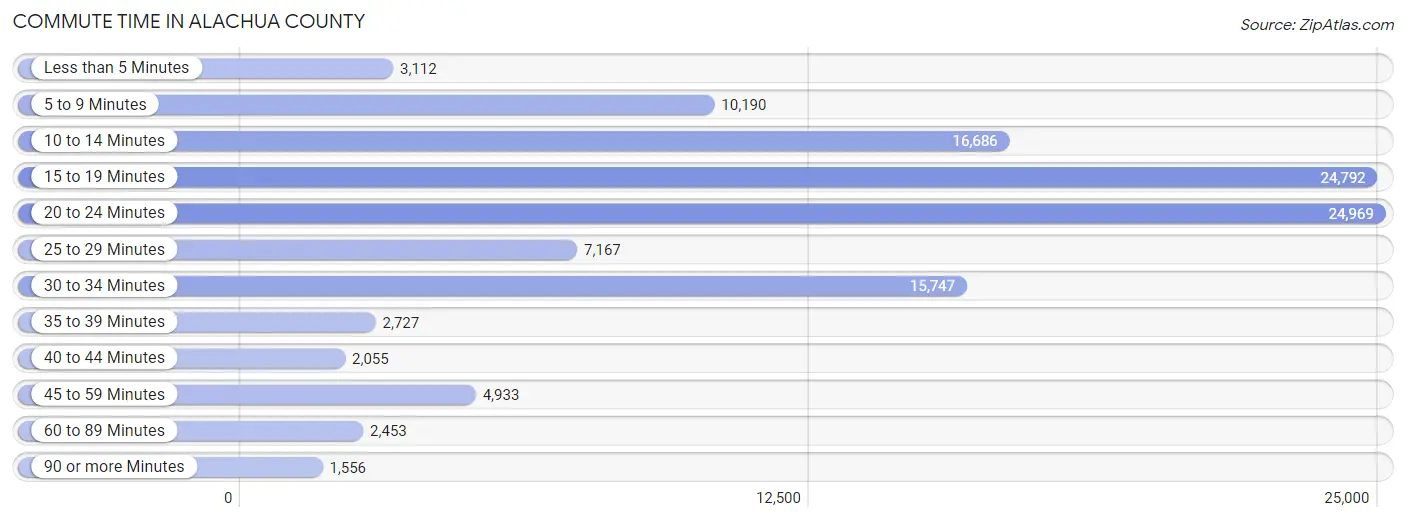
| Commute Time | # Commuters | % Commuters |
| Less than 5 Minutes | 3,112 | 2.7% |
| 5 to 9 Minutes | 10,190 | 8.8% |
| 10 to 14 Minutes | 16,686 | 14.3% |
| 15 to 19 Minutes | 24,792 | 21.3% |
| 20 to 24 Minutes | 24,969 | 21.4% |
| 25 to 29 Minutes | 7,167 | 6.2% |
| 30 to 34 Minutes | 15,747 | 13.5% |
| 35 to 39 Minutes | 2,727 | 2.3% |
| 40 to 44 Minutes | 2,055 | 1.8% |
| 45 to 59 Minutes | 4,933 | 4.2% |
| 60 to 89 Minutes | 2,453 | 2.1% |
| 90 or more Minutes | 1,556 | 1.3% |
Commute Time by Sex in Alachua County
The most common commute times in Alachua County are 15 to 19 minutes (13,098 commuters, 22.0%) for males and 20 to 24 minutes (12,204 commuters, 21.5%) for females.
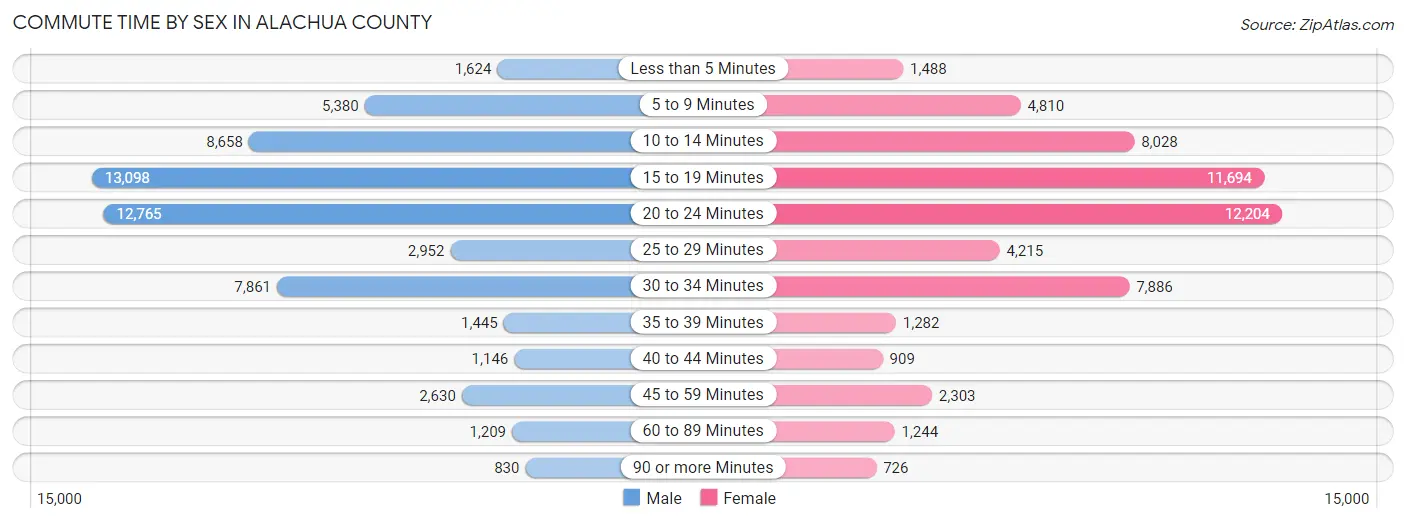
| Commute Time | Male | Female |
| Less than 5 Minutes | 1,624 (2.7%) | 1,488 (2.6%) |
| 5 to 9 Minutes | 5,380 (9.0%) | 4,810 (8.5%) |
| 10 to 14 Minutes | 8,658 (14.5%) | 8,028 (14.1%) |
| 15 to 19 Minutes | 13,098 (22.0%) | 11,694 (20.6%) |
| 20 to 24 Minutes | 12,765 (21.4%) | 12,204 (21.5%) |
| 25 to 29 Minutes | 2,952 (5.0%) | 4,215 (7.4%) |
| 30 to 34 Minutes | 7,861 (13.2%) | 7,886 (13.9%) |
| 35 to 39 Minutes | 1,445 (2.4%) | 1,282 (2.3%) |
| 40 to 44 Minutes | 1,146 (1.9%) | 909 (1.6%) |
| 45 to 59 Minutes | 2,630 (4.4%) | 2,303 (4.1%) |
| 60 to 89 Minutes | 1,209 (2.0%) | 1,244 (2.2%) |
| 90 or more Minutes | 830 (1.4%) | 726 (1.3%) |
Time of Departure to Work by Sex in Alachua County
The most frequent times of departure to work in Alachua County are 7:00 AM to 7:29 AM (8,911, 14.9%) for males and 7:00 AM to 7:29 AM (10,020, 17.6%) for females.
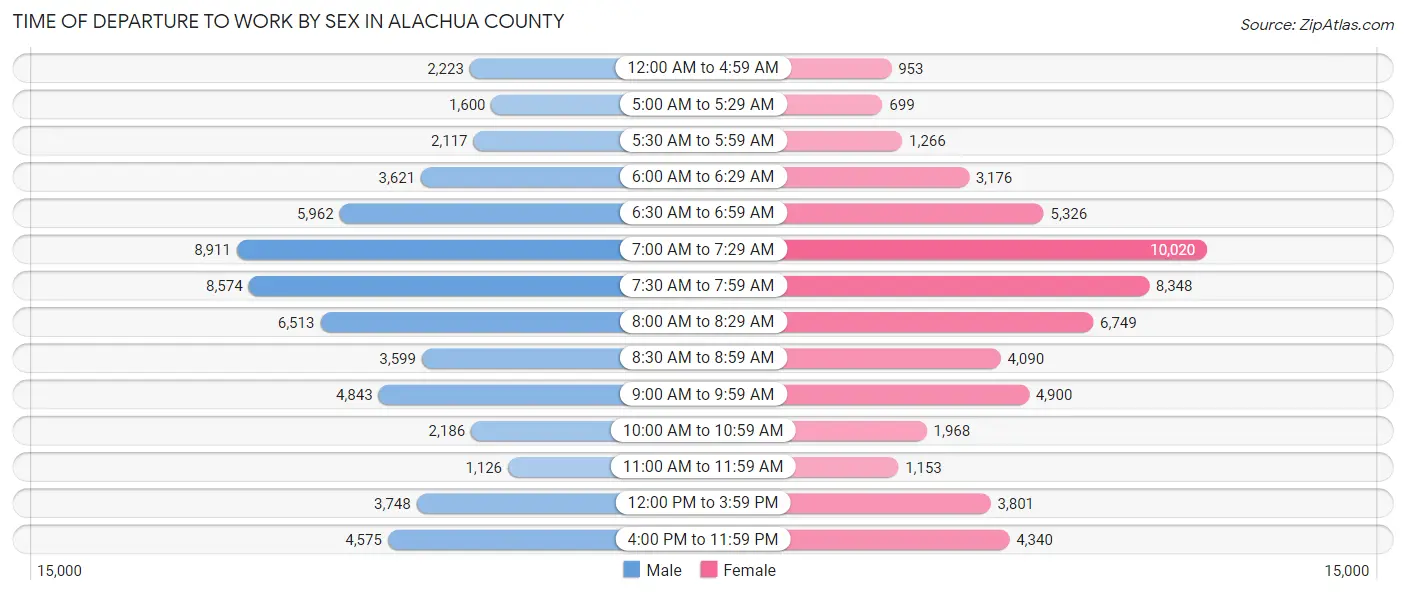
| Time of Departure | Male | Female |
| 12:00 AM to 4:59 AM | 2,223 (3.7%) | 953 (1.7%) |
| 5:00 AM to 5:29 AM | 1,600 (2.7%) | 699 (1.2%) |
| 5:30 AM to 5:59 AM | 2,117 (3.5%) | 1,266 (2.2%) |
| 6:00 AM to 6:29 AM | 3,621 (6.1%) | 3,176 (5.6%) |
| 6:30 AM to 6:59 AM | 5,962 (10.0%) | 5,326 (9.4%) |
| 7:00 AM to 7:29 AM | 8,911 (14.9%) | 10,020 (17.6%) |
| 7:30 AM to 7:59 AM | 8,574 (14.4%) | 8,348 (14.7%) |
| 8:00 AM to 8:29 AM | 6,513 (10.9%) | 6,749 (11.9%) |
| 8:30 AM to 8:59 AM | 3,599 (6.0%) | 4,090 (7.2%) |
| 9:00 AM to 9:59 AM | 4,843 (8.1%) | 4,900 (8.6%) |
| 10:00 AM to 10:59 AM | 2,186 (3.7%) | 1,968 (3.5%) |
| 11:00 AM to 11:59 AM | 1,126 (1.9%) | 1,153 (2.0%) |
| 12:00 PM to 3:59 PM | 3,748 (6.3%) | 3,801 (6.7%) |
| 4:00 PM to 11:59 PM | 4,575 (7.7%) | 4,340 (7.6%) |
| Total | 59,598 (100.0%) | 56,789 (100.0%) |
Housing Occupancy in Alachua County
Occupancy by Ownership in Alachua County
Of the total 108,597 dwellings in Alachua County, owner-occupied units account for 59,226 (54.5%), while renter-occupied units make up 49,371 (45.5%).
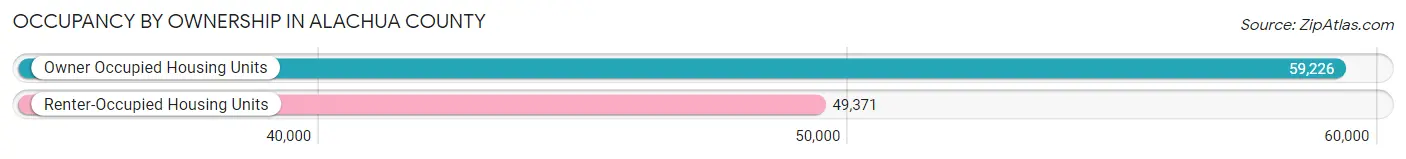
| Occupancy | # Housing Units | % Housing Units |
| Owner Occupied Housing Units | 59,226 | 54.5% |
| Renter-Occupied Housing Units | 49,371 | 45.5% |
| Total Occupied Housing Units | 108,597 | 100.0% |
Occupancy by Household Size in Alachua County
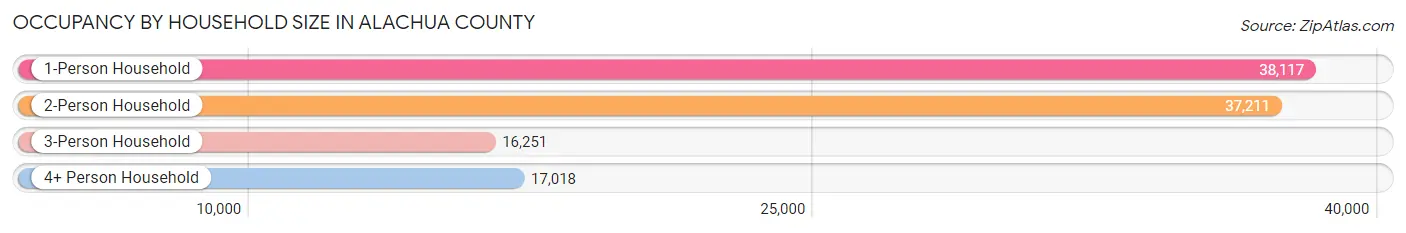
| Household Size | # Housing Units | % Housing Units |
| 1-Person Household | 38,117 | 35.1% |
| 2-Person Household | 37,211 | 34.3% |
| 3-Person Household | 16,251 | 15.0% |
| 4+ Person Household | 17,018 | 15.7% |
| Total Housing Units | 108,597 | 100.0% |
Occupancy by Ownership by Household Size in Alachua County
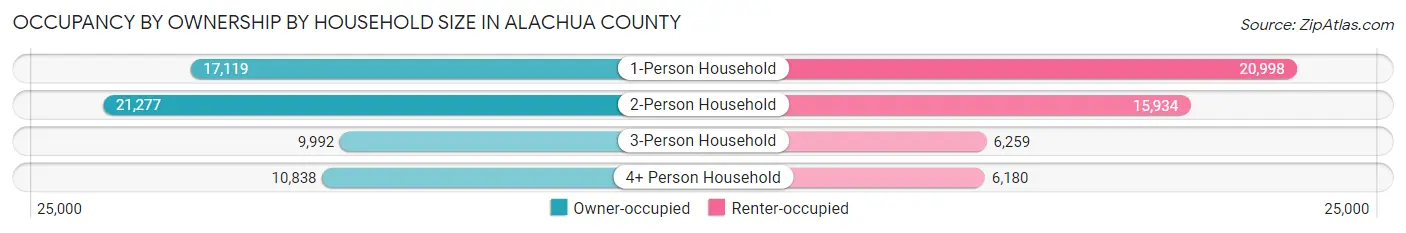
| Household Size | Owner-occupied | Renter-occupied |
| 1-Person Household | 17,119 (44.9%) | 20,998 (55.1%) |
| 2-Person Household | 21,277 (57.2%) | 15,934 (42.8%) |
| 3-Person Household | 9,992 (61.5%) | 6,259 (38.5%) |
| 4+ Person Household | 10,838 (63.7%) | 6,180 (36.3%) |
| Total Housing Units | 59,226 (54.5%) | 49,371 (45.5%) |
Occupancy by Educational Attainment in Alachua County
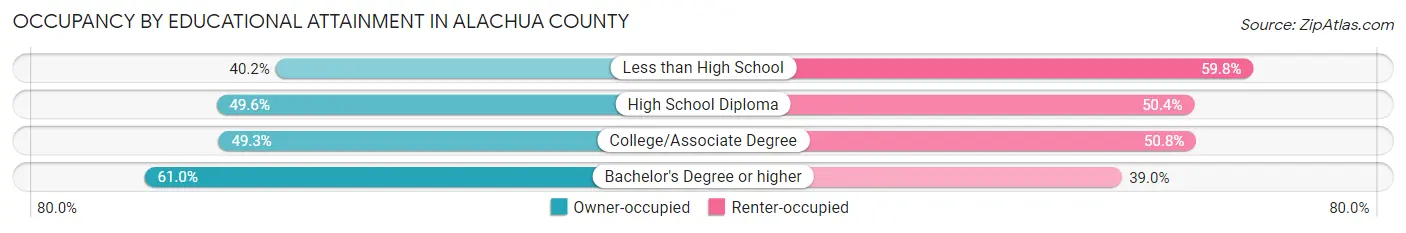
| Household Size | Owner-occupied | Renter-occupied |
| Less than High School | 2,034 (40.2%) | 3,026 (59.8%) |
| High School Diploma | 8,936 (49.6%) | 9,093 (50.4%) |
| College/Associate Degree | 16,300 (49.2%) | 16,794 (50.7%) |
| Bachelor's Degree or higher | 31,956 (61.0%) | 20,458 (39.0%) |
Occupancy by Age of Householder in Alachua County
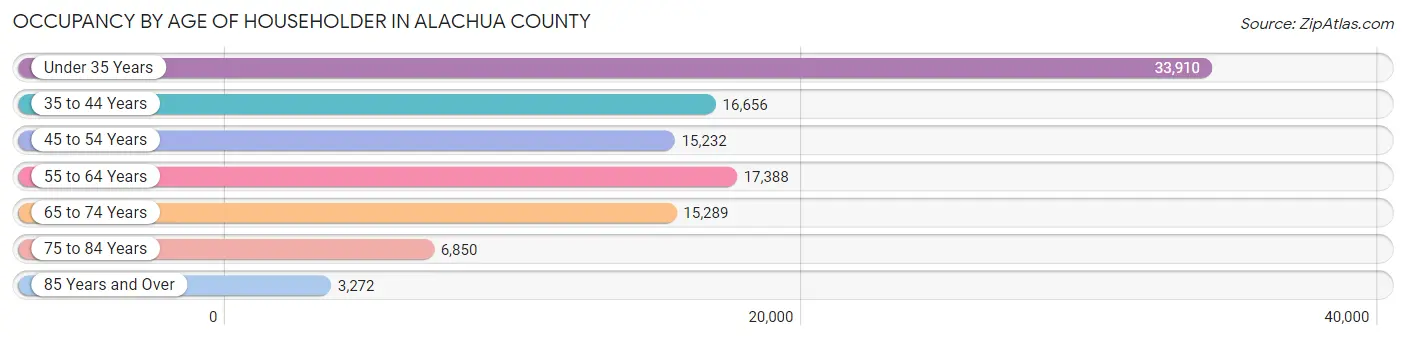
| Age Bracket | # Households | % Households |
| Under 35 Years | 33,910 | 31.2% |
| 35 to 44 Years | 16,656 | 15.3% |
| 45 to 54 Years | 15,232 | 14.0% |
| 55 to 64 Years | 17,388 | 16.0% |
| 65 to 74 Years | 15,289 | 14.1% |
| 75 to 84 Years | 6,850 | 6.3% |
| 85 Years and Over | 3,272 | 3.0% |
| Total | 108,597 | 100.0% |
Housing Finances in Alachua County
Median Income by Occupancy in Alachua County
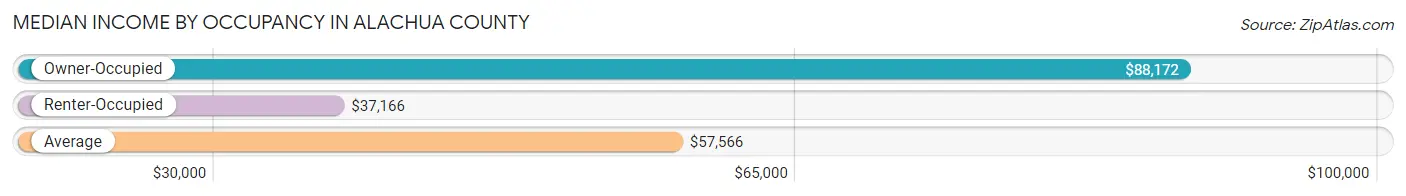
| Occupancy Type | # Households | Median Income |
| Owner-Occupied | 59,226 (54.5%) | $88,172 |
| Renter-Occupied | 49,371 (45.5%) | $37,166 |
| Average | 108,597 (100.0%) | $57,566 |
Occupancy by Householder Income Bracket in Alachua County
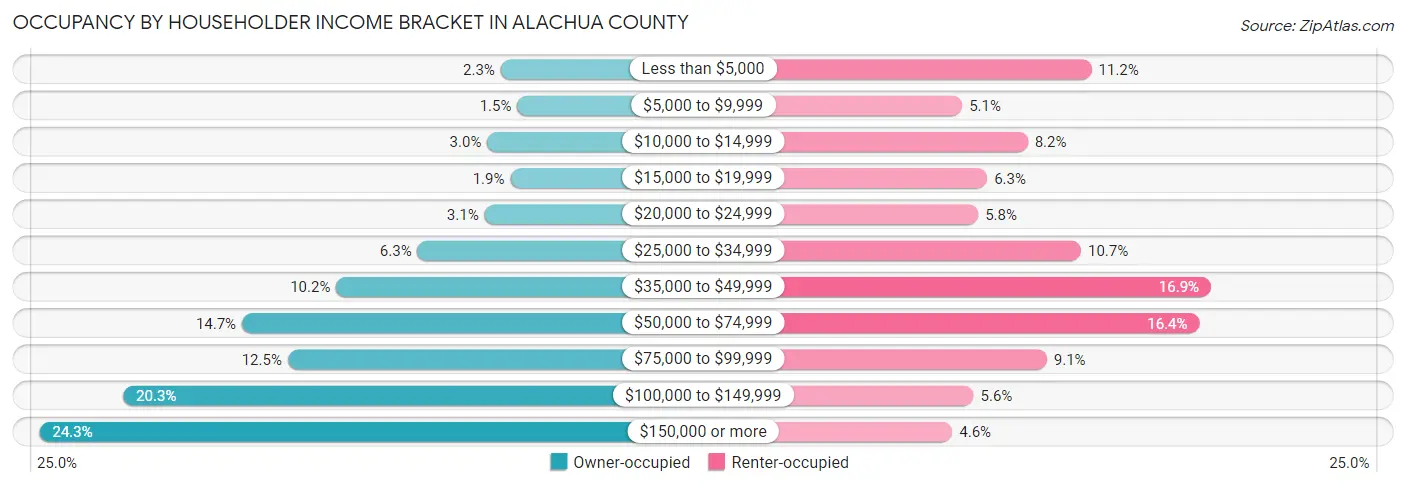
| Income Bracket | Owner-occupied | Renter-occupied |
| Less than $5,000 | 1,382 (2.3%) | 5,551 (11.2%) |
| $5,000 to $9,999 | 914 (1.5%) | 2,508 (5.1%) |
| $10,000 to $14,999 | 1,760 (3.0%) | 4,048 (8.2%) |
| $15,000 to $19,999 | 1,109 (1.9%) | 3,094 (6.3%) |
| $20,000 to $24,999 | 1,834 (3.1%) | 2,885 (5.8%) |
| $25,000 to $34,999 | 3,726 (6.3%) | 5,301 (10.7%) |
| $35,000 to $49,999 | 6,015 (10.2%) | 8,353 (16.9%) |
| $50,000 to $74,999 | 8,679 (14.6%) | 8,080 (16.4%) |
| $75,000 to $99,999 | 7,388 (12.5%) | 4,500 (9.1%) |
| $100,000 to $149,999 | 12,028 (20.3%) | 2,777 (5.6%) |
| $150,000 or more | 14,391 (24.3%) | 2,274 (4.6%) |
| Total | 59,226 (100.0%) | 49,371 (100.0%) |
Monthly Housing Cost Tiers in Alachua County
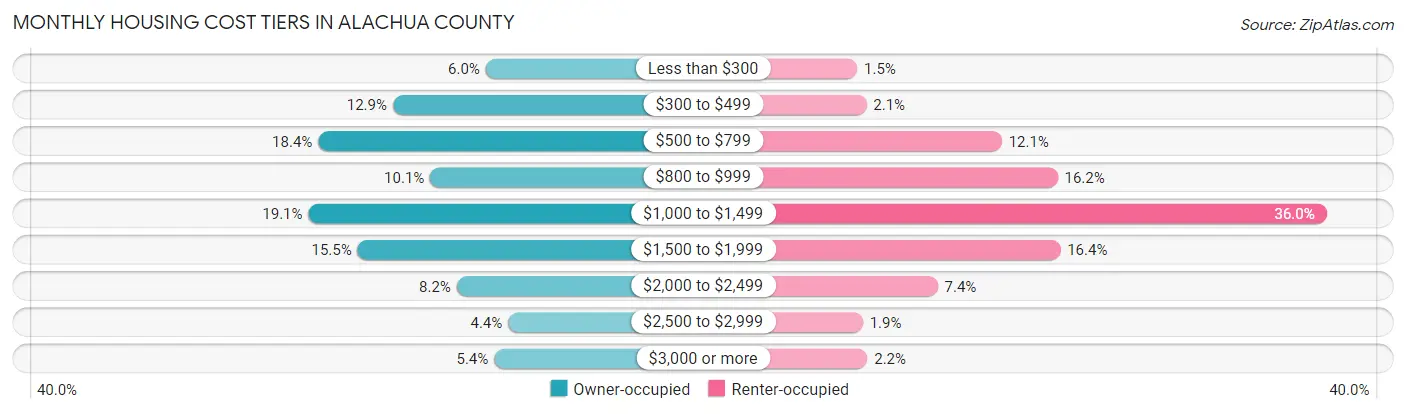
| Monthly Cost | Owner-occupied | Renter-occupied |
| Less than $300 | 3,576 (6.0%) | 716 (1.5%) |
| $300 to $499 | 7,626 (12.9%) | 1,051 (2.1%) |
| $500 to $799 | 10,888 (18.4%) | 5,976 (12.1%) |
| $800 to $999 | 6,002 (10.1%) | 8,005 (16.2%) |
| $1,000 to $1,499 | 11,310 (19.1%) | 17,784 (36.0%) |
| $1,500 to $1,999 | 9,171 (15.5%) | 8,102 (16.4%) |
| $2,000 to $2,499 | 4,842 (8.2%) | 3,643 (7.4%) |
| $2,500 to $2,999 | 2,601 (4.4%) | 918 (1.9%) |
| $3,000 or more | 3,210 (5.4%) | 1,084 (2.2%) |
| Total | 59,226 (100.0%) | 49,371 (100.0%) |
Physical Housing Characteristics in Alachua County
Housing Structures in Alachua County
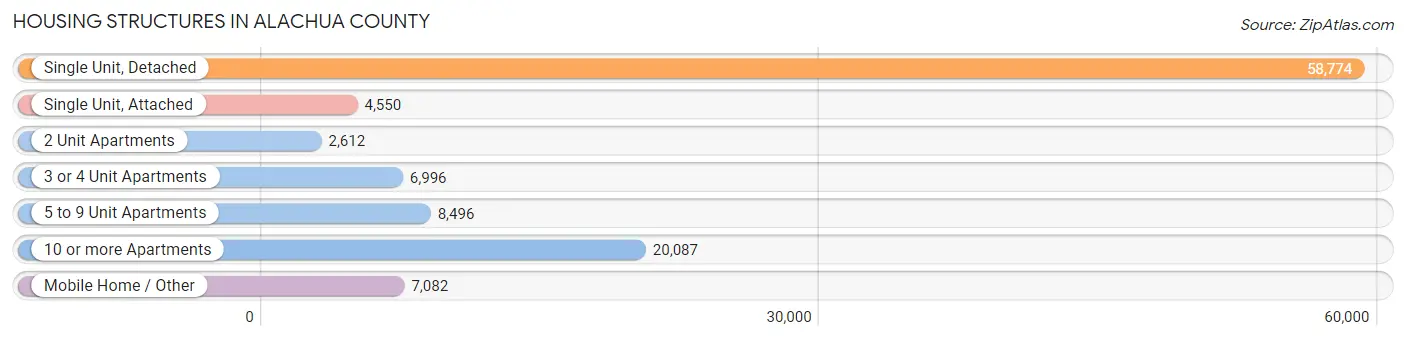
| Structure Type | # Housing Units | % Housing Units |
| Single Unit, Detached | 58,774 | 54.1% |
| Single Unit, Attached | 4,550 | 4.2% |
| 2 Unit Apartments | 2,612 | 2.4% |
| 3 or 4 Unit Apartments | 6,996 | 6.4% |
| 5 to 9 Unit Apartments | 8,496 | 7.8% |
| 10 or more Apartments | 20,087 | 18.5% |
| Mobile Home / Other | 7,082 | 6.5% |
| Total | 108,597 | 100.0% |
Housing Structures by Occupancy in Alachua County
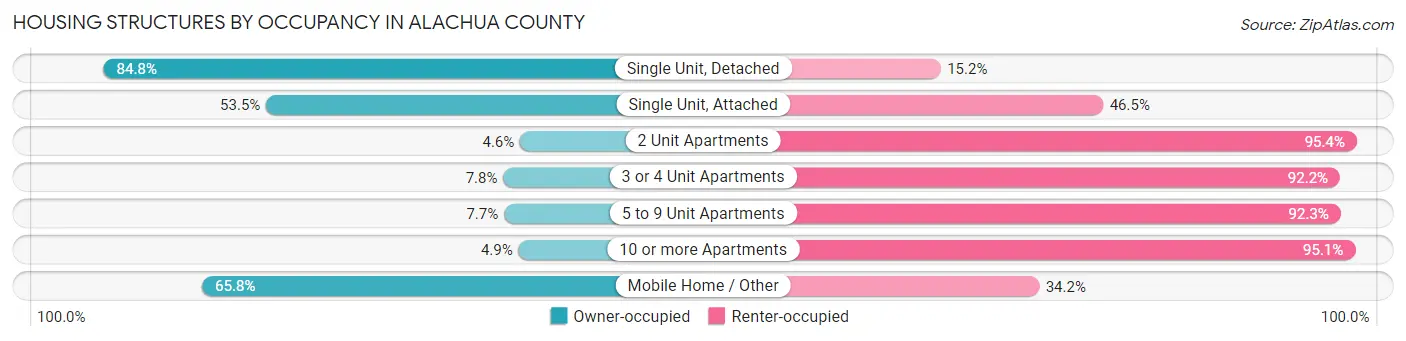
| Structure Type | Owner-occupied | Renter-occupied |
| Single Unit, Detached | 49,826 (84.8%) | 8,948 (15.2%) |
| Single Unit, Attached | 2,434 (53.5%) | 2,116 (46.5%) |
| 2 Unit Apartments | 120 (4.6%) | 2,492 (95.4%) |
| 3 or 4 Unit Apartments | 548 (7.8%) | 6,448 (92.2%) |
| 5 to 9 Unit Apartments | 653 (7.7%) | 7,843 (92.3%) |
| 10 or more Apartments | 984 (4.9%) | 19,103 (95.1%) |
| Mobile Home / Other | 4,661 (65.8%) | 2,421 (34.2%) |
| Total | 59,226 (54.5%) | 49,371 (45.5%) |
Housing Structures by Number of Rooms in Alachua County
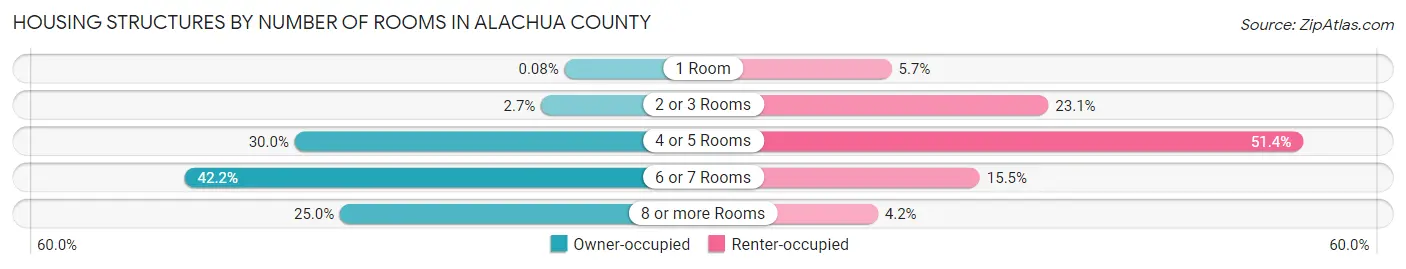
| Number of Rooms | Owner-occupied | Renter-occupied |
| 1 Room | 49 (0.1%) | 2,829 (5.7%) |
| 2 or 3 Rooms | 1,579 (2.7%) | 11,426 (23.1%) |
| 4 or 5 Rooms | 17,780 (30.0%) | 25,372 (51.4%) |
| 6 or 7 Rooms | 25,017 (42.2%) | 7,667 (15.5%) |
| 8 or more Rooms | 14,801 (25.0%) | 2,077 (4.2%) |
| Total | 59,226 (100.0%) | 49,371 (100.0%) |
Housing Structure by Heating Type in Alachua County
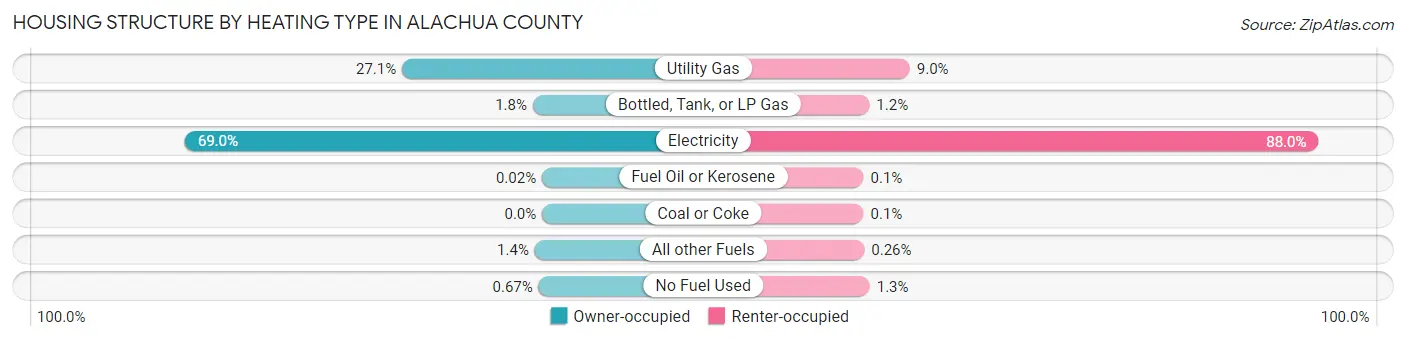
| Heating Type | Owner-occupied | Renter-occupied |
| Utility Gas | 16,029 (27.1%) | 4,462 (9.0%) |
| Bottled, Tank, or LP Gas | 1,062 (1.8%) | 605 (1.2%) |
| Electricity | 40,883 (69.0%) | 43,434 (88.0%) |
| Fuel Oil or Kerosene | 14 (0.0%) | 47 (0.1%) |
| Coal or Coke | 0 (0.0%) | 51 (0.1%) |
| All other Fuels | 843 (1.4%) | 130 (0.3%) |
| No Fuel Used | 395 (0.7%) | 642 (1.3%) |
| Total | 59,226 (100.0%) | 49,371 (100.0%) |
Household Vehicle Usage in Alachua County
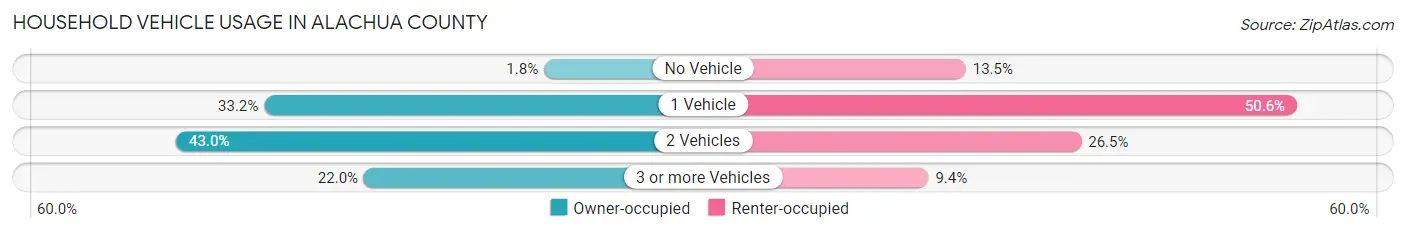
| Vehicles per Household | Owner-occupied | Renter-occupied |
| No Vehicle | 1,080 (1.8%) | 6,683 (13.5%) |
| 1 Vehicle | 19,643 (33.2%) | 24,995 (50.6%) |
| 2 Vehicles | 25,478 (43.0%) | 13,074 (26.5%) |
| 3 or more Vehicles | 13,025 (22.0%) | 4,619 (9.4%) |
| Total | 59,226 (100.0%) | 49,371 (100.0%) |
Real Estate & Mortgages in Alachua County
Real Estate and Mortgage Overview in Alachua County
| Characteristic | Without Mortgage | With Mortgage |
| Housing Units | 25,481 | 33,745 |
| Median Property Value | $223,300 | $260,100 |
| Median Household Income | $62,557 | $10,100 |
| Monthly Housing Costs | $549 | $3,177 |
| Real Estate Taxes | $2,192 | $721 |
Property Value by Mortgage Status in Alachua County
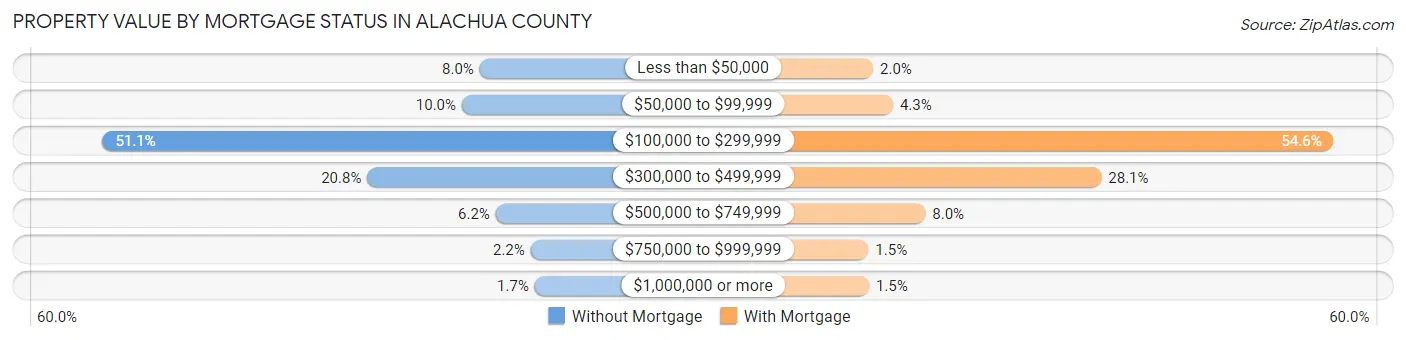
| Property Value | Without Mortgage | With Mortgage |
| Less than $50,000 | 2,036 (8.0%) | 679 (2.0%) |
| $50,000 to $99,999 | 2,557 (10.0%) | 1,445 (4.3%) |
| $100,000 to $299,999 | 13,022 (51.1%) | 18,436 (54.6%) |
| $300,000 to $499,999 | 5,311 (20.8%) | 9,478 (28.1%) |
| $500,000 to $749,999 | 1,570 (6.2%) | 2,692 (8.0%) |
| $750,000 to $999,999 | 553 (2.2%) | 496 (1.5%) |
| $1,000,000 or more | 432 (1.7%) | 519 (1.5%) |
| Total | 25,481 (100.0%) | 33,745 (100.0%) |
Household Income by Mortgage Status in Alachua County
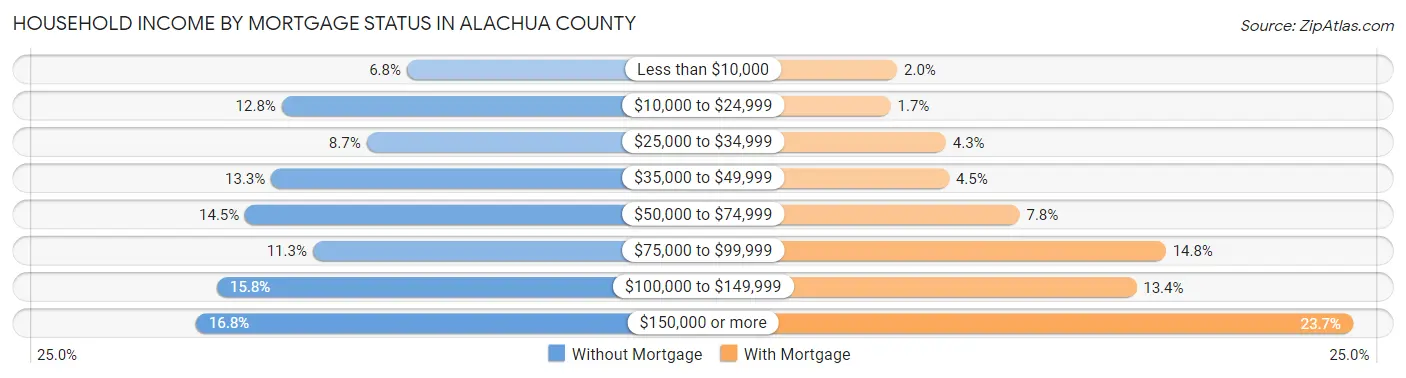
| Household Income | Without Mortgage | With Mortgage |
| Less than $10,000 | 1,733 (6.8%) | 668 (2.0%) |
| $10,000 to $24,999 | 3,251 (12.8%) | 563 (1.7%) |
| $25,000 to $34,999 | 2,223 (8.7%) | 1,452 (4.3%) |
| $35,000 to $49,999 | 3,378 (13.3%) | 1,503 (4.4%) |
| $50,000 to $74,999 | 3,694 (14.5%) | 2,637 (7.8%) |
| $75,000 to $99,999 | 2,875 (11.3%) | 4,985 (14.8%) |
| $100,000 to $149,999 | 4,036 (15.8%) | 4,513 (13.4%) |
| $150,000 or more | 4,291 (16.8%) | 7,992 (23.7%) |
| Total | 25,481 (100.0%) | 33,745 (100.0%) |
Property Value to Household Income Ratio in Alachua County
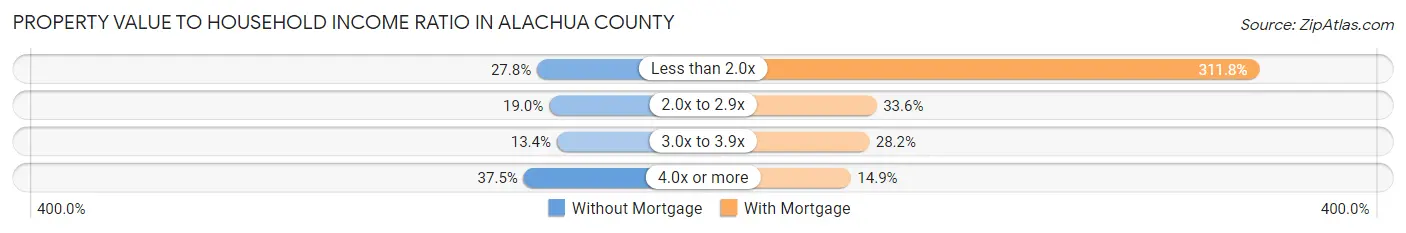
| Value-to-Income Ratio | Without Mortgage | With Mortgage |
| Less than 2.0x | 7,080 (27.8%) | 105,231 (311.8%) |
| 2.0x to 2.9x | 4,844 (19.0%) | 11,347 (33.6%) |
| 3.0x to 3.9x | 3,407 (13.4%) | 9,528 (28.2%) |
| 4.0x or more | 9,542 (37.4%) | 5,017 (14.9%) |
| Total | 25,481 (100.0%) | 33,745 (100.0%) |
Real Estate Taxes by Mortgage Status in Alachua County
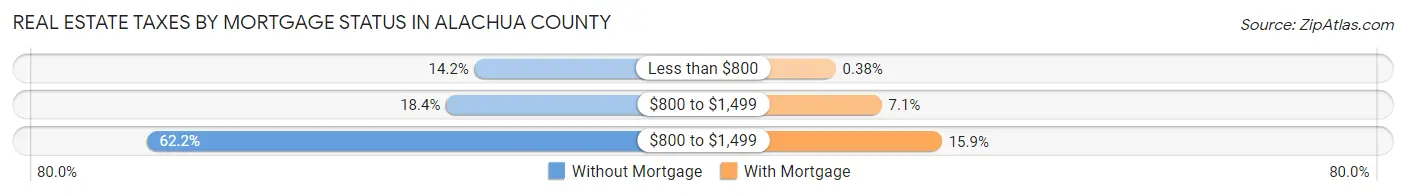
| Property Taxes | Without Mortgage | With Mortgage |
| Less than $800 | 3,628 (14.2%) | 127 (0.4%) |
| $800 to $1,499 | 4,687 (18.4%) | 2,397 (7.1%) |
| $800 to $1,499 | 15,839 (62.2%) | 5,360 (15.9%) |
| Total | 25,481 (100.0%) | 33,745 (100.0%) |
Health & Disability in Alachua County
Health Insurance Coverage by Age in Alachua County
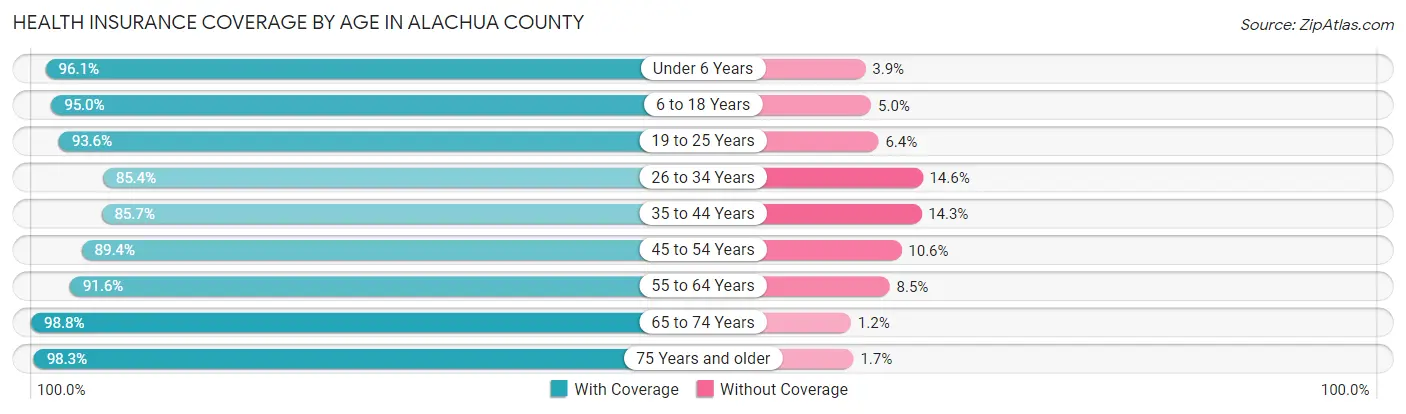
| Age Bracket | With Coverage | Without Coverage |
| Under 6 Years | 15,251 (96.1%) | 624 (3.9%) |
| 6 to 18 Years | 39,815 (95.0%) | 2,093 (5.0%) |
| 19 to 25 Years | 53,084 (93.6%) | 3,619 (6.4%) |
| 26 to 34 Years | 31,205 (85.4%) | 5,328 (14.6%) |
| 35 to 44 Years | 26,691 (85.7%) | 4,468 (14.3%) |
| 45 to 54 Years | 23,662 (89.4%) | 2,816 (10.6%) |
| 55 to 64 Years | 26,333 (91.5%) | 2,432 (8.5%) |
| 65 to 74 Years | 23,979 (98.8%) | 299 (1.2%) |
| 75 Years and older | 15,115 (98.3%) | 263 (1.7%) |
| Total | 255,135 (92.1%) | 21,942 (7.9%) |
Health Insurance Coverage by Citizenship Status in Alachua County
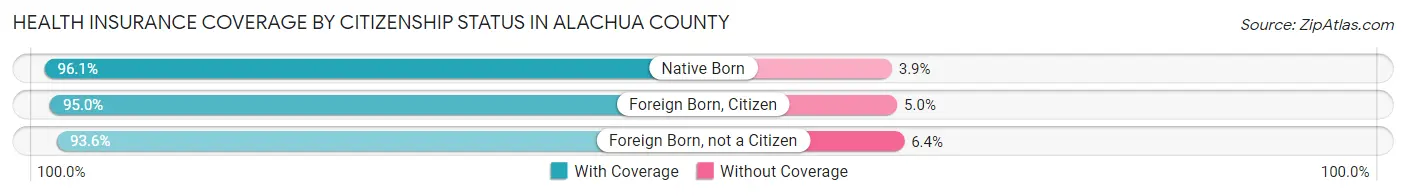
| Citizenship Status | With Coverage | Without Coverage |
| Native Born | 15,251 (96.1%) | 624 (3.9%) |
| Foreign Born, Citizen | 39,815 (95.0%) | 2,093 (5.0%) |
| Foreign Born, not a Citizen | 53,084 (93.6%) | 3,619 (6.4%) |
Health Insurance Coverage by Household Income in Alachua County
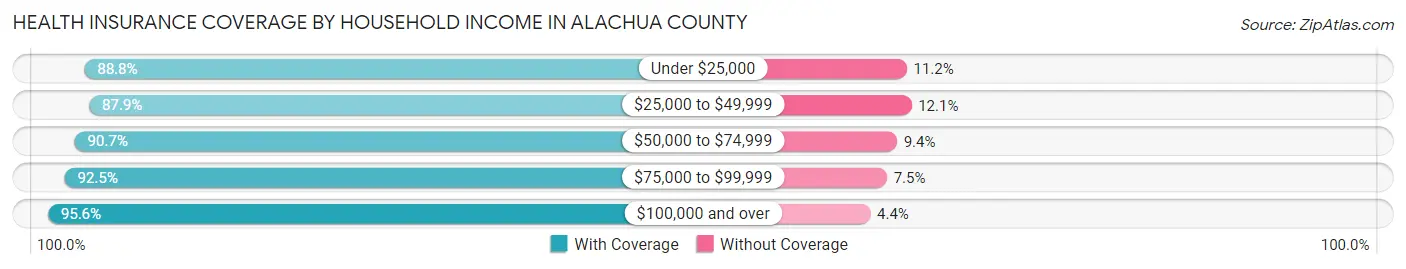
| Household Income | With Coverage | Without Coverage |
| Under $25,000 | 40,641 (88.8%) | 5,123 (11.2%) |
| $25,000 to $49,999 | 42,035 (87.9%) | 5,771 (12.1%) |
| $50,000 to $74,999 | 36,174 (90.6%) | 3,729 (9.3%) |
| $75,000 to $99,999 | 29,971 (92.5%) | 2,423 (7.5%) |
| $100,000 and over | 91,133 (95.6%) | 4,153 (4.4%) |
Public vs Private Health Insurance Coverage by Age in Alachua County
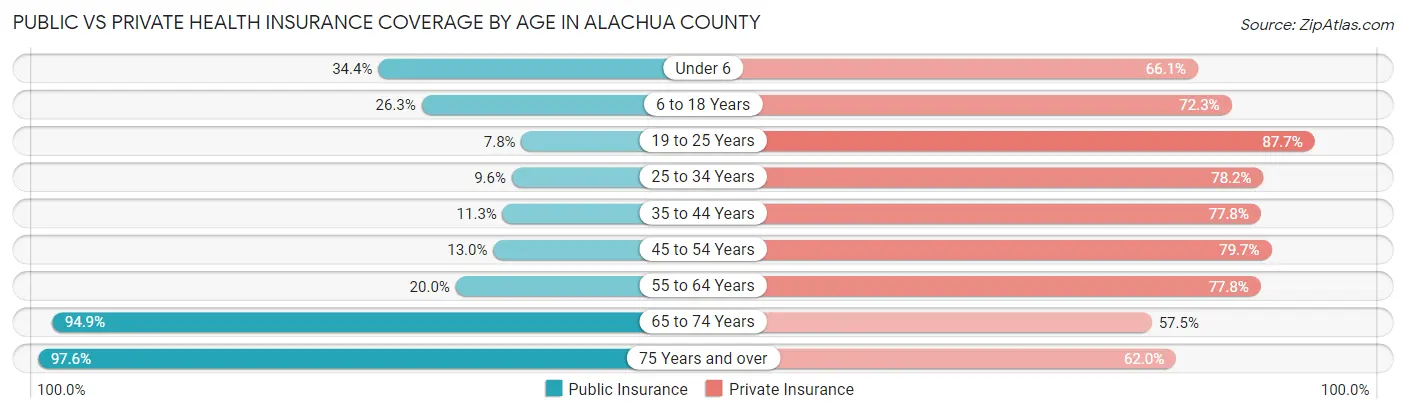
| Age Bracket | Public Insurance | Private Insurance |
| Under 6 | 5,454 (34.4%) | 10,491 (66.1%) |
| 6 to 18 Years | 11,025 (26.3%) | 30,302 (72.3%) |
| 19 to 25 Years | 4,410 (7.8%) | 49,752 (87.7%) |
| 25 to 34 Years | 3,497 (9.6%) | 28,585 (78.2%) |
| 35 to 44 Years | 3,512 (11.3%) | 24,229 (77.8%) |
| 45 to 54 Years | 3,441 (13.0%) | 21,111 (79.7%) |
| 55 to 64 Years | 5,751 (20.0%) | 22,365 (77.7%) |
| 65 to 74 Years | 23,047 (94.9%) | 13,968 (57.5%) |
| 75 Years and over | 15,003 (97.6%) | 9,540 (62.0%) |
| Total | 75,140 (27.1%) | 210,343 (75.9%) |
Disability Status by Sex by Age in Alachua County
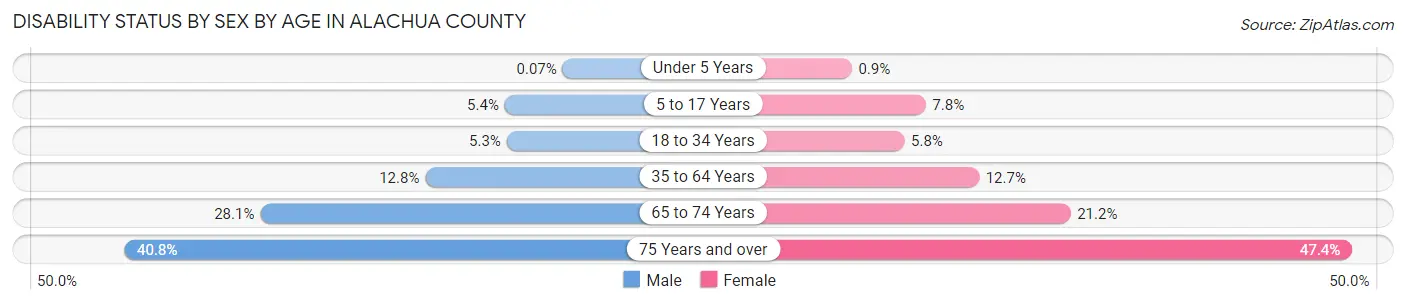
| Age Bracket | Male | Female |
| Under 5 Years | 5 (0.1%) | 60 (0.9%) |
| 5 to 17 Years | 980 (5.4%) | 1,380 (7.8%) |
| 18 to 34 Years | 2,578 (5.3%) | 3,041 (5.8%) |
| 35 to 64 Years | 5,374 (12.8%) | 5,654 (12.7%) |
| 65 to 74 Years | 3,102 (28.1%) | 2,809 (21.2%) |
| 75 Years and over | 2,685 (40.8%) | 4,164 (47.4%) |
Disability Class by Sex by Age in Alachua County
Disability Class: Hearing Difficulty
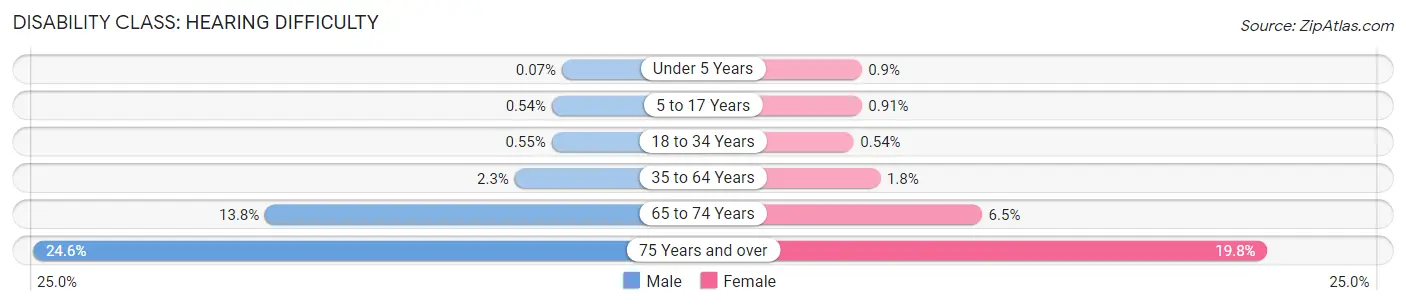
| Age Bracket | Male | Female |
| Under 5 Years | 5 (0.1%) | 60 (0.9%) |
| 5 to 17 Years | 98 (0.5%) | 161 (0.9%) |
| 18 to 34 Years | 268 (0.5%) | 284 (0.5%) |
| 35 to 64 Years | 946 (2.3%) | 789 (1.8%) |
| 65 to 74 Years | 1,526 (13.8%) | 860 (6.5%) |
| 75 Years and over | 1,621 (24.6%) | 1,736 (19.8%) |
Disability Class: Vision Difficulty
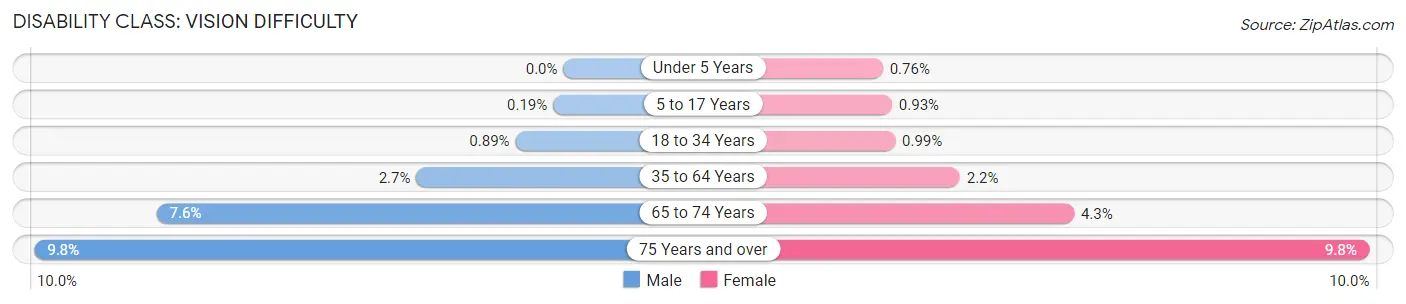
| Age Bracket | Male | Female |
| Under 5 Years | 0 (0.0%) | 51 (0.8%) |
| 5 to 17 Years | 35 (0.2%) | 166 (0.9%) |
| 18 to 34 Years | 437 (0.9%) | 521 (1.0%) |
| 35 to 64 Years | 1,144 (2.7%) | 972 (2.2%) |
| 65 to 74 Years | 833 (7.5%) | 571 (4.3%) |
| 75 Years and over | 647 (9.8%) | 860 (9.8%) |
Disability Class: Cognitive Difficulty
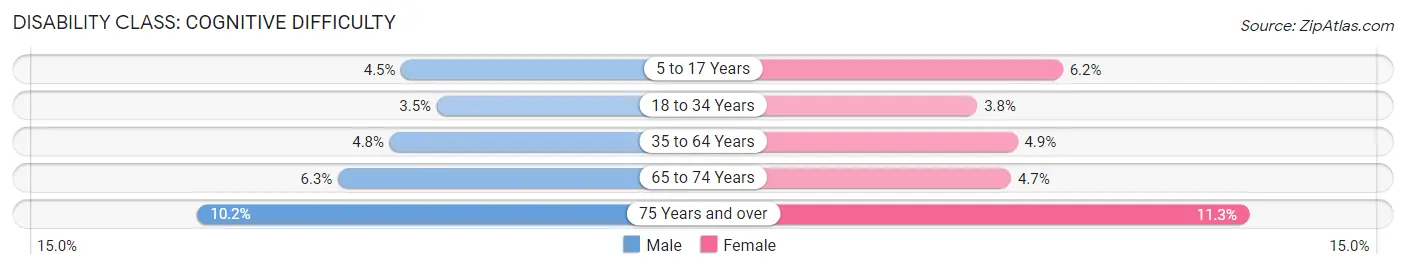
| Age Bracket | Male | Female |
| 5 to 17 Years | 813 (4.5%) | 1,094 (6.1%) |
| 18 to 34 Years | 1,726 (3.5%) | 1,983 (3.8%) |
| 35 to 64 Years | 2,025 (4.8%) | 2,175 (4.9%) |
| 65 to 74 Years | 691 (6.3%) | 624 (4.7%) |
| 75 Years and over | 671 (10.2%) | 996 (11.3%) |
Disability Class: Ambulatory Difficulty
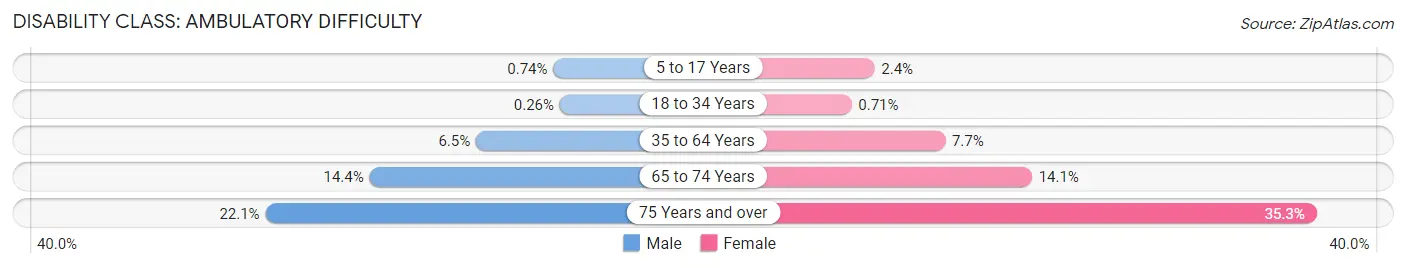
| Age Bracket | Male | Female |
| 5 to 17 Years | 134 (0.7%) | 430 (2.4%) |
| 18 to 34 Years | 128 (0.3%) | 374 (0.7%) |
| 35 to 64 Years | 2,716 (6.5%) | 3,408 (7.7%) |
| 65 to 74 Years | 1,587 (14.4%) | 1,869 (14.1%) |
| 75 Years and over | 1,457 (22.1%) | 3,100 (35.3%) |
Disability Class: Self-Care Difficulty
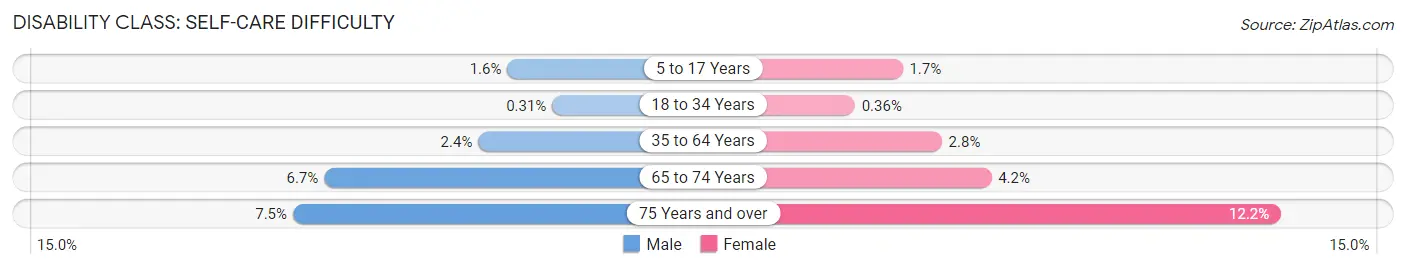
| Age Bracket | Male | Female |
| 5 to 17 Years | 282 (1.6%) | 300 (1.7%) |
| 18 to 34 Years | 151 (0.3%) | 192 (0.4%) |
| 35 to 64 Years | 995 (2.4%) | 1,235 (2.8%) |
| 65 to 74 Years | 734 (6.7%) | 551 (4.2%) |
| 75 Years and over | 496 (7.5%) | 1,075 (12.2%) |
Technology Access in Alachua County
Computing Device Access in Alachua County
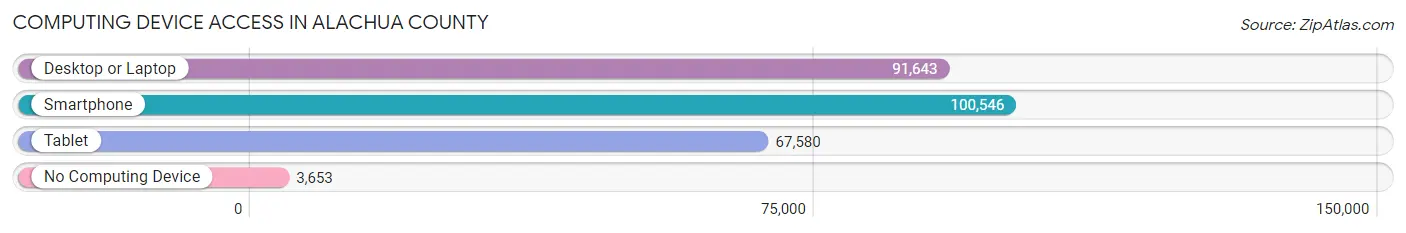
| Device Type | # Households | % Households |
| Desktop or Laptop | 91,643 | 84.4% |
| Smartphone | 100,546 | 92.6% |
| Tablet | 67,580 | 62.2% |
| No Computing Device | 3,653 | 3.4% |
| Total | 108,597 | 100.0% |
Internet Access in Alachua County
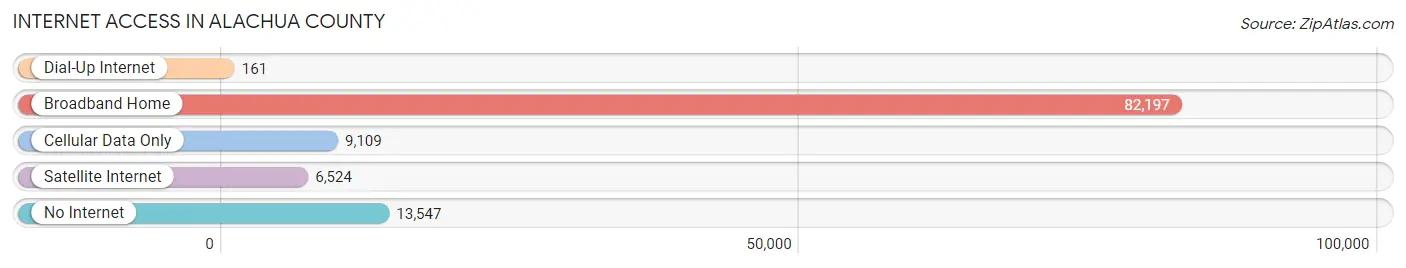
| Internet Type | # Households | % Households |
| Dial-Up Internet | 161 | 0.2% |
| Broadband Home | 82,197 | 75.7% |
| Cellular Data Only | 9,109 | 8.4% |
| Satellite Internet | 6,524 | 6.0% |
| No Internet | 13,547 | 12.5% |
| Total | 108,597 | 100.0% |
Alachua County Summary
Alachua County is located in the north-central part of the state of Florida, and is part of the Gainesville Metropolitan Statistical Area. It is bordered by Marion, Levy, Gilchrist, and Putnam counties. The county seat is Gainesville, and the county has a total area of 926 square miles.
History
Alachua County was created in 1824, and was named for a Seminole Indian village that was located in the area. The county was originally part of the territory of East Florida, and was part of the Second Seminole War. The county was divided into two parts in 1854, with the western part becoming Levy County. The county was home to several Native American tribes, including the Seminole, Timucua, and Apalachee.
Geography
Alachua County is located in the north-central part of the state of Florida. It is bordered by Marion, Levy, Gilchrist, and Putnam counties. The county has a total area of 926 square miles, of which 890 square miles is land and 36 square miles is water. The county is home to several rivers, including the Santa Fe, Suwannee, and Ichetucknee. The county is also home to several lakes, including Newnan's Lake, Orange Lake, and Lochloosa Lake.
Economy
Alachua County has a diverse economy, with a variety of industries. The county is home to several major employers, including the University of Florida, Shands Hospital, and the Gainesville Regional Airport. The county is also home to several major industries, including manufacturing, healthcare, and technology. The county is also home to several major retail centers, including the Oaks Mall and Butler Plaza.
Demographics
As of the 2010 census, Alachua County had a population of 247,336. The population was spread out, with 24.7% under the age of 18, 11.3% from 18 to 24, 28.2% from 25 to 44, 22.3% from 45 to 64, and 13.5% who were 65 years of age or older. The median age was 34.3 years. The median income for a household in the county was $45,934, and the median income for a family was $54,945. The per capita income for the county was $23,845.
Alachua County is home to a diverse population, with a variety of racial and ethnic backgrounds. The population is 54.2% White, 24.3% African American, 0.4% Native American, 5.2% Asian, 0.1% Pacific Islander, 11.3% from other races, and 4.5% from two or more races. Hispanic or Latino of any race were 22.3% of the population.
Conclusion
Alachua County is a diverse county located in the north-central part of the state of Florida. The county has a rich history, and is home to a variety of industries and employers. The county has a diverse population, with a variety of racial and ethnic backgrounds. The county has a strong economy, and is home to several major employers and industries.
Common Questions
What is the Total Population of Alachua County?
Total Population of Alachua County is 279,729.
What is the Total Male Population of Alachua County?
Total Male Population of Alachua County is 135,121.
What is the Total Female Population of Alachua County?
Total Female Population of Alachua County is 144,608.
What is the Ratio of Males per 100 Females in Alachua County?
There are 93.44 Males per 100 Females in Alachua County.
What is the Ratio of Females per 100 Males in Alachua County?
There are 107.02 Females per 100 Males in Alachua County.
What is the Median Population Age in Alachua County?
Median Population Age in Alachua County is 31.7 Years.
What is the Average Family Size in Alachua County
Average Family Size in Alachua County is 3.2 People.
What is the Average Household Size in Alachua County
Average Household Size in Alachua County is 2.4 People.
What is Per Capita Income in Alachua County?
Per Capita income in Alachua County is $35,684.
What is the Median Family Income in Alachua County?
Median Family Income in Alachua County is $89,713.
What is the Median Household income in Alachua County?
Median Household Income in Alachua County is $57,566.
What is Income or Wage Gap in Alachua County?
Income or Wage Gap in Alachua County is 17.2%.
Women in Alachua County earn 82.8 cents for every dollar earned by a man.
What is Family Income Deficit in Alachua County?
Family Income Deficit in Alachua County is $10,728.
Families that are below poverty line in Alachua County earn $10,728 less on average than the poverty threshold level.
What is Inequality or Gini Index in Alachua County?
Inequality or Gini Index in Alachua County is 0.52.
How Large is the Labor Force in Alachua County?
There are 140,425 People in the Labor Forcein in Alachua County.
What is the Percentage of People in the Labor Force in Alachua County?
59.7% of People are in the Labor Force in Alachua County.
What is the Unemployment Rate in Alachua County?
Unemployment Rate in Alachua County is 5.1%.