Buckingham, FL
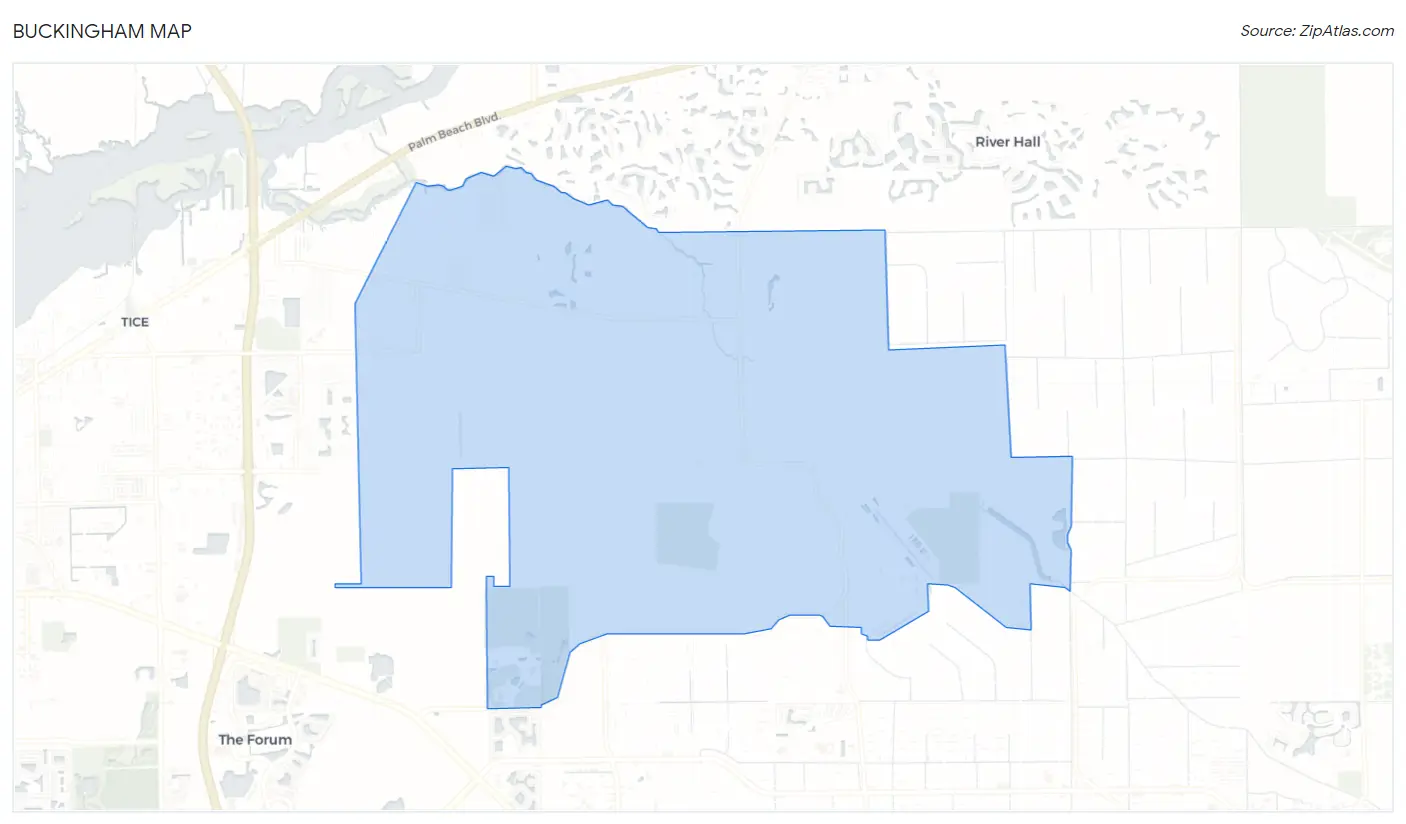
Buckingham Map
Buckingham Overview
4,288
TOTAL POPULATION
1,935
MALE POPULATION
2,353
FEMALE POPULATION
82.24
MALES / 100 FEMALES
121.60
FEMALES / 100 MALES
47.4
MEDIAN AGE
2.9
AVG FAMILY SIZE
2.6
AVG HOUSEHOLD SIZE
$41,145
PER CAPITA INCOME
$109,817
AVG FAMILY INCOME
$103,563
AVG HOUSEHOLD INCOME
35.9%
WAGE / INCOME GAP [ % ]
64.1¢/ $1
WAGE / INCOME GAP [ $ ]
$9,189
FAMILY INCOME DEFICIT
0.37
INEQUALITY / GINI INDEX
2,102
LABOR FORCE [ PEOPLE ]
57.3%
PERCENT IN LABOR FORCE
4.0%
UNEMPLOYMENT RATE
Buckingham Area Codes
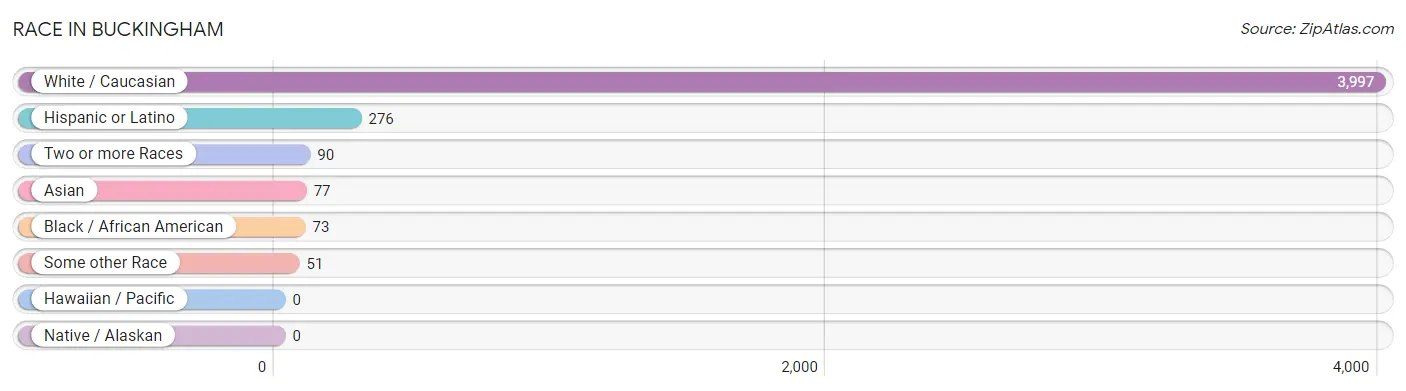
Race in Buckingham
The most populous races in Buckingham are White / Caucasian (3,997 | 93.2%), Hispanic or Latino (276 | 6.4%), and Two or more Races (90 | 2.1%).
| Race | # Population | % Population |
| Asian | 77 | 1.8% |
| Black / African American | 73 | 1.7% |
| Hawaiian / Pacific | 0 | 0.0% |
| Hispanic or Latino | 276 | 6.4% |
| Native / Alaskan | 0 | 0.0% |
| White / Caucasian | 3,997 | 93.2% |
| Two or more Races | 90 | 2.1% |
| Some other Race | 51 | 1.2% |
| Total | 4,288 | 100.0% |
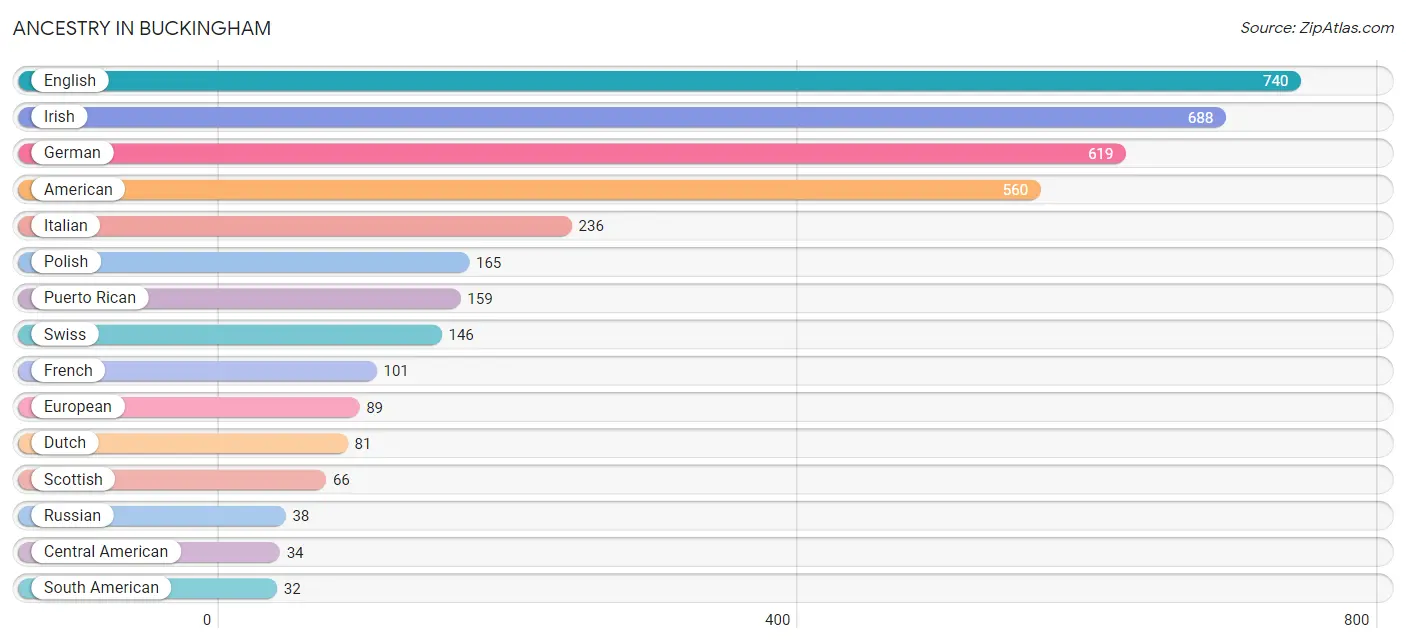
Ancestry in Buckingham
The most populous ancestries reported in Buckingham are English (740 | 17.3%), Irish (688 | 16.0%), German (619 | 14.4%), American (560 | 13.1%), and Italian (236 | 5.5%), together accounting for 66.3% of all Buckingham residents.
| Ancestry | # Population | % Population |
| African | 7 | 0.2% |
| American | 560 | 13.1% |
| Argentinean | 3 | 0.1% |
| British | 8 | 0.2% |
| Burmese | 11 | 0.3% |
| Canadian | 12 | 0.3% |
| Celtic | 9 | 0.2% |
| Central American | 34 | 0.8% |
| Cuban | 8 | 0.2% |
| Czech | 4 | 0.1% |
| Danish | 1 | 0.0% |
| Dutch | 81 | 1.9% |
| English | 740 | 17.3% |
| European | 89 | 2.1% |
| Filipino | 13 | 0.3% |
| French | 101 | 2.4% |
| French Canadian | 17 | 0.4% |
| German | 619 | 14.4% |
| Guatemalan | 9 | 0.2% |
| Honduran | 25 | 0.6% |
| Indian (Asian) | 16 | 0.4% |
| Irish | 688 | 16.0% |
| Italian | 236 | 5.5% |
| Jamaican | 24 | 0.6% |
| Korean | 29 | 0.7% |
| Mexican | 15 | 0.4% |
| Northern European | 17 | 0.4% |
| Norwegian | 18 | 0.4% |
| Peruvian | 29 | 0.7% |
| Polish | 165 | 3.8% |
| Puerto Rican | 159 | 3.7% |
| Russian | 38 | 0.9% |
| Scandinavian | 13 | 0.3% |
| Scotch-Irish | 24 | 0.6% |
| Scottish | 66 | 1.5% |
| South American | 32 | 0.7% |
| Spanish | 28 | 0.6% |
| Sri Lankan | 30 | 0.7% |
| Subsaharan African | 7 | 0.2% |
| Swiss | 146 | 3.4% |
| Ukrainian | 8 | 0.2% |
| Welsh | 16 | 0.4% | View All 42 Rows |
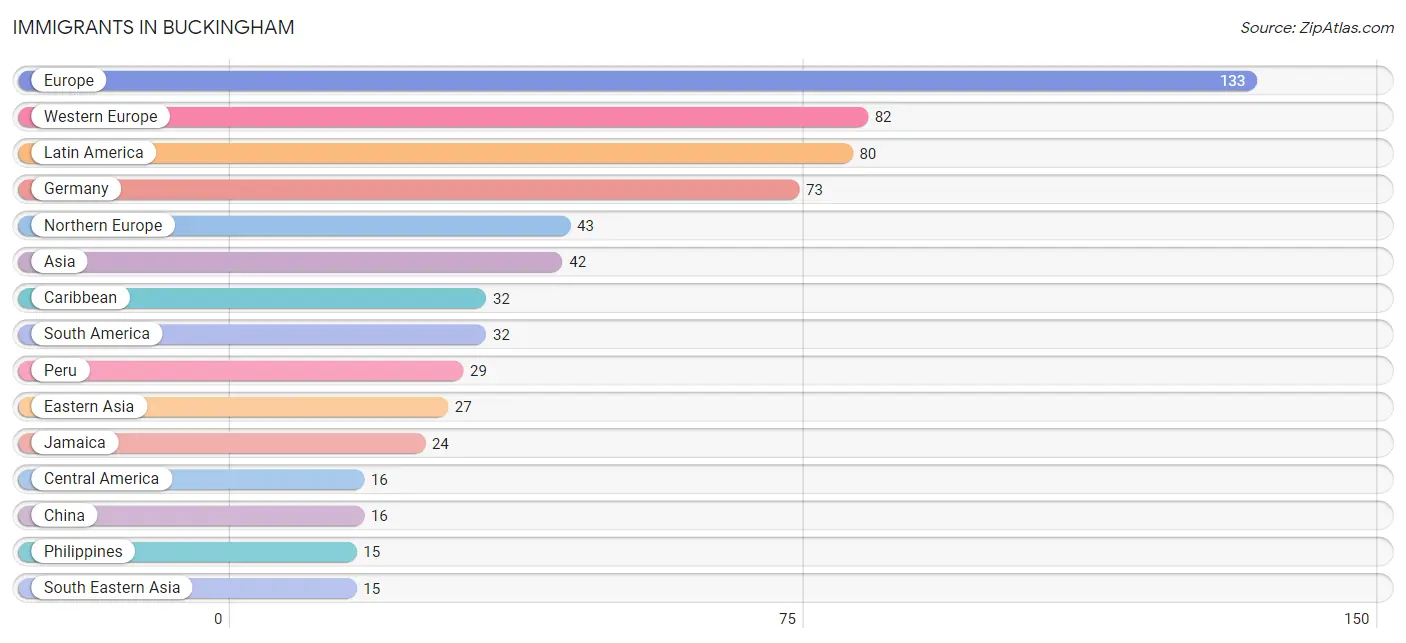
Immigrants in Buckingham
The most numerous immigrant groups reported in Buckingham came from Europe (133 | 3.1%), Western Europe (82 | 1.9%), Latin America (80 | 1.9%), Germany (73 | 1.7%), and Northern Europe (43 | 1.0%), together accounting for 9.6% of all Buckingham residents.
| Immigration Origin | # Population | % Population |
| Africa | 7 | 0.2% |
| Argentina | 3 | 0.1% |
| Asia | 42 | 1.0% |
| Canada | 10 | 0.2% |
| Caribbean | 32 | 0.7% |
| Central America | 16 | 0.4% |
| China | 16 | 0.4% |
| Cuba | 8 | 0.2% |
| Eastern Asia | 27 | 0.6% |
| Eastern Europe | 8 | 0.2% |
| Europe | 133 | 3.1% |
| Germany | 73 | 1.7% |
| Guatemala | 9 | 0.2% |
| Honduras | 6 | 0.1% |
| Jamaica | 24 | 0.6% |
| Korea | 11 | 0.3% |
| Latin America | 80 | 1.9% |
| Mexico | 1 | 0.0% |
| Netherlands | 9 | 0.2% |
| Northern Europe | 43 | 1.0% |
| Peru | 29 | 0.7% |
| Philippines | 15 | 0.4% |
| Poland | 8 | 0.2% |
| South Africa | 7 | 0.2% |
| South America | 32 | 0.7% |
| South Eastern Asia | 15 | 0.4% |
| Western Europe | 82 | 1.9% | View All 27 Rows |
Sex and Age in Buckingham
Sex and Age in Buckingham
The most populous age groups in Buckingham are 60 to 64 Years (211 | 10.9%) for men and 55 to 59 Years (230 | 9.8%) for women.
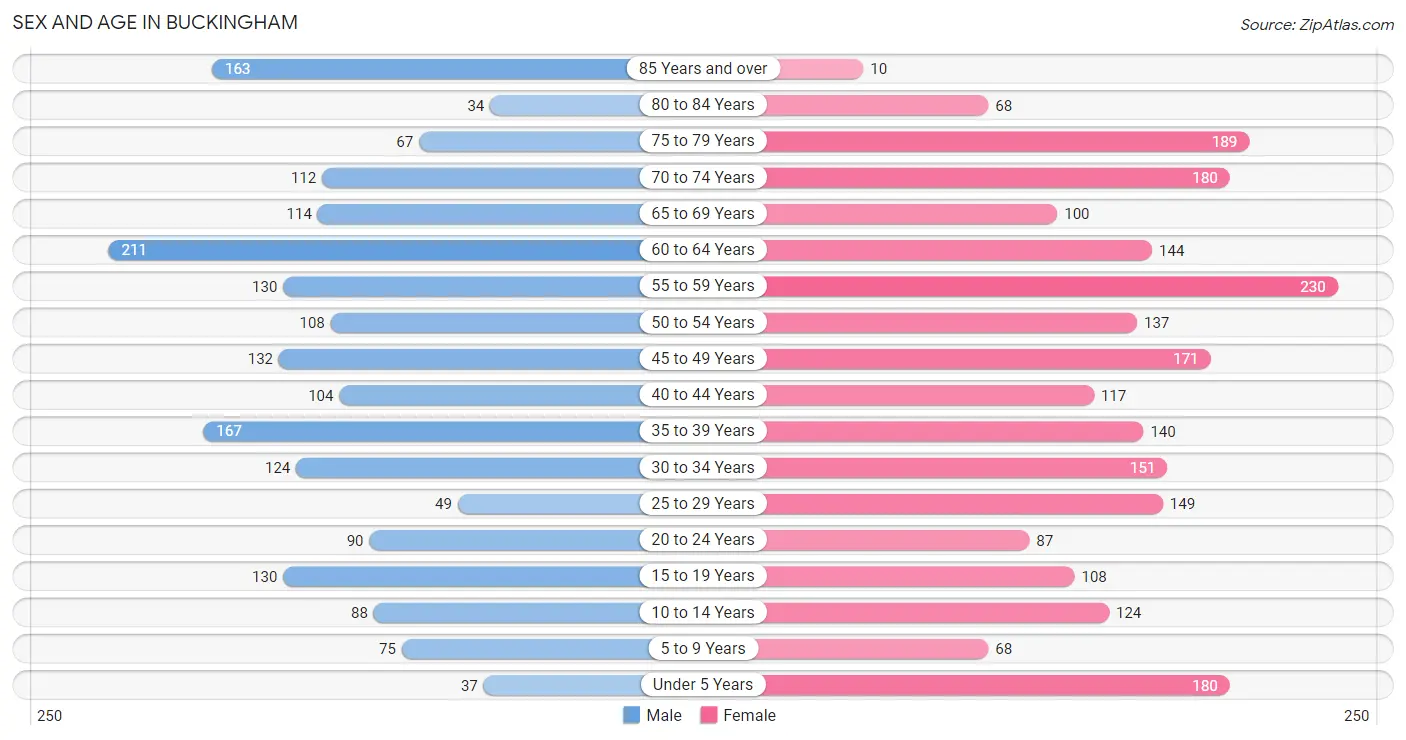
| Age Bracket | Male | Female |
| Under 5 Years | 37 (1.9%) | 180 (7.6%) |
| 5 to 9 Years | 75 (3.9%) | 68 (2.9%) |
| 10 to 14 Years | 88 (4.5%) | 124 (5.3%) |
| 15 to 19 Years | 130 (6.7%) | 108 (4.6%) |
| 20 to 24 Years | 90 (4.6%) | 87 (3.7%) |
| 25 to 29 Years | 49 (2.5%) | 149 (6.3%) |
| 30 to 34 Years | 124 (6.4%) | 151 (6.4%) |
| 35 to 39 Years | 167 (8.6%) | 140 (5.9%) |
| 40 to 44 Years | 104 (5.4%) | 117 (5.0%) |
| 45 to 49 Years | 132 (6.8%) | 171 (7.3%) |
| 50 to 54 Years | 108 (5.6%) | 137 (5.8%) |
| 55 to 59 Years | 130 (6.7%) | 230 (9.8%) |
| 60 to 64 Years | 211 (10.9%) | 144 (6.1%) |
| 65 to 69 Years | 114 (5.9%) | 100 (4.3%) |
| 70 to 74 Years | 112 (5.8%) | 180 (7.6%) |
| 75 to 79 Years | 67 (3.5%) | 189 (8.0%) |
| 80 to 84 Years | 34 (1.8%) | 68 (2.9%) |
| 85 Years and over | 163 (8.4%) | 10 (0.4%) |
| Total | 1,935 (100.0%) | 2,353 (100.0%) |
Families and Households in Buckingham
Median Family Size in Buckingham
The median family size in Buckingham is 2.87 persons per family, with single male/father families (32 | 2.5%) accounting for the largest median family size of 3.06 persons per family. On the other hand, single female/mother families (102 | 7.9%) represent the smallest median family size with 2.62 persons per family.
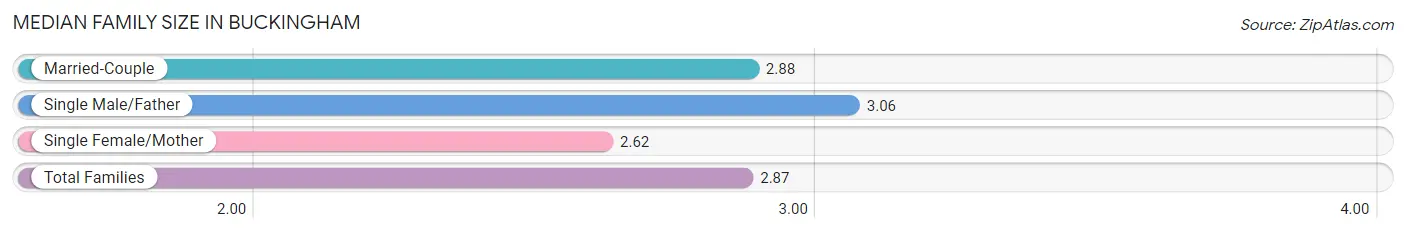
| Family Type | # Families | Family Size |
| Married-Couple | 1,162 (89.7%) | 2.88 |
| Single Male/Father | 32 (2.5%) | 3.06 |
| Single Female/Mother | 102 (7.9%) | 2.62 |
| Total Families | 1,296 (100.0%) | 2.87 |
Median Household Size in Buckingham
The median household size in Buckingham is 2.58 persons per household, with single male/father households (32 | 1.9%) accounting for the largest median household size of 4.19 persons per household. non-family households (353 | 21.4%) represent the smallest median household size with 1.27 persons per household.
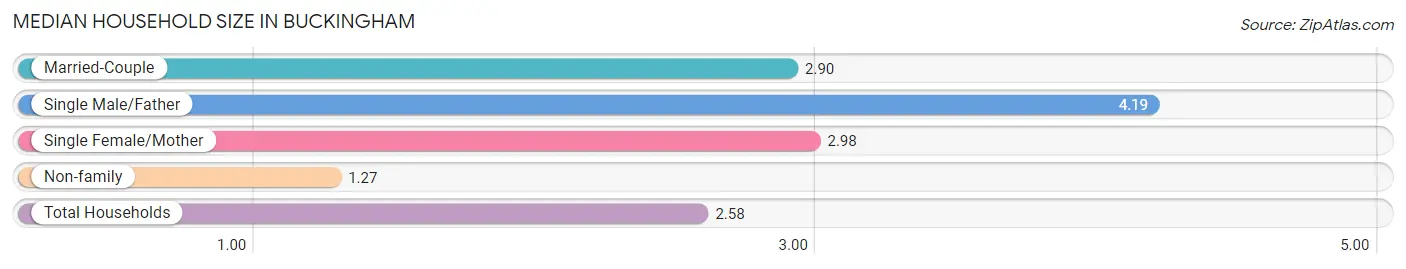
| Household Type | # Households | Household Size |
| Married-Couple | 1,162 (70.5%) | 2.90 |
| Single Male/Father | 32 (1.9%) | 4.19 |
| Single Female/Mother | 102 (6.2%) | 2.98 |
| Non-family | 353 (21.4%) | 1.27 |
| Total Households | 1,649 (100.0%) | 2.58 |
Household Size by Marriage Status in Buckingham
Out of a total of 1,649 households in Buckingham, 1,296 (78.6%) are family households, while 353 (21.4%) are nonfamily households. The most numerous type of family households are 2-person households, comprising 726, and the most common type of nonfamily households are 1-person households, comprising 262.

| Household Size | Family Households | Nonfamily Households |
| 1-Person Households | - | 262 (15.9%) |
| 2-Person Households | 726 (44.0%) | 91 (5.5%) |
| 3-Person Households | 255 (15.5%) | 0 (0.0%) |
| 4-Person Households | 201 (12.2%) | 0 (0.0%) |
| 5-Person Households | 57 (3.5%) | 0 (0.0%) |
| 6-Person Households | 40 (2.4%) | 0 (0.0%) |
| 7+ Person Households | 17 (1.0%) | 0 (0.0%) |
| Total | 1,296 (78.6%) | 353 (21.4%) |
Female Fertility in Buckingham
Fertility by Age in Buckingham
Average fertility rate in Buckingham is 105.0 births per 1,000 women. Women in the age bracket of 20 to 34 years have the highest fertility rate with 132.0 births per 1,000 women. Women in the age bracket of 20 to 34 years acount for 52.0% of all women with births.
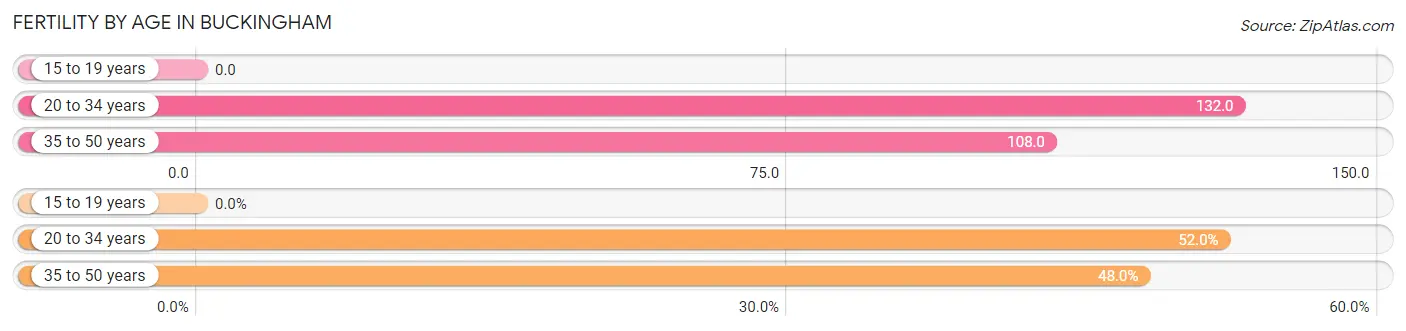
| Age Bracket | Women with Births | Births / 1,000 Women |
| 15 to 19 years | 0 (0.0%) | 0.0 |
| 20 to 34 years | 51 (52.0%) | 132.0 |
| 35 to 50 years | 47 (48.0%) | 108.0 |
| Total | 98 (100.0%) | 105.0 |
Fertility by Age by Marriage Status in Buckingham
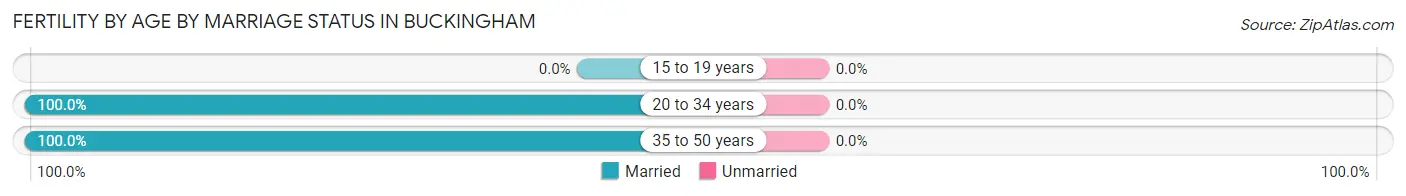
| Age Bracket | Married | Unmarried |
| 15 to 19 years | 0 (0.0%) | 0 (0.0%) |
| 20 to 34 years | 51 (100.0%) | 0 (0.0%) |
| 35 to 50 years | 47 (100.0%) | 0 (0.0%) |
| Total | 98 (100.0%) | 0 (0.0%) |
Fertility by Education in Buckingham
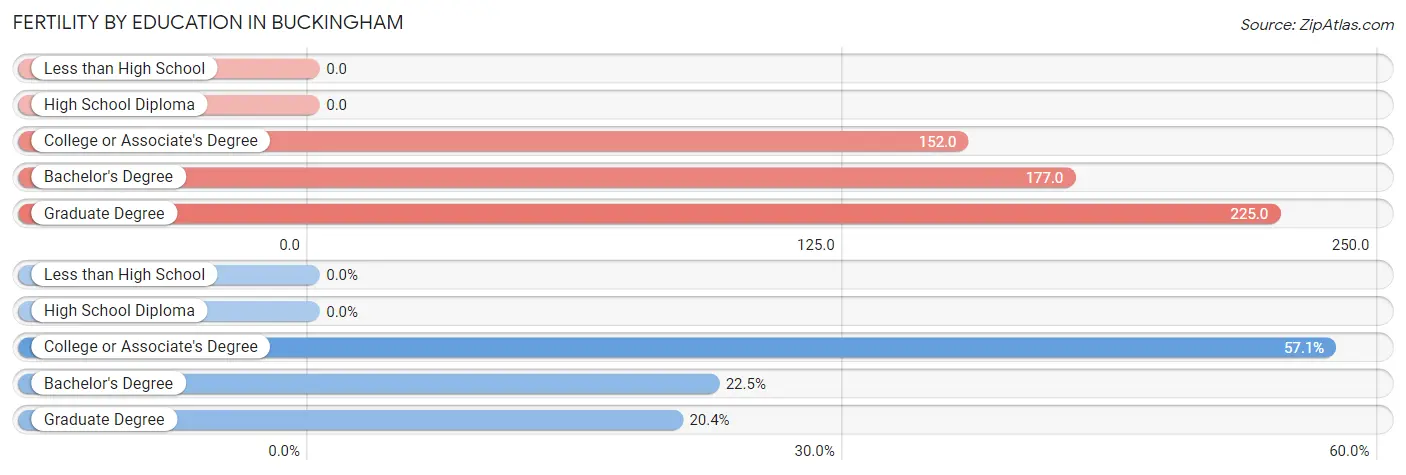
| Educational Attainment | Women with Births | Births / 1,000 Women |
| Less than High School | 0 (0.0%) | 0.0 |
| High School Diploma | 0 (0.0%) | 0.0 |
| College or Associate's Degree | 56 (57.1%) | 152.0 |
| Bachelor's Degree | 22 (22.5%) | 177.0 |
| Graduate Degree | 20 (20.4%) | 225.0 |
| Total | 98 (100.0%) | 105.0 |
Fertility by Education by Marriage Status in Buckingham
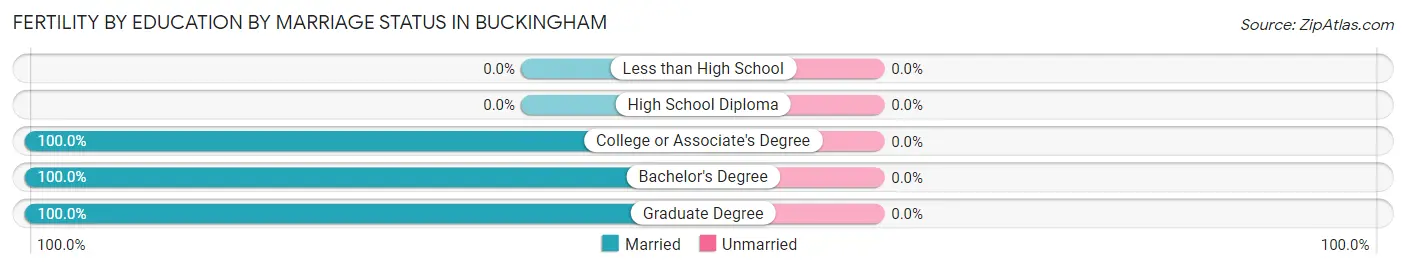
| Educational Attainment | Married | Unmarried |
| Less than High School | 0 (0.0%) | 0 (0.0%) |
| High School Diploma | 0 (0.0%) | 0 (0.0%) |
| College or Associate's Degree | 56 (100.0%) | 0 (0.0%) |
| Bachelor's Degree | 22 (100.0%) | 0 (0.0%) |
| Graduate Degree | 20 (100.0%) | 0 (0.0%) |
| Total | 98 (100.0%) | 0 (0.0%) |
Income in Buckingham
Income Overview in Buckingham
Per Capita Income in Buckingham is $41,145, while median incomes of families and households are $109,817 and $103,563 respectively.
| Characteristic | Number | Measure |
| Per Capita Income | 4,288 | $41,145 |
| Median Family Income | 1,296 | $109,817 |
| Mean Family Income | 1,296 | $114,774 |
| Median Household Income | 1,649 | $103,563 |
| Mean Household Income | 1,649 | $106,087 |
| Income Deficit | 1,296 | $9,189 |
| Wage / Income Gap (%) | 4,288 | 35.91% |
| Wage / Income Gap ($) | 4,288 | 64.09¢ per $1 |
| Gini / Inequality Index | 4,288 | 0.37 |
Earnings by Sex in Buckingham
Average Earnings in Buckingham are $47,015, $55,799 for men and $35,761 for women, a difference of 35.9%.
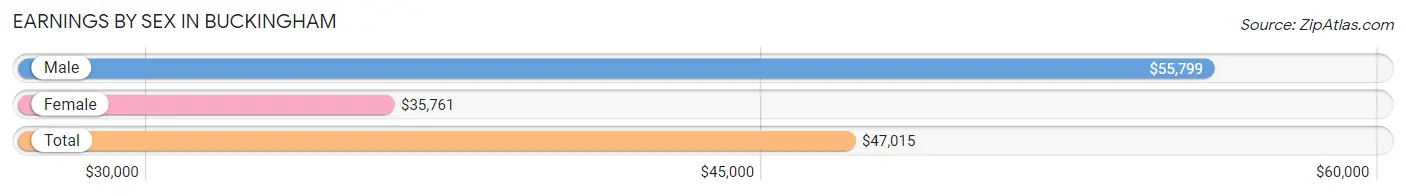
| Sex | Number | Average Earnings |
| Male | 1,067 (48.6%) | $55,799 |
| Female | 1,126 (51.3%) | $35,761 |
| Total | 2,193 (100.0%) | $47,015 |
Earnings by Sex by Income Bracket in Buckingham
The most common earnings brackets in Buckingham are $100,000+ for men (227 | 21.3%) and $75,000 to $99,999 for women (136 | 12.1%).
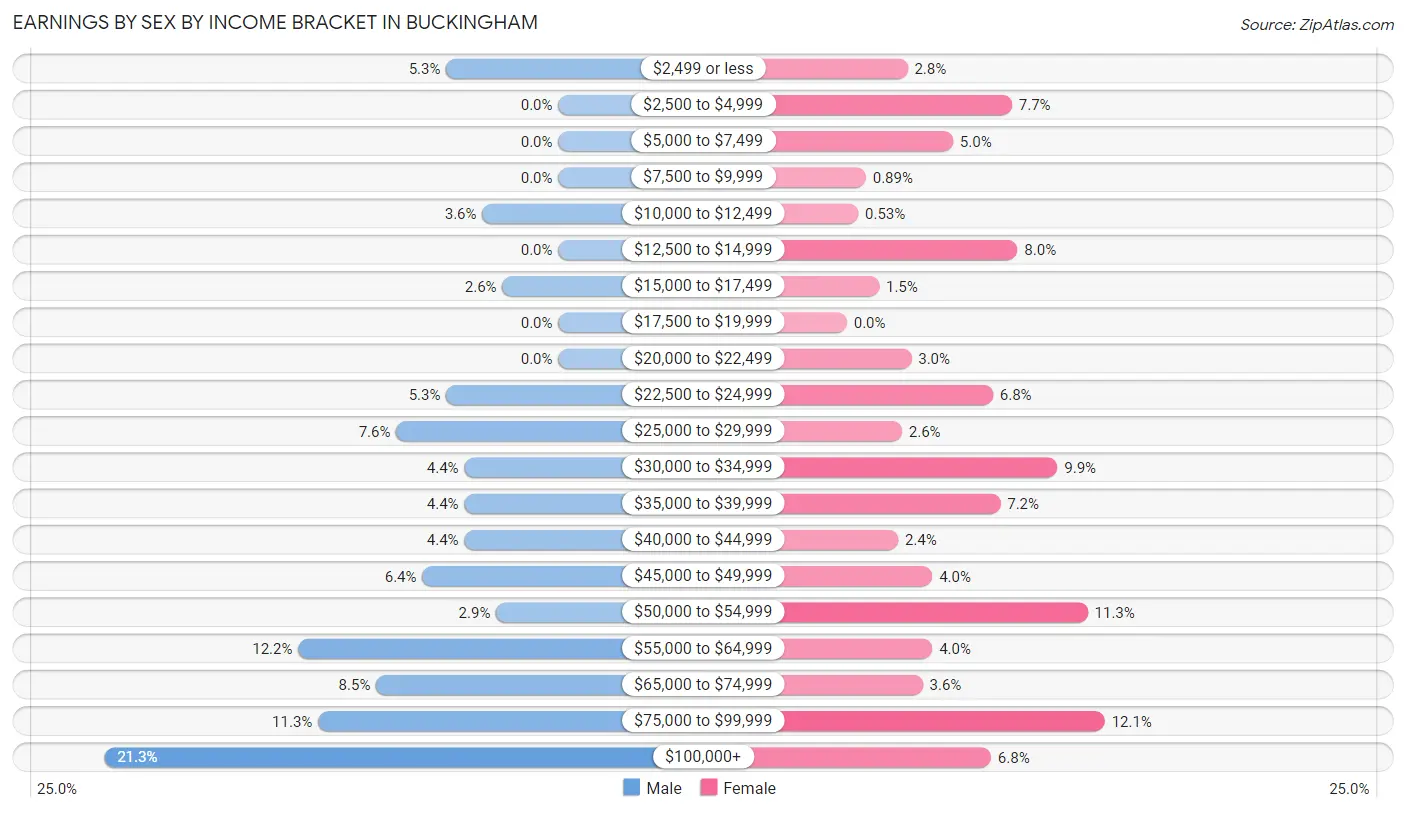
| Income | Male | Female |
| $2,499 or less | 56 (5.2%) | 32 (2.8%) |
| $2,500 to $4,999 | 0 (0.0%) | 87 (7.7%) |
| $5,000 to $7,499 | 0 (0.0%) | 56 (5.0%) |
| $7,500 to $9,999 | 0 (0.0%) | 10 (0.9%) |
| $10,000 to $12,499 | 38 (3.6%) | 6 (0.5%) |
| $12,500 to $14,999 | 0 (0.0%) | 90 (8.0%) |
| $15,000 to $17,499 | 28 (2.6%) | 17 (1.5%) |
| $17,500 to $19,999 | 0 (0.0%) | 0 (0.0%) |
| $20,000 to $22,499 | 0 (0.0%) | 34 (3.0%) |
| $22,500 to $24,999 | 56 (5.2%) | 77 (6.8%) |
| $25,000 to $29,999 | 81 (7.6%) | 29 (2.6%) |
| $30,000 to $34,999 | 47 (4.4%) | 111 (9.9%) |
| $35,000 to $39,999 | 47 (4.4%) | 81 (7.2%) |
| $40,000 to $44,999 | 47 (4.4%) | 27 (2.4%) |
| $45,000 to $49,999 | 68 (6.4%) | 45 (4.0%) |
| $50,000 to $54,999 | 31 (2.9%) | 127 (11.3%) |
| $55,000 to $64,999 | 130 (12.2%) | 45 (4.0%) |
| $65,000 to $74,999 | 91 (8.5%) | 40 (3.5%) |
| $75,000 to $99,999 | 120 (11.3%) | 136 (12.1%) |
| $100,000+ | 227 (21.3%) | 76 (6.8%) |
| Total | 1,067 (100.0%) | 1,126 (100.0%) |
Earnings by Sex by Educational Attainment in Buckingham
Average earnings in Buckingham are $57,454 for men and $38,500 for women, a difference of 33.0%. Men with an educational attainment of bachelor's degree enjoy the highest average annual earnings of $107,841, while those with high school diploma education earn the least with $51,094. Women with an educational attainment of graduate degree earn the most with the average annual earnings of $77,898, while those with less than high school education have the smallest earnings of $24,156.
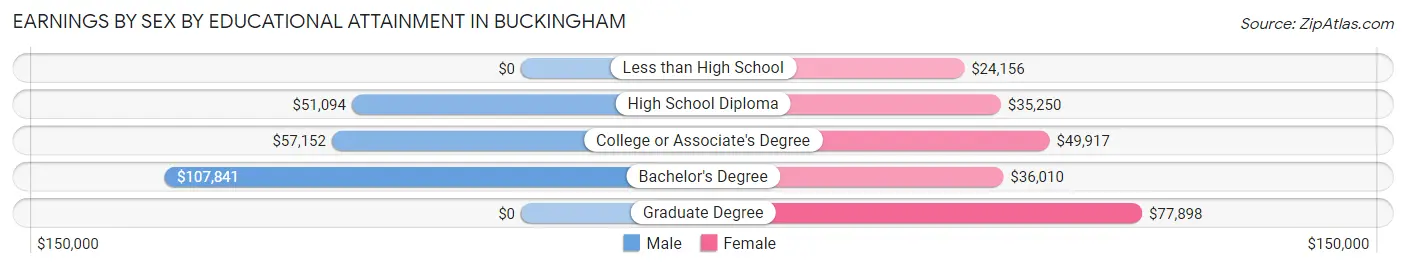
| Educational Attainment | Male Income | Female Income |
| Less than High School | - | - |
| High School Diploma | $51,094 | $35,250 |
| College or Associate's Degree | $57,152 | $49,917 |
| Bachelor's Degree | $107,841 | $36,010 |
| Graduate Degree | - | - |
| Total | $57,454 | $38,500 |
Family Income in Buckingham
Family Income Brackets in Buckingham
According to the Buckingham family income data, there are 465 families falling into the $100,000 to $149,999 income range, which is the most common income bracket and makes up 35.9% of all families. Conversely, the $15,000 to $24,999 income bracket is the least frequent group with only 17 families (1.3%) belonging to this category.
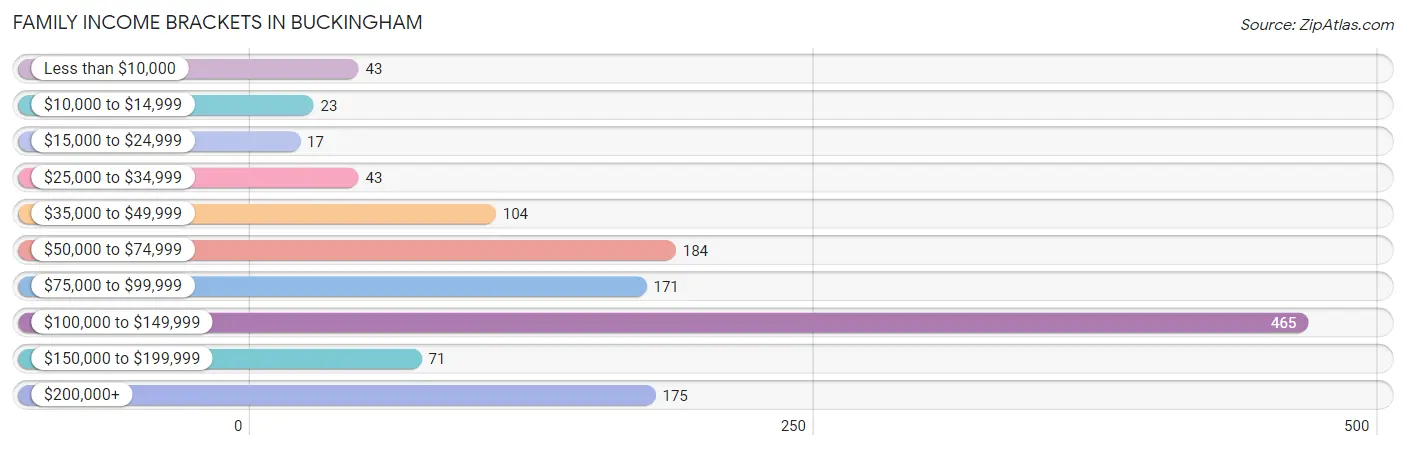
| Income Bracket | # Families | % Families |
| Less than $10,000 | 43 | 3.3% |
| $10,000 to $14,999 | 23 | 1.8% |
| $15,000 to $24,999 | 17 | 1.3% |
| $25,000 to $34,999 | 43 | 3.3% |
| $35,000 to $49,999 | 104 | 8.0% |
| $50,000 to $74,999 | 184 | 14.2% |
| $75,000 to $99,999 | 171 | 13.2% |
| $100,000 to $149,999 | 465 | 35.9% |
| $150,000 to $199,999 | 71 | 5.5% |
| $200,000+ | 175 | 13.5% |
Family Income by Famaliy Size in Buckingham
4-person families (154 | 11.9%) account for the highest median family income in Buckingham with $168,929 per family, while 2-person families (750 | 57.9%) have the highest median income of $43,828 per family member.
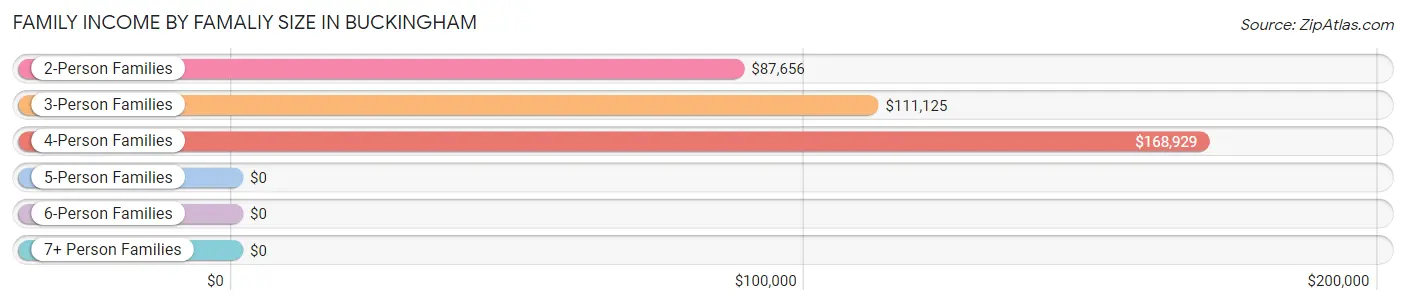
| Income Bracket | # Families | Median Income |
| 2-Person Families | 750 (57.9%) | $87,656 |
| 3-Person Families | 278 (21.4%) | $111,125 |
| 4-Person Families | 154 (11.9%) | $168,929 |
| 5-Person Families | 57 (4.4%) | $0 |
| 6-Person Families | 40 (3.1%) | $0 |
| 7+ Person Families | 17 (1.3%) | $0 |
| Total | 1,296 (100.0%) | $109,817 |
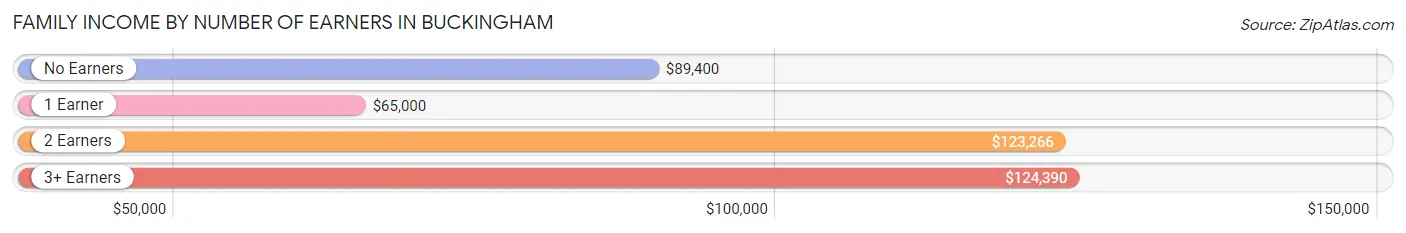
Family Income by Number of Earners in Buckingham
The median family income in Buckingham is $109,817, with families comprising 3+ earners (155) having the highest median family income of $124,390, while families with 1 earner (336) have the lowest median family income of $65,000, accounting for 12.0% and 25.9% of families, respectively.
| Number of Earners | # Families | Median Income |
| No Earners | 346 (26.7%) | $89,400 |
| 1 Earner | 336 (25.9%) | $65,000 |
| 2 Earners | 459 (35.4%) | $123,266 |
| 3+ Earners | 155 (12.0%) | $124,390 |
| Total | 1,296 (100.0%) | $109,817 |
Household Income in Buckingham
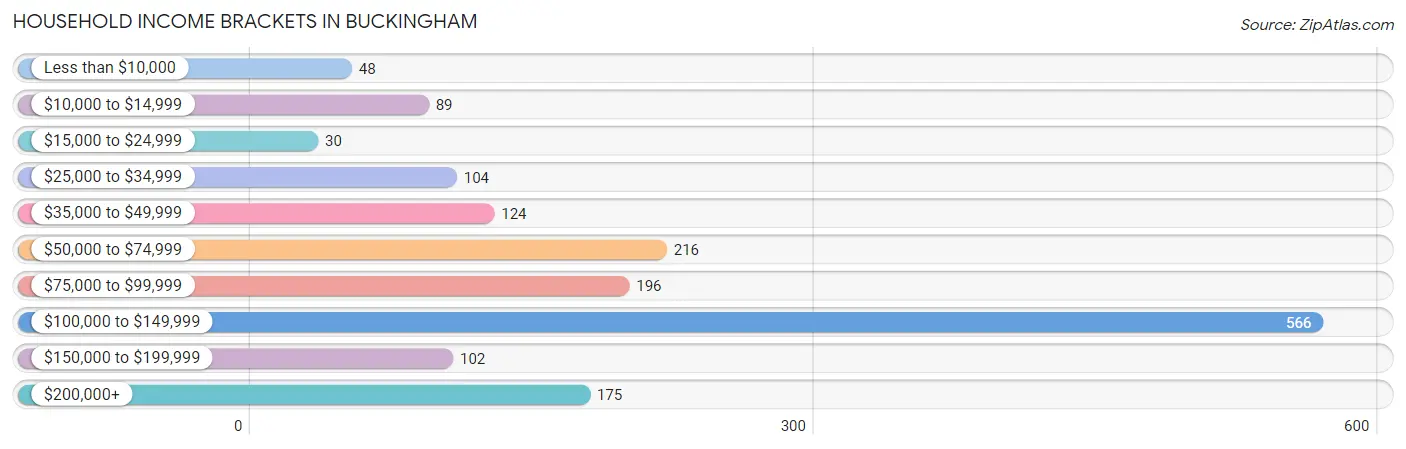
Household Income Brackets in Buckingham
With 566 households falling in the category, the $100,000 to $149,999 income range is the most frequent in Buckingham, accounting for 34.3% of all households. In contrast, only 30 households (1.8%) fall into the $15,000 to $24,999 income bracket, making it the least populous group.
| Income Bracket | # Households | % Households |
| Less than $10,000 | 48 | 2.9% |
| $10,000 to $14,999 | 89 | 5.4% |
| $15,000 to $24,999 | 30 | 1.8% |
| $25,000 to $34,999 | 104 | 6.3% |
| $35,000 to $49,999 | 124 | 7.5% |
| $50,000 to $74,999 | 216 | 13.1% |
| $75,000 to $99,999 | 196 | 11.9% |
| $100,000 to $149,999 | 566 | 34.3% |
| $150,000 to $199,999 | 102 | 6.2% |
| $200,000+ | 175 | 10.6% |
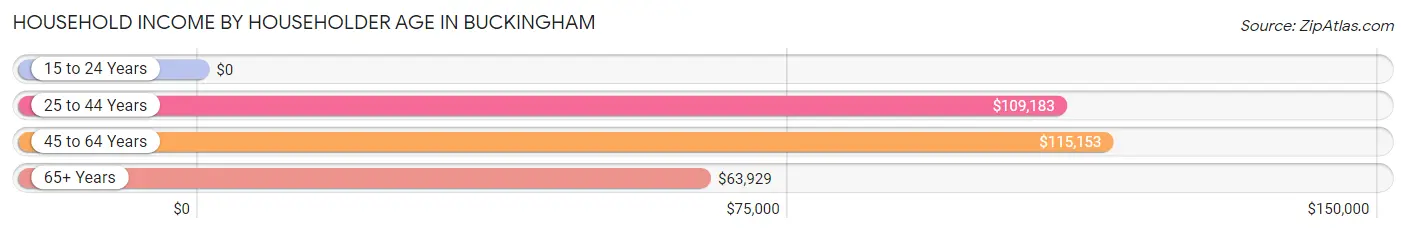
Household Income by Householder Age in Buckingham
The median household income in Buckingham is $103,563, with the highest median household income of $115,153 found in the 45 to 64 years age bracket for the primary householder. A total of 662 households (40.2%) fall into this category.
| Income Bracket | # Households | Median Income |
| 15 to 24 Years | 0 (0.0%) | $0 |
| 25 to 44 Years | 417 (25.3%) | $109,183 |
| 45 to 64 Years | 662 (40.2%) | $115,153 |
| 65+ Years | 570 (34.6%) | $63,929 |
| Total | 1,649 (100.0%) | $103,563 |
Poverty in Buckingham
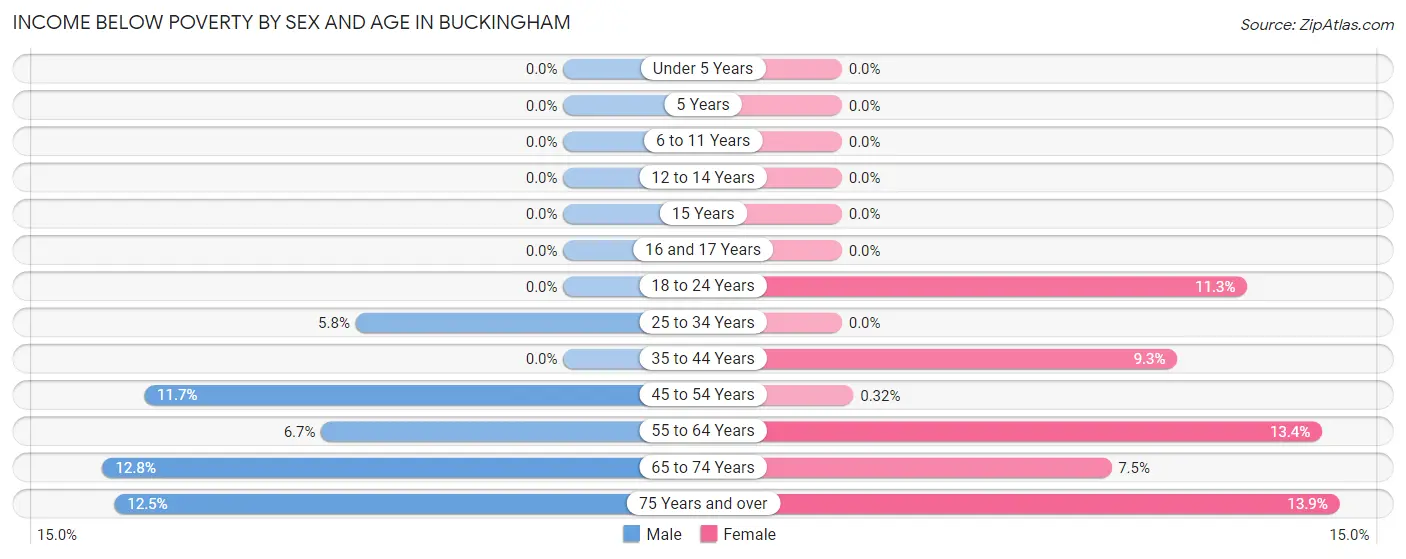
Income Below Poverty by Sex and Age in Buckingham
With 6.4% poverty level for males and 6.3% for females among the residents of Buckingham, 65 to 74 year old males and 75 year old and over females are the most vulnerable to poverty, with 29 males (12.8%) and 37 females (13.9%) in their respective age groups living below the poverty level.
| Age Bracket | Male | Female |
| Under 5 Years | 0 (0.0%) | 0 (0.0%) |
| 5 Years | 0 (0.0%) | 0 (0.0%) |
| 6 to 11 Years | 0 (0.0%) | 0 (0.0%) |
| 12 to 14 Years | 0 (0.0%) | 0 (0.0%) |
| 15 Years | 0 (0.0%) | 0 (0.0%) |
| 16 and 17 Years | 0 (0.0%) | 0 (0.0%) |
| 18 to 24 Years | 0 (0.0%) | 14 (11.3%) |
| 25 to 34 Years | 10 (5.8%) | 0 (0.0%) |
| 35 to 44 Years | 0 (0.0%) | 24 (9.3%) |
| 45 to 54 Years | 28 (11.7%) | 1 (0.3%) |
| 55 to 64 Years | 23 (6.7%) | 50 (13.4%) |
| 65 to 74 Years | 29 (12.8%) | 21 (7.5%) |
| 75 Years and over | 33 (12.5%) | 37 (13.9%) |
| Total | 123 (6.4%) | 147 (6.3%) |
Income Above Poverty by Sex and Age in Buckingham
According to the poverty statistics in Buckingham, males aged under 5 years and females aged under 5 years are the age groups that are most secure financially, with 100.0% of males and 100.0% of females in these age groups living above the poverty line.
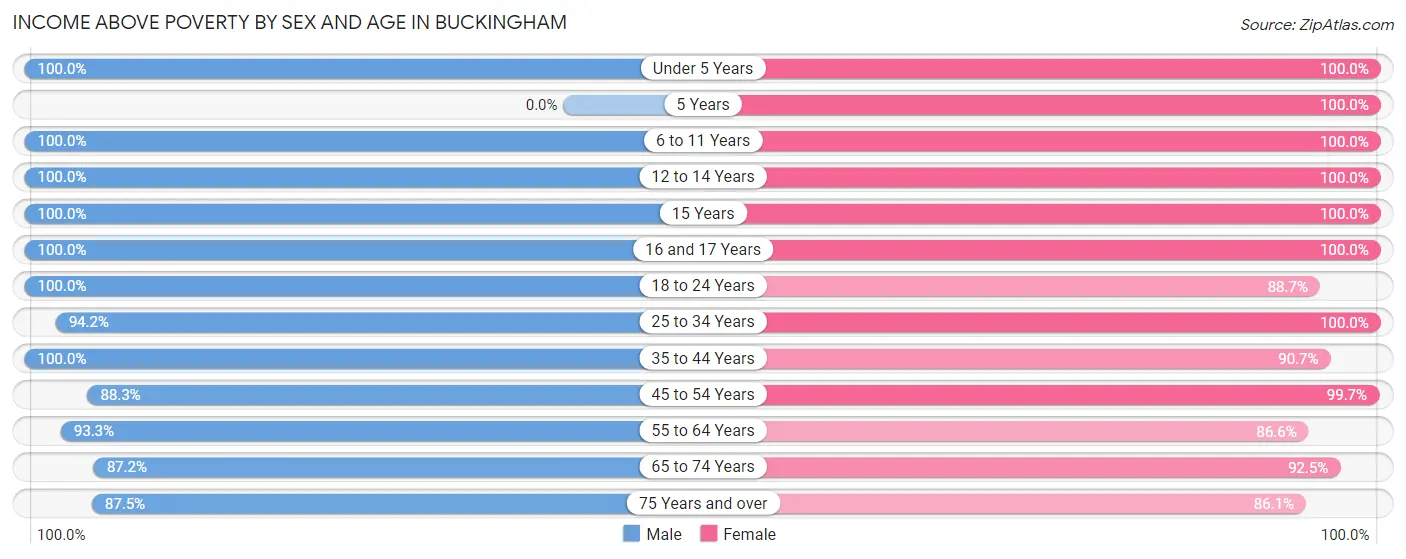
| Age Bracket | Male | Female |
| Under 5 Years | 37 (100.0%) | 180 (100.0%) |
| 5 Years | 0 (0.0%) | 9 (100.0%) |
| 6 to 11 Years | 124 (100.0%) | 62 (100.0%) |
| 12 to 14 Years | 39 (100.0%) | 112 (100.0%) |
| 15 Years | 22 (100.0%) | 26 (100.0%) |
| 16 and 17 Years | 89 (100.0%) | 45 (100.0%) |
| 18 to 24 Years | 109 (100.0%) | 110 (88.7%) |
| 25 to 34 Years | 163 (94.2%) | 300 (100.0%) |
| 35 to 44 Years | 271 (100.0%) | 233 (90.7%) |
| 45 to 54 Years | 212 (88.3%) | 307 (99.7%) |
| 55 to 64 Years | 318 (93.3%) | 324 (86.6%) |
| 65 to 74 Years | 197 (87.2%) | 259 (92.5%) |
| 75 Years and over | 231 (87.5%) | 230 (86.1%) |
| Total | 1,812 (93.6%) | 2,197 (93.7%) |
Income Below Poverty Among Married-Couple Families in Buckingham
The poverty statistics for married-couple families in Buckingham show that 5.7% or 66 of the total 1,162 families live below the poverty line. Families with no children have the highest poverty rate of 7.6%, comprising of 66 families. On the other hand, families with 1 or 2 children have the lowest poverty rate of 0.0%, which includes 0 families.
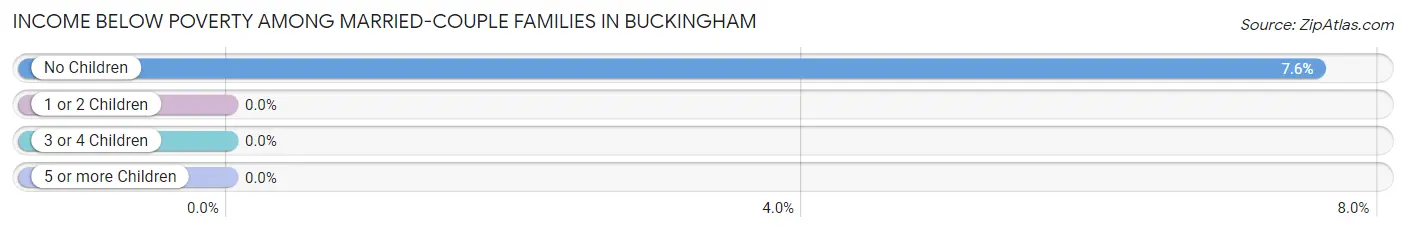
| Children | Above Poverty | Below Poverty |
| No Children | 806 (92.4%) | 66 (7.6%) |
| 1 or 2 Children | 218 (100.0%) | 0 (0.0%) |
| 3 or 4 Children | 55 (100.0%) | 0 (0.0%) |
| 5 or more Children | 17 (100.0%) | 0 (0.0%) |
| Total | 1,096 (94.3%) | 66 (5.7%) |
Income Below Poverty Among Single-Parent Households in Buckingham
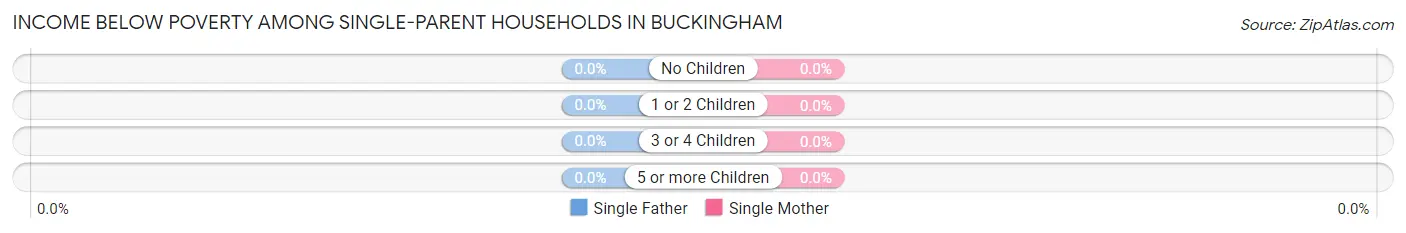
| Children | Single Father | Single Mother |
| No Children | 0 (0.0%) | 0 (0.0%) |
| 1 or 2 Children | 0 (0.0%) | 0 (0.0%) |
| 3 or 4 Children | 0 (0.0%) | 0 (0.0%) |
| 5 or more Children | 0 (0.0%) | 0 (0.0%) |
| Total | 0 (0.0%) | 0 (0.0%) |
Income Below Poverty Among Married-Couple vs Single-Parent Households in Buckingham
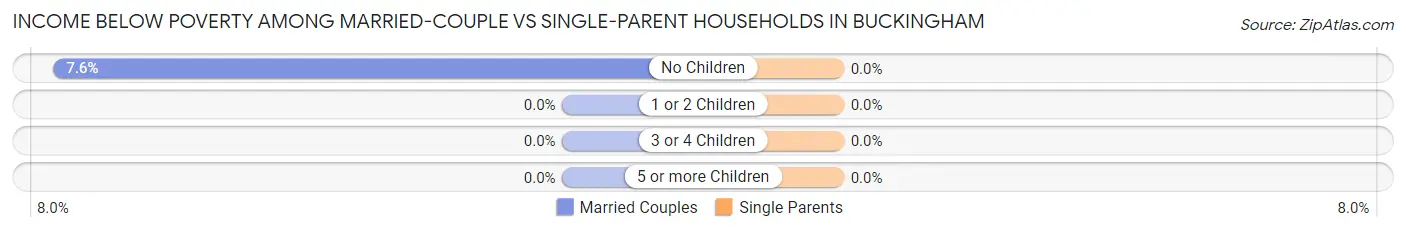
| Children | Married-Couple Families | Single-Parent Households |
| No Children | 66 (7.6%) | 0 (0.0%) |
| 1 or 2 Children | 0 (0.0%) | 0 (0.0%) |
| 3 or 4 Children | 0 (0.0%) | 0 (0.0%) |
| 5 or more Children | 0 (0.0%) | 0 (0.0%) |
| Total | 66 (5.7%) | 0 (0.0%) |
Employment Characteristics in Buckingham
Employment by Class of Employer in Buckingham
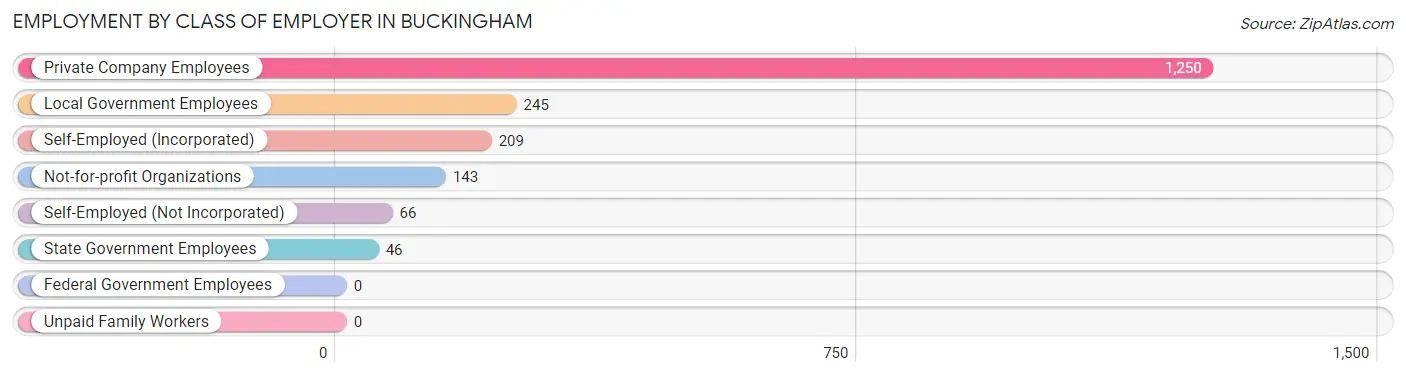
Among the 1,959 employed individuals in Buckingham, private company employees (1,250 | 63.8%), local government employees (245 | 12.5%), and self-employed (incorporated) (209 | 10.7%) make up the most common classes of employment.
| Employer Class | # Employees | % Employees |
| Private Company Employees | 1,250 | 63.8% |
| Self-Employed (Incorporated) | 209 | 10.7% |
| Self-Employed (Not Incorporated) | 66 | 3.4% |
| Not-for-profit Organizations | 143 | 7.3% |
| Local Government Employees | 245 | 12.5% |
| State Government Employees | 46 | 2.4% |
| Federal Government Employees | 0 | 0.0% |
| Unpaid Family Workers | 0 | 0.0% |
| Total | 1,959 | 100.0% |
Employment Status by Age in Buckingham
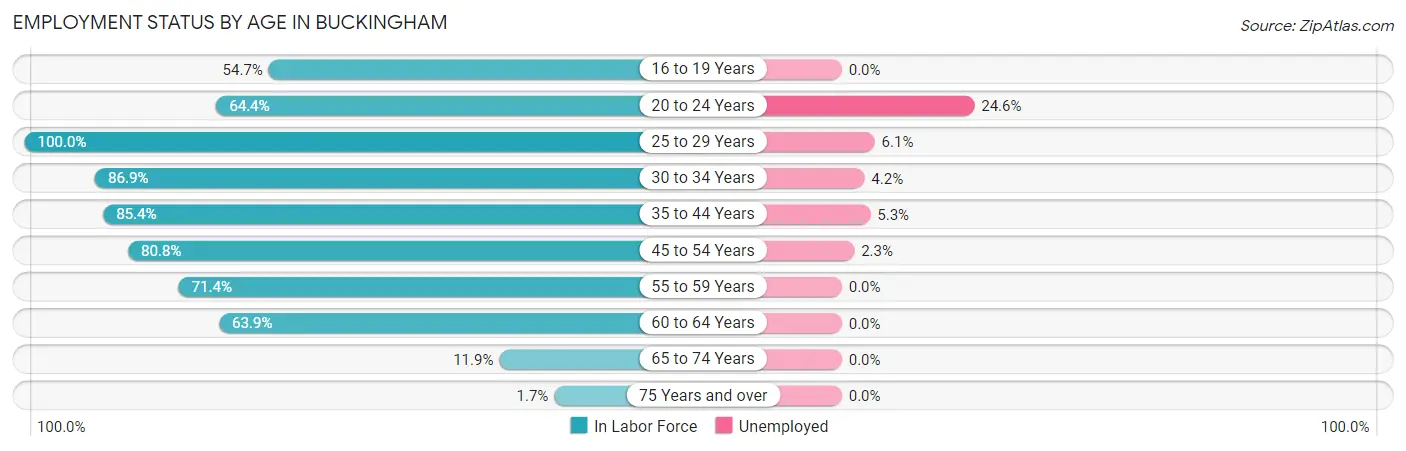
According to the labor force statistics for Buckingham, out of the total population over 16 years of age (3,668), 57.3% or 2,102 individuals are in the labor force, with 4.0% or 84 of them unemployed. The age group with the highest labor force participation rate is 25 to 29 years, with 100.0% or 198 individuals in the labor force. Within the labor force, the 20 to 24 years age range has the highest percentage of unemployed individuals, with 24.6% or 28 of them being unemployed.
| Age Bracket | In Labor Force | Unemployed |
| 16 to 19 Years | 104 (54.7%) | 0 (0.0%) |
| 20 to 24 Years | 114 (64.4%) | 28 (24.6%) |
| 25 to 29 Years | 198 (100.0%) | 12 (6.1%) |
| 30 to 34 Years | 239 (86.9%) | 10 (4.2%) |
| 35 to 44 Years | 451 (85.4%) | 24 (5.3%) |
| 45 to 54 Years | 443 (80.8%) | 10 (2.3%) |
| 55 to 59 Years | 257 (71.4%) | 0 (0.0%) |
| 60 to 64 Years | 227 (63.9%) | 0 (0.0%) |
| 65 to 74 Years | 60 (11.9%) | 0 (0.0%) |
| 75 Years and over | 9 (1.7%) | 0 (0.0%) |
| Total | 2,102 (57.3%) | 84 (4.0%) |
Employment Status by Educational Attainment in Buckingham
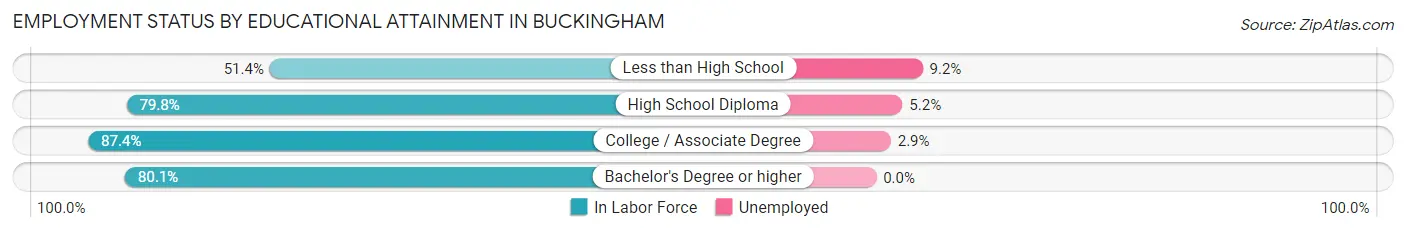
According to labor force statistics for Buckingham, 80.2% of individuals (1,816) out of the total population between 25 and 64 years of age (2,264) are in the labor force, with 3.1% or 56 of them being unemployed. The group with the highest labor force participation rate are those with the educational attainment of college / associate degree, with 87.4% or 768 individuals in the labor force. Within the labor force, individuals with less than high school education have the highest percentage of unemployment, with 9.2% or 10 of them being unemployed.
| Educational Attainment | In Labor Force | Unemployed |
| Less than High School | 109 (51.4%) | 20 (9.2%) |
| High School Diploma | 466 (79.8%) | 30 (5.2%) |
| College / Associate Degree | 768 (87.4%) | 25 (2.9%) |
| Bachelor's Degree or higher | 472 (80.1%) | 0 (0.0%) |
| Total | 1,816 (80.2%) | 70 (3.1%) |
Employment Occupations by Sex in Buckingham
Management, Business, Science and Arts Occupations
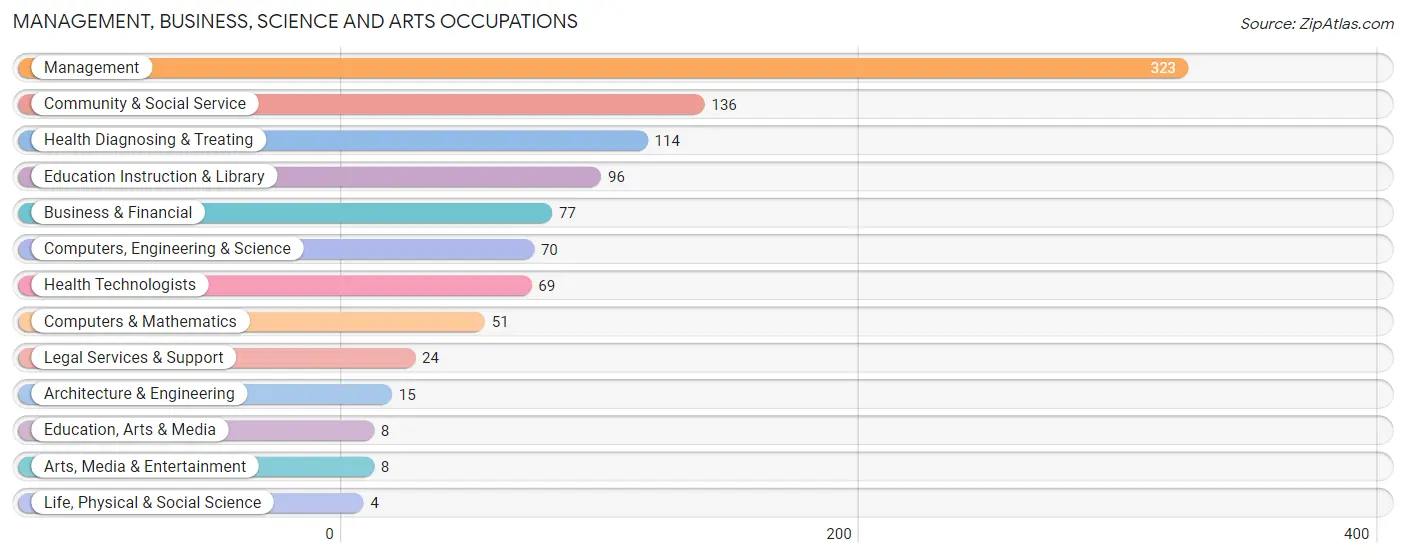
The most common Management, Business, Science and Arts occupations in Buckingham are Management (323 | 16.0%), Community & Social Service (136 | 6.7%), Health Diagnosing & Treating (114 | 5.7%), Education Instruction & Library (96 | 4.8%), and Business & Financial (77 | 3.8%).
Management, Business, Science and Arts Occupations by Sex
Within the Management, Business, Science and Arts occupations in Buckingham, the most male-oriented occupations are Arts, Media & Entertainment (100.0%), Legal Services & Support (75.0%), and Computers & Mathematics (72.6%), while the most female-oriented occupations are Life, Physical & Social Science (100.0%), Education, Arts & Media (100.0%), and Education Instruction & Library (100.0%).
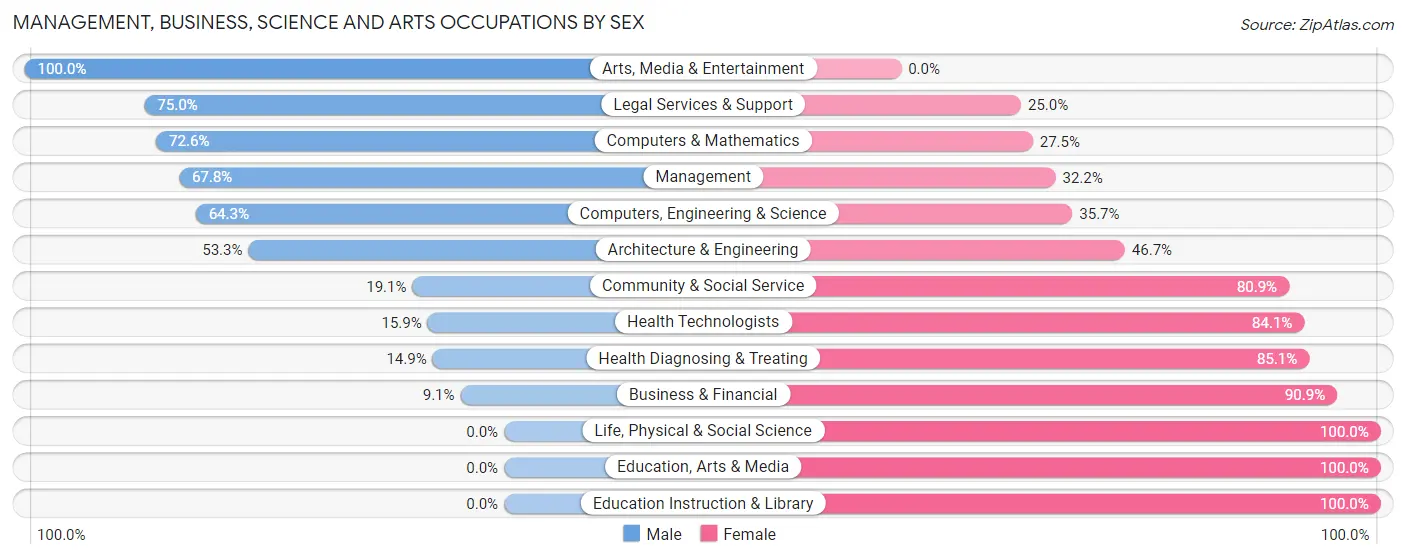
| Occupation | Male | Female |
| Management | 219 (67.8%) | 104 (32.2%) |
| Business & Financial | 7 (9.1%) | 70 (90.9%) |
| Computers, Engineering & Science | 45 (64.3%) | 25 (35.7%) |
| Computers & Mathematics | 37 (72.6%) | 14 (27.5%) |
| Architecture & Engineering | 8 (53.3%) | 7 (46.7%) |
| Life, Physical & Social Science | 0 (0.0%) | 4 (100.0%) |
| Community & Social Service | 26 (19.1%) | 110 (80.9%) |
| Education, Arts & Media | 0 (0.0%) | 8 (100.0%) |
| Legal Services & Support | 18 (75.0%) | 6 (25.0%) |
| Education Instruction & Library | 0 (0.0%) | 96 (100.0%) |
| Arts, Media & Entertainment | 8 (100.0%) | 0 (0.0%) |
| Health Diagnosing & Treating | 17 (14.9%) | 97 (85.1%) |
| Health Technologists | 11 (15.9%) | 58 (84.1%) |
| Total (Category) | 314 (43.6%) | 406 (56.4%) |
| Total (Overall) | 956 (47.4%) | 1,062 (52.6%) |
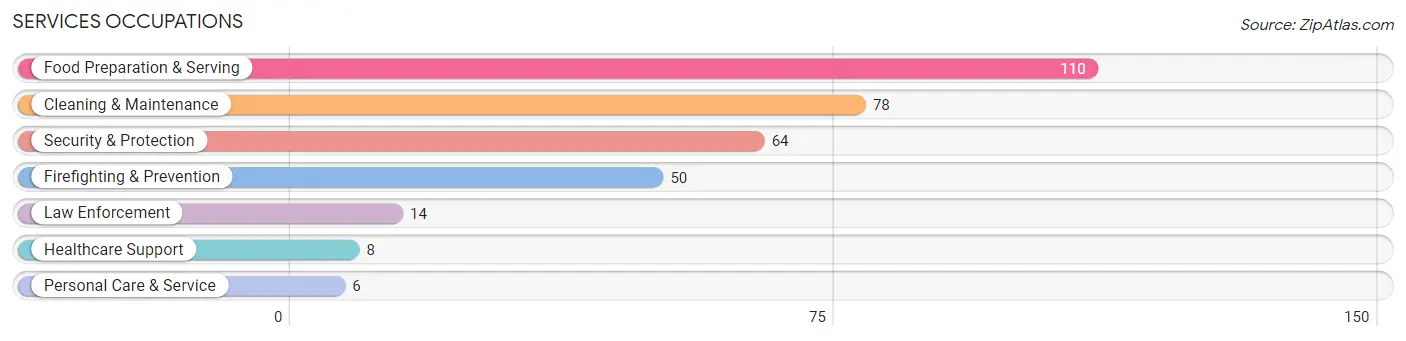
Services Occupations
The most common Services occupations in Buckingham are Food Preparation & Serving (110 | 5.4%), Cleaning & Maintenance (78 | 3.9%), Security & Protection (64 | 3.2%), Firefighting & Prevention (50 | 2.5%), and Law Enforcement (14 | 0.7%).
Services Occupations by Sex
Within the Services occupations in Buckingham, the most male-oriented occupations are Healthcare Support (100.0%), Security & Protection (100.0%), and Firefighting & Prevention (100.0%), while the most female-oriented occupations are Personal Care & Service (100.0%), Food Preparation & Serving (88.2%), and Cleaning & Maintenance (7.7%).
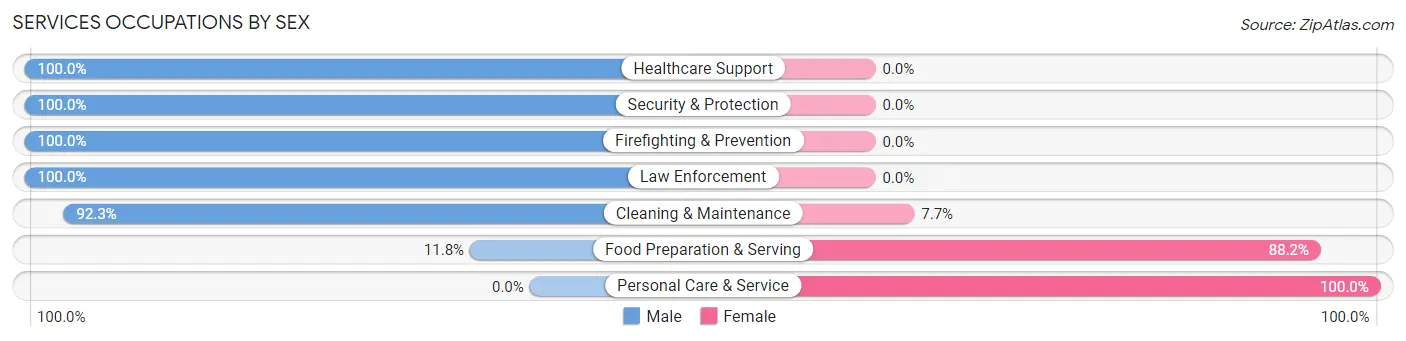
| Occupation | Male | Female |
| Healthcare Support | 8 (100.0%) | 0 (0.0%) |
| Security & Protection | 64 (100.0%) | 0 (0.0%) |
| Firefighting & Prevention | 50 (100.0%) | 0 (0.0%) |
| Law Enforcement | 14 (100.0%) | 0 (0.0%) |
| Food Preparation & Serving | 13 (11.8%) | 97 (88.2%) |
| Cleaning & Maintenance | 72 (92.3%) | 6 (7.7%) |
| Personal Care & Service | 0 (0.0%) | 6 (100.0%) |
| Total (Category) | 157 (59.0%) | 109 (41.0%) |
| Total (Overall) | 956 (47.4%) | 1,062 (52.6%) |
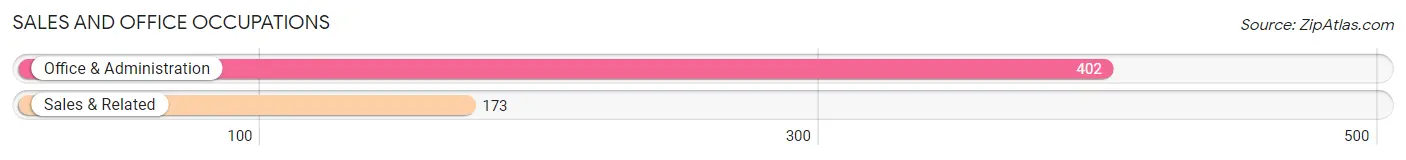
Sales and Office Occupations
The most common Sales and Office occupations in Buckingham are Office & Administration (402 | 19.9%), and Sales & Related (173 | 8.6%).
Sales and Office Occupations by Sex
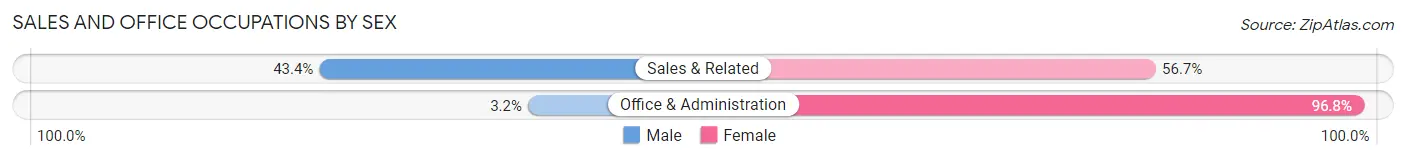
| Occupation | Male | Female |
| Sales & Related | 75 (43.3%) | 98 (56.7%) |
| Office & Administration | 13 (3.2%) | 389 (96.8%) |
| Total (Category) | 88 (15.3%) | 487 (84.7%) |
| Total (Overall) | 956 (47.4%) | 1,062 (52.6%) |
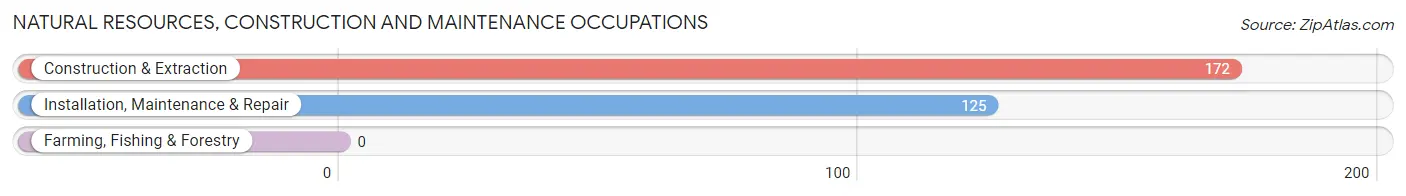
Natural Resources, Construction and Maintenance Occupations
The most common Natural Resources, Construction and Maintenance occupations in Buckingham are Construction & Extraction (172 | 8.5%), and Installation, Maintenance & Repair (125 | 6.2%).
Natural Resources, Construction and Maintenance Occupations by Sex
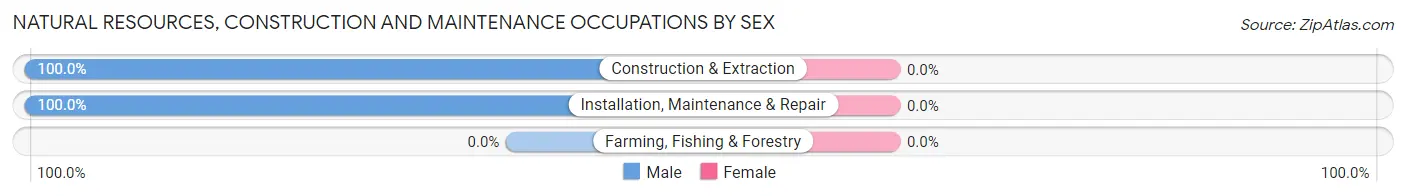
| Occupation | Male | Female |
| Farming, Fishing & Forestry | 0 (0.0%) | 0 (0.0%) |
| Construction & Extraction | 172 (100.0%) | 0 (0.0%) |
| Installation, Maintenance & Repair | 125 (100.0%) | 0 (0.0%) |
| Total (Category) | 297 (100.0%) | 0 (0.0%) |
| Total (Overall) | 956 (47.4%) | 1,062 (52.6%) |
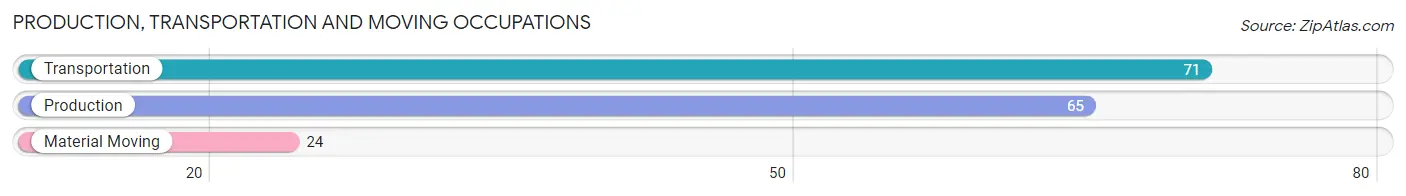
Production, Transportation and Moving Occupations
The most common Production, Transportation and Moving occupations in Buckingham are Transportation (71 | 3.5%), Production (65 | 3.2%), and Material Moving (24 | 1.2%).
Production, Transportation and Moving Occupations by Sex
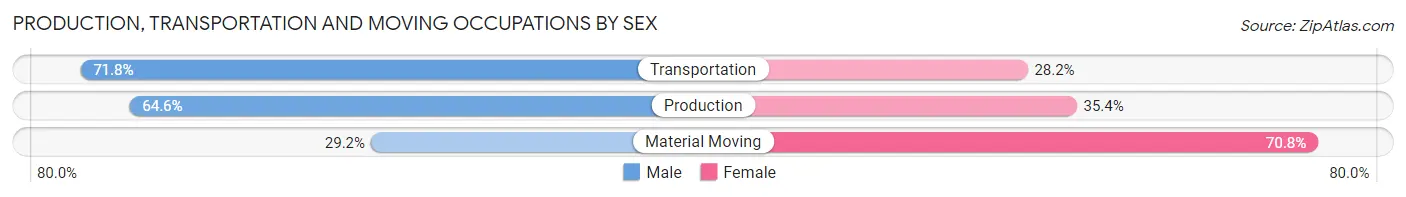
| Occupation | Male | Female |
| Production | 42 (64.6%) | 23 (35.4%) |
| Transportation | 51 (71.8%) | 20 (28.2%) |
| Material Moving | 7 (29.2%) | 17 (70.8%) |
| Total (Category) | 100 (62.5%) | 60 (37.5%) |
| Total (Overall) | 956 (47.4%) | 1,062 (52.6%) |
Employment Industries by Sex in Buckingham
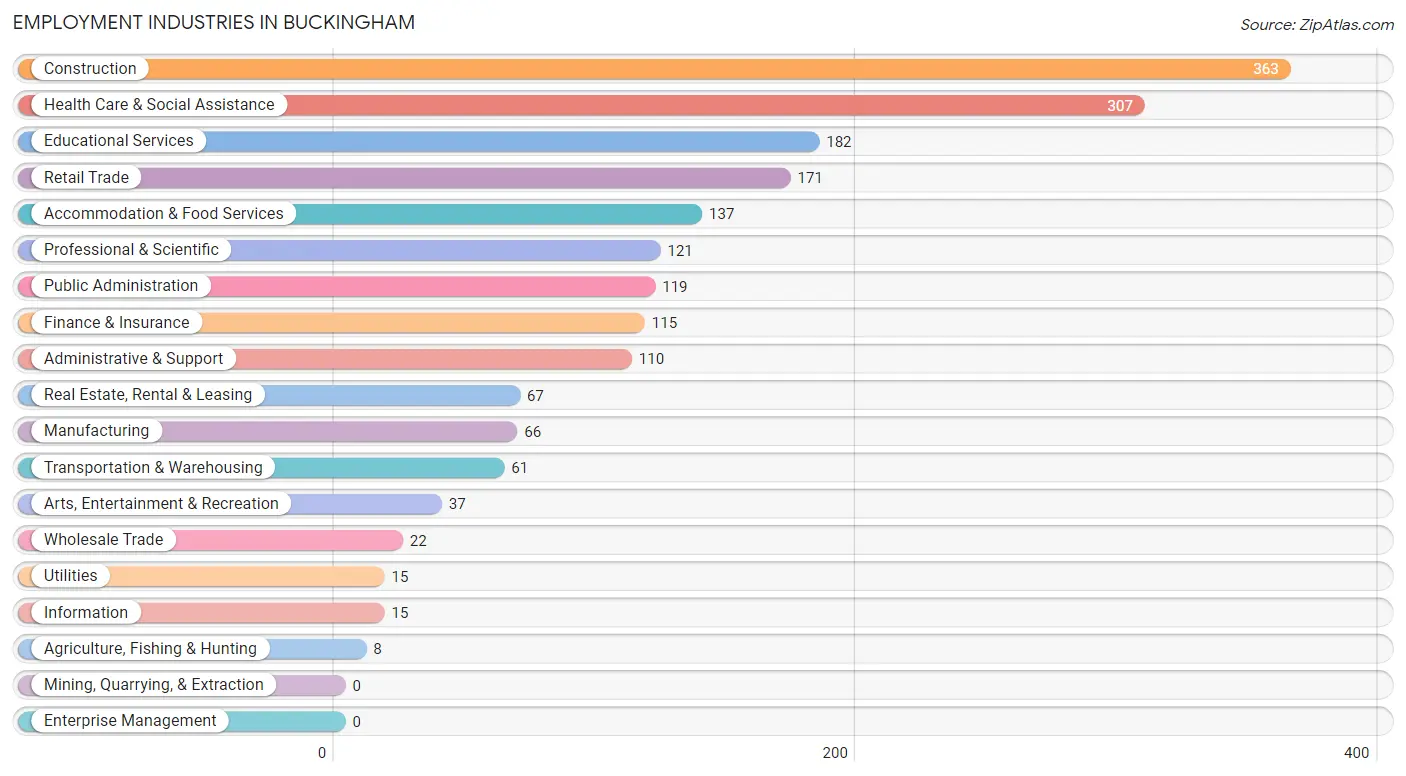
Employment Industries in Buckingham
The major employment industries in Buckingham include Construction (363 | 18.0%), Health Care & Social Assistance (307 | 15.2%), Educational Services (182 | 9.0%), Retail Trade (171 | 8.5%), and Accommodation & Food Services (137 | 6.8%).
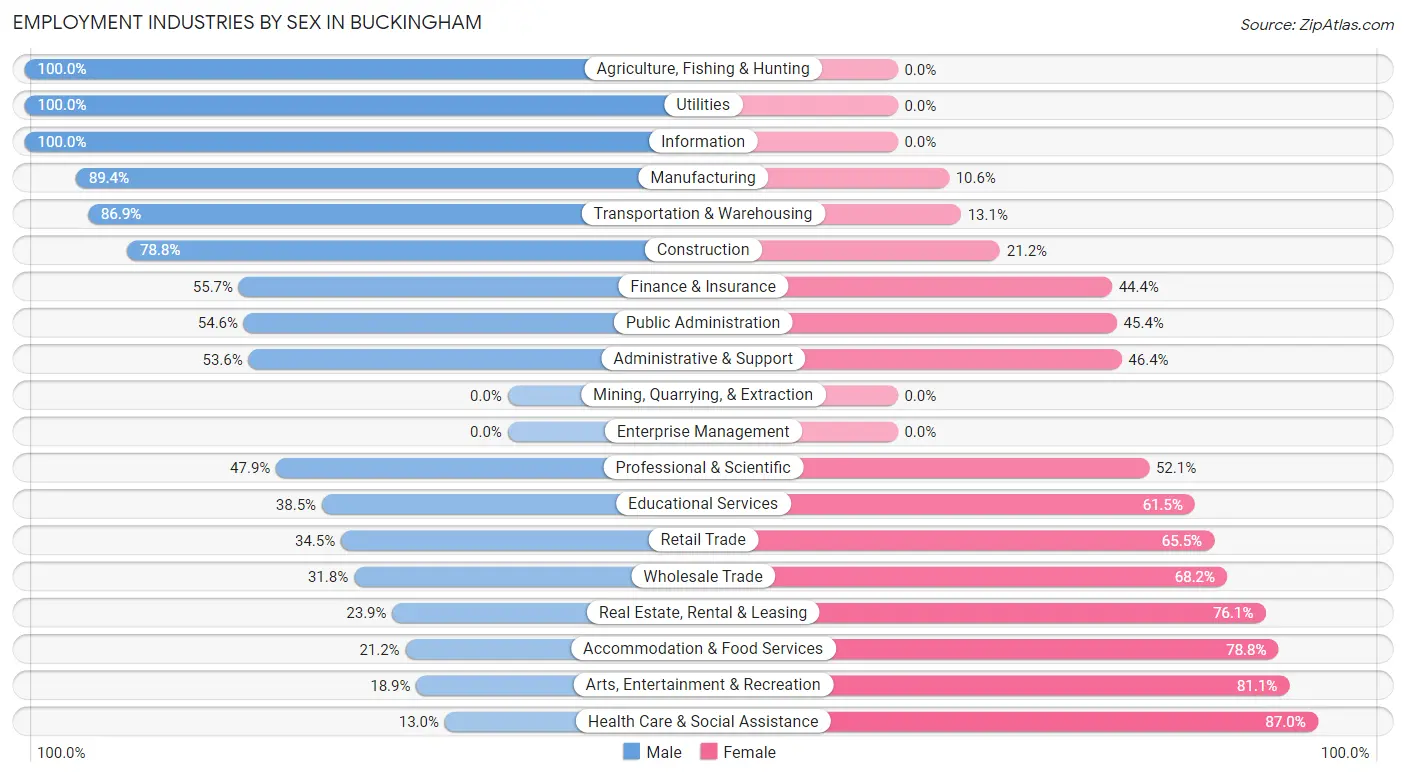
Employment Industries by Sex in Buckingham
The Buckingham industries that see more men than women are Agriculture, Fishing & Hunting (100.0%), Utilities (100.0%), and Information (100.0%), whereas the industries that tend to have a higher number of women are Health Care & Social Assistance (87.0%), Arts, Entertainment & Recreation (81.1%), and Accommodation & Food Services (78.8%).
| Industry | Male | Female |
| Agriculture, Fishing & Hunting | 8 (100.0%) | 0 (0.0%) |
| Mining, Quarrying, & Extraction | 0 (0.0%) | 0 (0.0%) |
| Construction | 286 (78.8%) | 77 (21.2%) |
| Manufacturing | 59 (89.4%) | 7 (10.6%) |
| Wholesale Trade | 7 (31.8%) | 15 (68.2%) |
| Retail Trade | 59 (34.5%) | 112 (65.5%) |
| Transportation & Warehousing | 53 (86.9%) | 8 (13.1%) |
| Utilities | 15 (100.0%) | 0 (0.0%) |
| Information | 15 (100.0%) | 0 (0.0%) |
| Finance & Insurance | 64 (55.6%) | 51 (44.4%) |
| Real Estate, Rental & Leasing | 16 (23.9%) | 51 (76.1%) |
| Professional & Scientific | 58 (47.9%) | 63 (52.1%) |
| Enterprise Management | 0 (0.0%) | 0 (0.0%) |
| Administrative & Support | 59 (53.6%) | 51 (46.4%) |
| Educational Services | 70 (38.5%) | 112 (61.5%) |
| Health Care & Social Assistance | 40 (13.0%) | 267 (87.0%) |
| Arts, Entertainment & Recreation | 7 (18.9%) | 30 (81.1%) |
| Accommodation & Food Services | 29 (21.2%) | 108 (78.8%) |
| Public Administration | 65 (54.6%) | 54 (45.4%) |
| Total | 956 (47.4%) | 1,062 (52.6%) |
Education in Buckingham
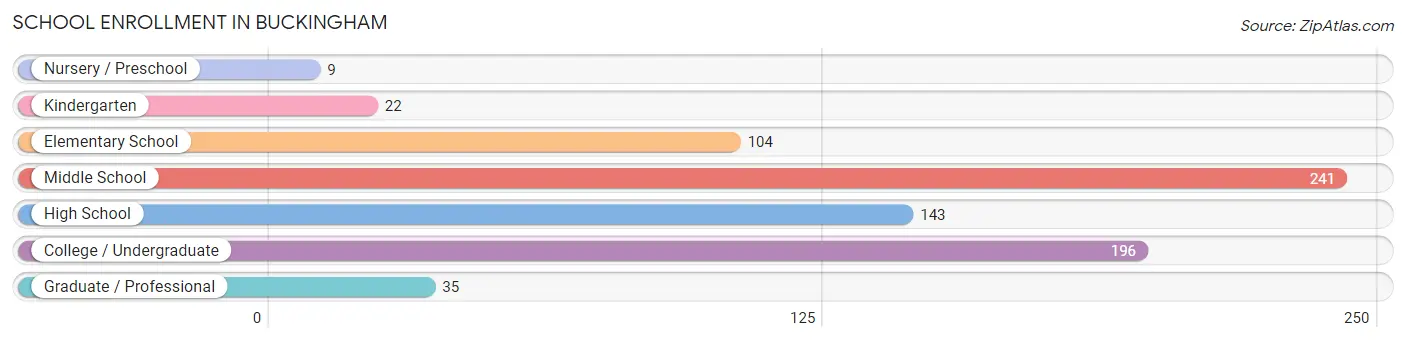
School Enrollment in Buckingham
The most common levels of schooling among the 750 students in Buckingham are middle school (241 | 32.1%), college / undergraduate (196 | 26.1%), and high school (143 | 19.1%).
| School Level | # Students | % Students |
| Nursery / Preschool | 9 | 1.2% |
| Kindergarten | 22 | 2.9% |
| Elementary School | 104 | 13.9% |
| Middle School | 241 | 32.1% |
| High School | 143 | 19.1% |
| College / Undergraduate | 196 | 26.1% |
| Graduate / Professional | 35 | 4.7% |
| Total | 750 | 100.0% |
School Enrollment by Age by Funding Source in Buckingham
Out of a total of 750 students who are enrolled in schools in Buckingham, 93 (12.4%) attend a private institution, while the remaining 657 (87.6%) are enrolled in public schools. The age group of 15 to 17 year olds has the highest likelihood of being enrolled in private schools, with 42 (26.8% in the age bracket) enrolled. Conversely, the age group of 3 to 4 year olds has the lowest likelihood of being enrolled in a private school, with 9 (100.0% in the age bracket) attending a public institution.
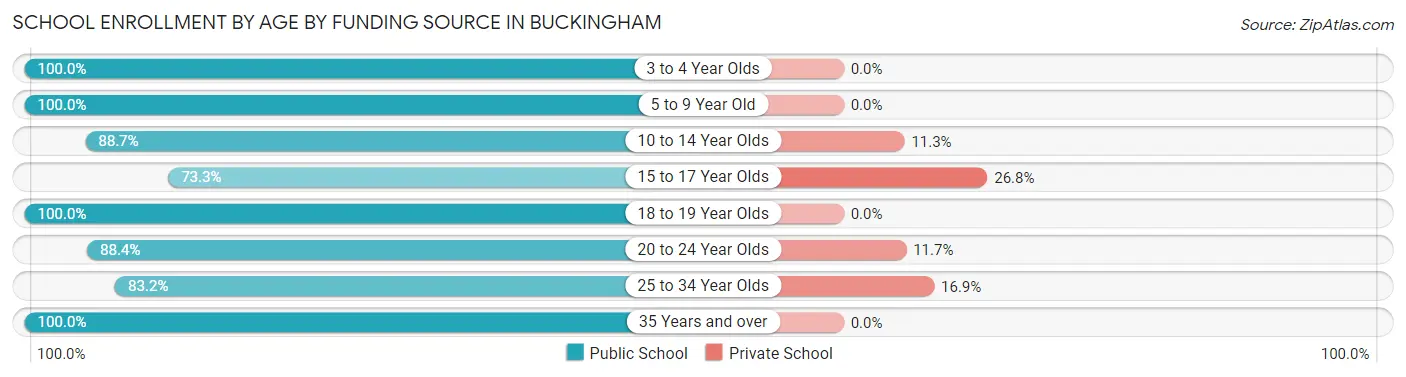
| Age Bracket | Public School | Private School |
| 3 to 4 Year Olds | 9 (100.0%) | 0 (0.0%) |
| 5 to 9 Year Old | 123 (100.0%) | 0 (0.0%) |
| 10 to 14 Year Olds | 188 (88.7%) | 24 (11.3%) |
| 15 to 17 Year Olds | 115 (73.3%) | 42 (26.8%) |
| 18 to 19 Year Olds | 30 (100.0%) | 0 (0.0%) |
| 20 to 24 Year Olds | 91 (88.3%) | 12 (11.7%) |
| 25 to 34 Year Olds | 74 (83.2%) | 15 (16.9%) |
| 35 Years and over | 27 (100.0%) | 0 (0.0%) |
| Total | 657 (87.6%) | 93 (12.4%) |
Educational Attainment by Field of Study in Buckingham
Education (193 | 20.4%), business (166 | 17.5%), physical & health sciences (145 | 15.3%), science & technology (123 | 13.0%), and arts & humanities (68 | 7.2%) are the most common fields of study among 947 individuals in Buckingham who have obtained a bachelor's degree or higher.
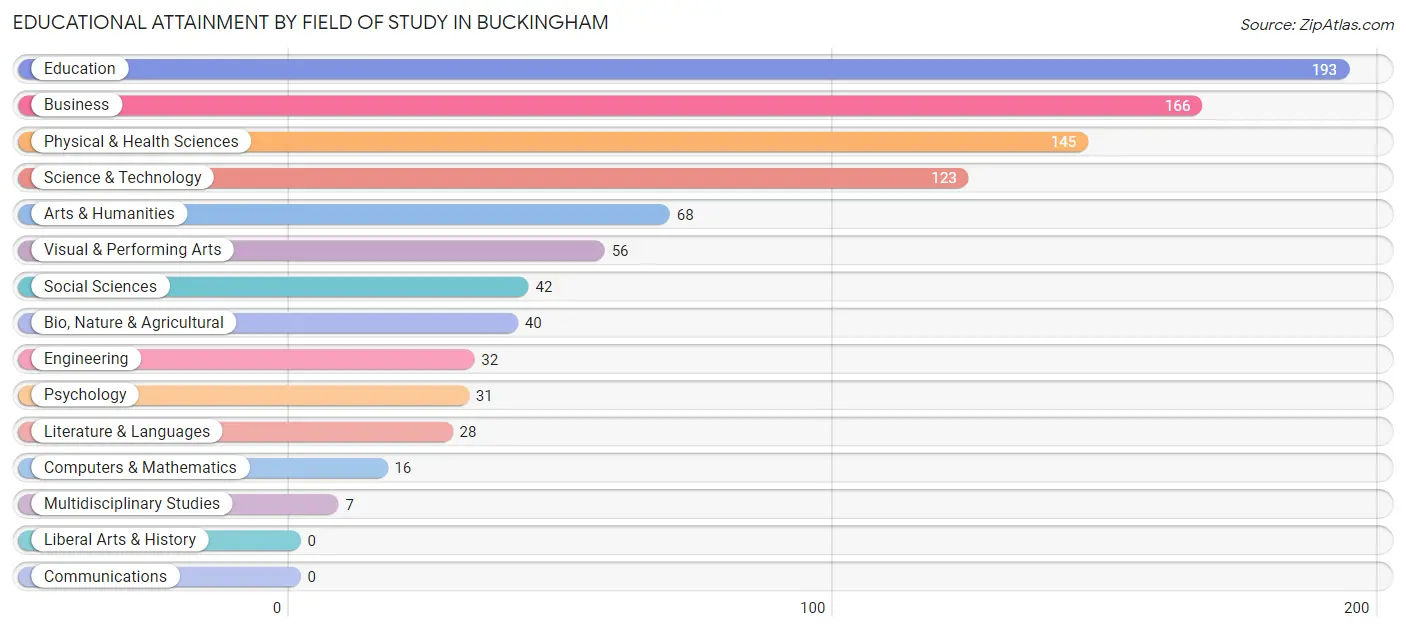
| Field of Study | # Graduates | % Graduates |
| Computers & Mathematics | 16 | 1.7% |
| Bio, Nature & Agricultural | 40 | 4.2% |
| Physical & Health Sciences | 145 | 15.3% |
| Psychology | 31 | 3.3% |
| Social Sciences | 42 | 4.4% |
| Engineering | 32 | 3.4% |
| Multidisciplinary Studies | 7 | 0.7% |
| Science & Technology | 123 | 13.0% |
| Business | 166 | 17.5% |
| Education | 193 | 20.4% |
| Literature & Languages | 28 | 3.0% |
| Liberal Arts & History | 0 | 0.0% |
| Visual & Performing Arts | 56 | 5.9% |
| Communications | 0 | 0.0% |
| Arts & Humanities | 68 | 7.2% |
| Total | 947 | 100.0% |
Transportation & Commute in Buckingham
Vehicle Availability by Sex in Buckingham
The most prevalent vehicle ownership categories in Buckingham are males with 3 vehicles (444, accounting for 46.4%) and females with 3 vehicles (351, making up 44.7%).
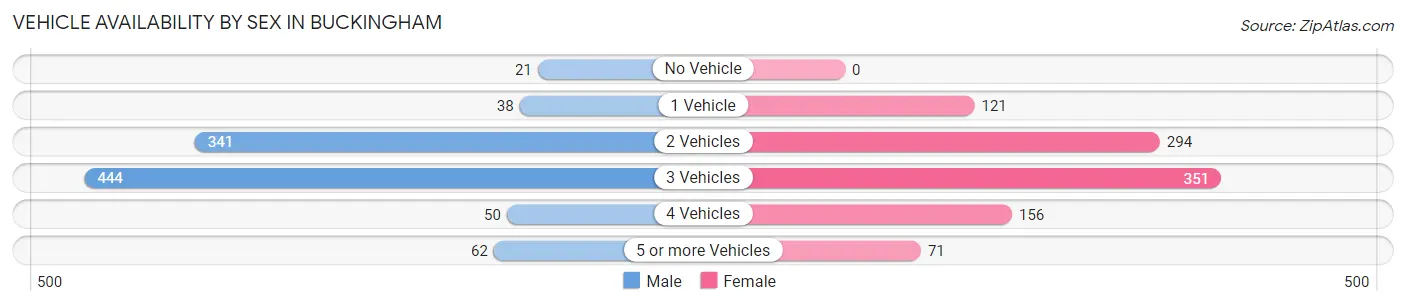
| Vehicles Available | Male | Female |
| No Vehicle | 21 (2.2%) | 0 (0.0%) |
| 1 Vehicle | 38 (4.0%) | 121 (12.2%) |
| 2 Vehicles | 341 (35.7%) | 294 (29.6%) |
| 3 Vehicles | 444 (46.4%) | 351 (35.3%) |
| 4 Vehicles | 50 (5.2%) | 156 (15.7%) |
| 5 or more Vehicles | 62 (6.5%) | 71 (7.1%) |
| Total | 956 (100.0%) | 993 (100.0%) |
Commute Time in Buckingham
The most frequently occuring commute durations in Buckingham are 30 to 34 minutes (365 commuters, 20.4%), 20 to 24 minutes (330 commuters, 18.4%), and 15 to 19 minutes (251 commuters, 14.0%).
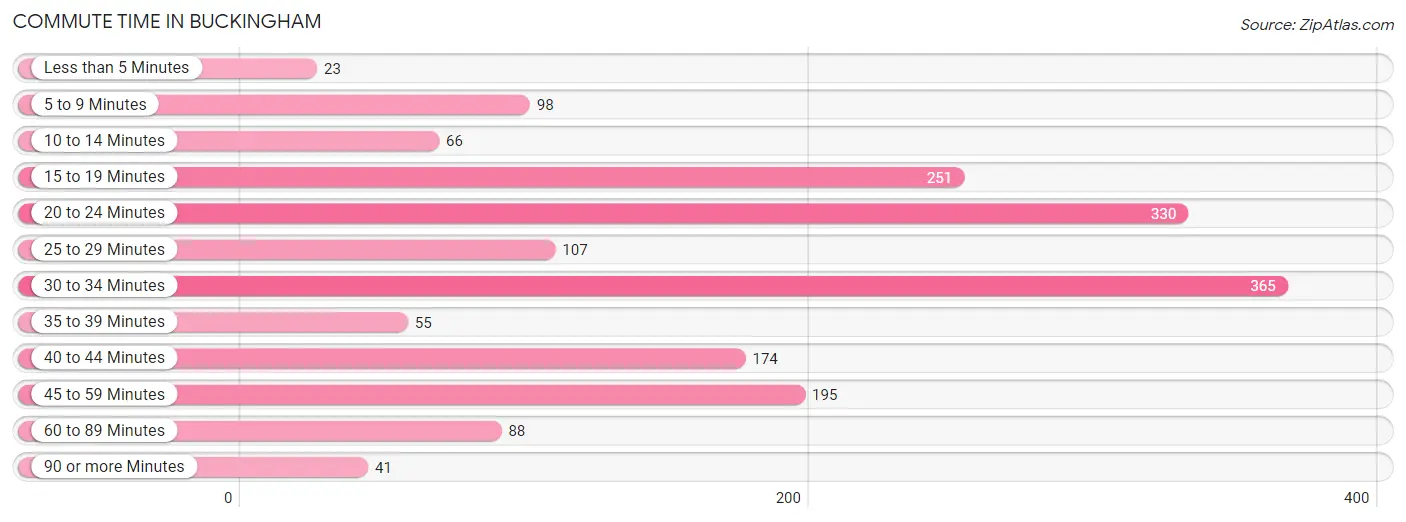
| Commute Time | # Commuters | % Commuters |
| Less than 5 Minutes | 23 | 1.3% |
| 5 to 9 Minutes | 98 | 5.5% |
| 10 to 14 Minutes | 66 | 3.7% |
| 15 to 19 Minutes | 251 | 14.0% |
| 20 to 24 Minutes | 330 | 18.4% |
| 25 to 29 Minutes | 107 | 6.0% |
| 30 to 34 Minutes | 365 | 20.4% |
| 35 to 39 Minutes | 55 | 3.1% |
| 40 to 44 Minutes | 174 | 9.7% |
| 45 to 59 Minutes | 195 | 10.9% |
| 60 to 89 Minutes | 88 | 4.9% |
| 90 or more Minutes | 41 | 2.3% |
Commute Time by Sex in Buckingham
The most common commute times in Buckingham are 20 to 24 minutes (204 commuters, 23.1%) for males and 30 to 34 minutes (199 commuters, 21.9%) for females.
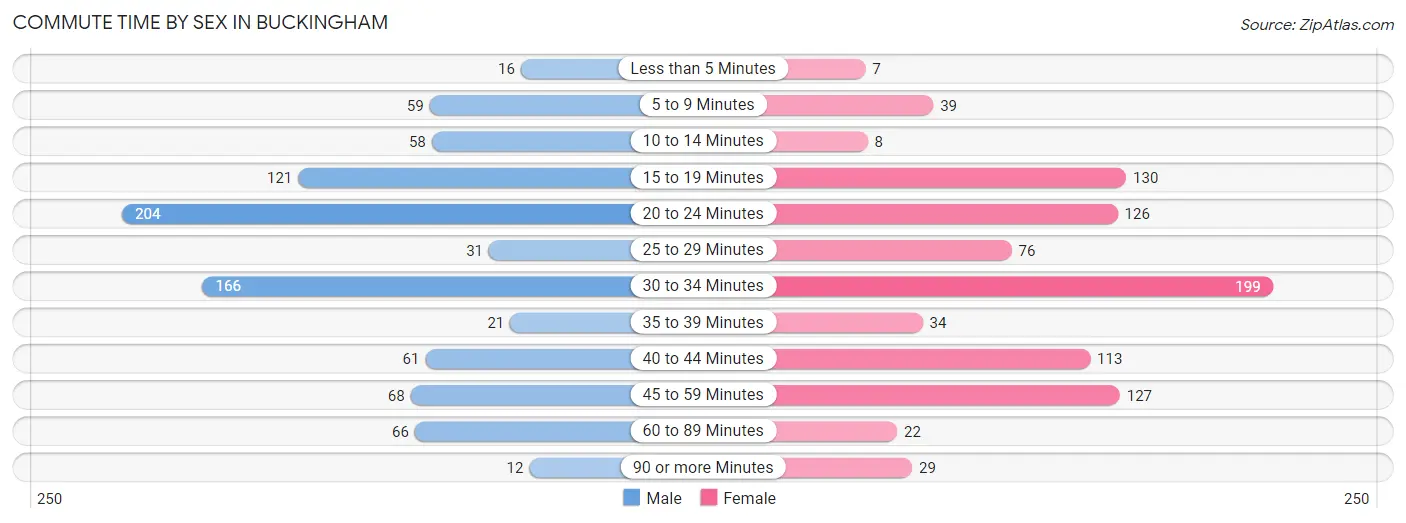
| Commute Time | Male | Female |
| Less than 5 Minutes | 16 (1.8%) | 7 (0.8%) |
| 5 to 9 Minutes | 59 (6.7%) | 39 (4.3%) |
| 10 to 14 Minutes | 58 (6.6%) | 8 (0.9%) |
| 15 to 19 Minutes | 121 (13.7%) | 130 (14.3%) |
| 20 to 24 Minutes | 204 (23.1%) | 126 (13.9%) |
| 25 to 29 Minutes | 31 (3.5%) | 76 (8.4%) |
| 30 to 34 Minutes | 166 (18.8%) | 199 (21.9%) |
| 35 to 39 Minutes | 21 (2.4%) | 34 (3.7%) |
| 40 to 44 Minutes | 61 (6.9%) | 113 (12.4%) |
| 45 to 59 Minutes | 68 (7.7%) | 127 (14.0%) |
| 60 to 89 Minutes | 66 (7.5%) | 22 (2.4%) |
| 90 or more Minutes | 12 (1.4%) | 29 (3.2%) |
Time of Departure to Work by Sex in Buckingham
The most frequent times of departure to work in Buckingham are 7:00 AM to 7:29 AM (165, 18.7%) for males and 7:00 AM to 7:29 AM (215, 23.6%) for females.
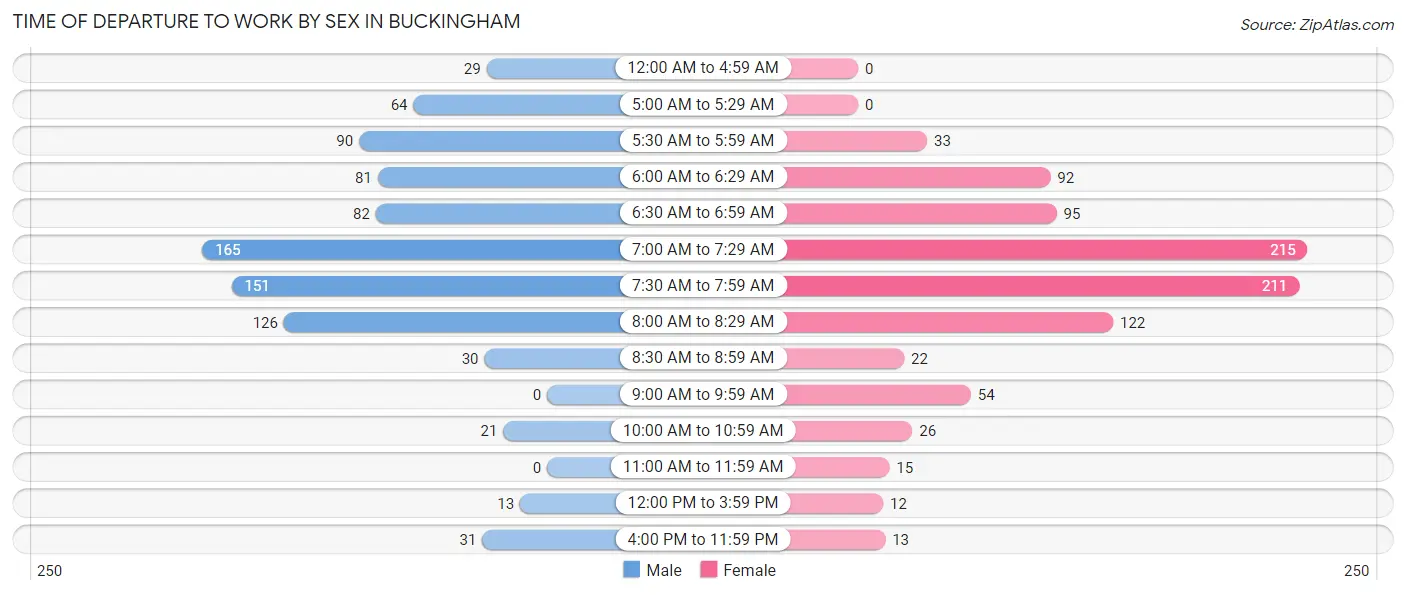
| Time of Departure | Male | Female |
| 12:00 AM to 4:59 AM | 29 (3.3%) | 0 (0.0%) |
| 5:00 AM to 5:29 AM | 64 (7.2%) | 0 (0.0%) |
| 5:30 AM to 5:59 AM | 90 (10.2%) | 33 (3.6%) |
| 6:00 AM to 6:29 AM | 81 (9.2%) | 92 (10.1%) |
| 6:30 AM to 6:59 AM | 82 (9.3%) | 95 (10.4%) |
| 7:00 AM to 7:29 AM | 165 (18.7%) | 215 (23.6%) |
| 7:30 AM to 7:59 AM | 151 (17.1%) | 211 (23.2%) |
| 8:00 AM to 8:29 AM | 126 (14.3%) | 122 (13.4%) |
| 8:30 AM to 8:59 AM | 30 (3.4%) | 22 (2.4%) |
| 9:00 AM to 9:59 AM | 0 (0.0%) | 54 (5.9%) |
| 10:00 AM to 10:59 AM | 21 (2.4%) | 26 (2.9%) |
| 11:00 AM to 11:59 AM | 0 (0.0%) | 15 (1.7%) |
| 12:00 PM to 3:59 PM | 13 (1.5%) | 12 (1.3%) |
| 4:00 PM to 11:59 PM | 31 (3.5%) | 13 (1.4%) |
| Total | 883 (100.0%) | 910 (100.0%) |
Housing Occupancy in Buckingham
Occupancy by Ownership in Buckingham
Of the total 1,649 dwellings in Buckingham, owner-occupied units account for 1,484 (90.0%), while renter-occupied units make up 165 (10.0%).
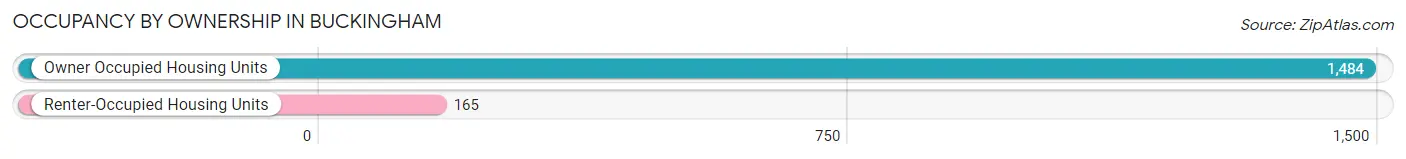
| Occupancy | # Housing Units | % Housing Units |
| Owner Occupied Housing Units | 1,484 | 90.0% |
| Renter-Occupied Housing Units | 165 | 10.0% |
| Total Occupied Housing Units | 1,649 | 100.0% |
Occupancy by Household Size in Buckingham
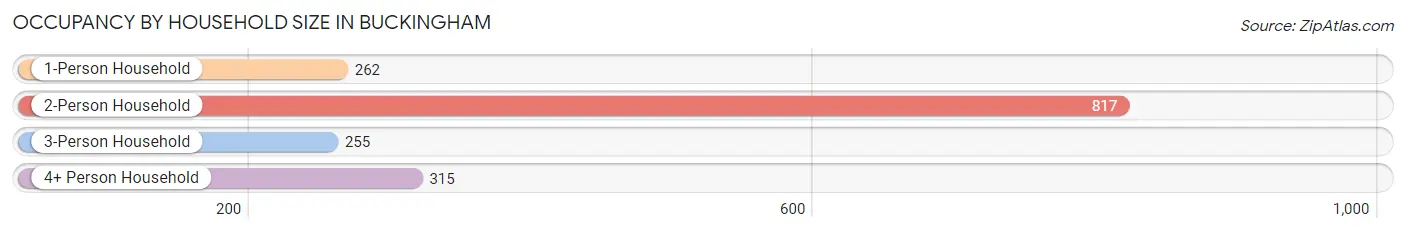
| Household Size | # Housing Units | % Housing Units |
| 1-Person Household | 262 | 15.9% |
| 2-Person Household | 817 | 49.5% |
| 3-Person Household | 255 | 15.5% |
| 4+ Person Household | 315 | 19.1% |
| Total Housing Units | 1,649 | 100.0% |
Occupancy by Ownership by Household Size in Buckingham
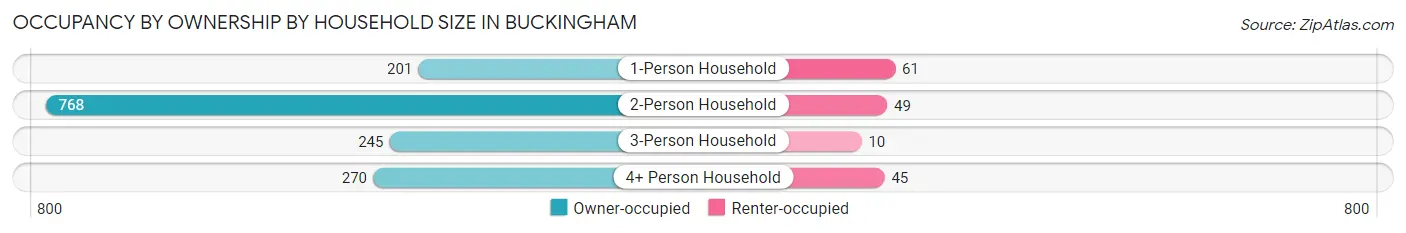
| Household Size | Owner-occupied | Renter-occupied |
| 1-Person Household | 201 (76.7%) | 61 (23.3%) |
| 2-Person Household | 768 (94.0%) | 49 (6.0%) |
| 3-Person Household | 245 (96.1%) | 10 (3.9%) |
| 4+ Person Household | 270 (85.7%) | 45 (14.3%) |
| Total Housing Units | 1,484 (90.0%) | 165 (10.0%) |
Occupancy by Educational Attainment in Buckingham
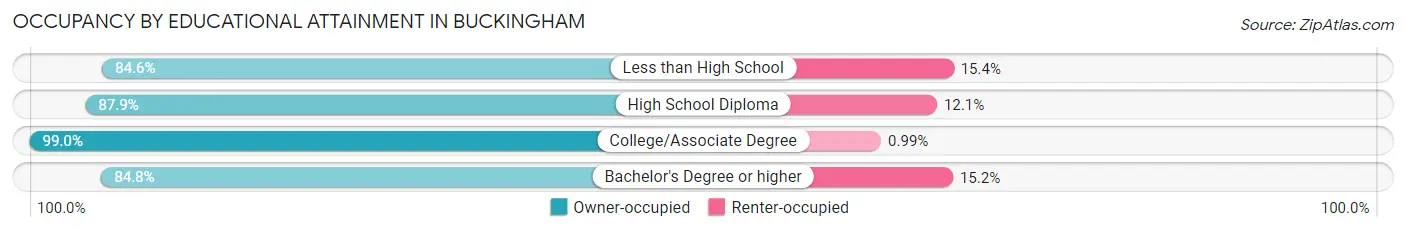
| Household Size | Owner-occupied | Renter-occupied |
| Less than High School | 110 (84.6%) | 20 (15.4%) |
| High School Diploma | 401 (87.9%) | 55 (12.1%) |
| College/Associate Degree | 500 (99.0%) | 5 (1.0%) |
| Bachelor's Degree or higher | 473 (84.8%) | 85 (15.2%) |
Occupancy by Age of Householder in Buckingham
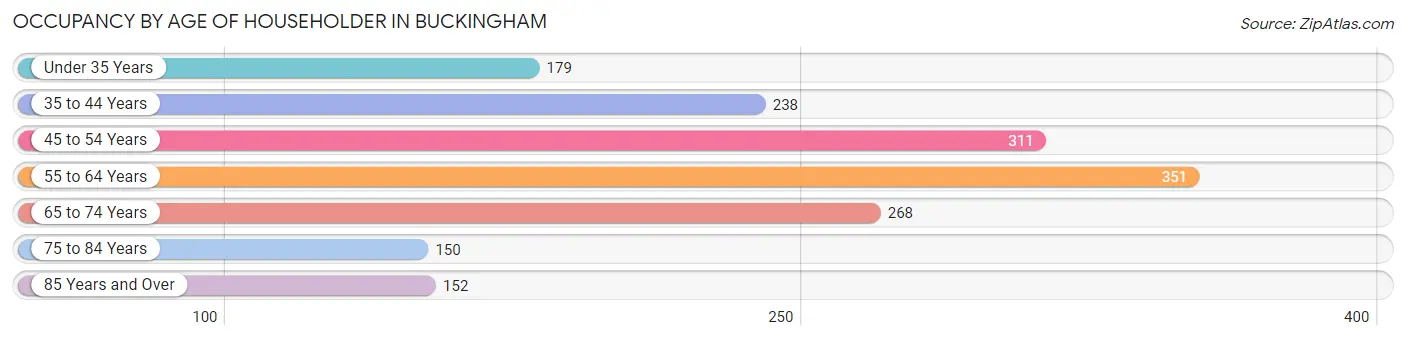
| Age Bracket | # Households | % Households |
| Under 35 Years | 179 | 10.9% |
| 35 to 44 Years | 238 | 14.4% |
| 45 to 54 Years | 311 | 18.9% |
| 55 to 64 Years | 351 | 21.3% |
| 65 to 74 Years | 268 | 16.3% |
| 75 to 84 Years | 150 | 9.1% |
| 85 Years and Over | 152 | 9.2% |
| Total | 1,649 | 100.0% |
Housing Finances in Buckingham
Median Income by Occupancy in Buckingham
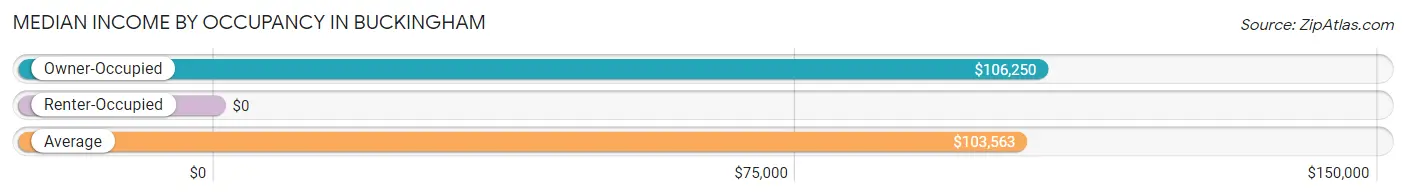
| Occupancy Type | # Households | Median Income |
| Owner-Occupied | 1,484 (90.0%) | $106,250 |
| Renter-Occupied | 165 (10.0%) | $0 |
| Average | 1,649 (100.0%) | $103,563 |
Occupancy by Householder Income Bracket in Buckingham
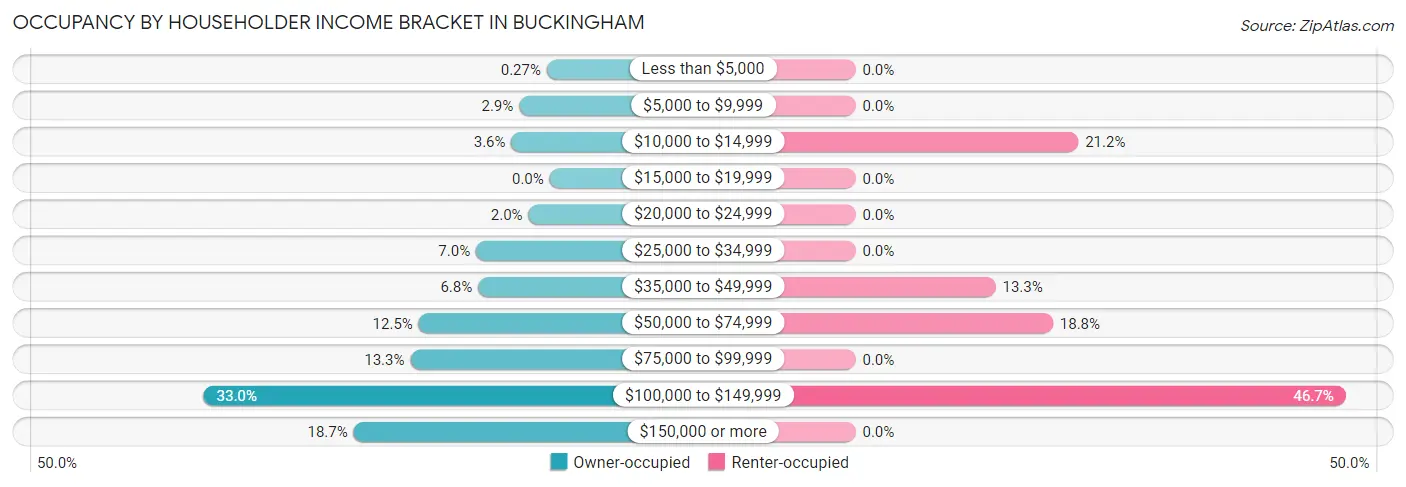
| Income Bracket | Owner-occupied | Renter-occupied |
| Less than $5,000 | 4 (0.3%) | 0 (0.0%) |
| $5,000 to $9,999 | 43 (2.9%) | 0 (0.0%) |
| $10,000 to $14,999 | 54 (3.6%) | 35 (21.2%) |
| $15,000 to $19,999 | 0 (0.0%) | 0 (0.0%) |
| $20,000 to $24,999 | 30 (2.0%) | 0 (0.0%) |
| $25,000 to $34,999 | 104 (7.0%) | 0 (0.0%) |
| $35,000 to $49,999 | 101 (6.8%) | 22 (13.3%) |
| $50,000 to $74,999 | 185 (12.5%) | 31 (18.8%) |
| $75,000 to $99,999 | 197 (13.3%) | 0 (0.0%) |
| $100,000 to $149,999 | 489 (33.0%) | 77 (46.7%) |
| $150,000 or more | 277 (18.7%) | 0 (0.0%) |
| Total | 1,484 (100.0%) | 165 (100.0%) |
Monthly Housing Cost Tiers in Buckingham
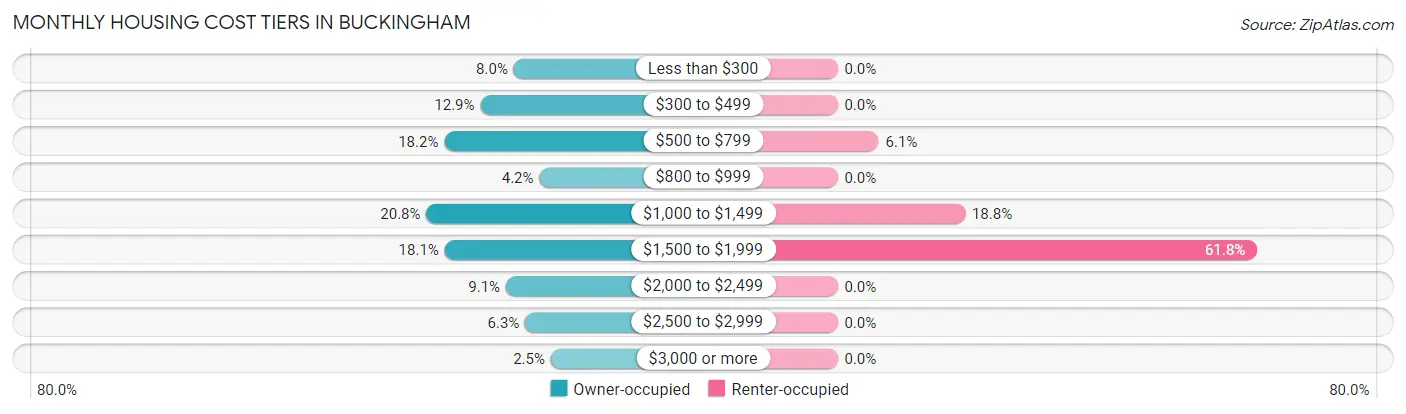
| Monthly Cost | Owner-occupied | Renter-occupied |
| Less than $300 | 118 (8.0%) | 0 (0.0%) |
| $300 to $499 | 191 (12.9%) | 0 (0.0%) |
| $500 to $799 | 270 (18.2%) | 10 (6.1%) |
| $800 to $999 | 62 (4.2%) | 0 (0.0%) |
| $1,000 to $1,499 | 309 (20.8%) | 31 (18.8%) |
| $1,500 to $1,999 | 269 (18.1%) | 102 (61.8%) |
| $2,000 to $2,499 | 135 (9.1%) | 0 (0.0%) |
| $2,500 to $2,999 | 93 (6.3%) | 0 (0.0%) |
| $3,000 or more | 37 (2.5%) | 0 (0.0%) |
| Total | 1,484 (100.0%) | 165 (100.0%) |
Physical Housing Characteristics in Buckingham
Housing Structures in Buckingham
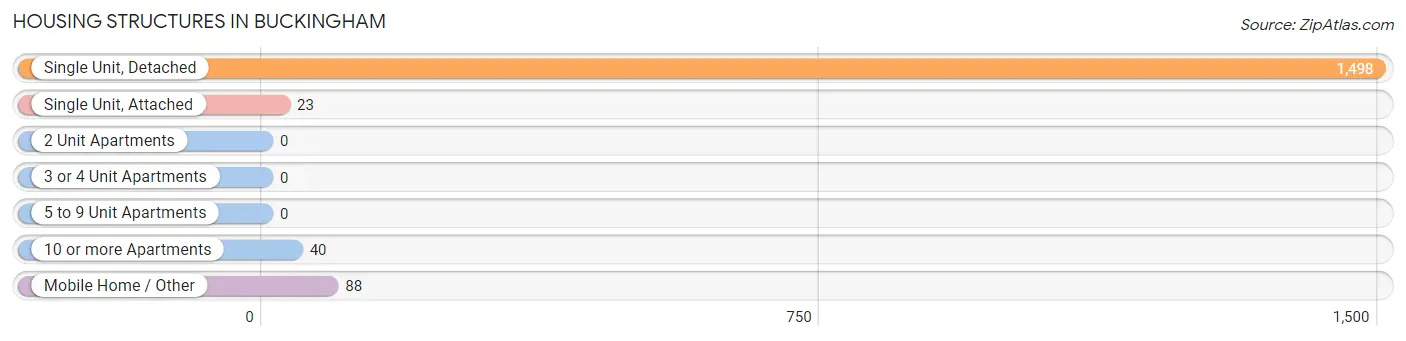
| Structure Type | # Housing Units | % Housing Units |
| Single Unit, Detached | 1,498 | 90.8% |
| Single Unit, Attached | 23 | 1.4% |
| 2 Unit Apartments | 0 | 0.0% |
| 3 or 4 Unit Apartments | 0 | 0.0% |
| 5 to 9 Unit Apartments | 0 | 0.0% |
| 10 or more Apartments | 40 | 2.4% |
| Mobile Home / Other | 88 | 5.3% |
| Total | 1,649 | 100.0% |
Housing Structures by Occupancy in Buckingham
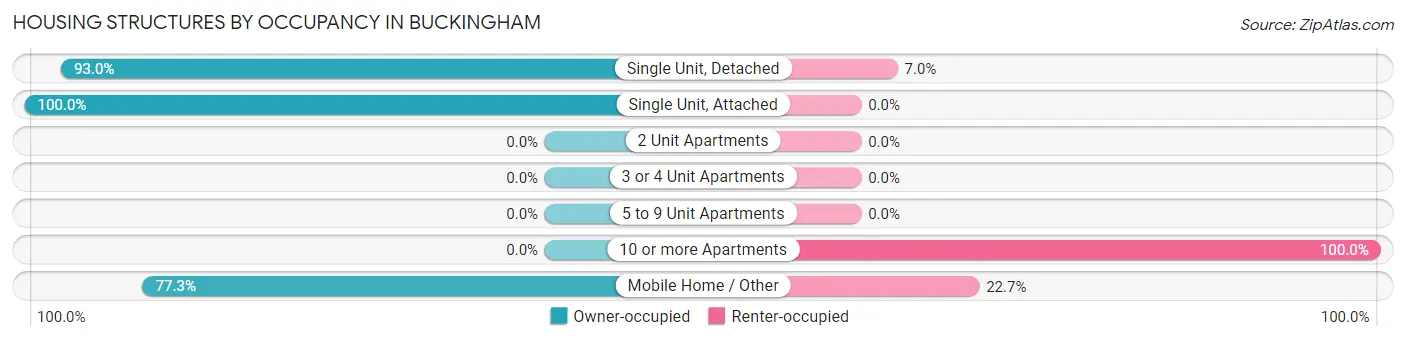
| Structure Type | Owner-occupied | Renter-occupied |
| Single Unit, Detached | 1,393 (93.0%) | 105 (7.0%) |
| Single Unit, Attached | 23 (100.0%) | 0 (0.0%) |
| 2 Unit Apartments | 0 (0.0%) | 0 (0.0%) |
| 3 or 4 Unit Apartments | 0 (0.0%) | 0 (0.0%) |
| 5 to 9 Unit Apartments | 0 (0.0%) | 0 (0.0%) |
| 10 or more Apartments | 0 (0.0%) | 40 (100.0%) |
| Mobile Home / Other | 68 (77.3%) | 20 (22.7%) |
| Total | 1,484 (90.0%) | 165 (10.0%) |
Housing Structures by Number of Rooms in Buckingham
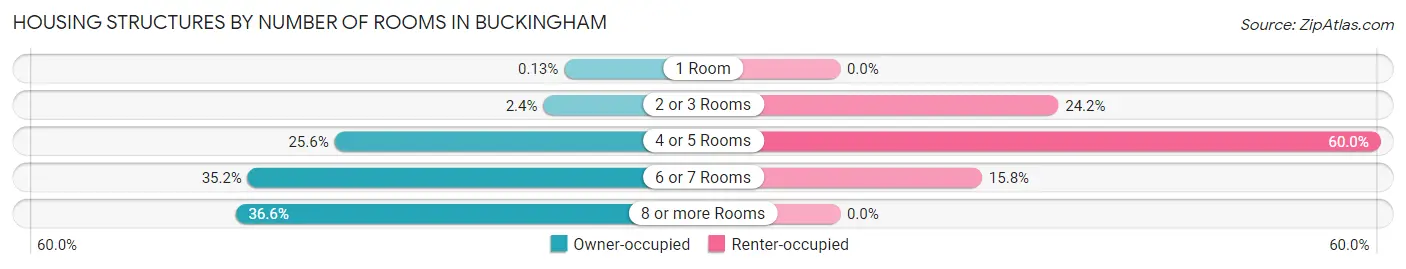
| Number of Rooms | Owner-occupied | Renter-occupied |
| 1 Room | 2 (0.1%) | 0 (0.0%) |
| 2 or 3 Rooms | 36 (2.4%) | 40 (24.2%) |
| 4 or 5 Rooms | 380 (25.6%) | 99 (60.0%) |
| 6 or 7 Rooms | 523 (35.2%) | 26 (15.8%) |
| 8 or more Rooms | 543 (36.6%) | 0 (0.0%) |
| Total | 1,484 (100.0%) | 165 (100.0%) |
Housing Structure by Heating Type in Buckingham
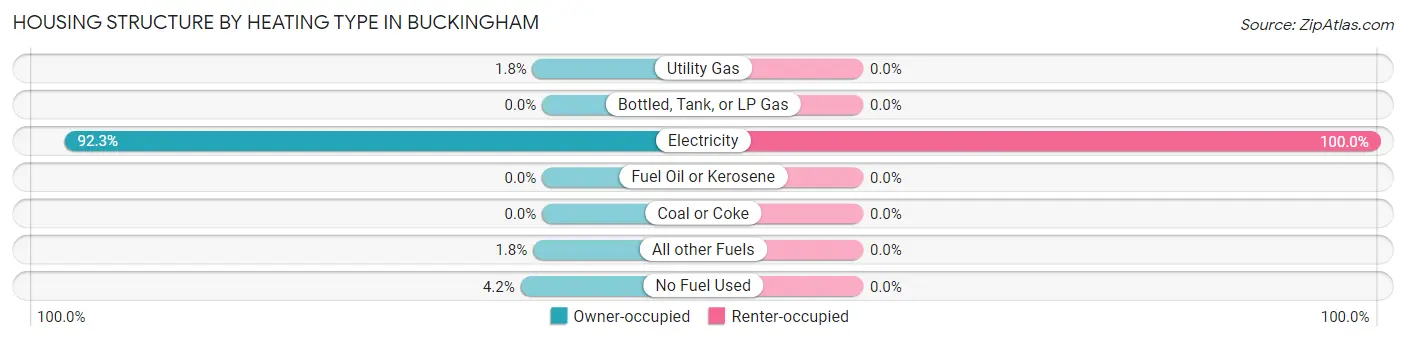
| Heating Type | Owner-occupied | Renter-occupied |
| Utility Gas | 27 (1.8%) | 0 (0.0%) |
| Bottled, Tank, or LP Gas | 0 (0.0%) | 0 (0.0%) |
| Electricity | 1,369 (92.2%) | 165 (100.0%) |
| Fuel Oil or Kerosene | 0 (0.0%) | 0 (0.0%) |
| Coal or Coke | 0 (0.0%) | 0 (0.0%) |
| All other Fuels | 26 (1.8%) | 0 (0.0%) |
| No Fuel Used | 62 (4.2%) | 0 (0.0%) |
| Total | 1,484 (100.0%) | 165 (100.0%) |
Household Vehicle Usage in Buckingham
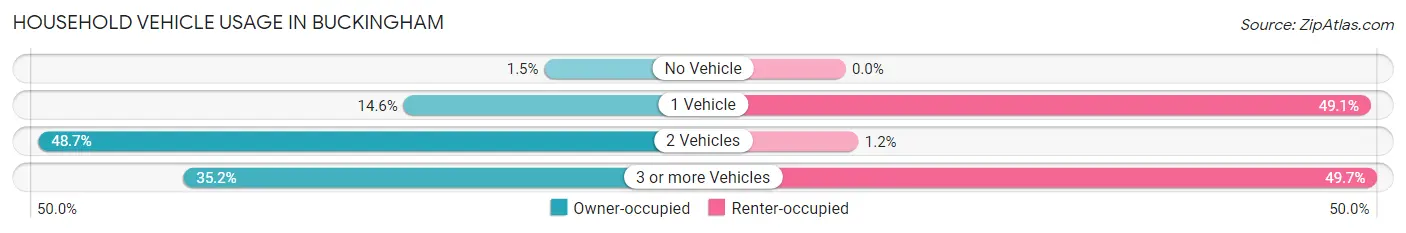
| Vehicles per Household | Owner-occupied | Renter-occupied |
| No Vehicle | 22 (1.5%) | 0 (0.0%) |
| 1 Vehicle | 217 (14.6%) | 81 (49.1%) |
| 2 Vehicles | 723 (48.7%) | 2 (1.2%) |
| 3 or more Vehicles | 522 (35.2%) | 82 (49.7%) |
| Total | 1,484 (100.0%) | 165 (100.0%) |
Real Estate & Mortgages in Buckingham
Real Estate and Mortgage Overview in Buckingham
| Characteristic | Without Mortgage | With Mortgage |
| Housing Units | 621 | 863 |
| Median Property Value | $366,600 | $337,600 |
| Median Household Income | $86,488 | $231 |
| Monthly Housing Costs | $504 | $37 |
| Real Estate Taxes | $2,330 | $0 |
Property Value by Mortgage Status in Buckingham
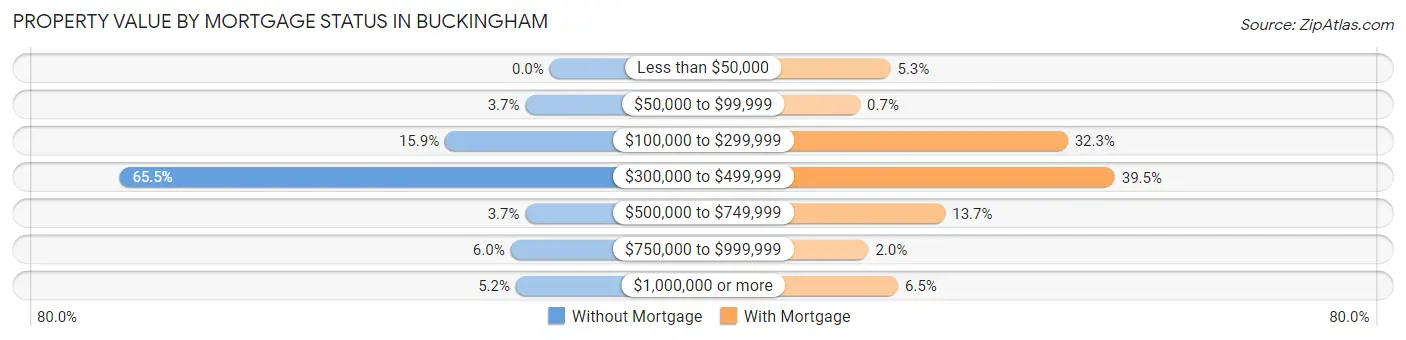
| Property Value | Without Mortgage | With Mortgage |
| Less than $50,000 | 0 (0.0%) | 46 (5.3%) |
| $50,000 to $99,999 | 23 (3.7%) | 6 (0.7%) |
| $100,000 to $299,999 | 99 (15.9%) | 279 (32.3%) |
| $300,000 to $499,999 | 407 (65.5%) | 341 (39.5%) |
| $500,000 to $749,999 | 23 (3.7%) | 118 (13.7%) |
| $750,000 to $999,999 | 37 (6.0%) | 17 (2.0%) |
| $1,000,000 or more | 32 (5.1%) | 56 (6.5%) |
| Total | 621 (100.0%) | 863 (100.0%) |
Household Income by Mortgage Status in Buckingham
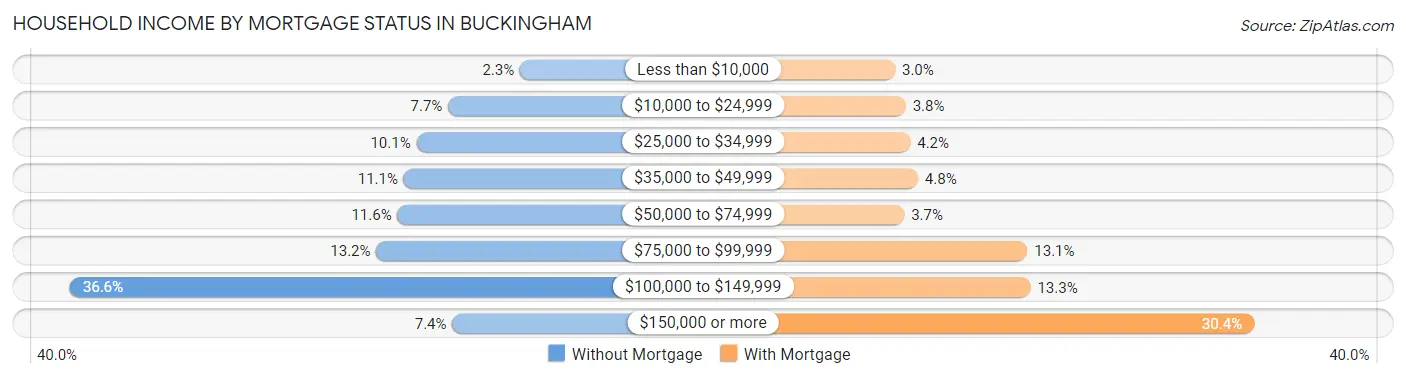
| Household Income | Without Mortgage | With Mortgage |
| Less than $10,000 | 14 (2.2%) | 26 (3.0%) |
| $10,000 to $24,999 | 48 (7.7%) | 33 (3.8%) |
| $25,000 to $34,999 | 63 (10.1%) | 36 (4.2%) |
| $35,000 to $49,999 | 69 (11.1%) | 41 (4.8%) |
| $50,000 to $74,999 | 72 (11.6%) | 32 (3.7%) |
| $75,000 to $99,999 | 82 (13.2%) | 113 (13.1%) |
| $100,000 to $149,999 | 227 (36.5%) | 115 (13.3%) |
| $150,000 or more | 46 (7.4%) | 262 (30.4%) |
| Total | 621 (100.0%) | 863 (100.0%) |
Property Value to Household Income Ratio in Buckingham
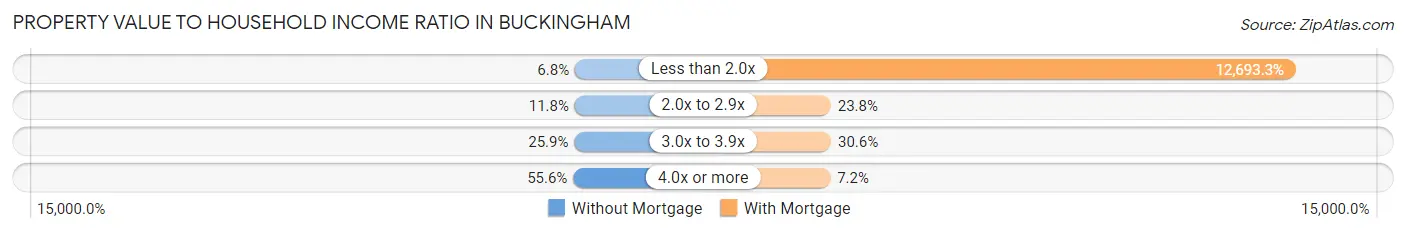
| Value-to-Income Ratio | Without Mortgage | With Mortgage |
| Less than 2.0x | 42 (6.8%) | 109,543 (12,693.3%) |
| 2.0x to 2.9x | 73 (11.8%) | 205 (23.7%) |
| 3.0x to 3.9x | 161 (25.9%) | 264 (30.6%) |
| 4.0x or more | 345 (55.6%) | 62 (7.2%) |
| Total | 621 (100.0%) | 863 (100.0%) |
Real Estate Taxes by Mortgage Status in Buckingham
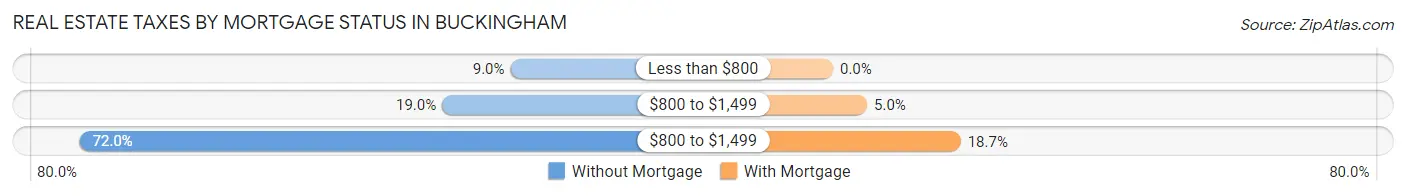
| Property Taxes | Without Mortgage | With Mortgage |
| Less than $800 | 56 (9.0%) | 0 (0.0%) |
| $800 to $1,499 | 118 (19.0%) | 43 (5.0%) |
| $800 to $1,499 | 447 (72.0%) | 161 (18.7%) |
| Total | 621 (100.0%) | 863 (100.0%) |
Health & Disability in Buckingham
Health Insurance Coverage by Age in Buckingham
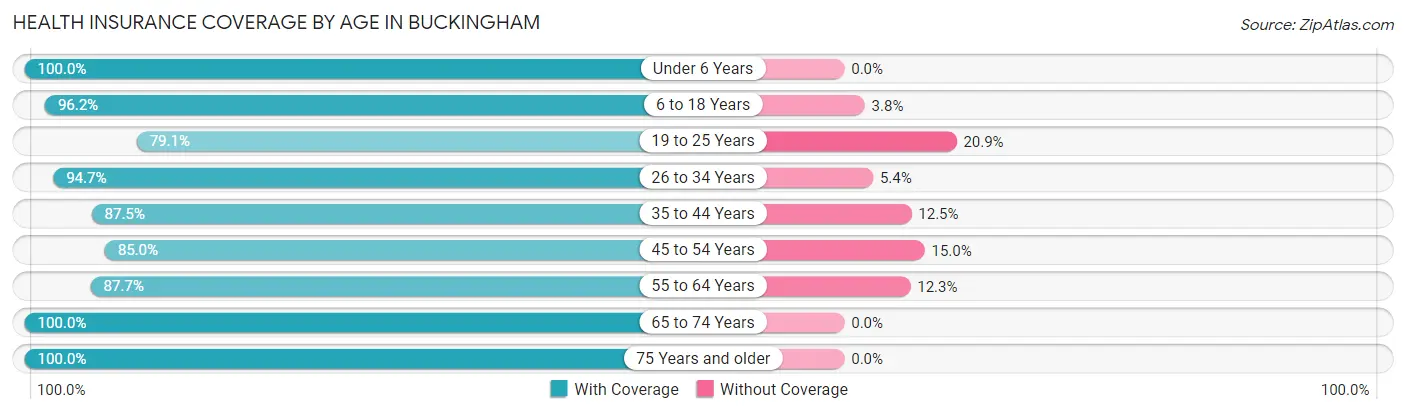
| Age Bracket | With Coverage | Without Coverage |
| Under 6 Years | 235 (100.0%) | 0 (0.0%) |
| 6 to 18 Years | 507 (96.2%) | 20 (3.8%) |
| 19 to 25 Years | 227 (79.1%) | 60 (20.9%) |
| 26 to 34 Years | 389 (94.7%) | 22 (5.3%) |
| 35 to 44 Years | 462 (87.5%) | 66 (12.5%) |
| 45 to 54 Years | 466 (85.0%) | 82 (15.0%) |
| 55 to 64 Years | 627 (87.7%) | 88 (12.3%) |
| 65 to 74 Years | 506 (100.0%) | 0 (0.0%) |
| 75 Years and older | 531 (100.0%) | 0 (0.0%) |
| Total | 3,950 (92.1%) | 338 (7.9%) |
Health Insurance Coverage by Citizenship Status in Buckingham
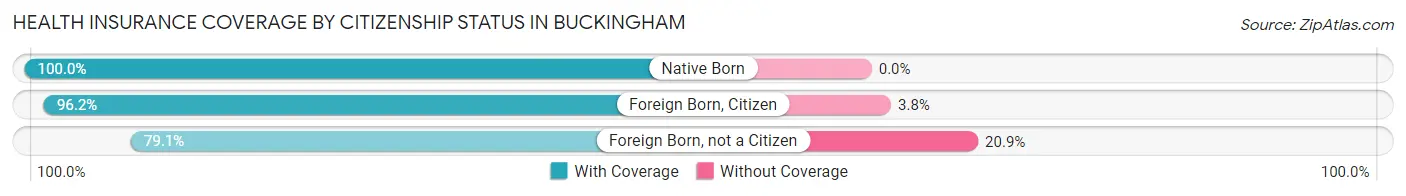
| Citizenship Status | With Coverage | Without Coverage |
| Native Born | 235 (100.0%) | 0 (0.0%) |
| Foreign Born, Citizen | 507 (96.2%) | 20 (3.8%) |
| Foreign Born, not a Citizen | 227 (79.1%) | 60 (20.9%) |
Health Insurance Coverage by Household Income in Buckingham
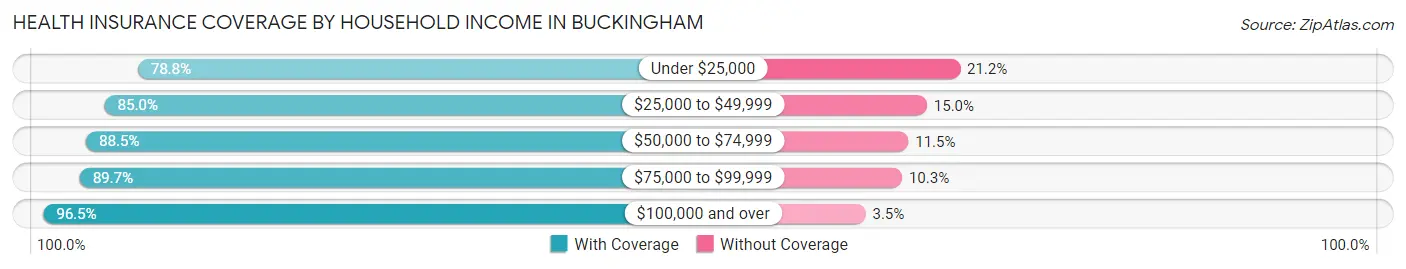
| Household Income | With Coverage | Without Coverage |
| Under $25,000 | 208 (78.8%) | 56 (21.2%) |
| $25,000 to $49,999 | 340 (85.0%) | 60 (15.0%) |
| $50,000 to $74,999 | 537 (88.5%) | 70 (11.5%) |
| $75,000 to $99,999 | 503 (89.7%) | 58 (10.3%) |
| $100,000 and over | 2,337 (96.5%) | 85 (3.5%) |
Public vs Private Health Insurance Coverage by Age in Buckingham
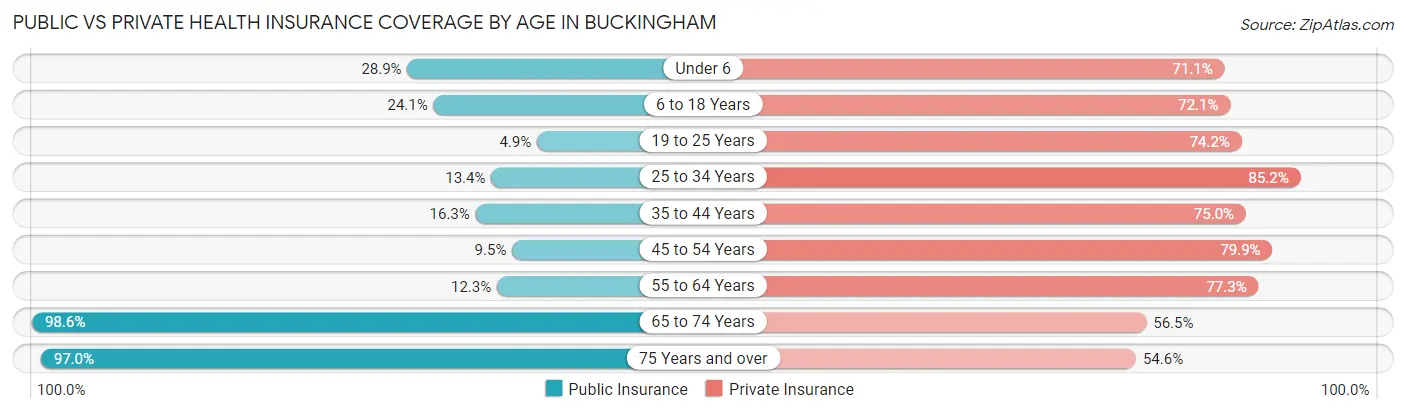
| Age Bracket | Public Insurance | Private Insurance |
| Under 6 | 68 (28.9%) | 167 (71.1%) |
| 6 to 18 Years | 127 (24.1%) | 380 (72.1%) |
| 19 to 25 Years | 14 (4.9%) | 213 (74.2%) |
| 25 to 34 Years | 55 (13.4%) | 350 (85.2%) |
| 35 to 44 Years | 86 (16.3%) | 396 (75.0%) |
| 45 to 54 Years | 52 (9.5%) | 438 (79.9%) |
| 55 to 64 Years | 88 (12.3%) | 553 (77.3%) |
| 65 to 74 Years | 499 (98.6%) | 286 (56.5%) |
| 75 Years and over | 515 (97.0%) | 290 (54.6%) |
| Total | 1,504 (35.1%) | 3,073 (71.7%) |
Disability Status by Sex by Age in Buckingham
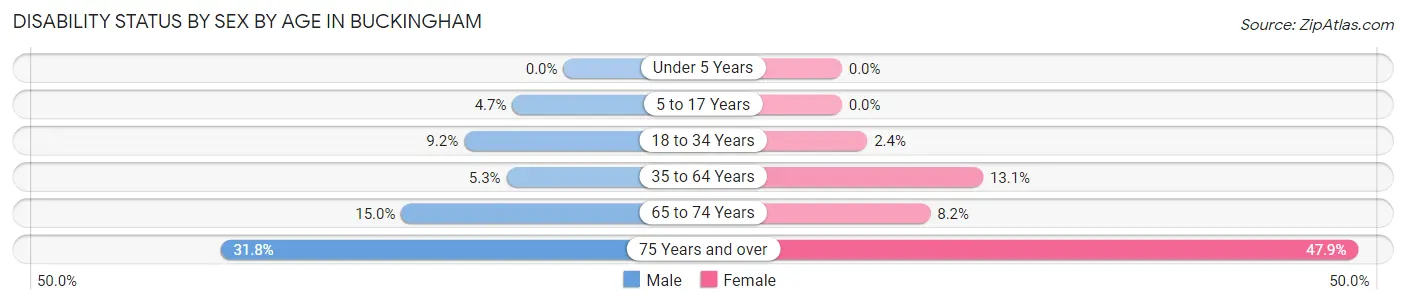
| Age Bracket | Male | Female |
| Under 5 Years | 0 (0.0%) | 0 (0.0%) |
| 5 to 17 Years | 13 (4.7%) | 0 (0.0%) |
| 18 to 34 Years | 26 (9.2%) | 10 (2.4%) |
| 35 to 64 Years | 45 (5.3%) | 123 (13.1%) |
| 65 to 74 Years | 34 (15.0%) | 23 (8.2%) |
| 75 Years and over | 84 (31.8%) | 128 (47.9%) |
Disability Class by Sex by Age in Buckingham
Disability Class: Hearing Difficulty
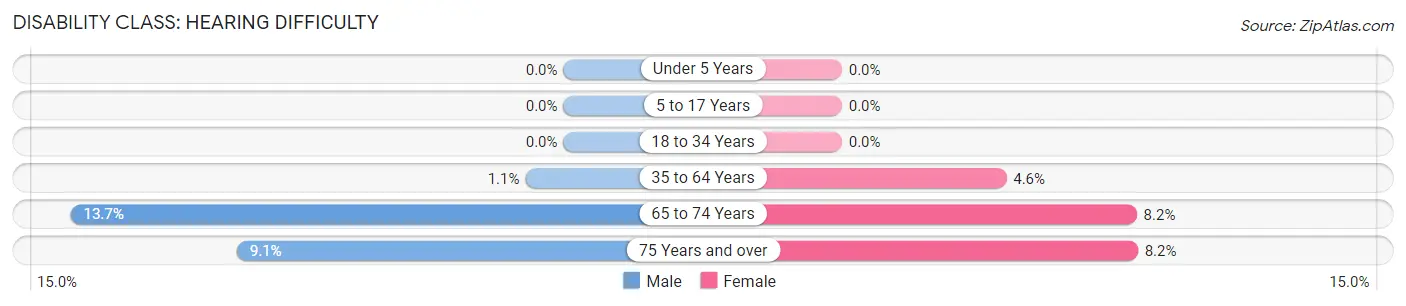
| Age Bracket | Male | Female |
| Under 5 Years | 0 (0.0%) | 0 (0.0%) |
| 5 to 17 Years | 0 (0.0%) | 0 (0.0%) |
| 18 to 34 Years | 0 (0.0%) | 0 (0.0%) |
| 35 to 64 Years | 9 (1.1%) | 43 (4.6%) |
| 65 to 74 Years | 31 (13.7%) | 23 (8.2%) |
| 75 Years and over | 24 (9.1%) | 22 (8.2%) |
Disability Class: Vision Difficulty
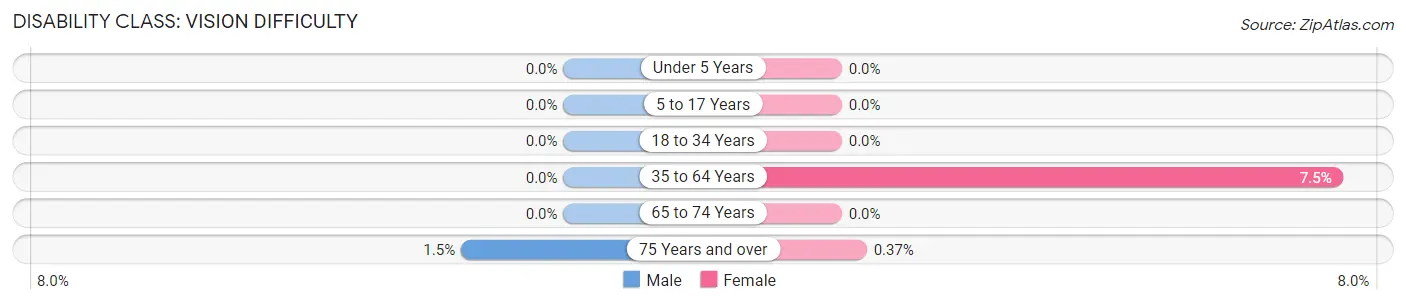
| Age Bracket | Male | Female |
| Under 5 Years | 0 (0.0%) | 0 (0.0%) |
| 5 to 17 Years | 0 (0.0%) | 0 (0.0%) |
| 18 to 34 Years | 0 (0.0%) | 0 (0.0%) |
| 35 to 64 Years | 0 (0.0%) | 70 (7.4%) |
| 65 to 74 Years | 0 (0.0%) | 0 (0.0%) |
| 75 Years and over | 4 (1.5%) | 1 (0.4%) |
Disability Class: Cognitive Difficulty
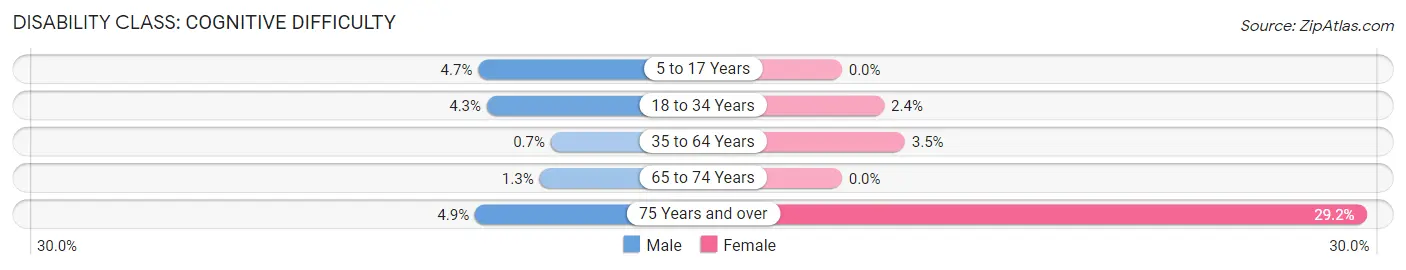
| Age Bracket | Male | Female |
| 5 to 17 Years | 13 (4.7%) | 0 (0.0%) |
| 18 to 34 Years | 12 (4.3%) | 10 (2.4%) |
| 35 to 64 Years | 6 (0.7%) | 33 (3.5%) |
| 65 to 74 Years | 3 (1.3%) | 0 (0.0%) |
| 75 Years and over | 13 (4.9%) | 78 (29.2%) |
Disability Class: Ambulatory Difficulty
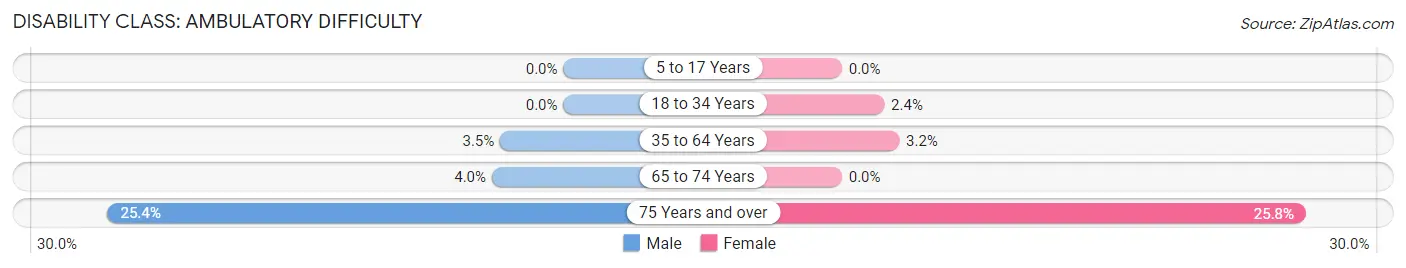
| Age Bracket | Male | Female |
| 5 to 17 Years | 0 (0.0%) | 0 (0.0%) |
| 18 to 34 Years | 0 (0.0%) | 10 (2.4%) |
| 35 to 64 Years | 30 (3.5%) | 30 (3.2%) |
| 65 to 74 Years | 9 (4.0%) | 0 (0.0%) |
| 75 Years and over | 67 (25.4%) | 69 (25.8%) |
Disability Class: Self-Care Difficulty
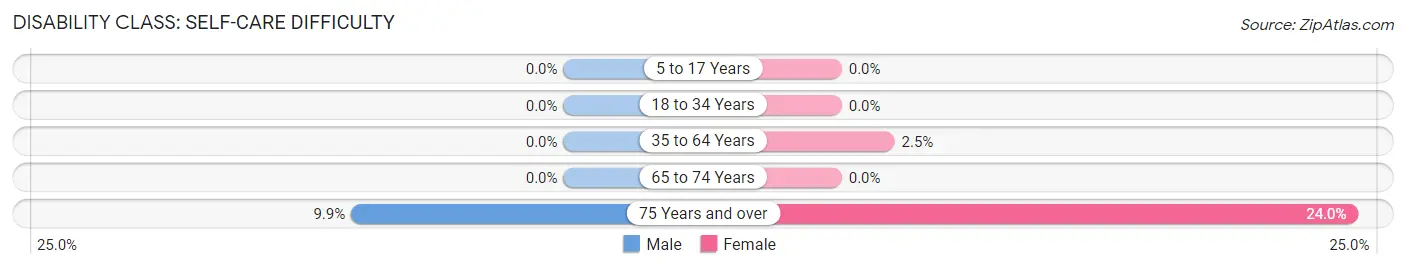
| Age Bracket | Male | Female |
| 5 to 17 Years | 0 (0.0%) | 0 (0.0%) |
| 18 to 34 Years | 0 (0.0%) | 0 (0.0%) |
| 35 to 64 Years | 0 (0.0%) | 23 (2.5%) |
| 65 to 74 Years | 0 (0.0%) | 0 (0.0%) |
| 75 Years and over | 26 (9.9%) | 64 (24.0%) |
Technology Access in Buckingham
Computing Device Access in Buckingham
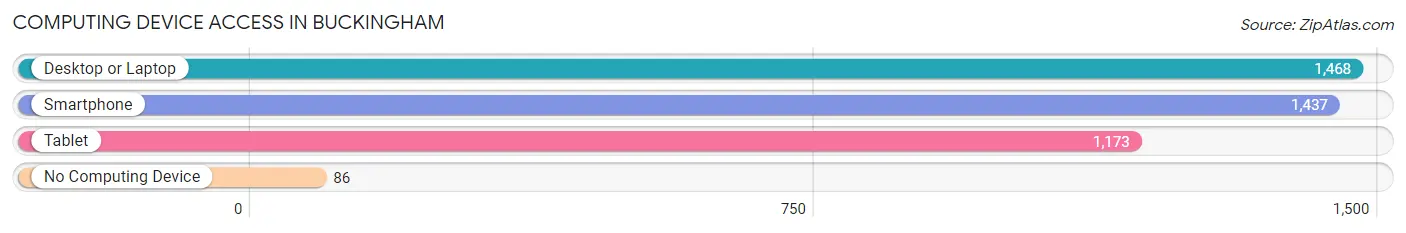
| Device Type | # Households | % Households |
| Desktop or Laptop | 1,468 | 89.0% |
| Smartphone | 1,437 | 87.1% |
| Tablet | 1,173 | 71.1% |
| No Computing Device | 86 | 5.2% |
| Total | 1,649 | 100.0% |
Internet Access in Buckingham
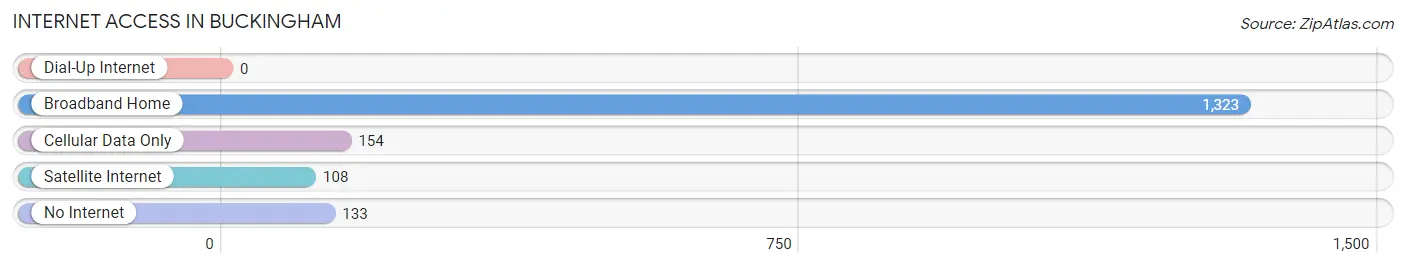
| Internet Type | # Households | % Households |
| Dial-Up Internet | 0 | 0.0% |
| Broadband Home | 1,323 | 80.2% |
| Cellular Data Only | 154 | 9.3% |
| Satellite Internet | 108 | 6.6% |
| No Internet | 133 | 8.1% |
| Total | 1,649 | 100.0% |
Buckingham Summary
Buckingham is an unincorporated community located in Lee County, Florida, United States. It is located on the Caloosahatchee River, about 10 miles east of Fort Myers. The population was estimated to be around 1,000 in 2000.
History
Buckingham was first settled in the late 1800s by settlers from the North. The area was originally known as “Bucktown” and was named after the first settler, William Buckingham. The area was primarily used for farming and ranching. In the early 1900s, the area began to develop into a small town. The first post office was established in 1908 and the town was officially incorporated in 1911.
In the 1920s, the area began to grow rapidly due to the development of the Tamiami Trail, which connected Miami to Tampa. This allowed for increased access to the area and the population began to grow. The town was also home to a number of businesses, including a general store, a hotel, and a movie theater.
In the 1950s, the area began to decline due to the development of nearby cities such as Fort Myers and Cape Coral. The population began to decline and many businesses closed. In the 1970s, the area began to experience a resurgence due to the development of the nearby Babcock Ranch. The population began to increase and the area began to experience a revitalization.
Geography
Buckingham is located in Lee County, Florida, about 10 miles east of Fort Myers. The area is located on the Caloosahatchee River and is surrounded by the Babcock Ranch. The area is mostly flat and is covered in pine and palmetto trees. The area is also home to a number of lakes, including Lake Okeechobee.
Economy
The economy of Buckingham is primarily based on agriculture and tourism. The area is home to a number of farms and ranches, which produce a variety of crops, including citrus, vegetables, and cattle. The area is also home to a number of tourist attractions, including the Babcock Ranch and the Caloosahatchee River.
Demographics
The population of Buckingham was estimated to be around 1,000 in 2000. The population is primarily white (90%) and Hispanic (7%). The median household income is $37,000 and the median home value is $125,000. The area is served by the Lee County School District.
Common Questions
What is the Total Population of Buckingham?
Total Population of Buckingham is 4,288.
What is the Total Male Population of Buckingham?
Total Male Population of Buckingham is 1,935.
What is the Total Female Population of Buckingham?
Total Female Population of Buckingham is 2,353.
What is the Ratio of Males per 100 Females in Buckingham?
There are 82.24 Males per 100 Females in Buckingham.
What is the Ratio of Females per 100 Males in Buckingham?
There are 121.60 Females per 100 Males in Buckingham.
What is the Median Population Age in Buckingham?
Median Population Age in Buckingham is 47.4 Years.
What is the Average Family Size in Buckingham
Average Family Size in Buckingham is 2.9 People.
What is the Average Household Size in Buckingham
Average Household Size in Buckingham is 2.6 People.
What is Per Capita Income in Buckingham?
Per Capita income in Buckingham is $41,145.
What is the Median Family Income in Buckingham?
Median Family Income in Buckingham is $109,817.
What is the Median Household income in Buckingham?
Median Household Income in Buckingham is $103,563.
What is Income or Wage Gap in Buckingham?
Income or Wage Gap in Buckingham is 35.9%.
Women in Buckingham earn 64.1 cents for every dollar earned by a man.
What is Family Income Deficit in Buckingham?
Family Income Deficit in Buckingham is $9,189.
Families that are below poverty line in Buckingham earn $9,189 less on average than the poverty threshold level.
What is Inequality or Gini Index in Buckingham?
Inequality or Gini Index in Buckingham is 0.37.
How Large is the Labor Force in Buckingham?
There are 2,102 People in the Labor Forcein in Buckingham.
What is the Percentage of People in the Labor Force in Buckingham?
57.3% of People are in the Labor Force in Buckingham.
What is the Unemployment Rate in Buckingham?
Unemployment Rate in Buckingham is 4.0%.