Bristol, FL
Bristol Map
Bristol Overview
1,351
TOTAL POPULATION
666
MALE POPULATION
685
FEMALE POPULATION
97.23
MALES / 100 FEMALES
102.85
FEMALES / 100 MALES
39.5
MEDIAN AGE
3.8
AVG FAMILY SIZE
2.8
AVG HOUSEHOLD SIZE
$24,904
PER CAPITA INCOME
$50,694
AVG FAMILY INCOME
$45,042
AVG HOUSEHOLD INCOME
14.6%
WAGE / INCOME GAP [ % ]
85.4¢/ $1
WAGE / INCOME GAP [ $ ]
0.46
INEQUALITY / GINI INDEX
494
LABOR FORCE [ PEOPLE ]
46.0%
PERCENT IN LABOR FORCE
6.5%
UNEMPLOYMENT RATE
Bristol Zip Codes
Bristol Area Codes
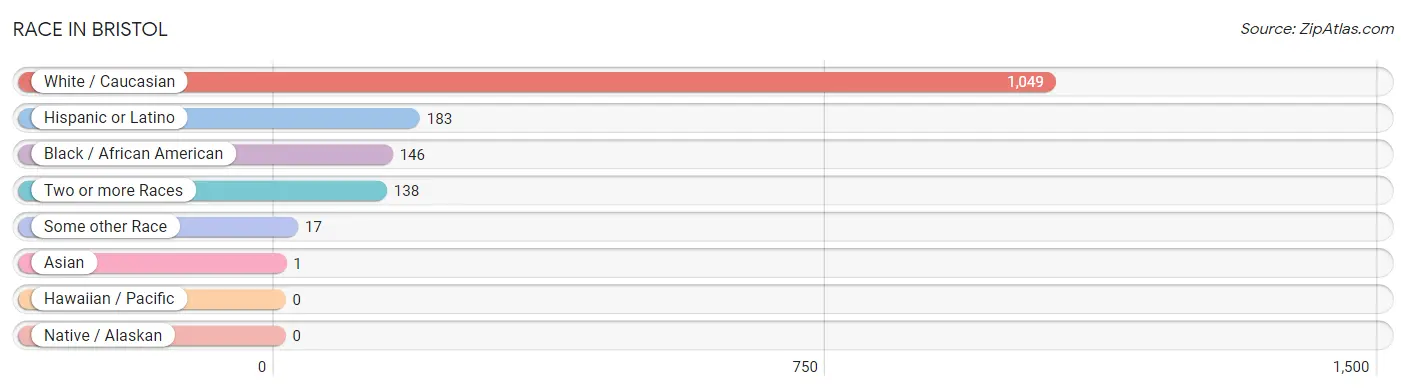
Race in Bristol
The most populous races in Bristol are White / Caucasian (1,049 | 77.6%), Hispanic or Latino (183 | 13.6%), and Black / African American (146 | 10.8%).
| Race | # Population | % Population |
| Asian | 1 | 0.1% |
| Black / African American | 146 | 10.8% |
| Hawaiian / Pacific | 0 | 0.0% |
| Hispanic or Latino | 183 | 13.6% |
| Native / Alaskan | 0 | 0.0% |
| White / Caucasian | 1,049 | 77.6% |
| Two or more Races | 138 | 10.2% |
| Some other Race | 17 | 1.3% |
| Total | 1,351 | 100.0% |
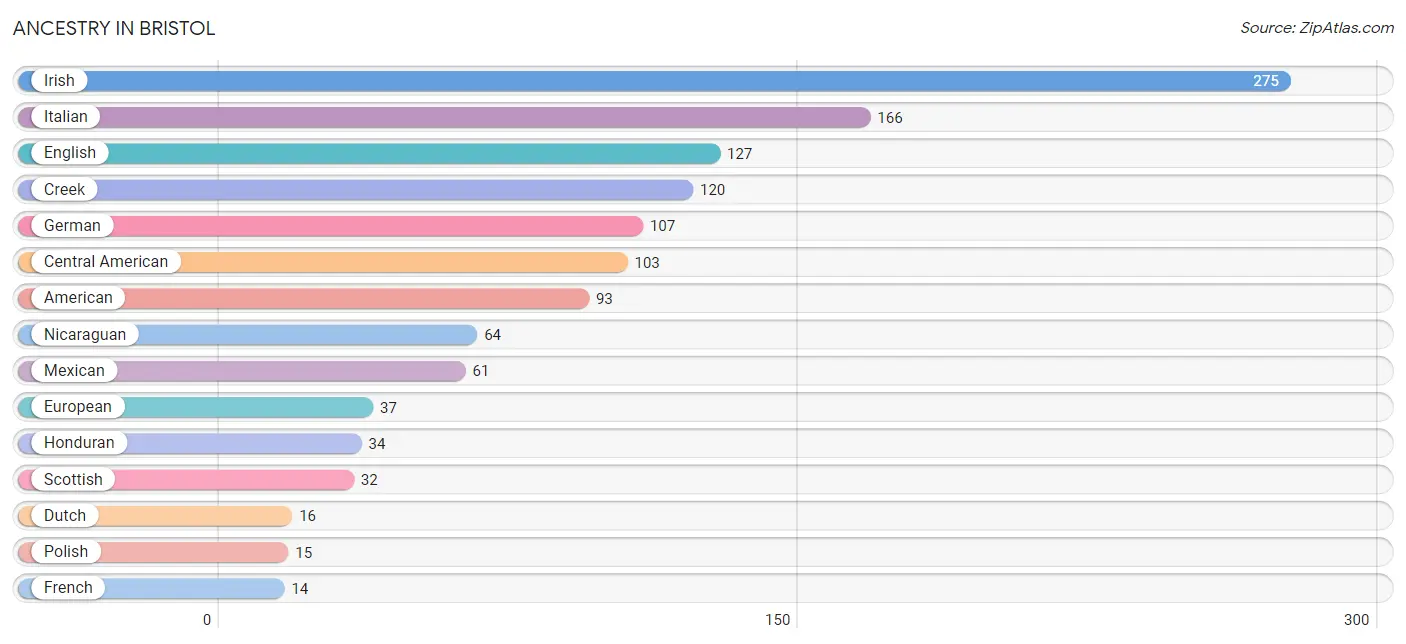
Ancestry in Bristol
The most populous ancestries reported in Bristol are Irish (275 | 20.4%), Italian (166 | 12.3%), English (127 | 9.4%), Creek (120 | 8.9%), and German (107 | 7.9%), together accounting for 58.9% of all Bristol residents.
| Ancestry | # Population | % Population |
| American | 93 | 6.9% |
| Arab | 8 | 0.6% |
| British | 1 | 0.1% |
| Central American | 103 | 7.6% |
| Cherokee | 5 | 0.4% |
| Creek | 120 | 8.9% |
| Cuban | 10 | 0.7% |
| Czech | 3 | 0.2% |
| Dutch | 16 | 1.2% |
| Egyptian | 8 | 0.6% |
| English | 127 | 9.4% |
| European | 37 | 2.7% |
| French | 14 | 1.0% |
| German | 107 | 7.9% |
| Guatemalan | 5 | 0.4% |
| Honduran | 34 | 2.5% |
| Irish | 275 | 20.4% |
| Italian | 166 | 12.3% |
| Mexican | 61 | 4.5% |
| Nicaraguan | 64 | 4.7% |
| Norwegian | 2 | 0.2% |
| Polish | 15 | 1.1% |
| Portuguese | 5 | 0.4% |
| Russian | 9 | 0.7% |
| Scotch-Irish | 5 | 0.4% |
| Scottish | 32 | 2.4% |
| Spaniard | 9 | 0.7% |
| Sri Lankan | 2 | 0.2% | View All 28 Rows |
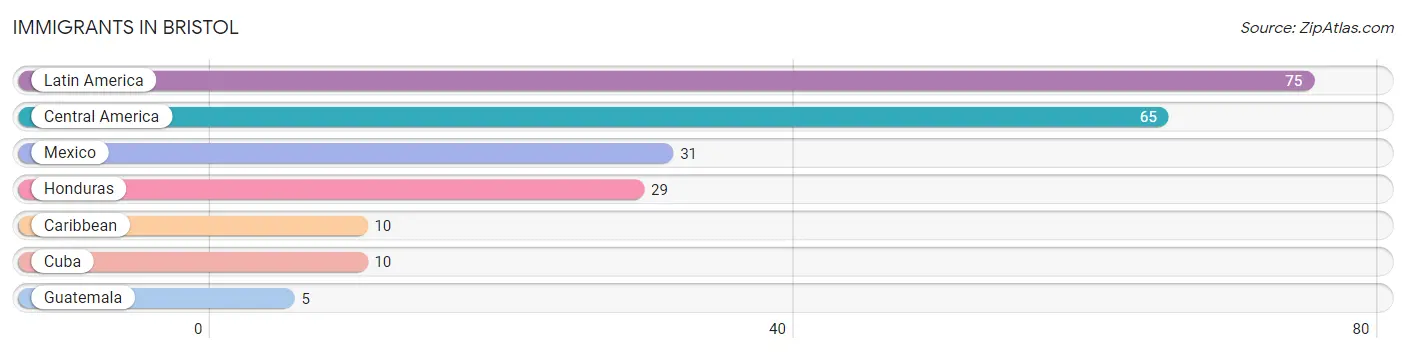
Immigrants in Bristol
The most numerous immigrant groups reported in Bristol came from Latin America (75 | 5.6%), Central America (65 | 4.8%), Mexico (31 | 2.3%), Honduras (29 | 2.1%), and Caribbean (10 | 0.7%), together accounting for 15.5% of all Bristol residents.
| Immigration Origin | # Population | % Population |
| Caribbean | 10 | 0.7% |
| Central America | 65 | 4.8% |
| Cuba | 10 | 0.7% |
| Guatemala | 5 | 0.4% |
| Honduras | 29 | 2.1% |
| Latin America | 75 | 5.6% |
| Mexico | 31 | 2.3% | View All 7 Rows |
Sex and Age in Bristol
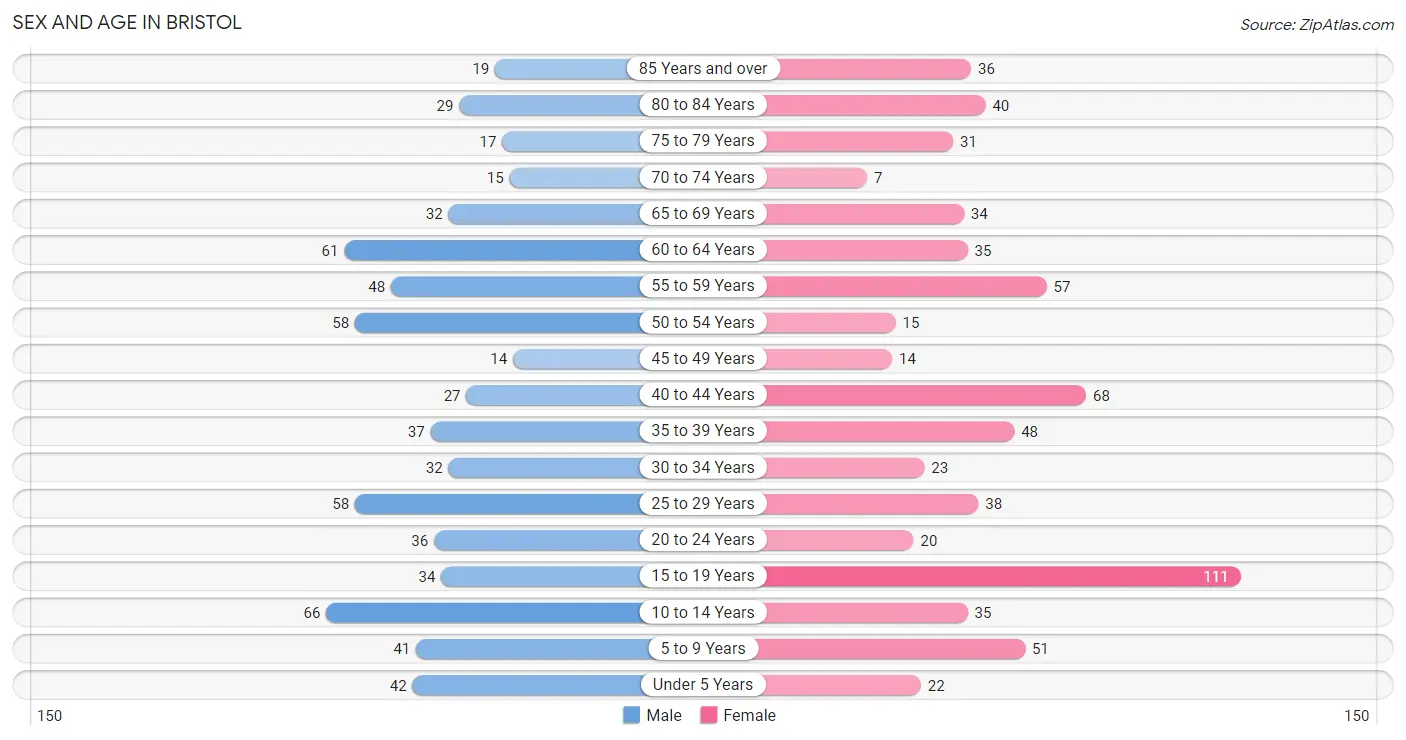
Sex and Age in Bristol
The most populous age groups in Bristol are 10 to 14 Years (66 | 9.9%) for men and 15 to 19 Years (111 | 16.2%) for women.
| Age Bracket | Male | Female |
| Under 5 Years | 42 (6.3%) | 22 (3.2%) |
| 5 to 9 Years | 41 (6.2%) | 51 (7.4%) |
| 10 to 14 Years | 66 (9.9%) | 35 (5.1%) |
| 15 to 19 Years | 34 (5.1%) | 111 (16.2%) |
| 20 to 24 Years | 36 (5.4%) | 20 (2.9%) |
| 25 to 29 Years | 58 (8.7%) | 38 (5.6%) |
| 30 to 34 Years | 32 (4.8%) | 23 (3.4%) |
| 35 to 39 Years | 37 (5.6%) | 48 (7.0%) |
| 40 to 44 Years | 27 (4.1%) | 68 (9.9%) |
| 45 to 49 Years | 14 (2.1%) | 14 (2.0%) |
| 50 to 54 Years | 58 (8.7%) | 15 (2.2%) |
| 55 to 59 Years | 48 (7.2%) | 57 (8.3%) |
| 60 to 64 Years | 61 (9.2%) | 35 (5.1%) |
| 65 to 69 Years | 32 (4.8%) | 34 (5.0%) |
| 70 to 74 Years | 15 (2.2%) | 7 (1.0%) |
| 75 to 79 Years | 17 (2.5%) | 31 (4.5%) |
| 80 to 84 Years | 29 (4.3%) | 40 (5.8%) |
| 85 Years and over | 19 (2.9%) | 36 (5.3%) |
| Total | 666 (100.0%) | 685 (100.0%) |
Families and Households in Bristol
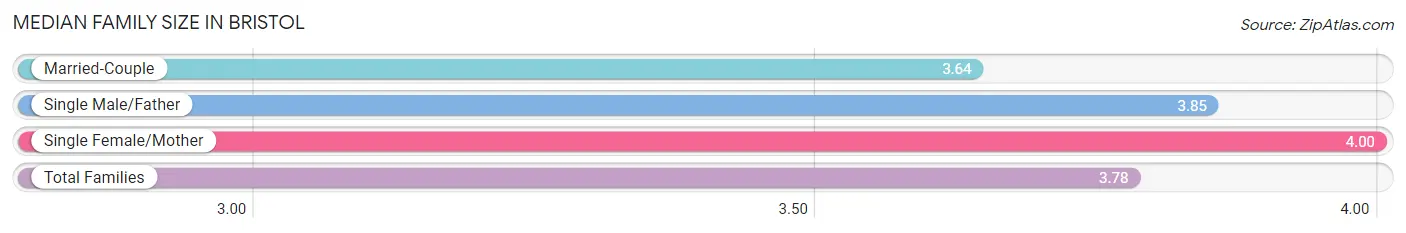
Median Family Size in Bristol
The median family size in Bristol is 3.78 persons per family, with single female/mother families (85 | 31.8%) accounting for the largest median family size of 4 persons per family. On the other hand, married-couple families (143 | 53.6%) represent the smallest median family size with 3.64 persons per family.
| Family Type | # Families | Family Size |
| Married-Couple | 143 (53.6%) | 3.64 |
| Single Male/Father | 39 (14.6%) | 3.85 |
| Single Female/Mother | 85 (31.8%) | 4.00 |
| Total Families | 267 (100.0%) | 3.78 |
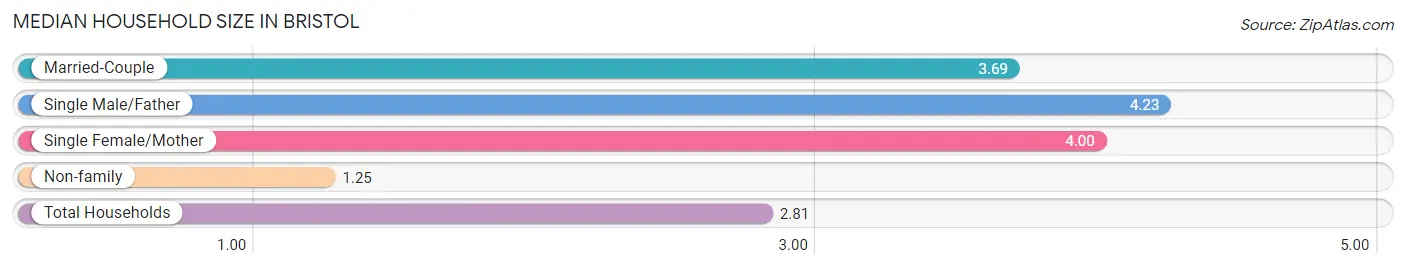
Median Household Size in Bristol
The median household size in Bristol is 2.81 persons per household, with single male/father households (39 | 8.7%) accounting for the largest median household size of 4.23 persons per household. non-family households (182 | 40.5%) represent the smallest median household size with 1.25 persons per household.
| Household Type | # Households | Household Size |
| Married-Couple | 143 (31.9%) | 3.69 |
| Single Male/Father | 39 (8.7%) | 4.23 |
| Single Female/Mother | 85 (18.9%) | 4.00 |
| Non-family | 182 (40.5%) | 1.25 |
| Total Households | 449 (100.0%) | 2.81 |
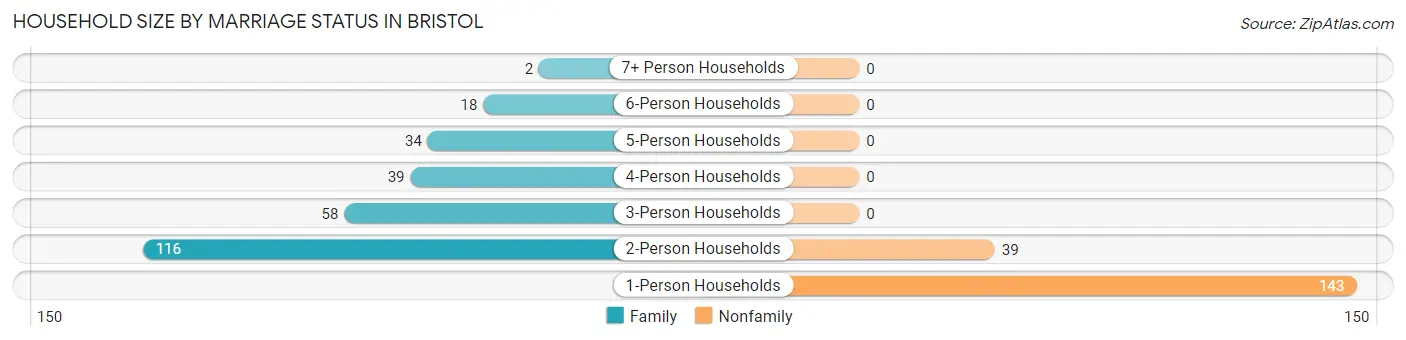
Household Size by Marriage Status in Bristol
Out of a total of 449 households in Bristol, 267 (59.5%) are family households, while 182 (40.5%) are nonfamily households. The most numerous type of family households are 2-person households, comprising 116, and the most common type of nonfamily households are 1-person households, comprising 143.
| Household Size | Family Households | Nonfamily Households |
| 1-Person Households | - | 143 (31.9%) |
| 2-Person Households | 116 (25.8%) | 39 (8.7%) |
| 3-Person Households | 58 (12.9%) | 0 (0.0%) |
| 4-Person Households | 39 (8.7%) | 0 (0.0%) |
| 5-Person Households | 34 (7.6%) | 0 (0.0%) |
| 6-Person Households | 18 (4.0%) | 0 (0.0%) |
| 7+ Person Households | 2 (0.4%) | 0 (0.0%) |
| Total | 267 (59.5%) | 182 (40.5%) |
Female Fertility in Bristol
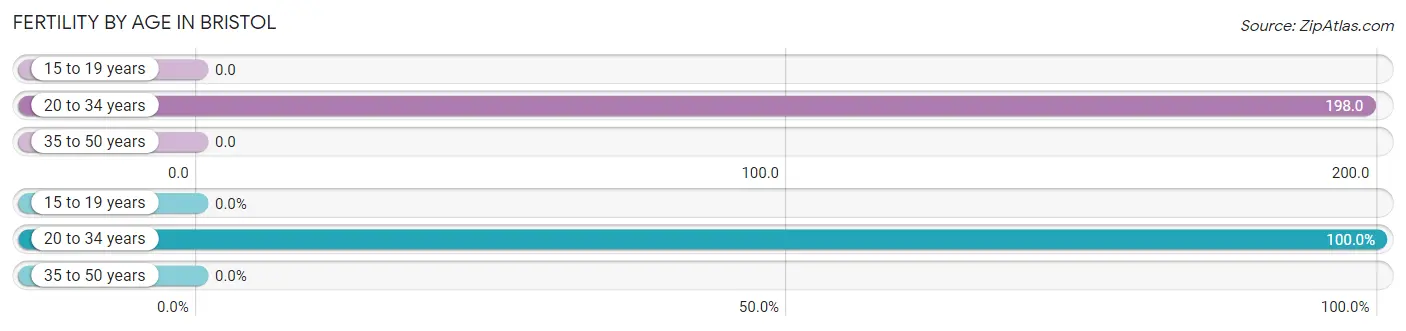
Fertility by Age in Bristol
Average fertility rate in Bristol is 48.0 births per 1,000 women. Women in the age bracket of 20 to 34 years have the highest fertility rate with 198.0 births per 1,000 women. Women in the age bracket of 20 to 34 years acount for 100.0% of all women with births.
| Age Bracket | Women with Births | Births / 1,000 Women |
| 15 to 19 years | 0 (0.0%) | 0.0 |
| 20 to 34 years | 16 (100.0%) | 198.0 |
| 35 to 50 years | 0 (0.0%) | 0.0 |
| Total | 16 (100.0%) | 48.0 |
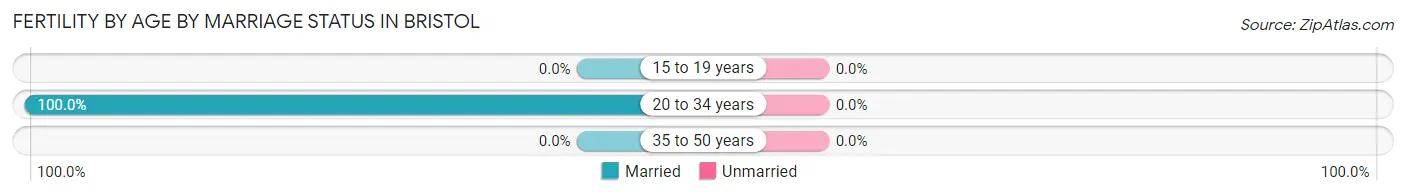
Fertility by Age by Marriage Status in Bristol
| Age Bracket | Married | Unmarried |
| 15 to 19 years | 0 (0.0%) | 0 (0.0%) |
| 20 to 34 years | 16 (100.0%) | 0 (0.0%) |
| 35 to 50 years | 0 (0.0%) | 0 (0.0%) |
| Total | 16 (100.0%) | 0 (0.0%) |
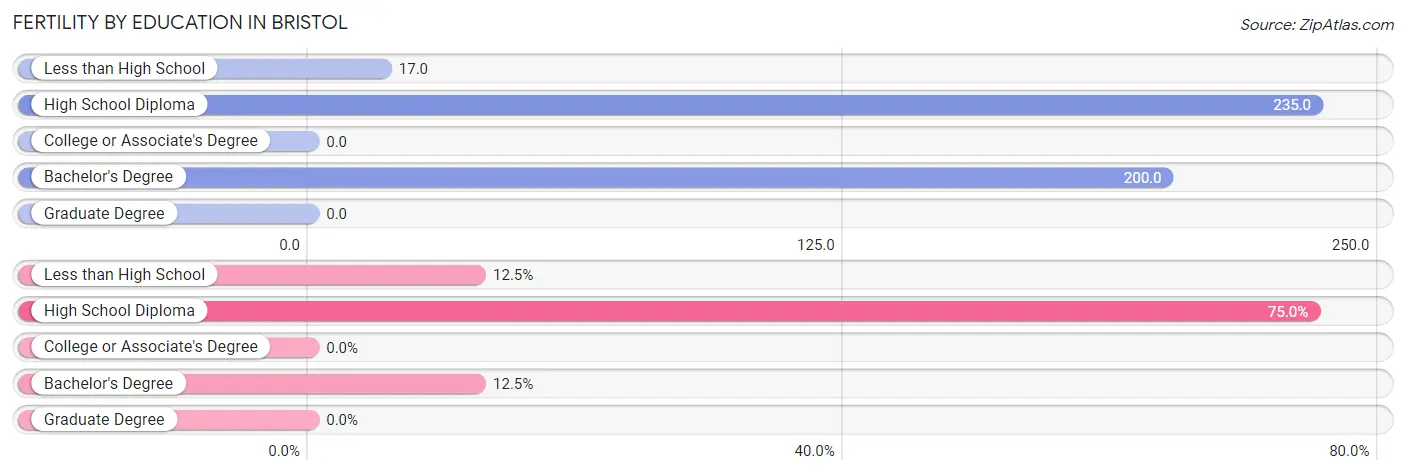
Fertility by Education in Bristol
| Educational Attainment | Women with Births | Births / 1,000 Women |
| Less than High School | 2 (12.5%) | 17.0 |
| High School Diploma | 12 (75.0%) | 235.0 |
| College or Associate's Degree | 0 (0.0%) | 0.0 |
| Bachelor's Degree | 2 (12.5%) | 200.0 |
| Graduate Degree | 0 (0.0%) | 0.0 |
| Total | 16 (100.0%) | 48.0 |
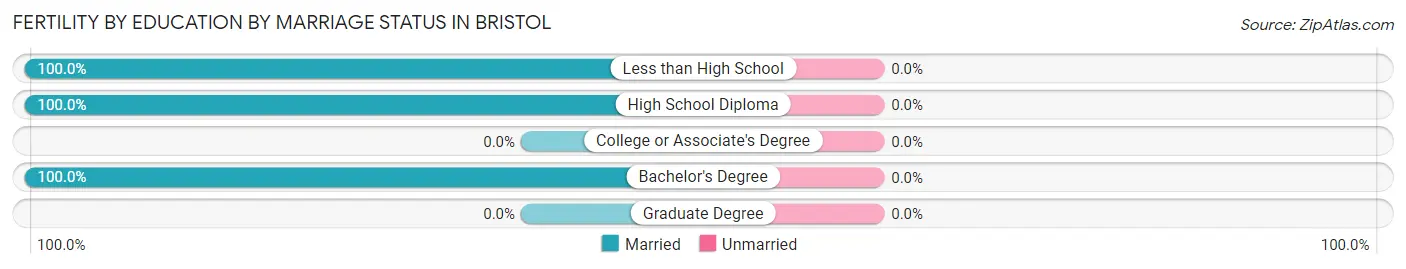
Fertility by Education by Marriage Status in Bristol
| Educational Attainment | Married | Unmarried |
| Less than High School | 2 (100.0%) | 0 (0.0%) |
| High School Diploma | 12 (100.0%) | 0 (0.0%) |
| College or Associate's Degree | 0 (0.0%) | 0 (0.0%) |
| Bachelor's Degree | 2 (100.0%) | 0 (0.0%) |
| Graduate Degree | 0 (0.0%) | 0 (0.0%) |
| Total | 16 (100.0%) | 0 (0.0%) |
Income in Bristol
Income Overview in Bristol
Per Capita Income in Bristol is $24,904, while median incomes of families and households are $50,694 and $45,042 respectively.
| Characteristic | Number | Measure |
| Per Capita Income | 1,351 | $24,904 |
| Median Family Income | 267 | $50,694 |
| Mean Family Income | 267 | $76,472 |
| Median Household Income | 449 | $45,042 |
| Mean Household Income | 449 | $64,732 |
| Income Deficit | 267 | $0 |
| Wage / Income Gap (%) | 1,351 | 14.65% |
| Wage / Income Gap ($) | 1,351 | 85.35¢ per $1 |
| Gini / Inequality Index | 1,351 | 0.46 |
Earnings by Sex in Bristol
Average Earnings in Bristol are $24,983, $24,375 for men and $28,558 for women, a difference of 14.6%.
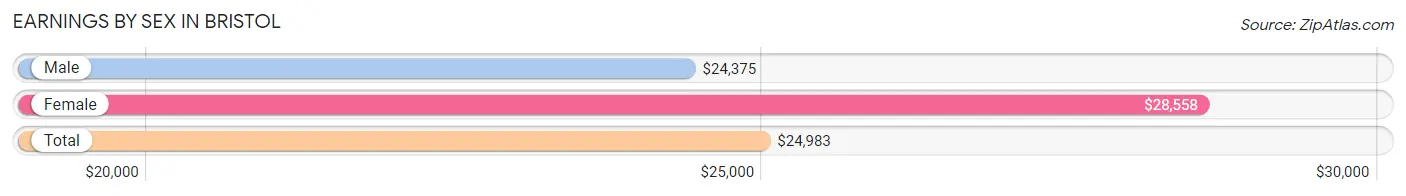
| Sex | Number | Average Earnings |
| Male | 259 (43.1%) | $24,375 |
| Female | 342 (56.9%) | $28,558 |
| Total | 601 (100.0%) | $24,983 |
Earnings by Sex by Income Bracket in Bristol
The most common earnings brackets in Bristol are $22,500 to $24,999 for men (50 | 19.3%) and $2,499 or less for women (87 | 25.4%).
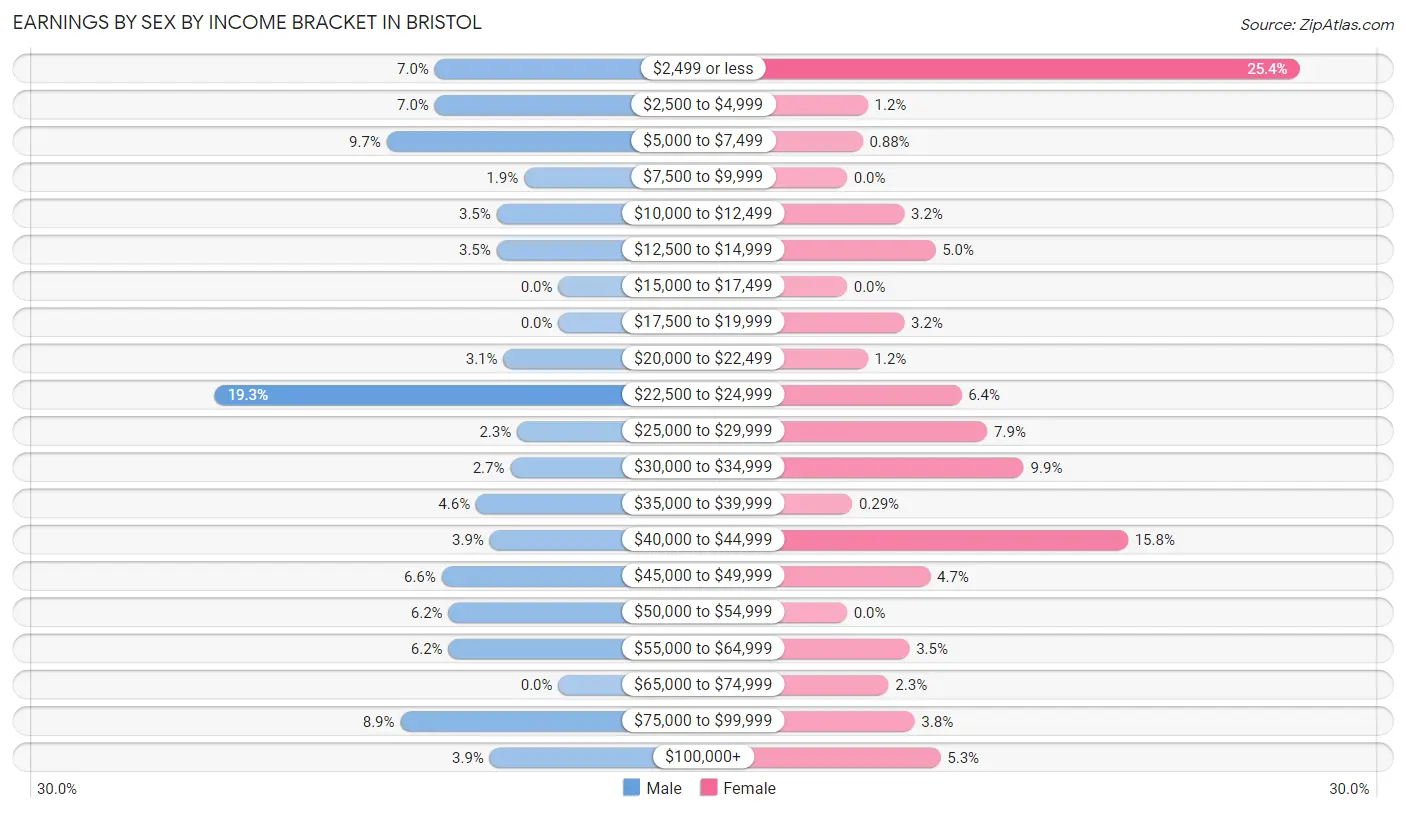
| Income | Male | Female |
| $2,499 or less | 18 (7.0%) | 87 (25.4%) |
| $2,500 to $4,999 | 18 (7.0%) | 4 (1.2%) |
| $5,000 to $7,499 | 25 (9.7%) | 3 (0.9%) |
| $7,500 to $9,999 | 5 (1.9%) | 0 (0.0%) |
| $10,000 to $12,499 | 9 (3.5%) | 11 (3.2%) |
| $12,500 to $14,999 | 9 (3.5%) | 17 (5.0%) |
| $15,000 to $17,499 | 0 (0.0%) | 0 (0.0%) |
| $17,500 to $19,999 | 0 (0.0%) | 11 (3.2%) |
| $20,000 to $22,499 | 8 (3.1%) | 4 (1.2%) |
| $22,500 to $24,999 | 50 (19.3%) | 22 (6.4%) |
| $25,000 to $29,999 | 6 (2.3%) | 27 (7.9%) |
| $30,000 to $34,999 | 7 (2.7%) | 34 (9.9%) |
| $35,000 to $39,999 | 12 (4.6%) | 1 (0.3%) |
| $40,000 to $44,999 | 10 (3.9%) | 54 (15.8%) |
| $45,000 to $49,999 | 17 (6.6%) | 16 (4.7%) |
| $50,000 to $54,999 | 16 (6.2%) | 0 (0.0%) |
| $55,000 to $64,999 | 16 (6.2%) | 12 (3.5%) |
| $65,000 to $74,999 | 0 (0.0%) | 8 (2.3%) |
| $75,000 to $99,999 | 23 (8.9%) | 13 (3.8%) |
| $100,000+ | 10 (3.9%) | 18 (5.3%) |
| Total | 259 (100.0%) | 342 (100.0%) |
Earnings by Sex by Educational Attainment in Bristol
Average earnings in Bristol are $24,625 for men and $32,292 for women, a difference of 23.7%. Men with an educational attainment of bachelor's degree enjoy the highest average annual earnings of $109,167, while those with high school diploma education earn the least with $24,089. Women with an educational attainment of college or associate's degree earn the most with the average annual earnings of $40,382, while those with graduate degree education have the smallest earnings of $28,938.
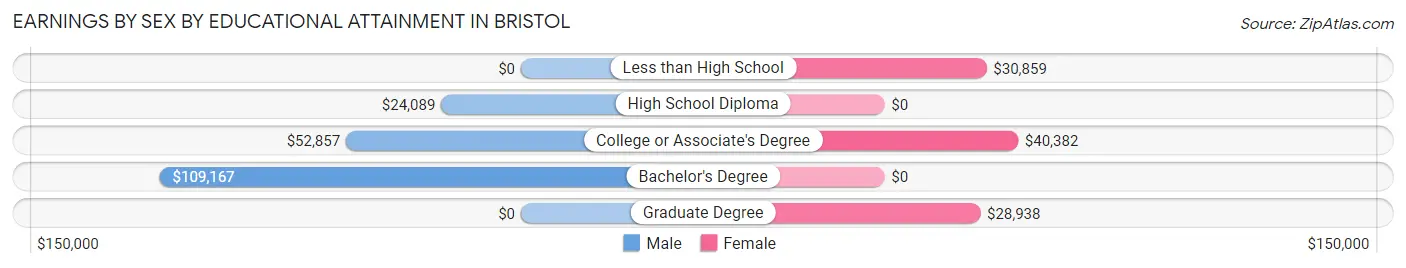
| Educational Attainment | Male Income | Female Income |
| Less than High School | - | - |
| High School Diploma | $24,089 | $0 |
| College or Associate's Degree | $52,857 | $40,382 |
| Bachelor's Degree | $109,167 | $0 |
| Graduate Degree | - | - |
| Total | $24,625 | $32,292 |
Family Income in Bristol
Family Income Brackets in Bristol
According to the Bristol family income data, there are 59 families falling into the $35,000 to $49,999 income range, which is the most common income bracket and makes up 22.1% of all families.
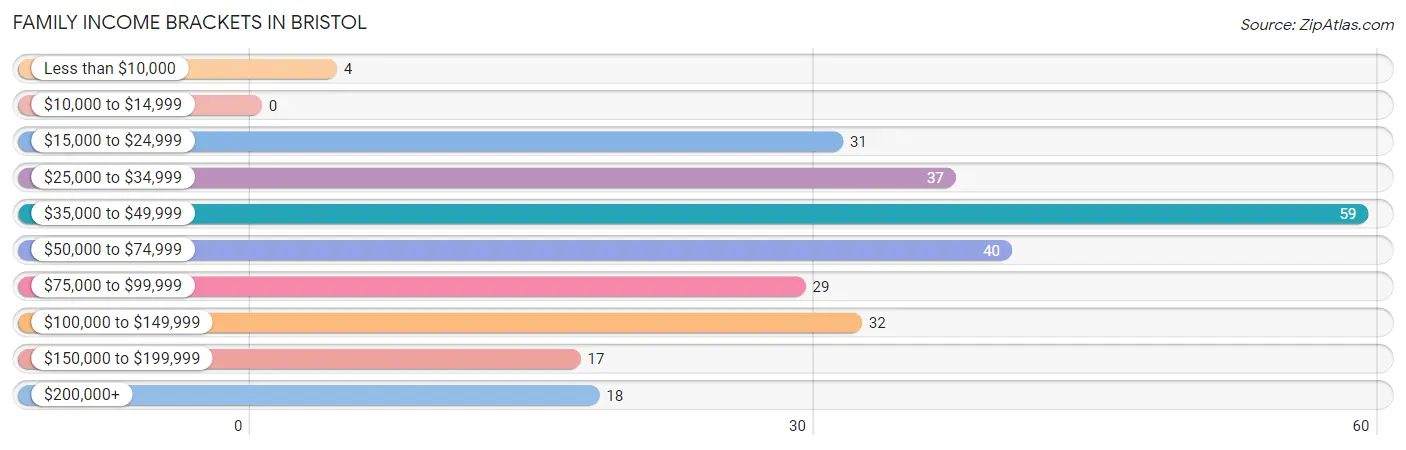
| Income Bracket | # Families | % Families |
| Less than $10,000 | 4 | 1.5% |
| $10,000 to $14,999 | 0 | 0.0% |
| $15,000 to $24,999 | 31 | 11.6% |
| $25,000 to $34,999 | 37 | 13.9% |
| $35,000 to $49,999 | 59 | 22.1% |
| $50,000 to $74,999 | 40 | 15.0% |
| $75,000 to $99,999 | 29 | 10.9% |
| $100,000 to $149,999 | 32 | 12.0% |
| $150,000 to $199,999 | 17 | 6.4% |
| $200,000+ | 18 | 6.7% |
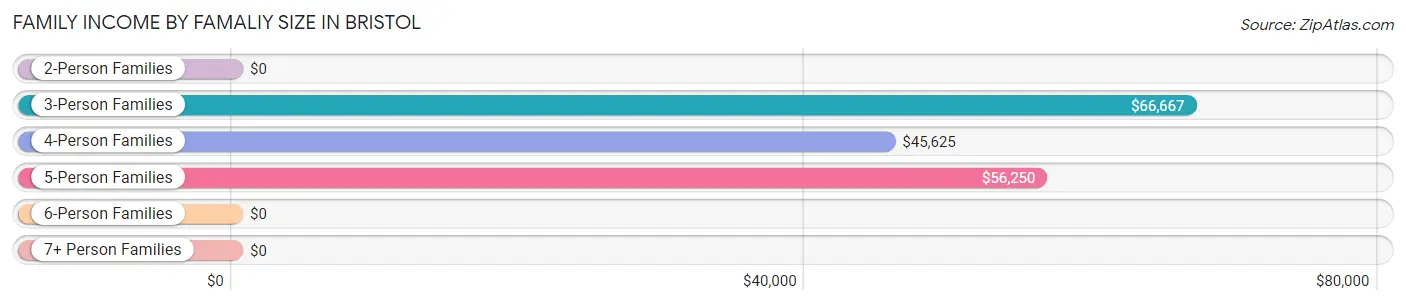
Family Income by Famaliy Size in Bristol
3-person families (58 | 21.7%) account for the highest median family income in Bristol with $66,667 per family, while 3-person families (58 | 21.7%) have the highest median income of $22,222 per family member.
| Income Bracket | # Families | Median Income |
| 2-Person Families | 116 (43.4%) | $0 |
| 3-Person Families | 58 (21.7%) | $66,667 |
| 4-Person Families | 51 (19.1%) | $45,625 |
| 5-Person Families | 25 (9.4%) | $56,250 |
| 6-Person Families | 15 (5.6%) | $0 |
| 7+ Person Families | 2 (0.7%) | $0 |
| Total | 267 (100.0%) | $50,694 |
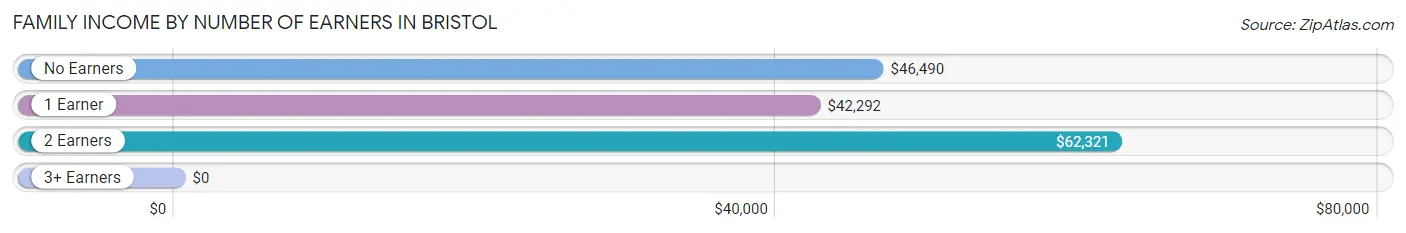
Family Income by Number of Earners in Bristol
| Number of Earners | # Families | Median Income |
| No Earners | 79 (29.6%) | $46,490 |
| 1 Earner | 63 (23.6%) | $42,292 |
| 2 Earners | 101 (37.8%) | $62,321 |
| 3+ Earners | 24 (9.0%) | $0 |
| Total | 267 (100.0%) | $50,694 |
Household Income in Bristol
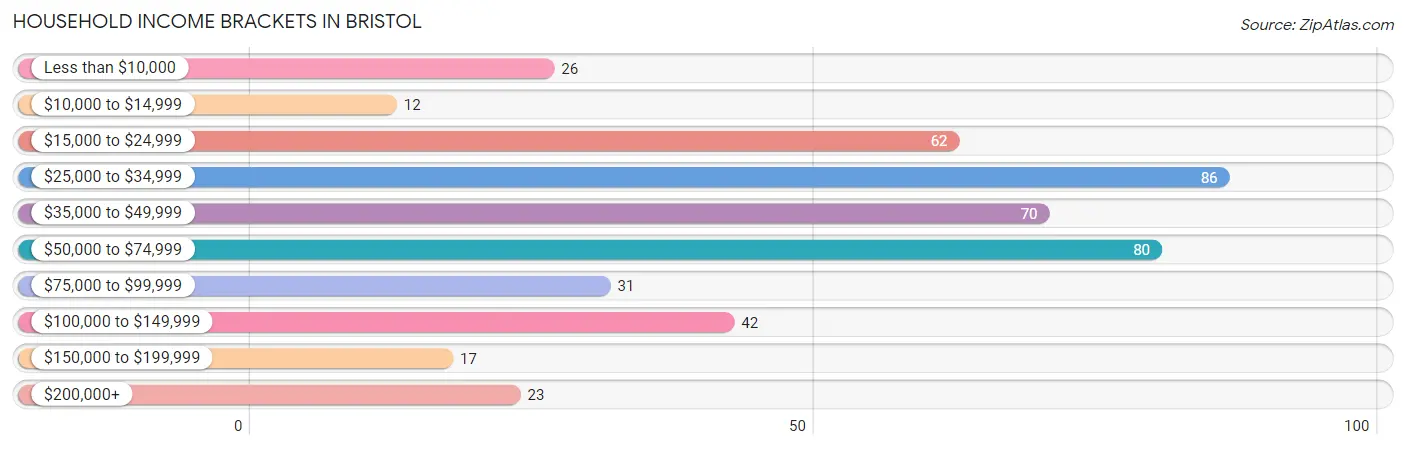
Household Income Brackets in Bristol
With 86 households falling in the category, the $25,000 to $34,999 income range is the most frequent in Bristol, accounting for 19.2% of all households. In contrast, only 12 households (2.7%) fall into the $10,000 to $14,999 income bracket, making it the least populous group.
| Income Bracket | # Households | % Households |
| Less than $10,000 | 26 | 5.8% |
| $10,000 to $14,999 | 12 | 2.7% |
| $15,000 to $24,999 | 62 | 13.8% |
| $25,000 to $34,999 | 86 | 19.2% |
| $35,000 to $49,999 | 70 | 15.6% |
| $50,000 to $74,999 | 80 | 17.8% |
| $75,000 to $99,999 | 31 | 6.9% |
| $100,000 to $149,999 | 42 | 9.4% |
| $150,000 to $199,999 | 17 | 3.8% |
| $200,000+ | 23 | 5.1% |
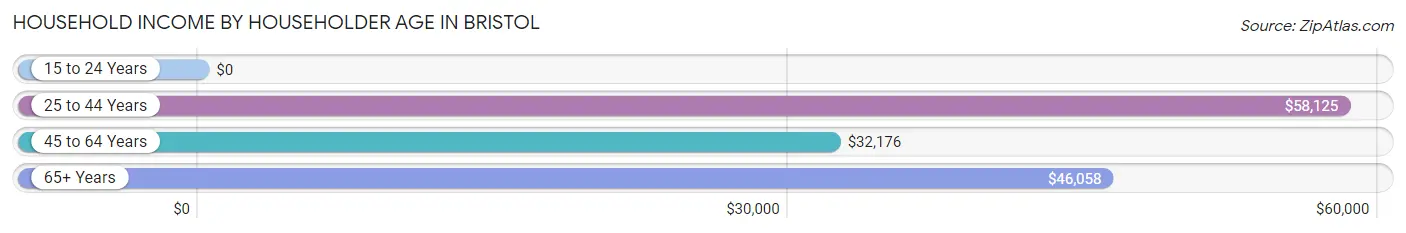
Household Income by Householder Age in Bristol
The median household income in Bristol is $45,042, with the highest median household income of $58,125 found in the 25 to 44 years age bracket for the primary householder. A total of 139 households (31.0%) fall into this category. Meanwhile, the 15 to 24 years age bracket for the primary householder has the lowest median household income of $0, with 23 households (5.1%) in this group.
| Income Bracket | # Households | Median Income |
| 15 to 24 Years | 23 (5.1%) | $0 |
| 25 to 44 Years | 139 (31.0%) | $58,125 |
| 45 to 64 Years | 153 (34.1%) | $32,176 |
| 65+ Years | 134 (29.8%) | $46,058 |
| Total | 449 (100.0%) | $45,042 |
Poverty in Bristol
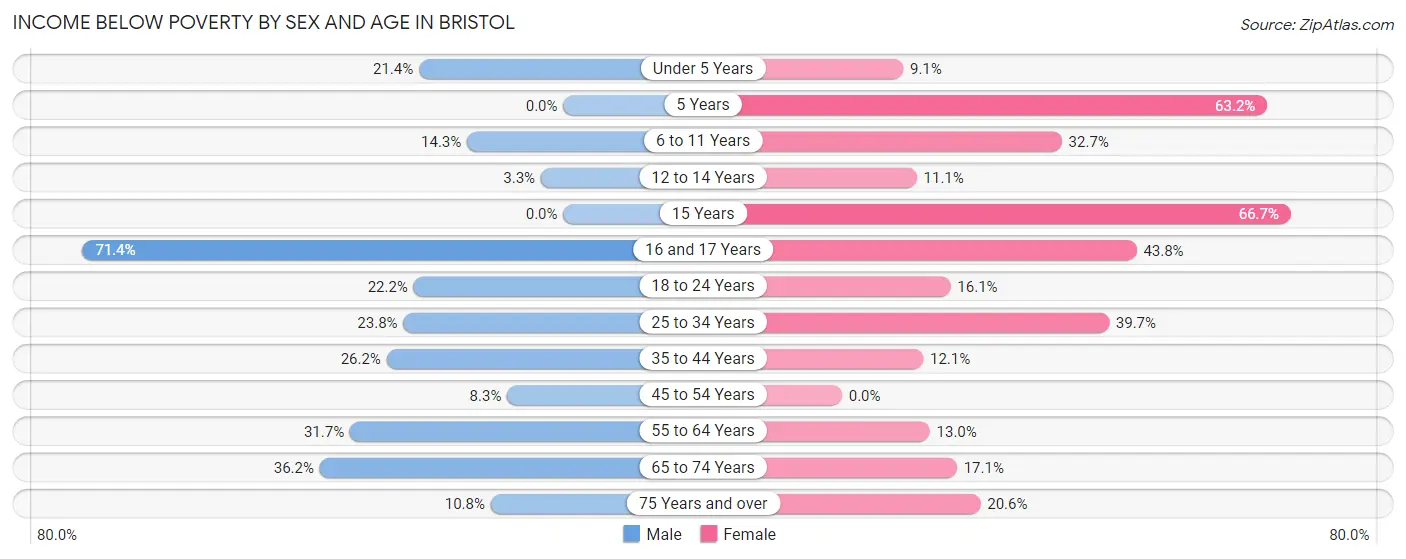
Income Below Poverty by Sex and Age in Bristol
With 21.0% poverty level for males and 21.1% for females among the residents of Bristol, 16 and 17 year old males and 15 year old females are the most vulnerable to poverty, with 5 males (71.4%) and 10 females (66.7%) in their respective age groups living below the poverty level.
| Age Bracket | Male | Female |
| Under 5 Years | 9 (21.4%) | 2 (9.1%) |
| 5 Years | 0 (0.0%) | 12 (63.2%) |
| 6 to 11 Years | 11 (14.3%) | 16 (32.7%) |
| 12 to 14 Years | 1 (3.3%) | 2 (11.1%) |
| 15 Years | 0 (0.0%) | 10 (66.7%) |
| 16 and 17 Years | 5 (71.4%) | 7 (43.8%) |
| 18 to 24 Years | 12 (22.2%) | 15 (16.1%) |
| 25 to 34 Years | 19 (23.7%) | 23 (39.7%) |
| 35 to 44 Years | 16 (26.2%) | 14 (12.1%) |
| 45 to 54 Years | 6 (8.3%) | 0 (0.0%) |
| 55 to 64 Years | 32 (31.7%) | 12 (13.0%) |
| 65 to 74 Years | 17 (36.2%) | 7 (17.1%) |
| 75 Years and over | 7 (10.8%) | 22 (20.6%) |
| Total | 135 (21.0%) | 142 (21.1%) |
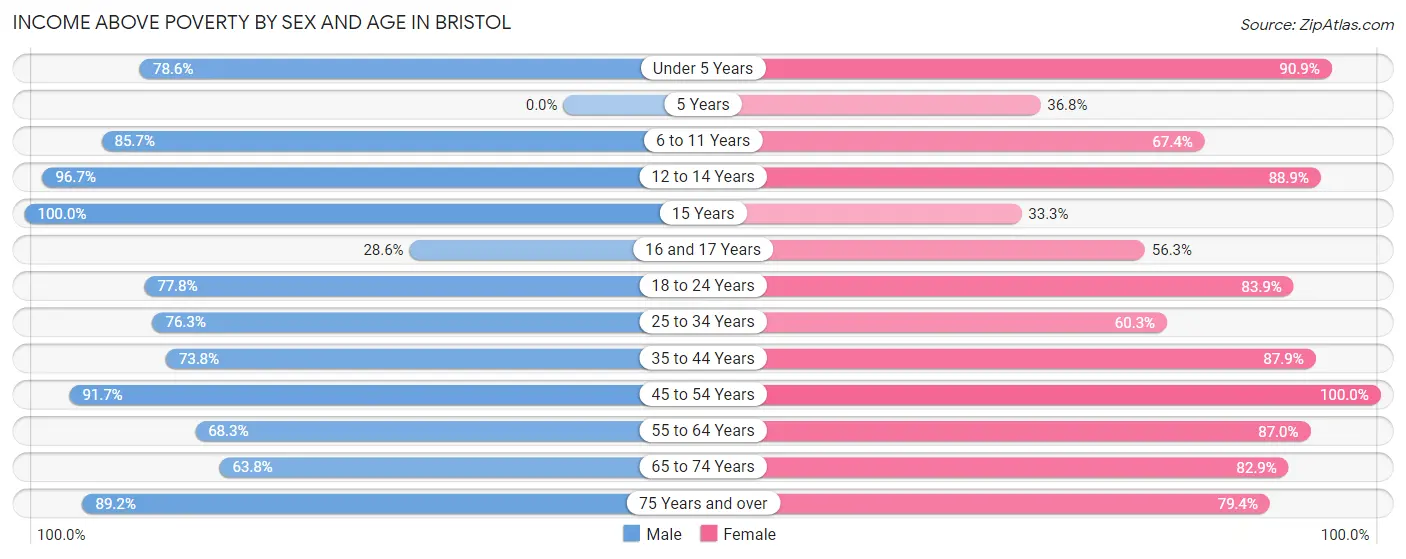
Income Above Poverty by Sex and Age in Bristol
According to the poverty statistics in Bristol, males aged 15 years and females aged 45 to 54 years are the age groups that are most secure financially, with 100.0% of males and 100.0% of females in these age groups living above the poverty line.
| Age Bracket | Male | Female |
| Under 5 Years | 33 (78.6%) | 20 (90.9%) |
| 5 Years | 0 (0.0%) | 7 (36.8%) |
| 6 to 11 Years | 66 (85.7%) | 33 (67.3%) |
| 12 to 14 Years | 29 (96.7%) | 16 (88.9%) |
| 15 Years | 6 (100.0%) | 5 (33.3%) |
| 16 and 17 Years | 2 (28.6%) | 9 (56.2%) |
| 18 to 24 Years | 42 (77.8%) | 78 (83.9%) |
| 25 to 34 Years | 61 (76.2%) | 35 (60.3%) |
| 35 to 44 Years | 45 (73.8%) | 102 (87.9%) |
| 45 to 54 Years | 66 (91.7%) | 26 (100.0%) |
| 55 to 64 Years | 69 (68.3%) | 80 (87.0%) |
| 65 to 74 Years | 30 (63.8%) | 34 (82.9%) |
| 75 Years and over | 58 (89.2%) | 85 (79.4%) |
| Total | 507 (79.0%) | 530 (78.9%) |
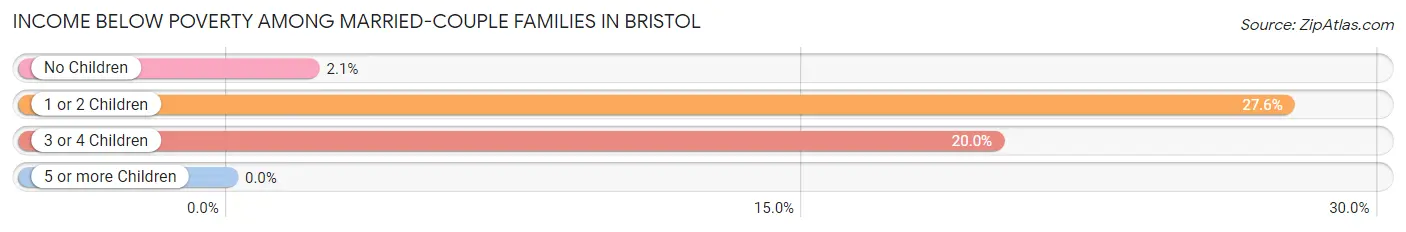
Income Below Poverty Among Married-Couple Families in Bristol
The poverty statistics for married-couple families in Bristol show that 9.8% or 14 of the total 143 families live below the poverty line. Families with 1 or 2 children have the highest poverty rate of 27.6%, comprising of 8 families. On the other hand, families with no children have the lowest poverty rate of 2.1%, which includes 2 families.
| Children | Above Poverty | Below Poverty |
| No Children | 92 (97.9%) | 2 (2.1%) |
| 1 or 2 Children | 21 (72.4%) | 8 (27.6%) |
| 3 or 4 Children | 16 (80.0%) | 4 (20.0%) |
| 5 or more Children | 0 (0.0%) | 0 (0.0%) |
| Total | 129 (90.2%) | 14 (9.8%) |
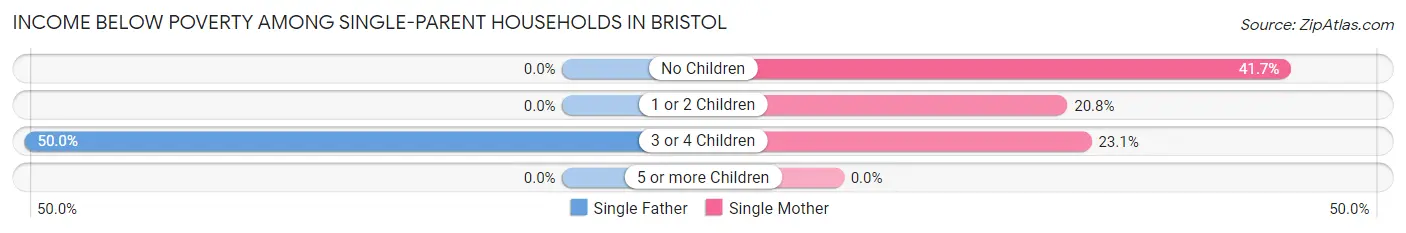
Income Below Poverty Among Single-Parent Households in Bristol
According to the poverty data in Bristol, 5.1% or 2 single-father households and 27.1% or 23 single-mother households are living below the poverty line. Among single-father households, those with 3 or 4 children have the highest poverty rate, with 2 households (50.0%) experiencing poverty. Likewise, among single-mother households, those with no children have the highest poverty rate, with 10 households (41.7%) falling below the poverty line.
| Children | Single Father | Single Mother |
| No Children | 0 (0.0%) | 10 (41.7%) |
| 1 or 2 Children | 0 (0.0%) | 10 (20.8%) |
| 3 or 4 Children | 2 (50.0%) | 3 (23.1%) |
| 5 or more Children | 0 (0.0%) | 0 (0.0%) |
| Total | 2 (5.1%) | 23 (27.1%) |
Income Below Poverty Among Married-Couple vs Single-Parent Households in Bristol
The poverty data for Bristol shows that 14 of the married-couple family households (9.8%) and 25 of the single-parent households (20.2%) are living below the poverty level. Within the married-couple family households, those with 1 or 2 children have the highest poverty rate, with 8 households (27.6%) falling below the poverty line. Among the single-parent households, those with 3 or 4 children have the highest poverty rate, with 5 household (29.4%) living below poverty.
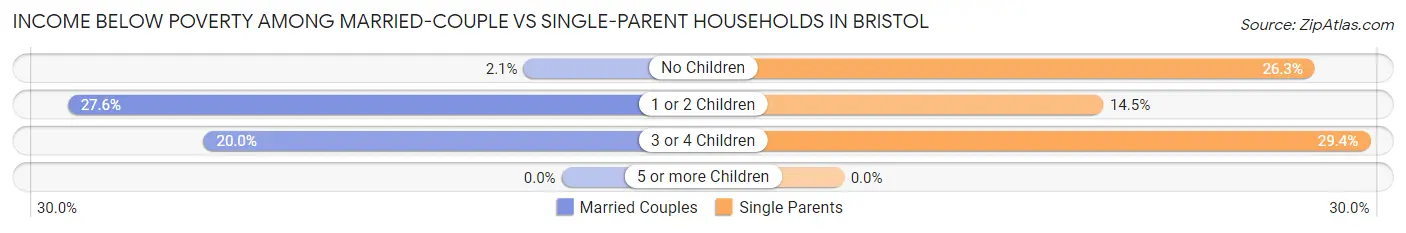
| Children | Married-Couple Families | Single-Parent Households |
| No Children | 2 (2.1%) | 10 (26.3%) |
| 1 or 2 Children | 8 (27.6%) | 10 (14.5%) |
| 3 or 4 Children | 4 (20.0%) | 5 (29.4%) |
| 5 or more Children | 0 (0.0%) | 0 (0.0%) |
| Total | 14 (9.8%) | 25 (20.2%) |
Employment Characteristics in Bristol
Employment by Class of Employer in Bristol
Among the 438 employed individuals in Bristol, private company employees (193 | 44.1%), local government employees (84 | 19.2%), and state government employees (67 | 15.3%) make up the most common classes of employment.
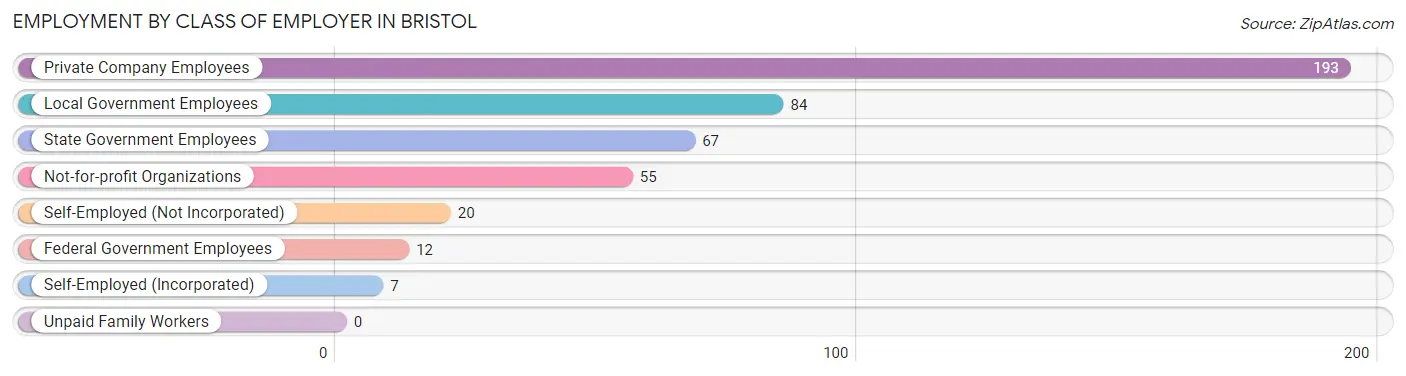
| Employer Class | # Employees | % Employees |
| Private Company Employees | 193 | 44.1% |
| Self-Employed (Incorporated) | 7 | 1.6% |
| Self-Employed (Not Incorporated) | 20 | 4.6% |
| Not-for-profit Organizations | 55 | 12.6% |
| Local Government Employees | 84 | 19.2% |
| State Government Employees | 67 | 15.3% |
| Federal Government Employees | 12 | 2.7% |
| Unpaid Family Workers | 0 | 0.0% |
| Total | 438 | 100.0% |
Employment Status by Age in Bristol
According to the labor force statistics for Bristol, out of the total population over 16 years of age (1,073), 46.0% or 494 individuals are in the labor force, with 6.5% or 32 of them unemployed. The age group with the highest labor force participation rate is 35 to 44 years, with 90.6% or 163 individuals in the labor force. Within the labor force, the 16 to 19 years age range has the highest percentage of unemployed individuals, with 38.2% or 13 of them being unemployed.
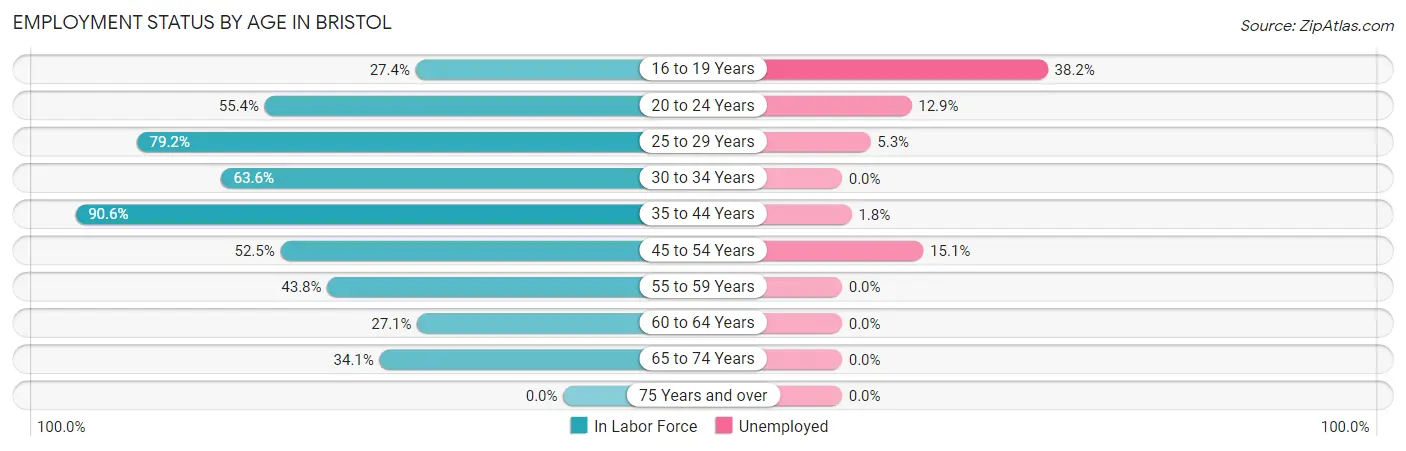
| Age Bracket | In Labor Force | Unemployed |
| 16 to 19 Years | 34 (27.4%) | 13 (38.2%) |
| 20 to 24 Years | 31 (55.4%) | 4 (12.9%) |
| 25 to 29 Years | 76 (79.2%) | 4 (5.3%) |
| 30 to 34 Years | 35 (63.6%) | 0 (0.0%) |
| 35 to 44 Years | 163 (90.6%) | 3 (1.8%) |
| 45 to 54 Years | 53 (52.5%) | 8 (15.1%) |
| 55 to 59 Years | 46 (43.8%) | 0 (0.0%) |
| 60 to 64 Years | 26 (27.1%) | 0 (0.0%) |
| 65 to 74 Years | 30 (34.1%) | 0 (0.0%) |
| 75 Years and over | 0 (0.0%) | 0 (0.0%) |
| Total | 494 (46.0%) | 32 (6.5%) |
Employment Status by Educational Attainment in Bristol
According to labor force statistics for Bristol, 63.0% of individuals (399) out of the total population between 25 and 64 years of age (633) are in the labor force, with 3.8% or 15 of them being unemployed. The group with the highest labor force participation rate are those with the educational attainment of bachelor's degree or higher, with 96.7% or 58 individuals in the labor force. Within the labor force, individuals with college / associate degree education have the highest percentage of unemployment, with 7.1% or 11 of them being unemployed.
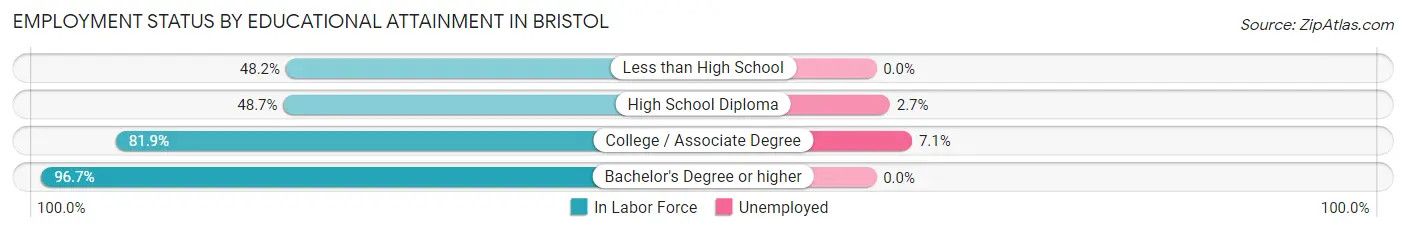
| Educational Attainment | In Labor Force | Unemployed |
| Less than High School | 41 (48.2%) | 0 (0.0%) |
| High School Diploma | 146 (48.7%) | 8 (2.7%) |
| College / Associate Degree | 154 (81.9%) | 13 (7.1%) |
| Bachelor's Degree or higher | 58 (96.7%) | 0 (0.0%) |
| Total | 399 (63.0%) | 24 (3.8%) |
Employment Occupations by Sex in Bristol
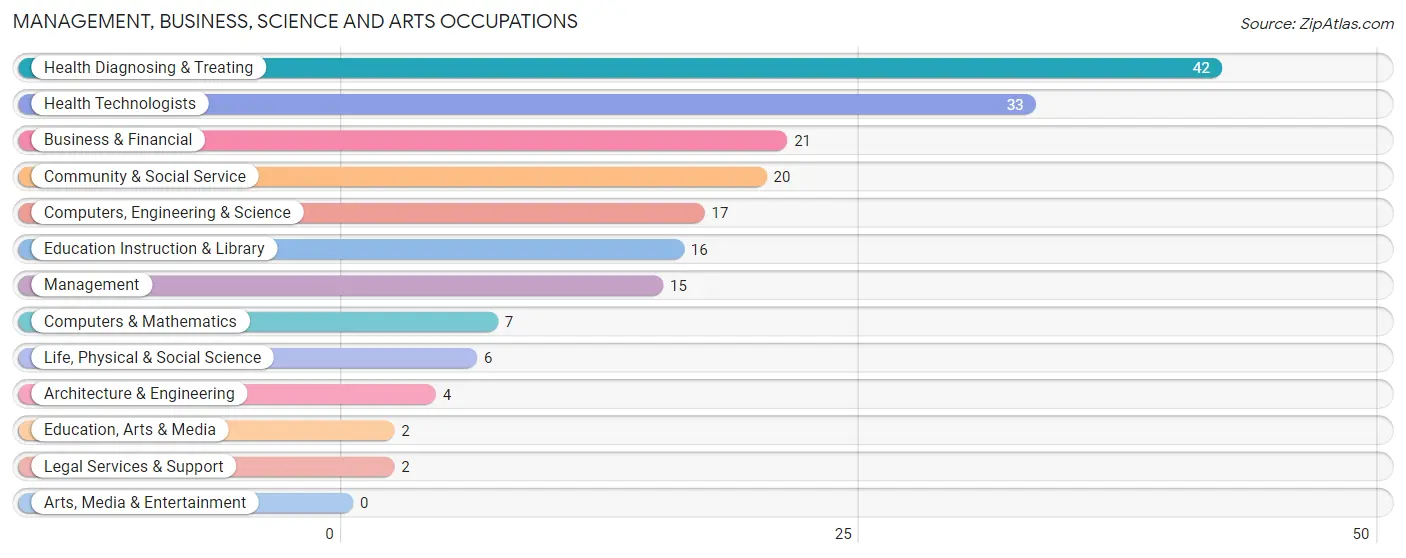
Management, Business, Science and Arts Occupations
The most common Management, Business, Science and Arts occupations in Bristol are Health Diagnosing & Treating (42 | 9.1%), Health Technologists (33 | 7.1%), Business & Financial (21 | 4.5%), Community & Social Service (20 | 4.3%), and Computers, Engineering & Science (17 | 3.7%).
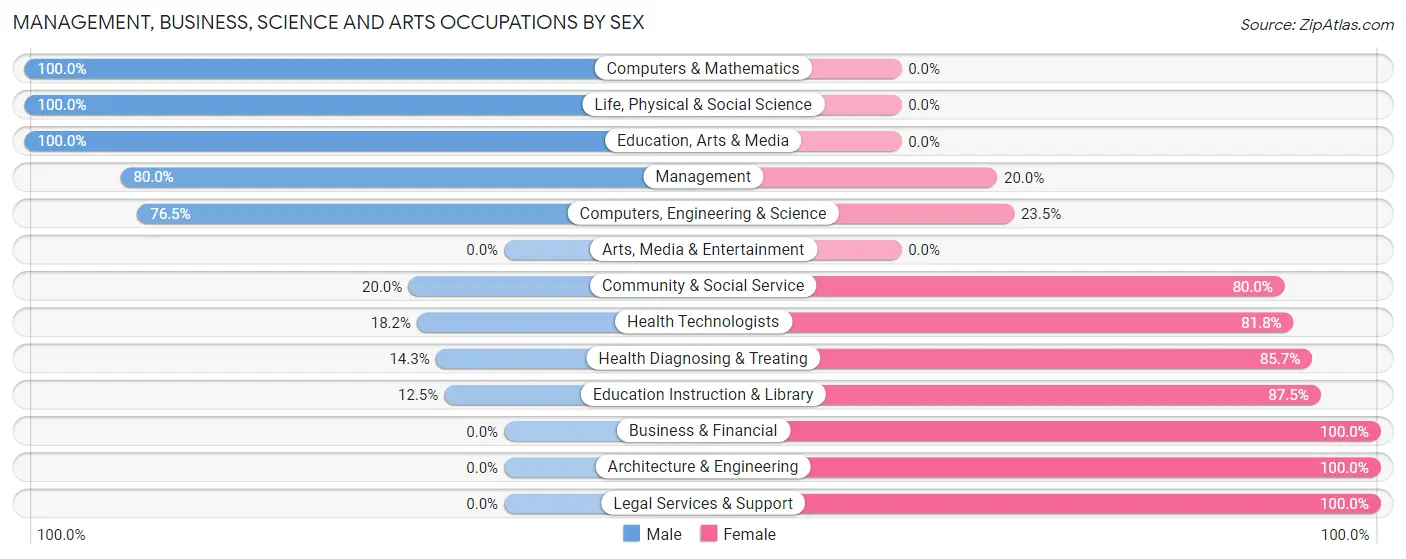
Management, Business, Science and Arts Occupations by Sex
Within the Management, Business, Science and Arts occupations in Bristol, the most male-oriented occupations are Computers & Mathematics (100.0%), Life, Physical & Social Science (100.0%), and Education, Arts & Media (100.0%), while the most female-oriented occupations are Business & Financial (100.0%), Architecture & Engineering (100.0%), and Legal Services & Support (100.0%).
| Occupation | Male | Female |
| Management | 12 (80.0%) | 3 (20.0%) |
| Business & Financial | 0 (0.0%) | 21 (100.0%) |
| Computers, Engineering & Science | 13 (76.5%) | 4 (23.5%) |
| Computers & Mathematics | 7 (100.0%) | 0 (0.0%) |
| Architecture & Engineering | 0 (0.0%) | 4 (100.0%) |
| Life, Physical & Social Science | 6 (100.0%) | 0 (0.0%) |
| Community & Social Service | 4 (20.0%) | 16 (80.0%) |
| Education, Arts & Media | 2 (100.0%) | 0 (0.0%) |
| Legal Services & Support | 0 (0.0%) | 2 (100.0%) |
| Education Instruction & Library | 2 (12.5%) | 14 (87.5%) |
| Arts, Media & Entertainment | 0 (0.0%) | 0 (0.0%) |
| Health Diagnosing & Treating | 6 (14.3%) | 36 (85.7%) |
| Health Technologists | 6 (18.2%) | 27 (81.8%) |
| Total (Category) | 35 (30.4%) | 80 (69.6%) |
| Total (Overall) | 226 (48.9%) | 236 (51.1%) |
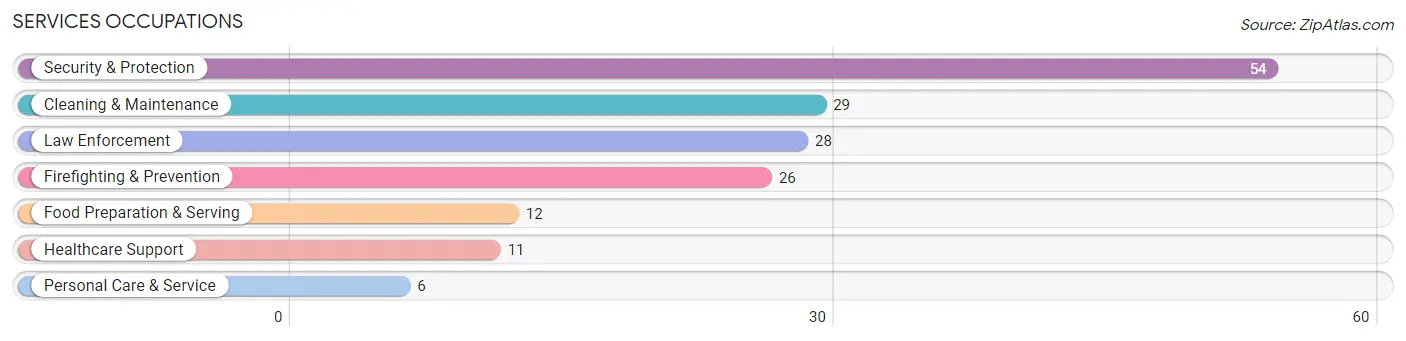
Services Occupations
The most common Services occupations in Bristol are Security & Protection (54 | 11.7%), Cleaning & Maintenance (29 | 6.3%), Law Enforcement (28 | 6.1%), Firefighting & Prevention (26 | 5.6%), and Food Preparation & Serving (12 | 2.6%).
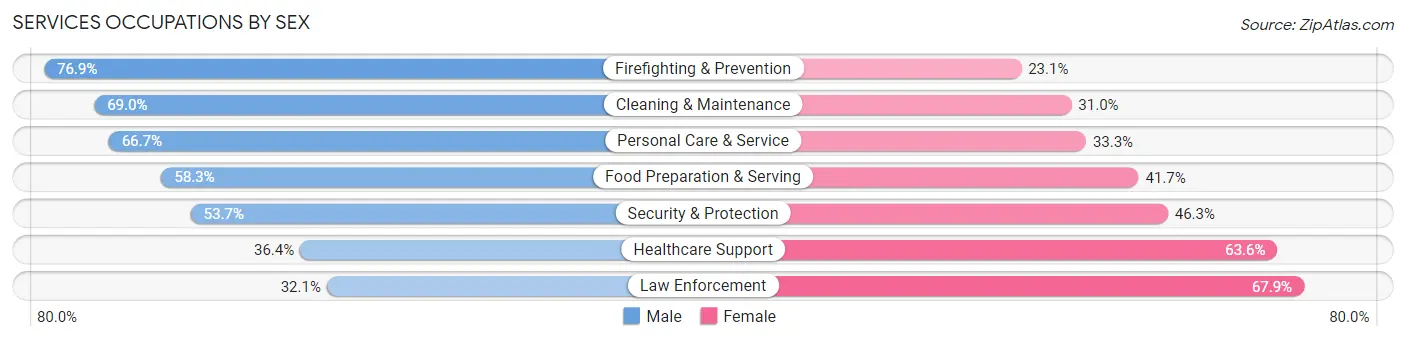
Services Occupations by Sex
Within the Services occupations in Bristol, the most male-oriented occupations are Firefighting & Prevention (76.9%), Cleaning & Maintenance (69.0%), and Personal Care & Service (66.7%), while the most female-oriented occupations are Law Enforcement (67.9%), Healthcare Support (63.6%), and Security & Protection (46.3%).
| Occupation | Male | Female |
| Healthcare Support | 4 (36.4%) | 7 (63.6%) |
| Security & Protection | 29 (53.7%) | 25 (46.3%) |
| Firefighting & Prevention | 20 (76.9%) | 6 (23.1%) |
| Law Enforcement | 9 (32.1%) | 19 (67.9%) |
| Food Preparation & Serving | 7 (58.3%) | 5 (41.7%) |
| Cleaning & Maintenance | 20 (69.0%) | 9 (31.0%) |
| Personal Care & Service | 4 (66.7%) | 2 (33.3%) |
| Total (Category) | 64 (57.1%) | 48 (42.9%) |
| Total (Overall) | 226 (48.9%) | 236 (51.1%) |
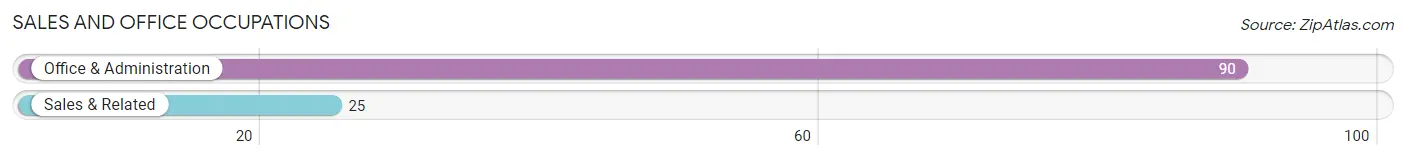
Sales and Office Occupations
The most common Sales and Office occupations in Bristol are Office & Administration (90 | 19.5%), and Sales & Related (25 | 5.4%).
Sales and Office Occupations by Sex
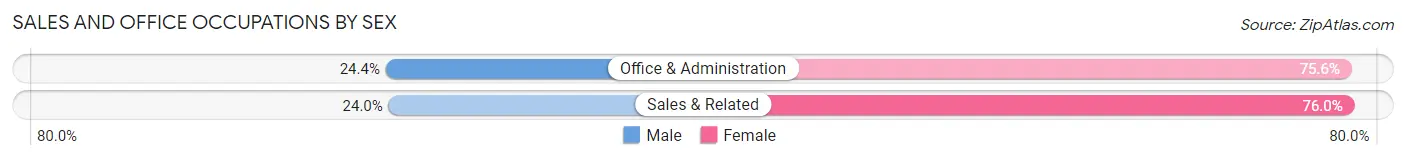
| Occupation | Male | Female |
| Sales & Related | 6 (24.0%) | 19 (76.0%) |
| Office & Administration | 22 (24.4%) | 68 (75.6%) |
| Total (Category) | 28 (24.3%) | 87 (75.6%) |
| Total (Overall) | 226 (48.9%) | 236 (51.1%) |
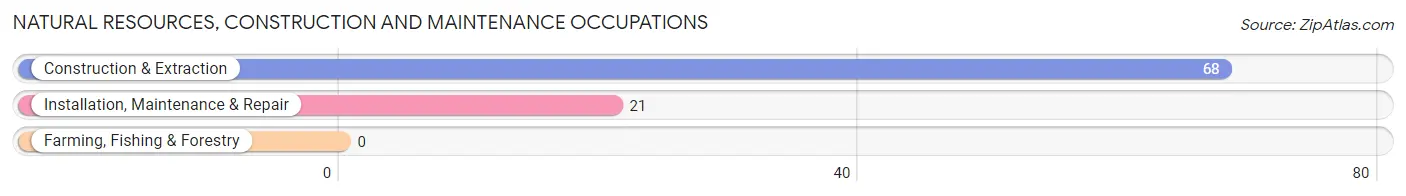
Natural Resources, Construction and Maintenance Occupations
The most common Natural Resources, Construction and Maintenance occupations in Bristol are Construction & Extraction (68 | 14.7%), and Installation, Maintenance & Repair (21 | 4.5%).
Natural Resources, Construction and Maintenance Occupations by Sex
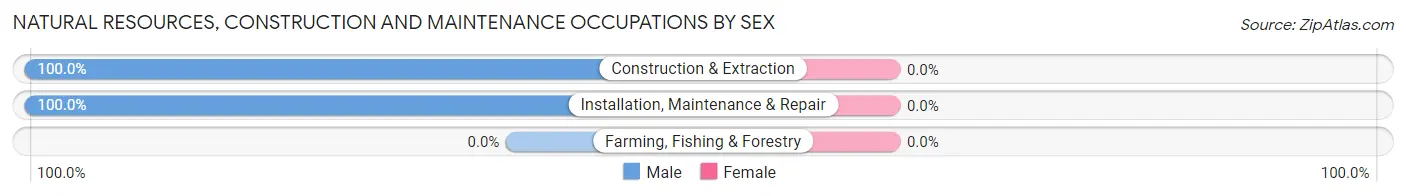
| Occupation | Male | Female |
| Farming, Fishing & Forestry | 0 (0.0%) | 0 (0.0%) |
| Construction & Extraction | 68 (100.0%) | 0 (0.0%) |
| Installation, Maintenance & Repair | 21 (100.0%) | 0 (0.0%) |
| Total (Category) | 89 (100.0%) | 0 (0.0%) |
| Total (Overall) | 226 (48.9%) | 236 (51.1%) |
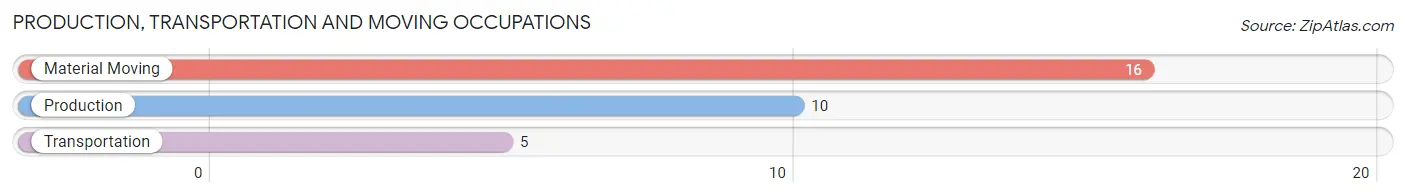
Production, Transportation and Moving Occupations
The most common Production, Transportation and Moving occupations in Bristol are Material Moving (16 | 3.5%), Production (10 | 2.2%), and Transportation (5 | 1.1%).
Production, Transportation and Moving Occupations by Sex
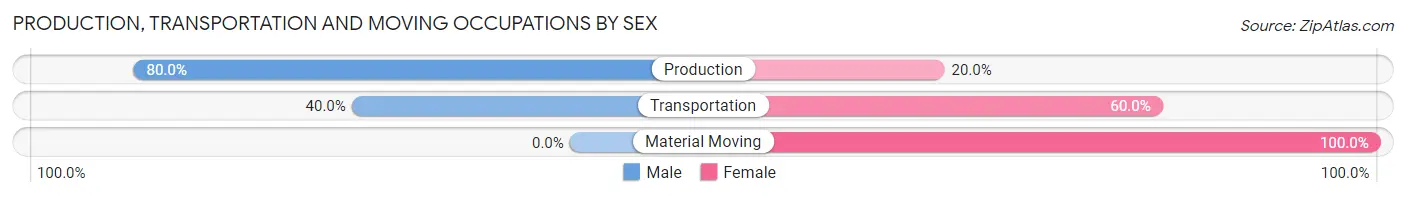
| Occupation | Male | Female |
| Production | 8 (80.0%) | 2 (20.0%) |
| Transportation | 2 (40.0%) | 3 (60.0%) |
| Material Moving | 0 (0.0%) | 16 (100.0%) |
| Total (Category) | 10 (32.3%) | 21 (67.7%) |
| Total (Overall) | 226 (48.9%) | 236 (51.1%) |
Employment Industries by Sex in Bristol
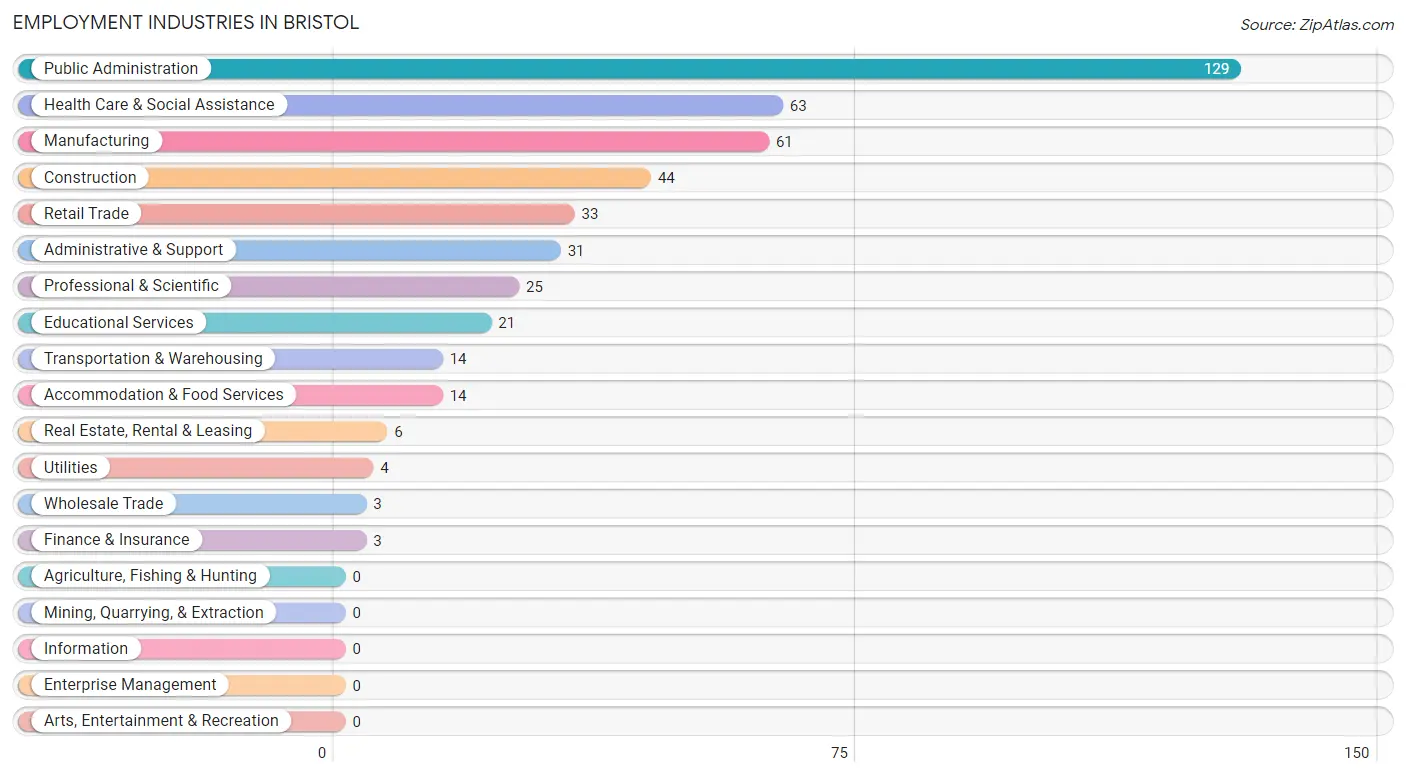
Employment Industries in Bristol
The major employment industries in Bristol include Public Administration (129 | 27.9%), Health Care & Social Assistance (63 | 13.6%), Manufacturing (61 | 13.2%), Construction (44 | 9.5%), and Retail Trade (33 | 7.1%).
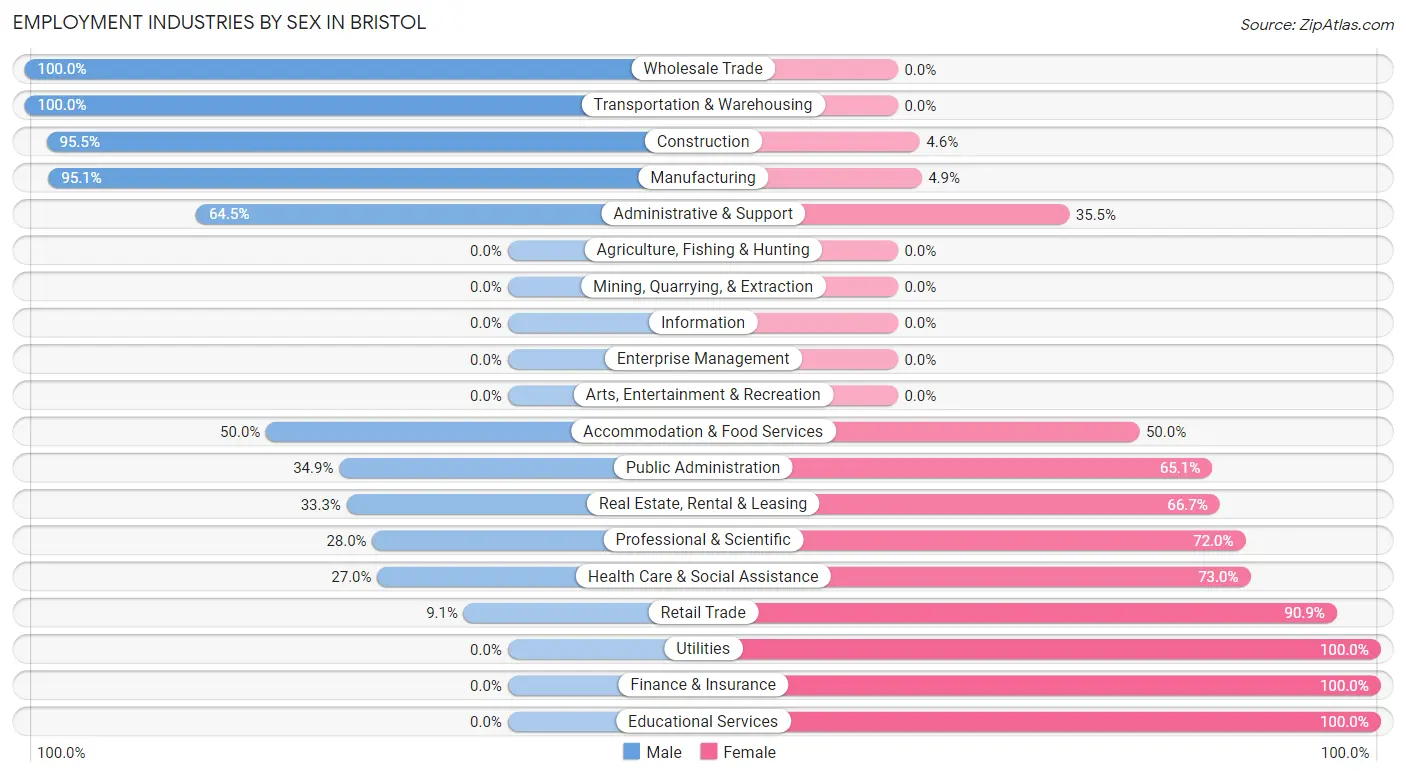
Employment Industries by Sex in Bristol
The Bristol industries that see more men than women are Wholesale Trade (100.0%), Transportation & Warehousing (100.0%), and Construction (95.5%), whereas the industries that tend to have a higher number of women are Utilities (100.0%), Finance & Insurance (100.0%), and Educational Services (100.0%).
| Industry | Male | Female |
| Agriculture, Fishing & Hunting | 0 (0.0%) | 0 (0.0%) |
| Mining, Quarrying, & Extraction | 0 (0.0%) | 0 (0.0%) |
| Construction | 42 (95.5%) | 2 (4.5%) |
| Manufacturing | 58 (95.1%) | 3 (4.9%) |
| Wholesale Trade | 3 (100.0%) | 0 (0.0%) |
| Retail Trade | 3 (9.1%) | 30 (90.9%) |
| Transportation & Warehousing | 14 (100.0%) | 0 (0.0%) |
| Utilities | 0 (0.0%) | 4 (100.0%) |
| Information | 0 (0.0%) | 0 (0.0%) |
| Finance & Insurance | 0 (0.0%) | 3 (100.0%) |
| Real Estate, Rental & Leasing | 2 (33.3%) | 4 (66.7%) |
| Professional & Scientific | 7 (28.0%) | 18 (72.0%) |
| Enterprise Management | 0 (0.0%) | 0 (0.0%) |
| Administrative & Support | 20 (64.5%) | 11 (35.5%) |
| Educational Services | 0 (0.0%) | 21 (100.0%) |
| Health Care & Social Assistance | 17 (27.0%) | 46 (73.0%) |
| Arts, Entertainment & Recreation | 0 (0.0%) | 0 (0.0%) |
| Accommodation & Food Services | 7 (50.0%) | 7 (50.0%) |
| Public Administration | 45 (34.9%) | 84 (65.1%) |
| Total | 226 (48.9%) | 236 (51.1%) |
Education in Bristol
School Enrollment in Bristol
The most common levels of schooling among the 379 students in Bristol are high school (125 | 33.0%), middle school (93 | 24.5%), and elementary school (62 | 16.4%).
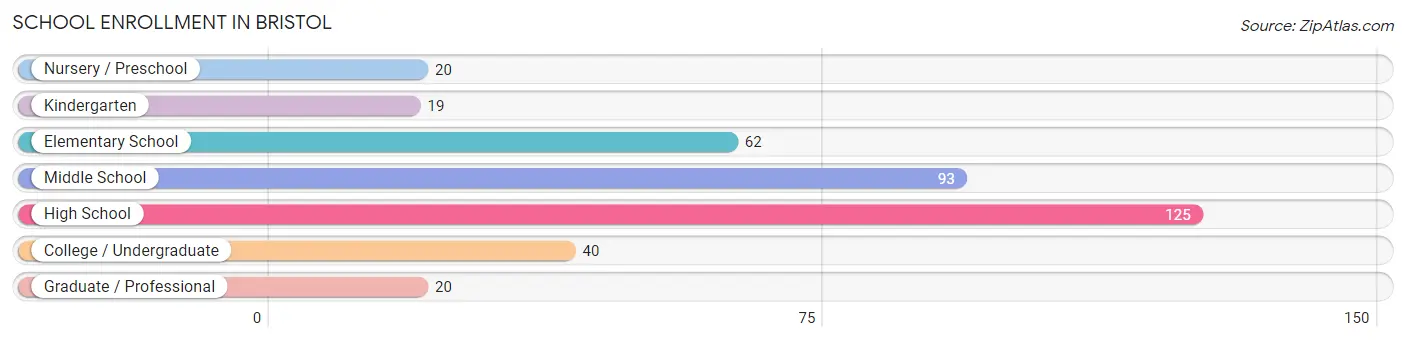
| School Level | # Students | % Students |
| Nursery / Preschool | 20 | 5.3% |
| Kindergarten | 19 | 5.0% |
| Elementary School | 62 | 16.4% |
| Middle School | 93 | 24.5% |
| High School | 125 | 33.0% |
| College / Undergraduate | 40 | 10.5% |
| Graduate / Professional | 20 | 5.3% |
| Total | 379 | 100.0% |
School Enrollment by Age by Funding Source in Bristol
Out of a total of 379 students who are enrolled in schools in Bristol, 28 (7.4%) attend a private institution, while the remaining 351 (92.6%) are enrolled in public schools. The age group of 35 years and over has the highest likelihood of being enrolled in private schools, with 17 (63.0% in the age bracket) enrolled. Conversely, the age group of 5 to 9 year old has the lowest likelihood of being enrolled in a private school, with 83 (100.0% in the age bracket) attending a public institution.
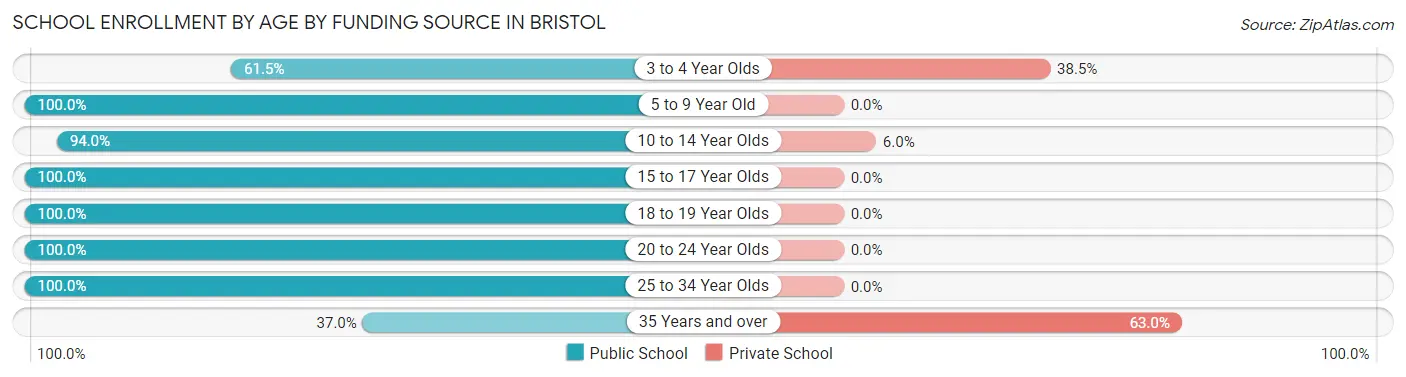
| Age Bracket | Public School | Private School |
| 3 to 4 Year Olds | 8 (61.5%) | 5 (38.5%) |
| 5 to 9 Year Old | 83 (100.0%) | 0 (0.0%) |
| 10 to 14 Year Olds | 94 (94.0%) | 6 (6.0%) |
| 15 to 17 Year Olds | 42 (100.0%) | 0 (0.0%) |
| 18 to 19 Year Olds | 88 (100.0%) | 0 (0.0%) |
| 20 to 24 Year Olds | 23 (100.0%) | 0 (0.0%) |
| 25 to 34 Year Olds | 3 (100.0%) | 0 (0.0%) |
| 35 Years and over | 10 (37.0%) | 17 (63.0%) |
| Total | 351 (92.6%) | 28 (7.4%) |
Educational Attainment by Field of Study in Bristol
Education (30 | 20.0%), science & technology (27 | 18.0%), liberal arts & history (23 | 15.3%), literature & languages (20 | 13.3%), and business (15 | 10.0%) are the most common fields of study among 150 individuals in Bristol who have obtained a bachelor's degree or higher.
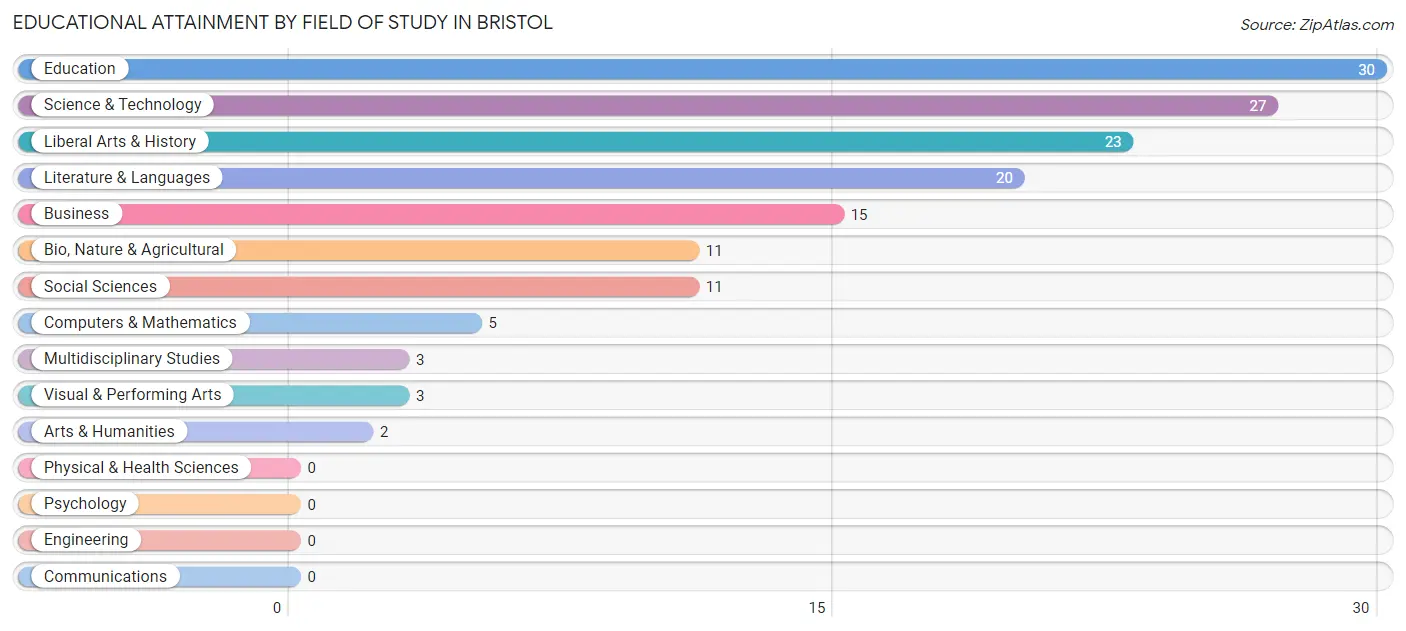
| Field of Study | # Graduates | % Graduates |
| Computers & Mathematics | 5 | 3.3% |
| Bio, Nature & Agricultural | 11 | 7.3% |
| Physical & Health Sciences | 0 | 0.0% |
| Psychology | 0 | 0.0% |
| Social Sciences | 11 | 7.3% |
| Engineering | 0 | 0.0% |
| Multidisciplinary Studies | 3 | 2.0% |
| Science & Technology | 27 | 18.0% |
| Business | 15 | 10.0% |
| Education | 30 | 20.0% |
| Literature & Languages | 20 | 13.3% |
| Liberal Arts & History | 23 | 15.3% |
| Visual & Performing Arts | 3 | 2.0% |
| Communications | 0 | 0.0% |
| Arts & Humanities | 2 | 1.3% |
| Total | 150 | 100.0% |
Transportation & Commute in Bristol
Vehicle Availability by Sex in Bristol
The most prevalent vehicle ownership categories in Bristol are males with 3 vehicles (103, accounting for 50.5%) and females with 3 vehicles (108, making up 44.0%).
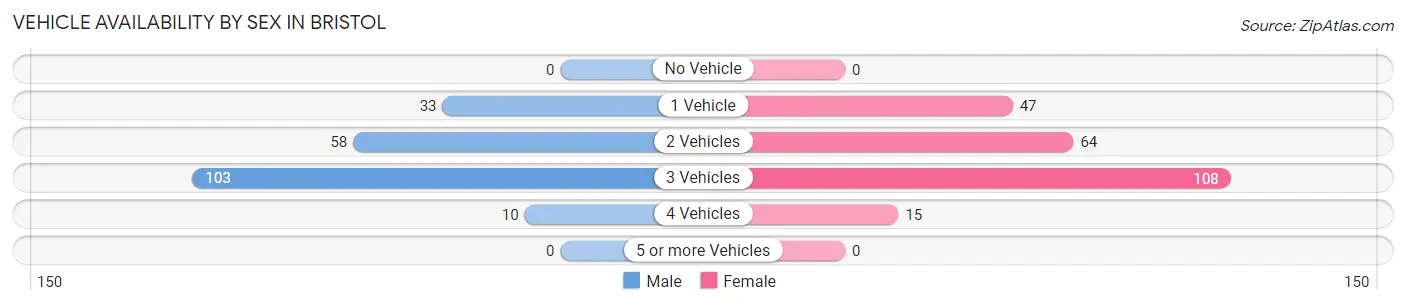
| Vehicles Available | Male | Female |
| No Vehicle | 0 (0.0%) | 0 (0.0%) |
| 1 Vehicle | 33 (16.2%) | 47 (20.1%) |
| 2 Vehicles | 58 (28.4%) | 64 (27.4%) |
| 3 Vehicles | 103 (50.5%) | 108 (46.2%) |
| 4 Vehicles | 10 (4.9%) | 15 (6.4%) |
| 5 or more Vehicles | 0 (0.0%) | 0 (0.0%) |
| Total | 204 (100.0%) | 234 (100.0%) |
Commute Time in Bristol
The most frequently occuring commute durations in Bristol are 10 to 14 minutes (114 commuters, 28.1%), 5 to 9 minutes (74 commuters, 18.2%), and 60 to 89 minutes (74 commuters, 18.2%).
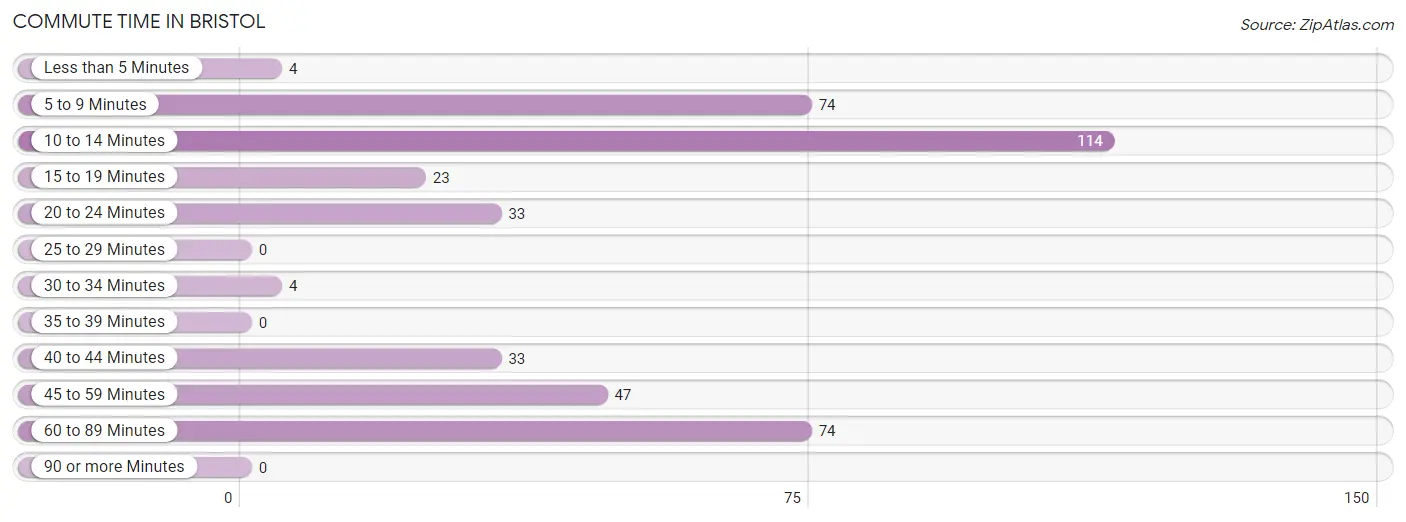
| Commute Time | # Commuters | % Commuters |
| Less than 5 Minutes | 4 | 1.0% |
| 5 to 9 Minutes | 74 | 18.2% |
| 10 to 14 Minutes | 114 | 28.1% |
| 15 to 19 Minutes | 23 | 5.7% |
| 20 to 24 Minutes | 33 | 8.1% |
| 25 to 29 Minutes | 0 | 0.0% |
| 30 to 34 Minutes | 4 | 1.0% |
| 35 to 39 Minutes | 0 | 0.0% |
| 40 to 44 Minutes | 33 | 8.1% |
| 45 to 59 Minutes | 47 | 11.6% |
| 60 to 89 Minutes | 74 | 18.2% |
| 90 or more Minutes | 0 | 0.0% |
Commute Time by Sex in Bristol
The most common commute times in Bristol are 10 to 14 minutes (85 commuters, 45.5%) for males and 5 to 9 minutes (69 commuters, 31.5%) for females.
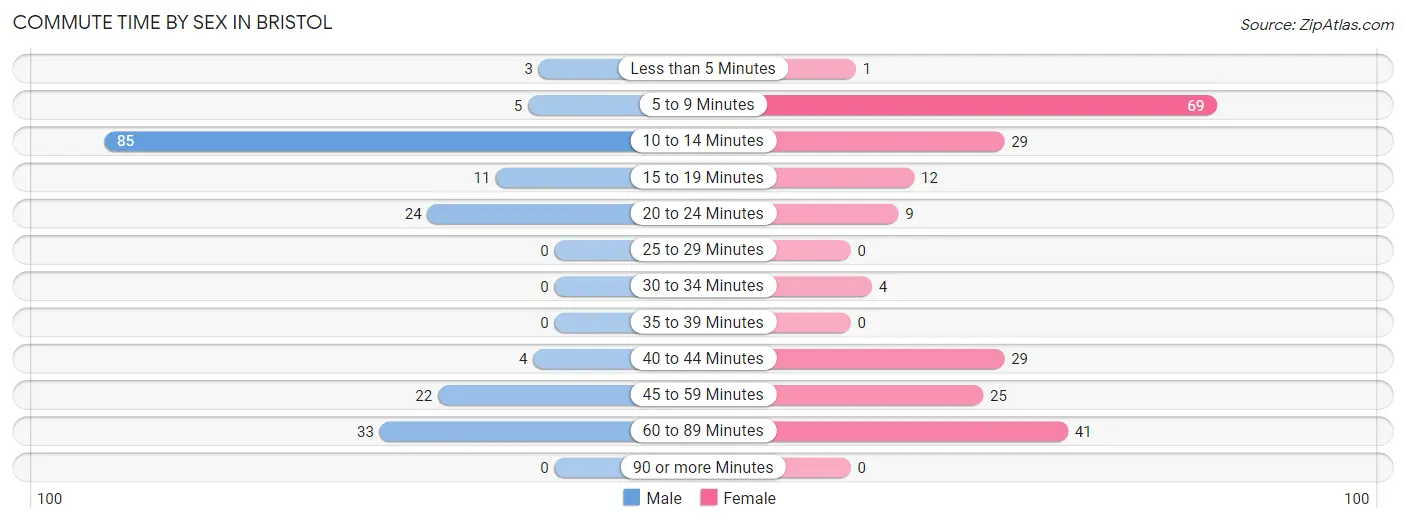
| Commute Time | Male | Female |
| Less than 5 Minutes | 3 (1.6%) | 1 (0.5%) |
| 5 to 9 Minutes | 5 (2.7%) | 69 (31.5%) |
| 10 to 14 Minutes | 85 (45.5%) | 29 (13.2%) |
| 15 to 19 Minutes | 11 (5.9%) | 12 (5.5%) |
| 20 to 24 Minutes | 24 (12.8%) | 9 (4.1%) |
| 25 to 29 Minutes | 0 (0.0%) | 0 (0.0%) |
| 30 to 34 Minutes | 0 (0.0%) | 4 (1.8%) |
| 35 to 39 Minutes | 0 (0.0%) | 0 (0.0%) |
| 40 to 44 Minutes | 4 (2.1%) | 29 (13.2%) |
| 45 to 59 Minutes | 22 (11.8%) | 25 (11.4%) |
| 60 to 89 Minutes | 33 (17.6%) | 41 (18.7%) |
| 90 or more Minutes | 0 (0.0%) | 0 (0.0%) |
Time of Departure to Work by Sex in Bristol
The most frequent times of departure to work in Bristol are 5:00 AM to 5:29 AM (49, 26.2%) for males and 7:30 AM to 7:59 AM (62, 28.3%) for females.
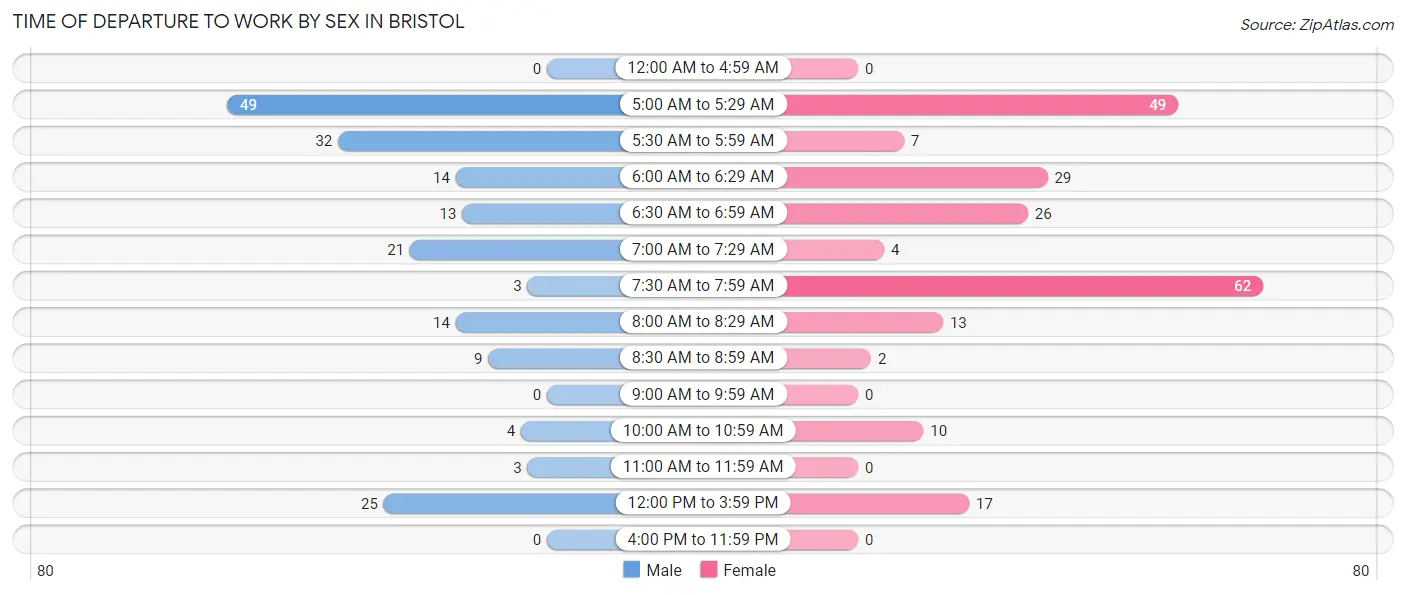
| Time of Departure | Male | Female |
| 12:00 AM to 4:59 AM | 0 (0.0%) | 0 (0.0%) |
| 5:00 AM to 5:29 AM | 49 (26.2%) | 49 (22.4%) |
| 5:30 AM to 5:59 AM | 32 (17.1%) | 7 (3.2%) |
| 6:00 AM to 6:29 AM | 14 (7.5%) | 29 (13.2%) |
| 6:30 AM to 6:59 AM | 13 (7.0%) | 26 (11.9%) |
| 7:00 AM to 7:29 AM | 21 (11.2%) | 4 (1.8%) |
| 7:30 AM to 7:59 AM | 3 (1.6%) | 62 (28.3%) |
| 8:00 AM to 8:29 AM | 14 (7.5%) | 13 (5.9%) |
| 8:30 AM to 8:59 AM | 9 (4.8%) | 2 (0.9%) |
| 9:00 AM to 9:59 AM | 0 (0.0%) | 0 (0.0%) |
| 10:00 AM to 10:59 AM | 4 (2.1%) | 10 (4.6%) |
| 11:00 AM to 11:59 AM | 3 (1.6%) | 0 (0.0%) |
| 12:00 PM to 3:59 PM | 25 (13.4%) | 17 (7.8%) |
| 4:00 PM to 11:59 PM | 0 (0.0%) | 0 (0.0%) |
| Total | 187 (100.0%) | 219 (100.0%) |
Housing Occupancy in Bristol
Occupancy by Ownership in Bristol
Of the total 449 dwellings in Bristol, owner-occupied units account for 329 (73.3%), while renter-occupied units make up 120 (26.7%).
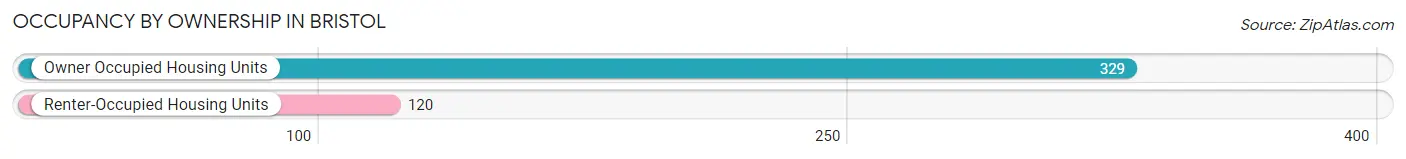
| Occupancy | # Housing Units | % Housing Units |
| Owner Occupied Housing Units | 329 | 73.3% |
| Renter-Occupied Housing Units | 120 | 26.7% |
| Total Occupied Housing Units | 449 | 100.0% |
Occupancy by Household Size in Bristol
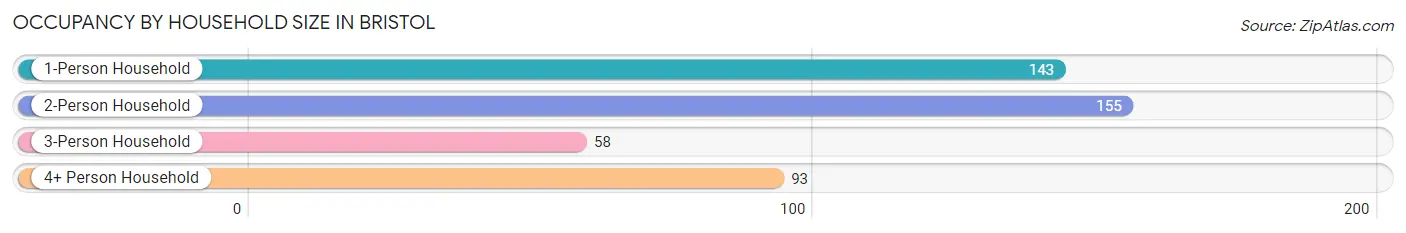
| Household Size | # Housing Units | % Housing Units |
| 1-Person Household | 143 | 31.9% |
| 2-Person Household | 155 | 34.5% |
| 3-Person Household | 58 | 12.9% |
| 4+ Person Household | 93 | 20.7% |
| Total Housing Units | 449 | 100.0% |
Occupancy by Ownership by Household Size in Bristol
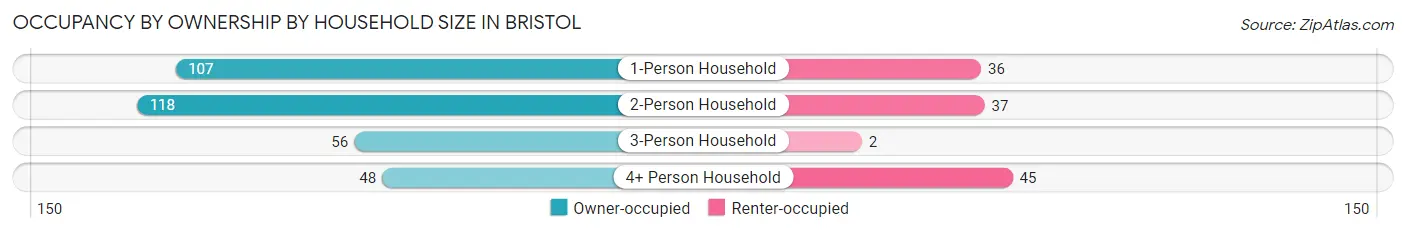
| Household Size | Owner-occupied | Renter-occupied |
| 1-Person Household | 107 (74.8%) | 36 (25.2%) |
| 2-Person Household | 118 (76.1%) | 37 (23.9%) |
| 3-Person Household | 56 (96.6%) | 2 (3.5%) |
| 4+ Person Household | 48 (51.6%) | 45 (48.4%) |
| Total Housing Units | 329 (73.3%) | 120 (26.7%) |
Occupancy by Educational Attainment in Bristol
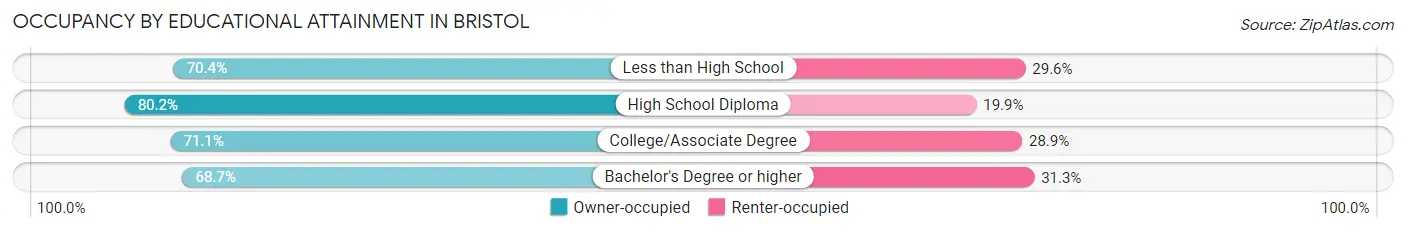
| Household Size | Owner-occupied | Renter-occupied |
| Less than High School | 50 (70.4%) | 21 (29.6%) |
| High School Diploma | 109 (80.1%) | 27 (19.9%) |
| College/Associate Degree | 113 (71.1%) | 46 (28.9%) |
| Bachelor's Degree or higher | 57 (68.7%) | 26 (31.3%) |
Occupancy by Age of Householder in Bristol
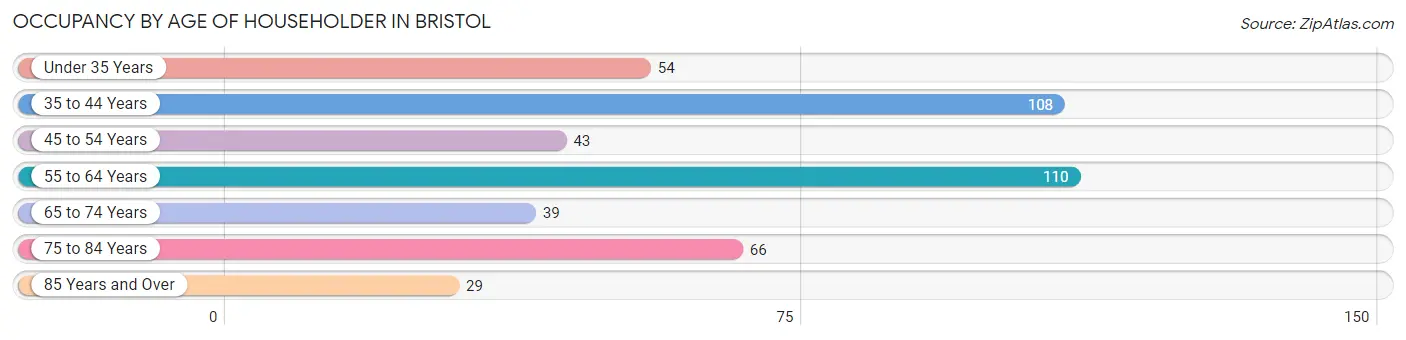
| Age Bracket | # Households | % Households |
| Under 35 Years | 54 | 12.0% |
| 35 to 44 Years | 108 | 24.0% |
| 45 to 54 Years | 43 | 9.6% |
| 55 to 64 Years | 110 | 24.5% |
| 65 to 74 Years | 39 | 8.7% |
| 75 to 84 Years | 66 | 14.7% |
| 85 Years and Over | 29 | 6.5% |
| Total | 449 | 100.0% |
Housing Finances in Bristol
Median Income by Occupancy in Bristol
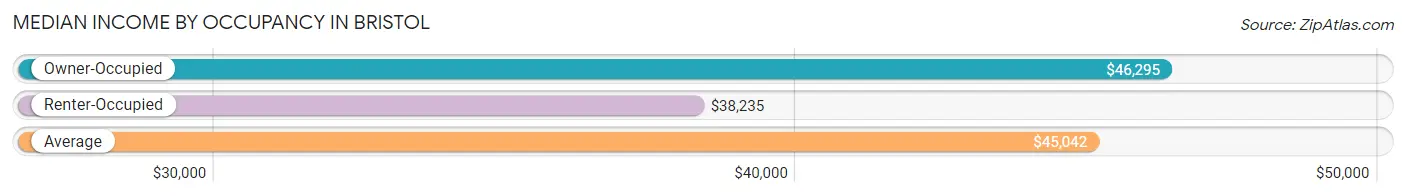
| Occupancy Type | # Households | Median Income |
| Owner-Occupied | 329 (73.3%) | $46,295 |
| Renter-Occupied | 120 (26.7%) | $38,235 |
| Average | 449 (100.0%) | $45,042 |
Occupancy by Householder Income Bracket in Bristol
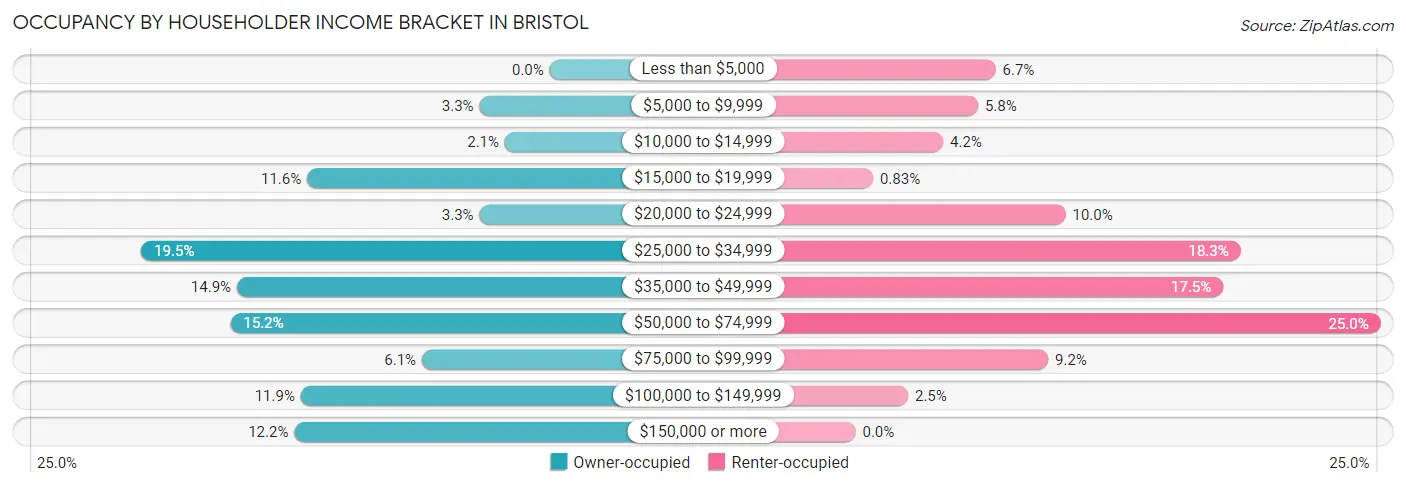
| Income Bracket | Owner-occupied | Renter-occupied |
| Less than $5,000 | 0 (0.0%) | 8 (6.7%) |
| $5,000 to $9,999 | 11 (3.3%) | 7 (5.8%) |
| $10,000 to $14,999 | 7 (2.1%) | 5 (4.2%) |
| $15,000 to $19,999 | 38 (11.6%) | 1 (0.8%) |
| $20,000 to $24,999 | 11 (3.3%) | 12 (10.0%) |
| $25,000 to $34,999 | 64 (19.5%) | 22 (18.3%) |
| $35,000 to $49,999 | 49 (14.9%) | 21 (17.5%) |
| $50,000 to $74,999 | 50 (15.2%) | 30 (25.0%) |
| $75,000 to $99,999 | 20 (6.1%) | 11 (9.2%) |
| $100,000 to $149,999 | 39 (11.8%) | 3 (2.5%) |
| $150,000 or more | 40 (12.2%) | 0 (0.0%) |
| Total | 329 (100.0%) | 120 (100.0%) |
Monthly Housing Cost Tiers in Bristol
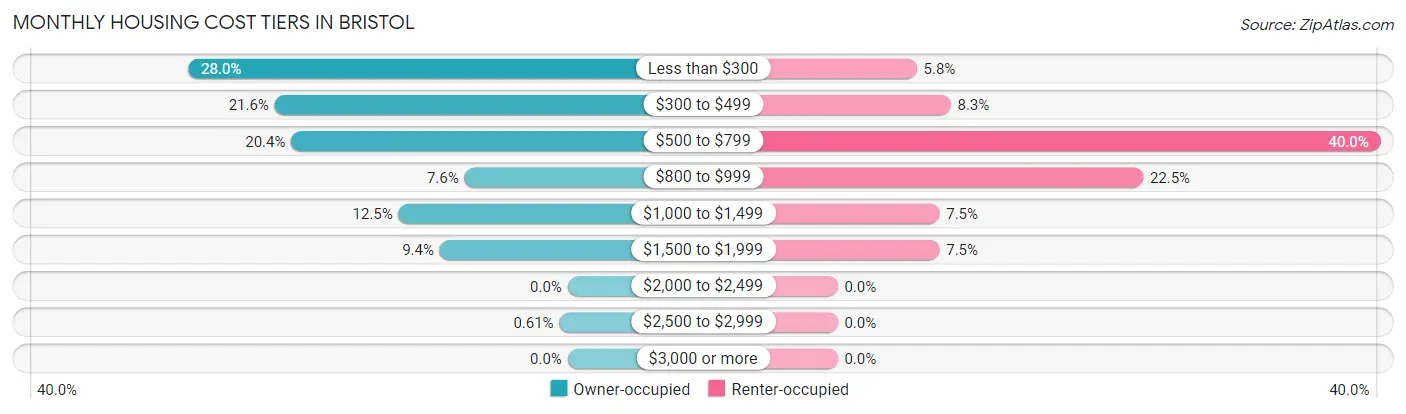
| Monthly Cost | Owner-occupied | Renter-occupied |
| Less than $300 | 92 (28.0%) | 7 (5.8%) |
| $300 to $499 | 71 (21.6%) | 10 (8.3%) |
| $500 to $799 | 67 (20.4%) | 48 (40.0%) |
| $800 to $999 | 25 (7.6%) | 27 (22.5%) |
| $1,000 to $1,499 | 41 (12.5%) | 9 (7.5%) |
| $1,500 to $1,999 | 31 (9.4%) | 9 (7.5%) |
| $2,000 to $2,499 | 0 (0.0%) | 0 (0.0%) |
| $2,500 to $2,999 | 2 (0.6%) | 0 (0.0%) |
| $3,000 or more | 0 (0.0%) | 0 (0.0%) |
| Total | 329 (100.0%) | 120 (100.0%) |
Physical Housing Characteristics in Bristol
Housing Structures in Bristol
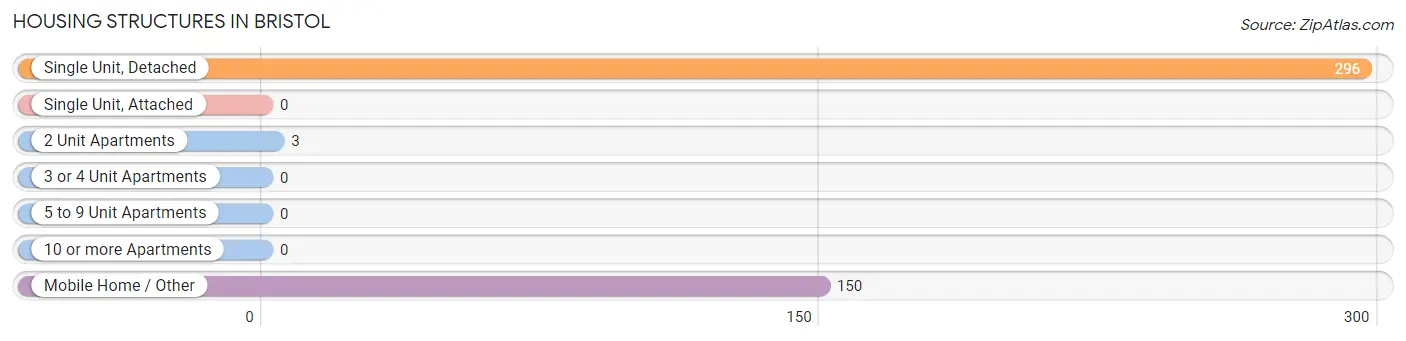
| Structure Type | # Housing Units | % Housing Units |
| Single Unit, Detached | 296 | 65.9% |
| Single Unit, Attached | 0 | 0.0% |
| 2 Unit Apartments | 3 | 0.7% |
| 3 or 4 Unit Apartments | 0 | 0.0% |
| 5 to 9 Unit Apartments | 0 | 0.0% |
| 10 or more Apartments | 0 | 0.0% |
| Mobile Home / Other | 150 | 33.4% |
| Total | 449 | 100.0% |
Housing Structures by Occupancy in Bristol
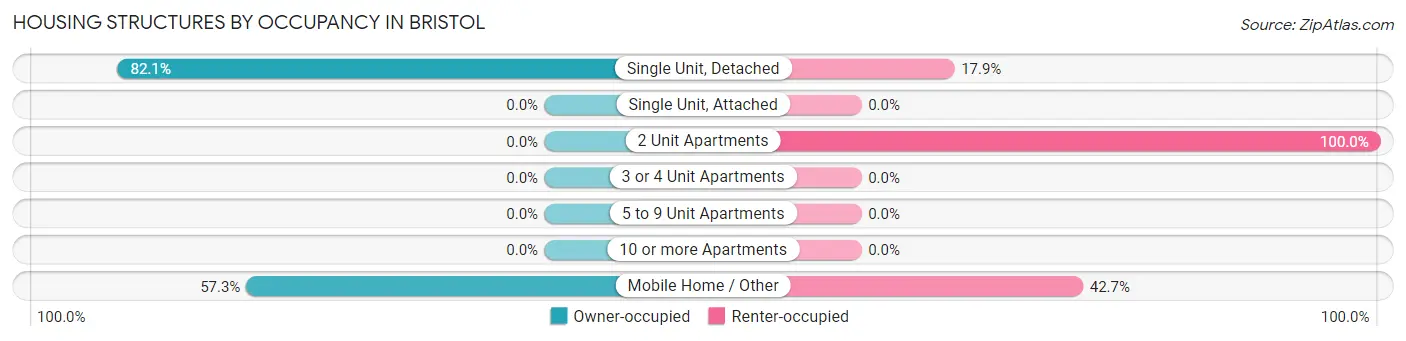
| Structure Type | Owner-occupied | Renter-occupied |
| Single Unit, Detached | 243 (82.1%) | 53 (17.9%) |
| Single Unit, Attached | 0 (0.0%) | 0 (0.0%) |
| 2 Unit Apartments | 0 (0.0%) | 3 (100.0%) |
| 3 or 4 Unit Apartments | 0 (0.0%) | 0 (0.0%) |
| 5 to 9 Unit Apartments | 0 (0.0%) | 0 (0.0%) |
| 10 or more Apartments | 0 (0.0%) | 0 (0.0%) |
| Mobile Home / Other | 86 (57.3%) | 64 (42.7%) |
| Total | 329 (73.3%) | 120 (26.7%) |
Housing Structures by Number of Rooms in Bristol
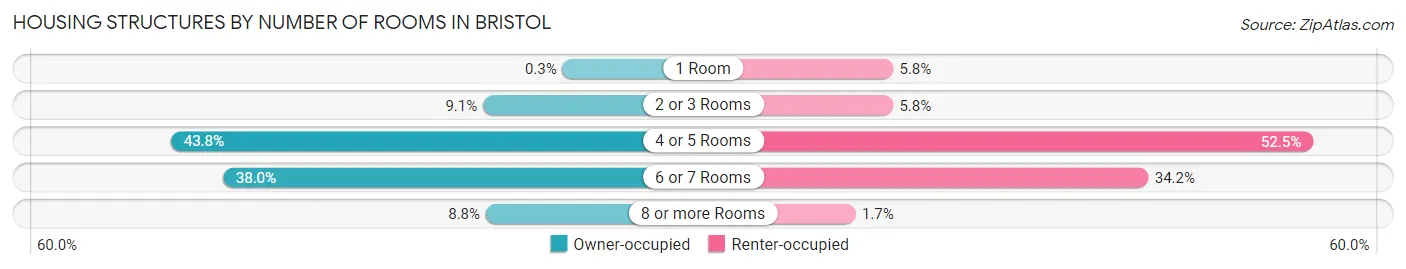
| Number of Rooms | Owner-occupied | Renter-occupied |
| 1 Room | 1 (0.3%) | 7 (5.8%) |
| 2 or 3 Rooms | 30 (9.1%) | 7 (5.8%) |
| 4 or 5 Rooms | 144 (43.8%) | 63 (52.5%) |
| 6 or 7 Rooms | 125 (38.0%) | 41 (34.2%) |
| 8 or more Rooms | 29 (8.8%) | 2 (1.7%) |
| Total | 329 (100.0%) | 120 (100.0%) |
Housing Structure by Heating Type in Bristol
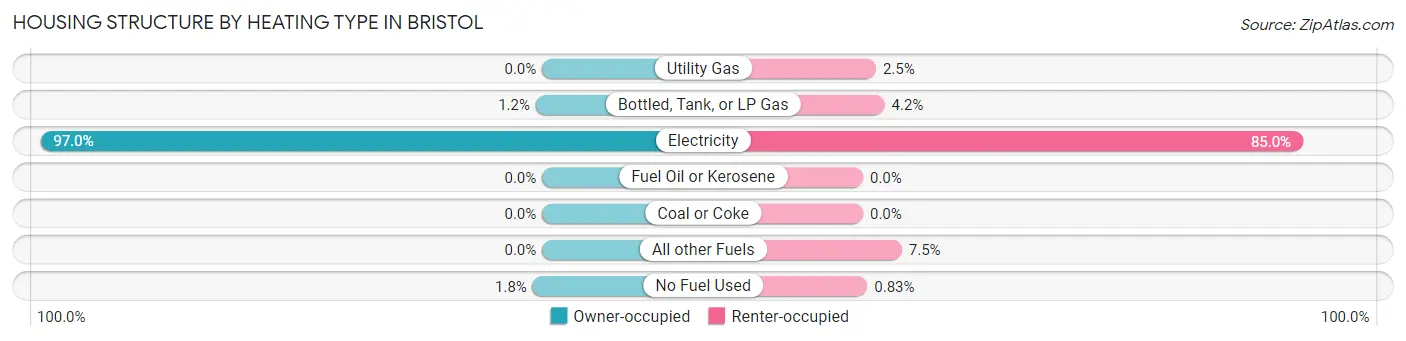
| Heating Type | Owner-occupied | Renter-occupied |
| Utility Gas | 0 (0.0%) | 3 (2.5%) |
| Bottled, Tank, or LP Gas | 4 (1.2%) | 5 (4.2%) |
| Electricity | 319 (97.0%) | 102 (85.0%) |
| Fuel Oil or Kerosene | 0 (0.0%) | 0 (0.0%) |
| Coal or Coke | 0 (0.0%) | 0 (0.0%) |
| All other Fuels | 0 (0.0%) | 9 (7.5%) |
| No Fuel Used | 6 (1.8%) | 1 (0.8%) |
| Total | 329 (100.0%) | 120 (100.0%) |
Household Vehicle Usage in Bristol
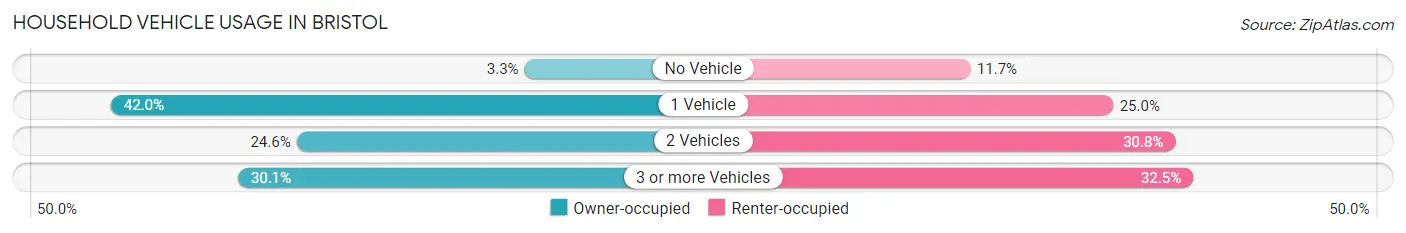
| Vehicles per Household | Owner-occupied | Renter-occupied |
| No Vehicle | 11 (3.3%) | 14 (11.7%) |
| 1 Vehicle | 138 (41.9%) | 30 (25.0%) |
| 2 Vehicles | 81 (24.6%) | 37 (30.8%) |
| 3 or more Vehicles | 99 (30.1%) | 39 (32.5%) |
| Total | 329 (100.0%) | 120 (100.0%) |
Real Estate & Mortgages in Bristol
Real Estate and Mortgage Overview in Bristol
| Characteristic | Without Mortgage | With Mortgage |
| Housing Units | 217 | 112 |
| Median Property Value | $102,200 | $142,500 |
| Median Household Income | $45,144 | $17 |
| Monthly Housing Costs | $343 | $0 |
| Real Estate Taxes | $731 | $15 |
Property Value by Mortgage Status in Bristol
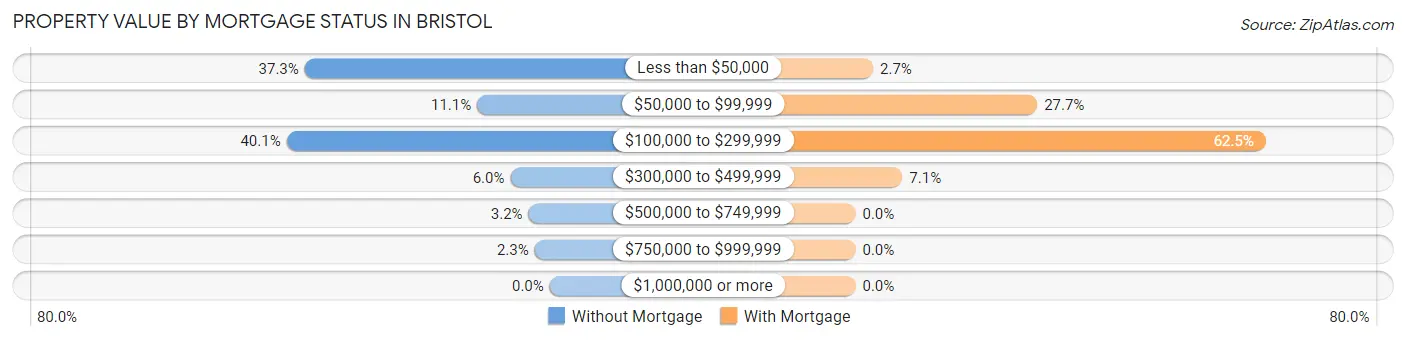
| Property Value | Without Mortgage | With Mortgage |
| Less than $50,000 | 81 (37.3%) | 3 (2.7%) |
| $50,000 to $99,999 | 24 (11.1%) | 31 (27.7%) |
| $100,000 to $299,999 | 87 (40.1%) | 70 (62.5%) |
| $300,000 to $499,999 | 13 (6.0%) | 8 (7.1%) |
| $500,000 to $749,999 | 7 (3.2%) | 0 (0.0%) |
| $750,000 to $999,999 | 5 (2.3%) | 0 (0.0%) |
| $1,000,000 or more | 0 (0.0%) | 0 (0.0%) |
| Total | 217 (100.0%) | 112 (100.0%) |
Household Income by Mortgage Status in Bristol
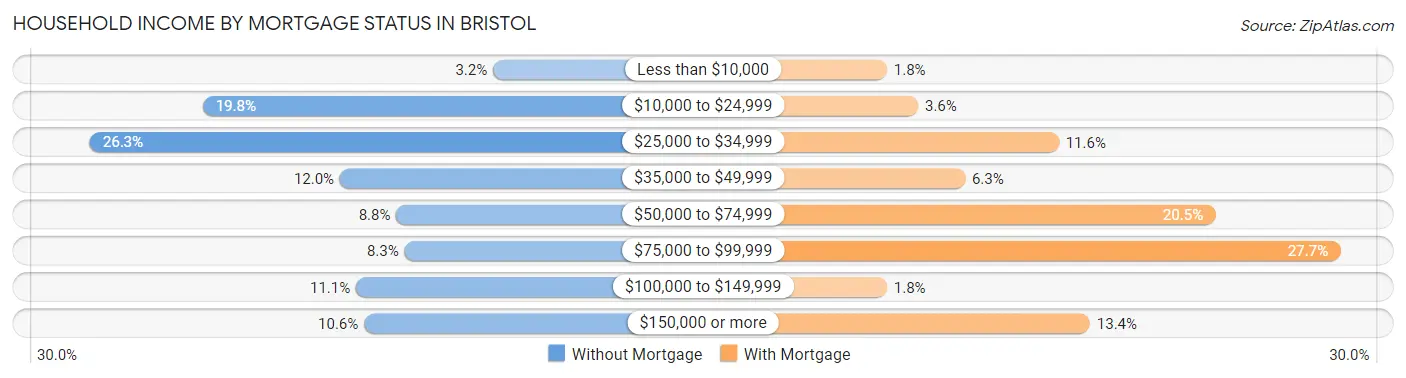
| Household Income | Without Mortgage | With Mortgage |
| Less than $10,000 | 7 (3.2%) | 2 (1.8%) |
| $10,000 to $24,999 | 43 (19.8%) | 4 (3.6%) |
| $25,000 to $34,999 | 57 (26.3%) | 13 (11.6%) |
| $35,000 to $49,999 | 26 (12.0%) | 7 (6.2%) |
| $50,000 to $74,999 | 19 (8.8%) | 23 (20.5%) |
| $75,000 to $99,999 | 18 (8.3%) | 31 (27.7%) |
| $100,000 to $149,999 | 24 (11.1%) | 2 (1.8%) |
| $150,000 or more | 23 (10.6%) | 15 (13.4%) |
| Total | 217 (100.0%) | 112 (100.0%) |
Property Value to Household Income Ratio in Bristol
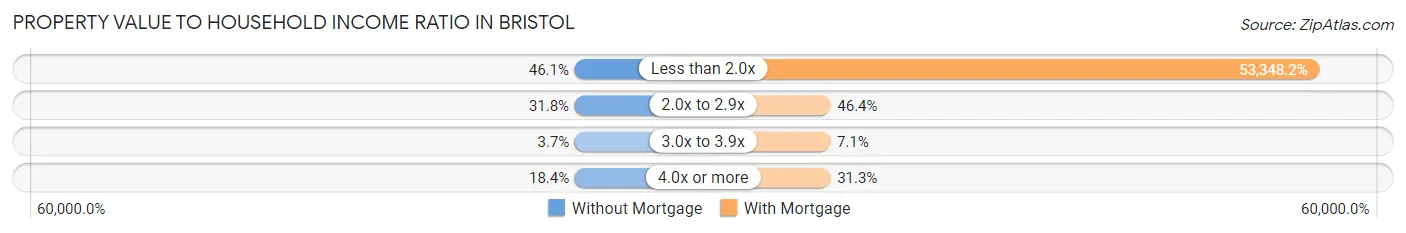
| Value-to-Income Ratio | Without Mortgage | With Mortgage |
| Less than 2.0x | 100 (46.1%) | 59,750 (53,348.2%) |
| 2.0x to 2.9x | 69 (31.8%) | 52 (46.4%) |
| 3.0x to 3.9x | 8 (3.7%) | 8 (7.1%) |
| 4.0x or more | 40 (18.4%) | 35 (31.2%) |
| Total | 217 (100.0%) | 112 (100.0%) |
Real Estate Taxes by Mortgage Status in Bristol
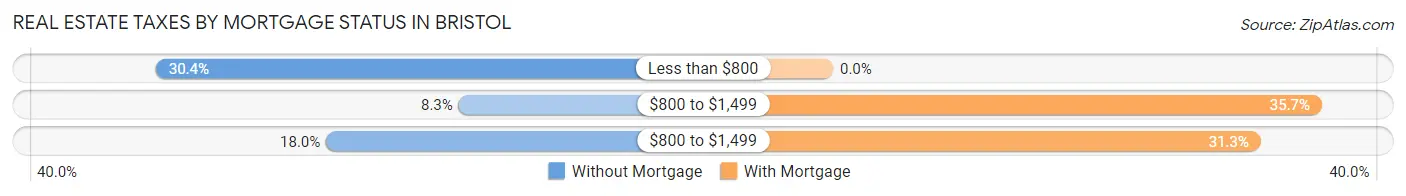
| Property Taxes | Without Mortgage | With Mortgage |
| Less than $800 | 66 (30.4%) | 0 (0.0%) |
| $800 to $1,499 | 18 (8.3%) | 40 (35.7%) |
| $800 to $1,499 | 39 (18.0%) | 35 (31.2%) |
| Total | 217 (100.0%) | 112 (100.0%) |
Health & Disability in Bristol
Health Insurance Coverage by Age in Bristol
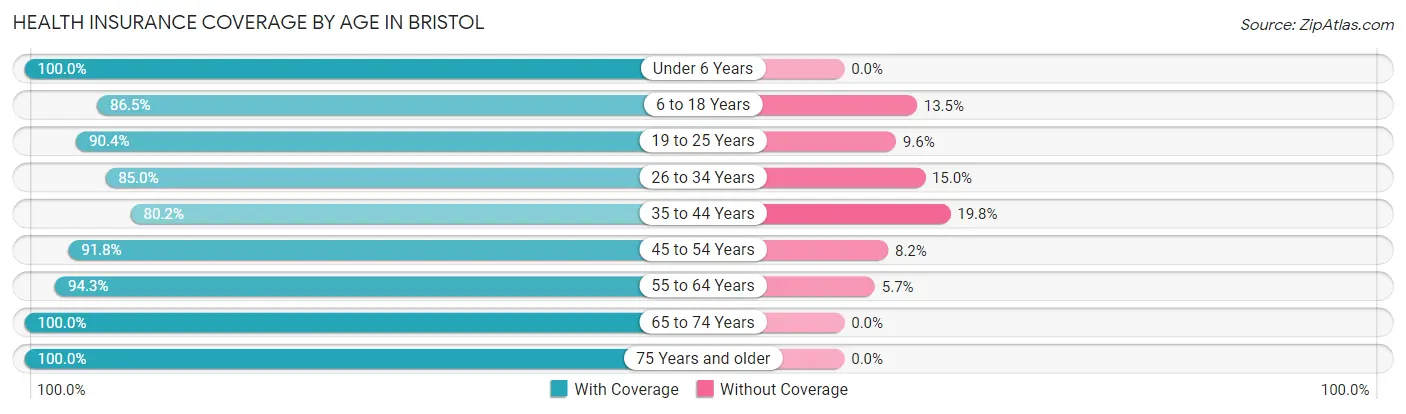
| Age Bracket | With Coverage | Without Coverage |
| Under 6 Years | 83 (100.0%) | 0 (0.0%) |
| 6 to 18 Years | 275 (86.5%) | 43 (13.5%) |
| 19 to 25 Years | 47 (90.4%) | 5 (9.6%) |
| 26 to 34 Years | 113 (85.0%) | 20 (15.0%) |
| 35 to 44 Years | 142 (80.2%) | 35 (19.8%) |
| 45 to 54 Years | 90 (91.8%) | 8 (8.2%) |
| 55 to 64 Years | 182 (94.3%) | 11 (5.7%) |
| 65 to 74 Years | 88 (100.0%) | 0 (0.0%) |
| 75 Years and older | 172 (100.0%) | 0 (0.0%) |
| Total | 1,192 (90.7%) | 122 (9.3%) |
Health Insurance Coverage by Citizenship Status in Bristol
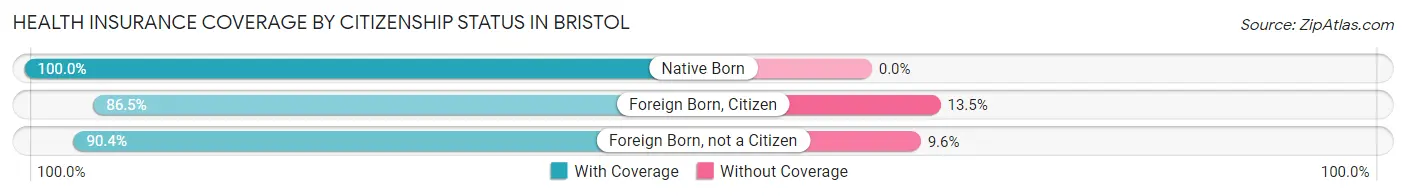
| Citizenship Status | With Coverage | Without Coverage |
| Native Born | 83 (100.0%) | 0 (0.0%) |
| Foreign Born, Citizen | 275 (86.5%) | 43 (13.5%) |
| Foreign Born, not a Citizen | 47 (90.4%) | 5 (9.6%) |
Health Insurance Coverage by Household Income in Bristol
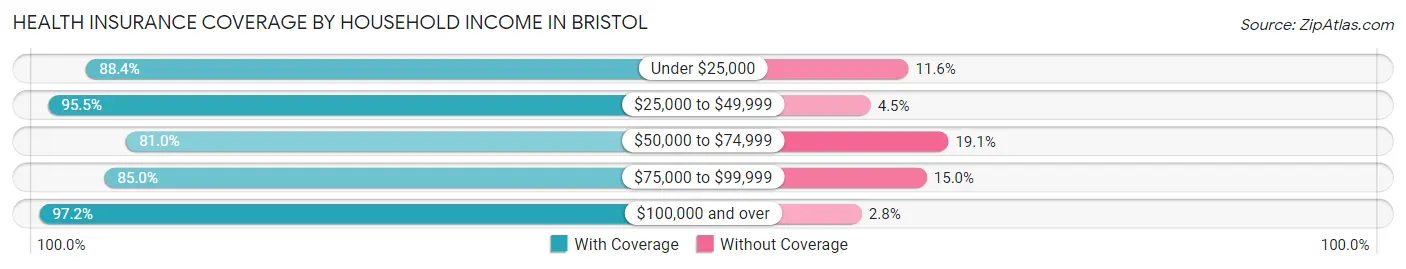
| Household Income | With Coverage | Without Coverage |
| Under $25,000 | 168 (88.4%) | 22 (11.6%) |
| $25,000 to $49,999 | 425 (95.5%) | 20 (4.5%) |
| $50,000 to $74,999 | 238 (80.9%) | 56 (19.1%) |
| $75,000 to $99,999 | 102 (85.0%) | 18 (15.0%) |
| $100,000 and over | 206 (97.2%) | 6 (2.8%) |
Public vs Private Health Insurance Coverage by Age in Bristol
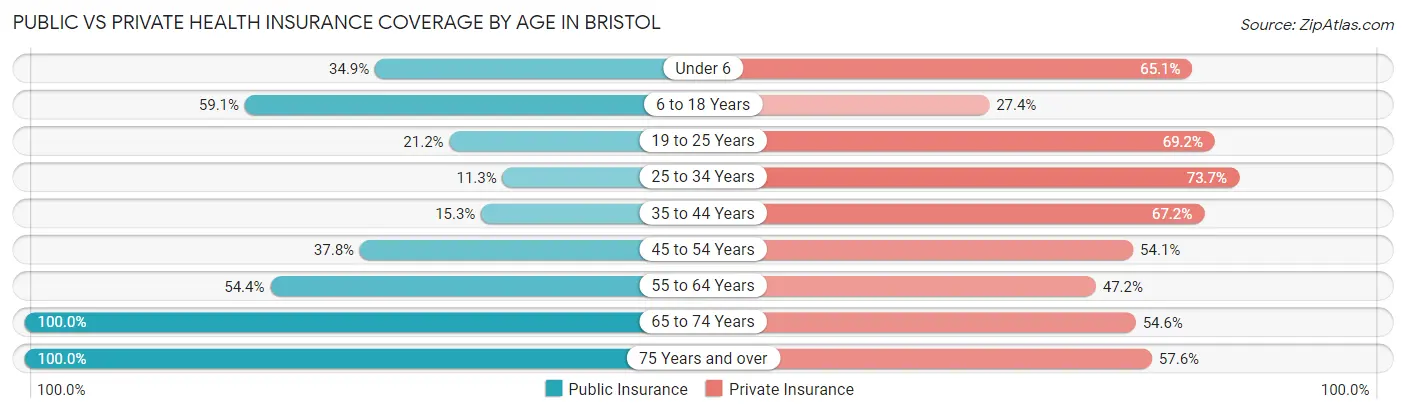
| Age Bracket | Public Insurance | Private Insurance |
| Under 6 | 29 (34.9%) | 54 (65.1%) |
| 6 to 18 Years | 188 (59.1%) | 87 (27.4%) |
| 19 to 25 Years | 11 (21.1%) | 36 (69.2%) |
| 25 to 34 Years | 15 (11.3%) | 98 (73.7%) |
| 35 to 44 Years | 27 (15.2%) | 119 (67.2%) |
| 45 to 54 Years | 37 (37.8%) | 53 (54.1%) |
| 55 to 64 Years | 105 (54.4%) | 91 (47.1%) |
| 65 to 74 Years | 88 (100.0%) | 48 (54.5%) |
| 75 Years and over | 172 (100.0%) | 99 (57.6%) |
| Total | 672 (51.1%) | 685 (52.1%) |
Disability Status by Sex by Age in Bristol
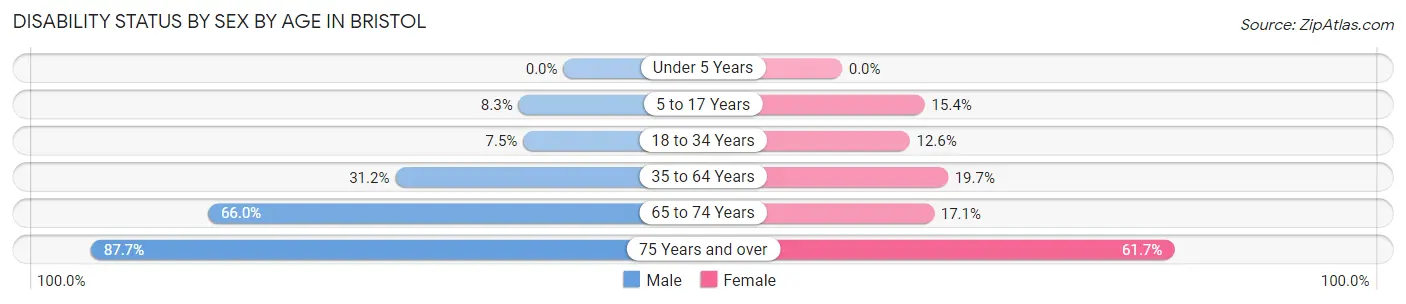
| Age Bracket | Male | Female |
| Under 5 Years | 0 (0.0%) | 0 (0.0%) |
| 5 to 17 Years | 10 (8.3%) | 18 (15.4%) |
| 18 to 34 Years | 10 (7.5%) | 19 (12.6%) |
| 35 to 64 Years | 73 (31.2%) | 46 (19.7%) |
| 65 to 74 Years | 31 (66.0%) | 7 (17.1%) |
| 75 Years and over | 57 (87.7%) | 66 (61.7%) |
Disability Class by Sex by Age in Bristol
Disability Class: Hearing Difficulty
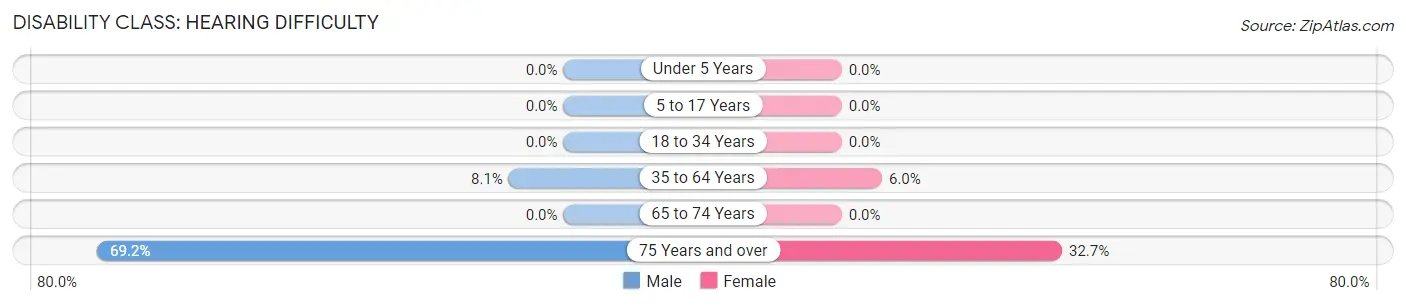
| Age Bracket | Male | Female |
| Under 5 Years | 0 (0.0%) | 0 (0.0%) |
| 5 to 17 Years | 0 (0.0%) | 0 (0.0%) |
| 18 to 34 Years | 0 (0.0%) | 0 (0.0%) |
| 35 to 64 Years | 19 (8.1%) | 14 (6.0%) |
| 65 to 74 Years | 0 (0.0%) | 0 (0.0%) |
| 75 Years and over | 45 (69.2%) | 35 (32.7%) |
Disability Class: Vision Difficulty
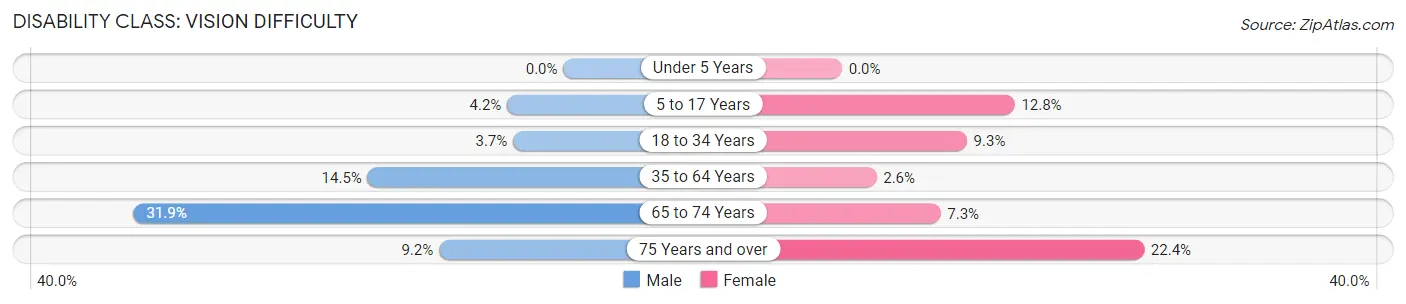
| Age Bracket | Male | Female |
| Under 5 Years | 0 (0.0%) | 0 (0.0%) |
| 5 to 17 Years | 5 (4.2%) | 15 (12.8%) |
| 18 to 34 Years | 5 (3.7%) | 14 (9.3%) |
| 35 to 64 Years | 34 (14.5%) | 6 (2.6%) |
| 65 to 74 Years | 15 (31.9%) | 3 (7.3%) |
| 75 Years and over | 6 (9.2%) | 24 (22.4%) |
Disability Class: Cognitive Difficulty
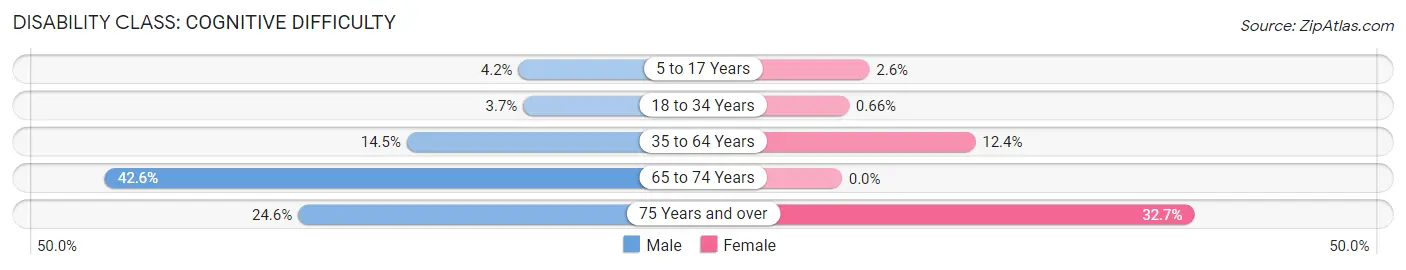
| Age Bracket | Male | Female |
| 5 to 17 Years | 5 (4.2%) | 3 (2.6%) |
| 18 to 34 Years | 5 (3.7%) | 1 (0.7%) |
| 35 to 64 Years | 34 (14.5%) | 29 (12.4%) |
| 65 to 74 Years | 20 (42.5%) | 0 (0.0%) |
| 75 Years and over | 16 (24.6%) | 35 (32.7%) |
Disability Class: Ambulatory Difficulty
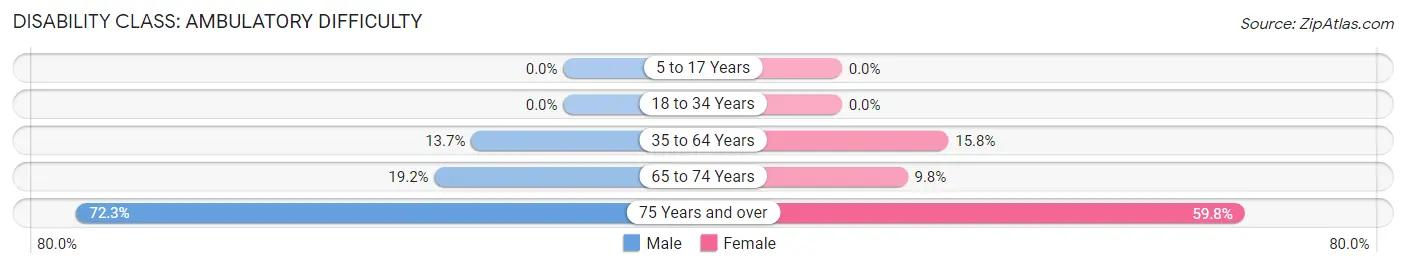
| Age Bracket | Male | Female |
| 5 to 17 Years | 0 (0.0%) | 0 (0.0%) |
| 18 to 34 Years | 0 (0.0%) | 0 (0.0%) |
| 35 to 64 Years | 32 (13.7%) | 37 (15.8%) |
| 65 to 74 Years | 9 (19.2%) | 4 (9.8%) |
| 75 Years and over | 47 (72.3%) | 64 (59.8%) |
Disability Class: Self-Care Difficulty
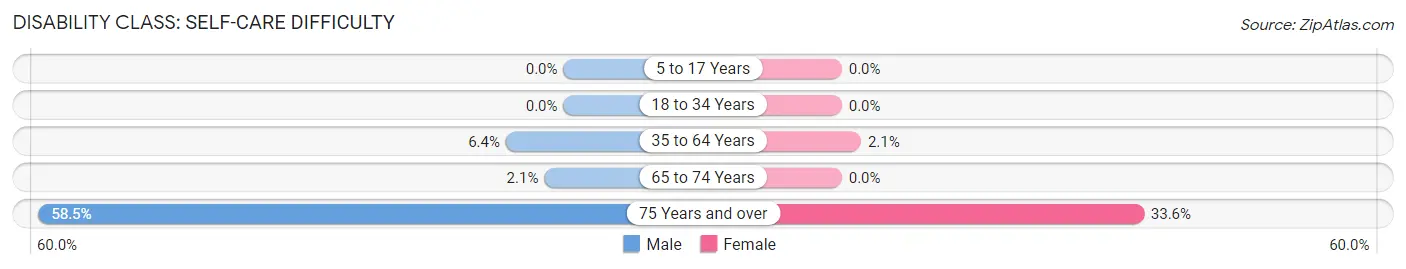
| Age Bracket | Male | Female |
| 5 to 17 Years | 0 (0.0%) | 0 (0.0%) |
| 18 to 34 Years | 0 (0.0%) | 0 (0.0%) |
| 35 to 64 Years | 15 (6.4%) | 5 (2.1%) |
| 65 to 74 Years | 1 (2.1%) | 0 (0.0%) |
| 75 Years and over | 38 (58.5%) | 36 (33.6%) |
Technology Access in Bristol
Computing Device Access in Bristol
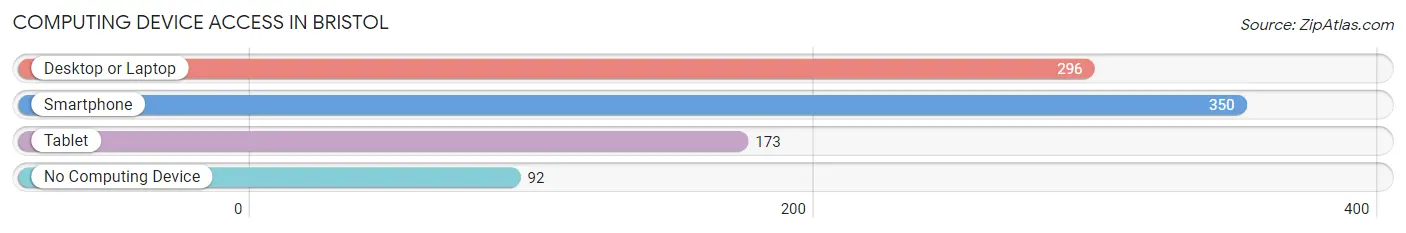
| Device Type | # Households | % Households |
| Desktop or Laptop | 296 | 65.9% |
| Smartphone | 350 | 77.9% |
| Tablet | 173 | 38.5% |
| No Computing Device | 92 | 20.5% |
| Total | 449 | 100.0% |
Internet Access in Bristol
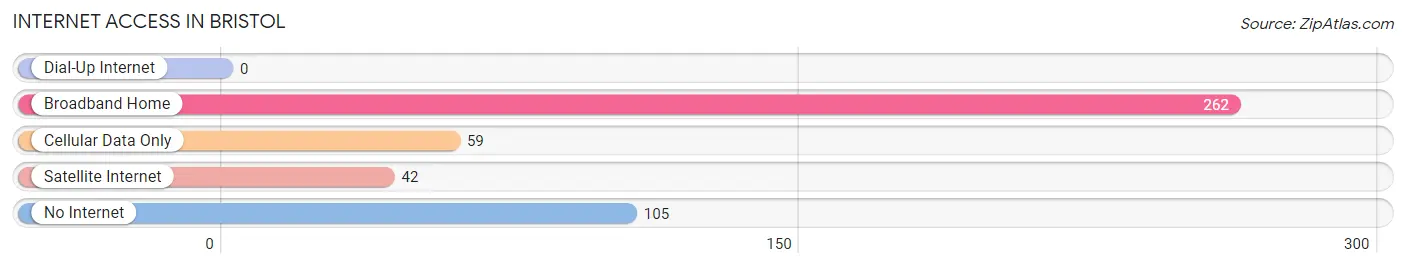
| Internet Type | # Households | % Households |
| Dial-Up Internet | 0 | 0.0% |
| Broadband Home | 262 | 58.4% |
| Cellular Data Only | 59 | 13.1% |
| Satellite Internet | 42 | 9.3% |
| No Internet | 105 | 23.4% |
| Total | 449 | 100.0% |
Bristol Summary
Bristol, Florida is a small town located in Liberty County, in the panhandle of Florida. It is situated on the Apalachicola River, about 30 miles from the Gulf of Mexico. The town was founded in 1843 and was named after Bristol, England. Bristol is a rural community with a population of 1,845 as of the 2010 census.
Geography
Bristol is located in the panhandle of Florida, in Liberty County. It is situated on the Apalachicola River, about 30 miles from the Gulf of Mexico. The town is located in the Apalachicola National Forest, which is a protected area of over 600,000 acres of land. The town is surrounded by pine forests and is home to a variety of wildlife, including deer, wild turkeys, and black bears. The town is also home to a variety of birds, including bald eagles, ospreys, and woodpeckers.
Economy
Bristol’s economy is largely based on agriculture and forestry. The town is home to several farms, which produce a variety of crops, including corn, soybeans, and cotton. The town is also home to several timber companies, which harvest timber from the surrounding forests. The town is also home to several small businesses, including restaurants, convenience stores, and gas stations.
Demographics
As of the 2010 census, Bristol had a population of 1,845. The population is predominantly white, with African Americans making up about 10% of the population. The median household income is $30,000, and the median age is 44. The town is home to a variety of religious denominations, including Baptist, Methodist, and Catholic.
History
Bristol was founded in 1843 and was named after Bristol, England. The town was originally a trading post for the local Native American tribes. In the late 1800s, the town became a center for the timber industry, and the Apalachicola River was used to transport logs to the sawmills. In the early 1900s, the town became a center for the cotton industry, and the town’s population grew rapidly. In the 1950s, the town began to decline, as the timber and cotton industries moved away. In the late 1990s, the town began to experience a resurgence, as new businesses moved into the area. Today, Bristol is a small, rural community with a population of 1,845.
Common Questions
What is the Total Population of Bristol?
Total Population of Bristol is 1,351.
What is the Total Male Population of Bristol?
Total Male Population of Bristol is 666.
What is the Total Female Population of Bristol?
Total Female Population of Bristol is 685.
What is the Ratio of Males per 100 Females in Bristol?
There are 97.23 Males per 100 Females in Bristol.
What is the Ratio of Females per 100 Males in Bristol?
There are 102.85 Females per 100 Males in Bristol.
What is the Median Population Age in Bristol?
Median Population Age in Bristol is 39.5 Years.
What is the Average Family Size in Bristol
Average Family Size in Bristol is 3.8 People.
What is the Average Household Size in Bristol
Average Household Size in Bristol is 2.8 People.
What is Per Capita Income in Bristol?
Per Capita income in Bristol is $24,904.
What is the Median Family Income in Bristol?
Median Family Income in Bristol is $50,694.
What is the Median Household income in Bristol?
Median Household Income in Bristol is $45,042.
What is Income or Wage Gap in Bristol?
Income or Wage Gap in Bristol is 14.6%.
Women in Bristol earn 85.4 cents for every dollar earned by a man.
What is Inequality or Gini Index in Bristol?
Inequality or Gini Index in Bristol is 0.46.
How Large is the Labor Force in Bristol?
There are 494 People in the Labor Forcein in Bristol.
What is the Percentage of People in the Labor Force in Bristol?
46.0% of People are in the Labor Force in Bristol.
What is the Unemployment Rate in Bristol?
Unemployment Rate in Bristol is 6.5%.