Subsaharan African vs Cypriot Disability Age 65 to 74
COMPARE
Subsaharan African
Cypriot
Disability Age 65 to 74
Disability Age 65 to 74 Comparison
Sub-Saharan Africans
Cypriots
25.1%
DISABILITY AGE 65 TO 74
0.6/ 100
METRIC RATING
253rd/ 347
METRIC RANK
20.1%
DISABILITY AGE 65 TO 74
100.0/ 100
METRIC RATING
7th/ 347
METRIC RANK
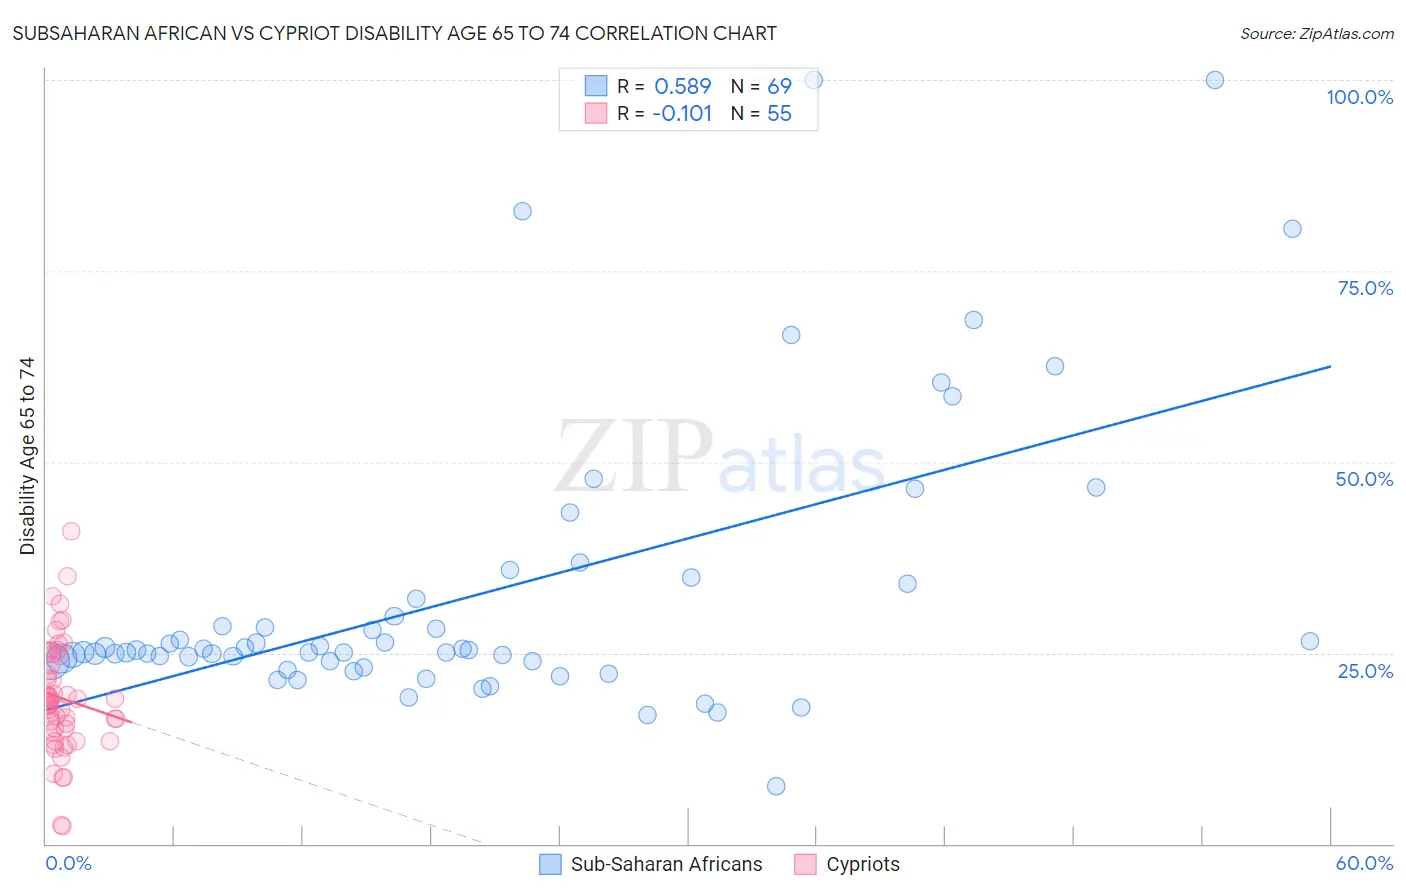
Subsaharan African vs Cypriot Disability Age 65 to 74 Correlation Chart
The statistical analysis conducted on geographies consisting of 506,486,159 people shows a substantial positive correlation between the proportion of Sub-Saharan Africans and percentage of population with a disability between the ages 65 and 75 in the United States with a correlation coefficient (R) of 0.589 and weighted average of 25.1%. Similarly, the statistical analysis conducted on geographies consisting of 61,803,006 people shows a poor negative correlation between the proportion of Cypriots and percentage of population with a disability between the ages 65 and 75 in the United States with a correlation coefficient (R) of -0.101 and weighted average of 20.1%, a difference of 24.9%.
Disability Age 65 to 74 Correlation Summary
| Measurement | Subsaharan African | Cypriot |
| Minimum | 7.5% | 2.3% |
| Maximum | 100.0% | 41.0% |
| Range | 92.5% | 38.6% |
| Mean | 32.6% | 19.1% |
| Median | 25.4% | 18.4% |
| Interquartile 25% (IQ1) | 23.9% | 14.6% |
| Interquartile 75% (IQ3) | 33.0% | 24.6% |
| Interquartile Range (IQR) | 9.1% | 9.9% |
| Standard Deviation (Sample) | 18.8% | 7.4% |
| Standard Deviation (Population) | 18.7% | 7.4% |
Similar Demographics by Disability Age 65 to 74
Demographics Similar to Sub-Saharan Africans by Disability Age 65 to 74
In terms of disability age 65 to 74, the demographic groups most similar to Sub-Saharan Africans are Immigrants from El Salvador (25.1%, a difference of 0.030%), Somali (25.1%, a difference of 0.080%), Nonimmigrants (25.0%, a difference of 0.23%), Central American (25.1%, a difference of 0.23%), and Salvadoran (25.0%, a difference of 0.43%).
| Demographics | Rating | Rank | Disability Age 65 to 74 |
| Immigrants | Iraq | 1.9 /100 | #246 | Tragic 24.7% |
| Indonesians | 1.1 /100 | #247 | Tragic 24.9% |
| Senegalese | 0.9 /100 | #248 | Tragic 24.9% |
| Immigrants | Fiji | 0.8 /100 | #249 | Tragic 25.0% |
| Salvadorans | 0.8 /100 | #250 | Tragic 25.0% |
| Immigrants | Nonimmigrants | 0.7 /100 | #251 | Tragic 25.0% |
| Immigrants | El Salvador | 0.6 /100 | #252 | Tragic 25.1% |
| Sub-Saharan Africans | 0.6 /100 | #253 | Tragic 25.1% |
| Somalis | 0.6 /100 | #254 | Tragic 25.1% |
| Central Americans | 0.5 /100 | #255 | Tragic 25.1% |
| Immigrants | Somalia | 0.4 /100 | #256 | Tragic 25.2% |
| Guamanians/Chamorros | 0.3 /100 | #257 | Tragic 25.3% |
| Marshallese | 0.3 /100 | #258 | Tragic 25.3% |
| Immigrants | Cambodia | 0.3 /100 | #259 | Tragic 25.3% |
| Malaysians | 0.2 /100 | #260 | Tragic 25.4% |
Demographics Similar to Cypriots by Disability Age 65 to 74
In terms of disability age 65 to 74, the demographic groups most similar to Cypriots are Thai (20.1%, a difference of 0.040%), Iranian (19.9%, a difference of 0.67%), Immigrants from Israel (19.9%, a difference of 0.78%), Immigrants from China (20.3%, a difference of 0.99%), and Immigrants from Eastern Asia (20.3%, a difference of 1.1%).
| Demographics | Rating | Rank | Disability Age 65 to 74 |
| Immigrants | Taiwan | 100.0 /100 | #1 | Exceptional 18.8% |
| Filipinos | 100.0 /100 | #2 | Exceptional 19.0% |
| Immigrants | India | 100.0 /100 | #3 | Exceptional 19.7% |
| Immigrants | Hong Kong | 100.0 /100 | #4 | Exceptional 19.9% |
| Immigrants | Israel | 100.0 /100 | #5 | Exceptional 19.9% |
| Iranians | 100.0 /100 | #6 | Exceptional 19.9% |
| Cypriots | 100.0 /100 | #7 | Exceptional 20.1% |
| Thais | 100.0 /100 | #8 | Exceptional 20.1% |
| Immigrants | China | 100.0 /100 | #9 | Exceptional 20.3% |
| Immigrants | Eastern Asia | 100.0 /100 | #10 | Exceptional 20.3% |
| Immigrants | Ireland | 100.0 /100 | #11 | Exceptional 20.3% |
| Immigrants | Korea | 100.0 /100 | #12 | Exceptional 20.4% |
| Immigrants | Singapore | 100.0 /100 | #13 | Exceptional 20.4% |
| Indians (Asian) | 100.0 /100 | #14 | Exceptional 20.5% |
| Paraguayans | 100.0 /100 | #15 | Exceptional 20.5% |