Rising Sun Lebanon, DE
Rising Sun Lebanon Map
Rising Sun Lebanon Overview
4,060
TOTAL POPULATION
2,037
MALE POPULATION
2,023
FEMALE POPULATION
100.69
MALES / 100 FEMALES
99.31
FEMALES / 100 MALES
31.5
MEDIAN AGE
3.4
AVG FAMILY SIZE
3.4
AVG HOUSEHOLD SIZE
$29,812
PER CAPITA INCOME
$76,370
AVG FAMILY INCOME
$78,205
AVG HOUSEHOLD INCOME
5.0%
WAGE / INCOME GAP [ % ]
95.0¢/ $1
WAGE / INCOME GAP [ $ ]
0.32
INEQUALITY / GINI INDEX
1,702
LABOR FORCE [ PEOPLE ]
59.9%
PERCENT IN LABOR FORCE
1.3%
UNEMPLOYMENT RATE
Race in Rising Sun Lebanon
The most populous races in Rising Sun Lebanon are White / Caucasian (2,418 | 59.6%), Black / African American (1,024 | 25.2%), and Two or more Races (409 | 10.1%).
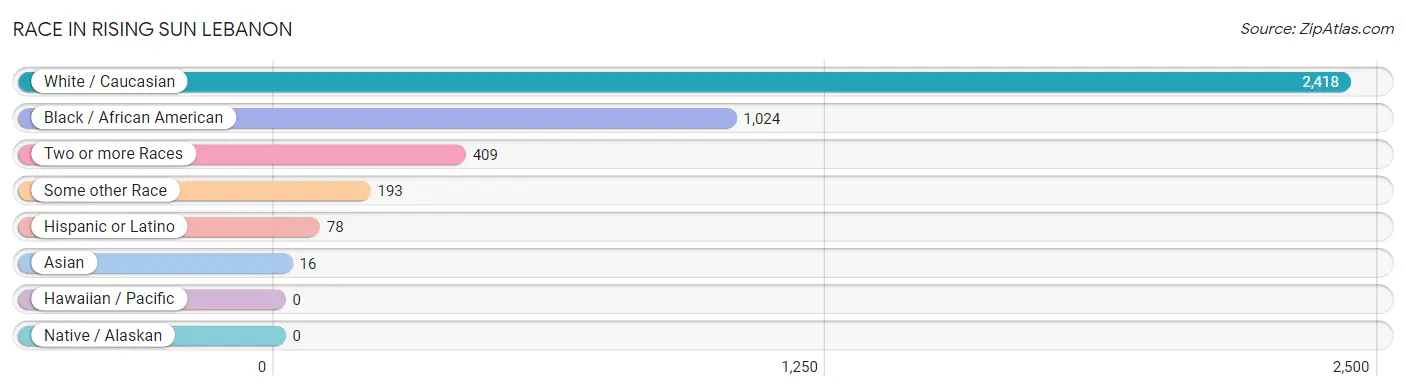
| Race | # Population | % Population |
| Asian | 16 | 0.4% |
| Black / African American | 1,024 | 25.2% |
| Hawaiian / Pacific | 0 | 0.0% |
| Hispanic or Latino | 78 | 1.9% |
| Native / Alaskan | 0 | 0.0% |
| White / Caucasian | 2,418 | 59.6% |
| Two or more Races | 409 | 10.1% |
| Some other Race | 193 | 4.8% |
| Total | 4,060 | 100.0% |
Ancestry in Rising Sun Lebanon
The most populous ancestries reported in Rising Sun Lebanon are Irish (738 | 18.2%), German (550 | 13.6%), Subsaharan African (444 | 10.9%), Liberian (438 | 10.8%), and Italian (300 | 7.4%), together accounting for 60.8% of all Rising Sun Lebanon residents.
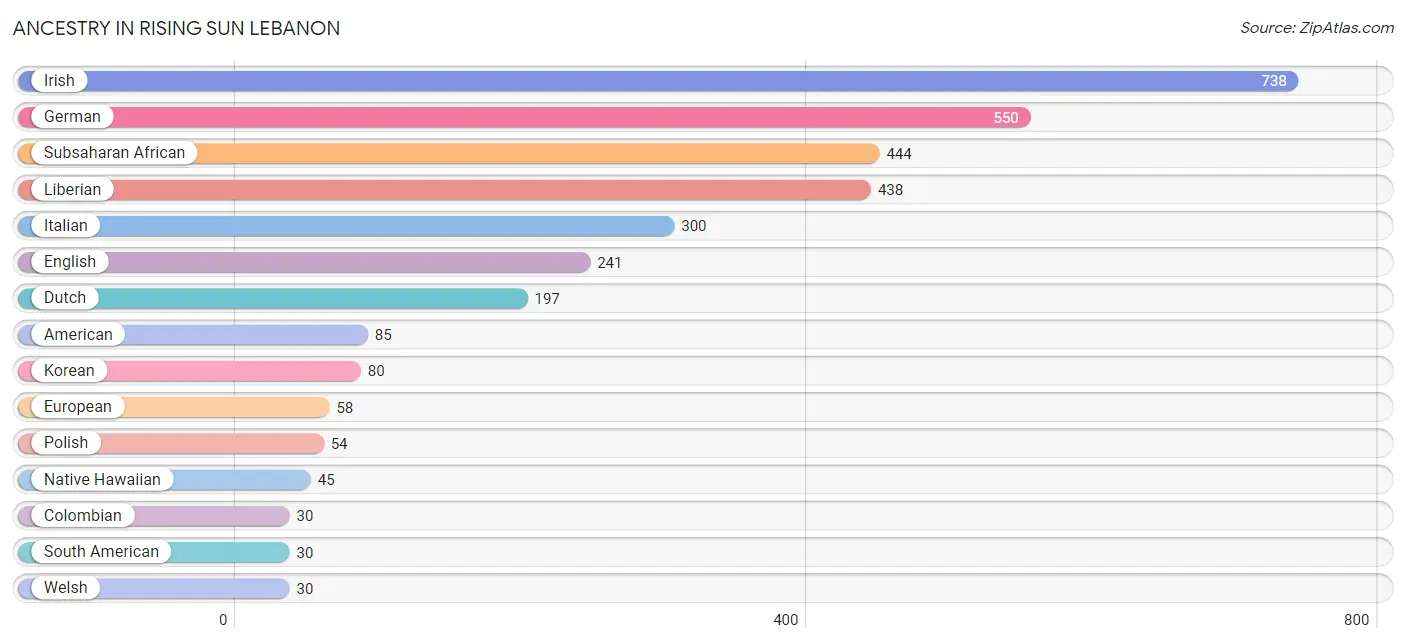
| Ancestry | # Population | % Population |
| African | 1 | 0.0% |
| American | 85 | 2.1% |
| Arab | 7 | 0.2% |
| Bhutanese | 28 | 0.7% |
| Canadian | 29 | 0.7% |
| Colombian | 30 | 0.7% |
| Dutch | 197 | 4.9% |
| English | 241 | 5.9% |
| European | 58 | 1.4% |
| French | 8 | 0.2% |
| German | 550 | 13.6% |
| Ghanaian | 5 | 0.1% |
| Indian (Asian) | 10 | 0.3% |
| Irish | 738 | 18.2% |
| Italian | 300 | 7.4% |
| Korean | 80 | 2.0% |
| Lebanese | 7 | 0.2% |
| Liberian | 438 | 10.8% |
| Mexican | 28 | 0.7% |
| Native Hawaiian | 45 | 1.1% |
| Polish | 54 | 1.3% |
| Portuguese | 9 | 0.2% |
| Puerto Rican | 7 | 0.2% |
| Scotch-Irish | 14 | 0.3% |
| Serbian | 28 | 0.7% |
| South American | 30 | 0.7% |
| Spanish | 13 | 0.3% |
| Subsaharan African | 444 | 10.9% |
| Welsh | 30 | 0.7% |
| West Indian | 7 | 0.2% | View All 30 Rows |
Immigrants in Rising Sun Lebanon
The most numerous immigrant groups reported in Rising Sun Lebanon came from Africa (223 | 5.5%), Western Africa (223 | 5.5%), Liberia (217 | 5.3%), Canada (32 | 0.8%), and Asia (16 | 0.4%), together accounting for 17.5% of all Rising Sun Lebanon residents.
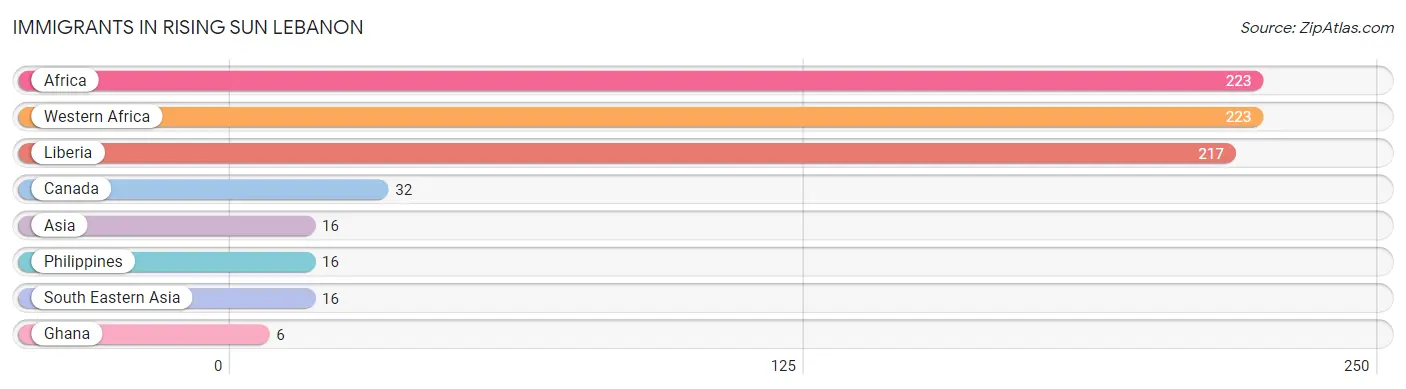
| Immigration Origin | # Population | % Population |
| Africa | 223 | 5.5% |
| Asia | 16 | 0.4% |
| Canada | 32 | 0.8% |
| Ghana | 6 | 0.2% |
| Liberia | 217 | 5.3% |
| Philippines | 16 | 0.4% |
| South Eastern Asia | 16 | 0.4% |
| Western Africa | 223 | 5.5% | View All 8 Rows |
Sex and Age in Rising Sun Lebanon
Sex and Age in Rising Sun Lebanon
The most populous age groups in Rising Sun Lebanon are Under 5 Years (417 | 20.5%) for men and 5 to 9 Years (279 | 13.8%) for women.
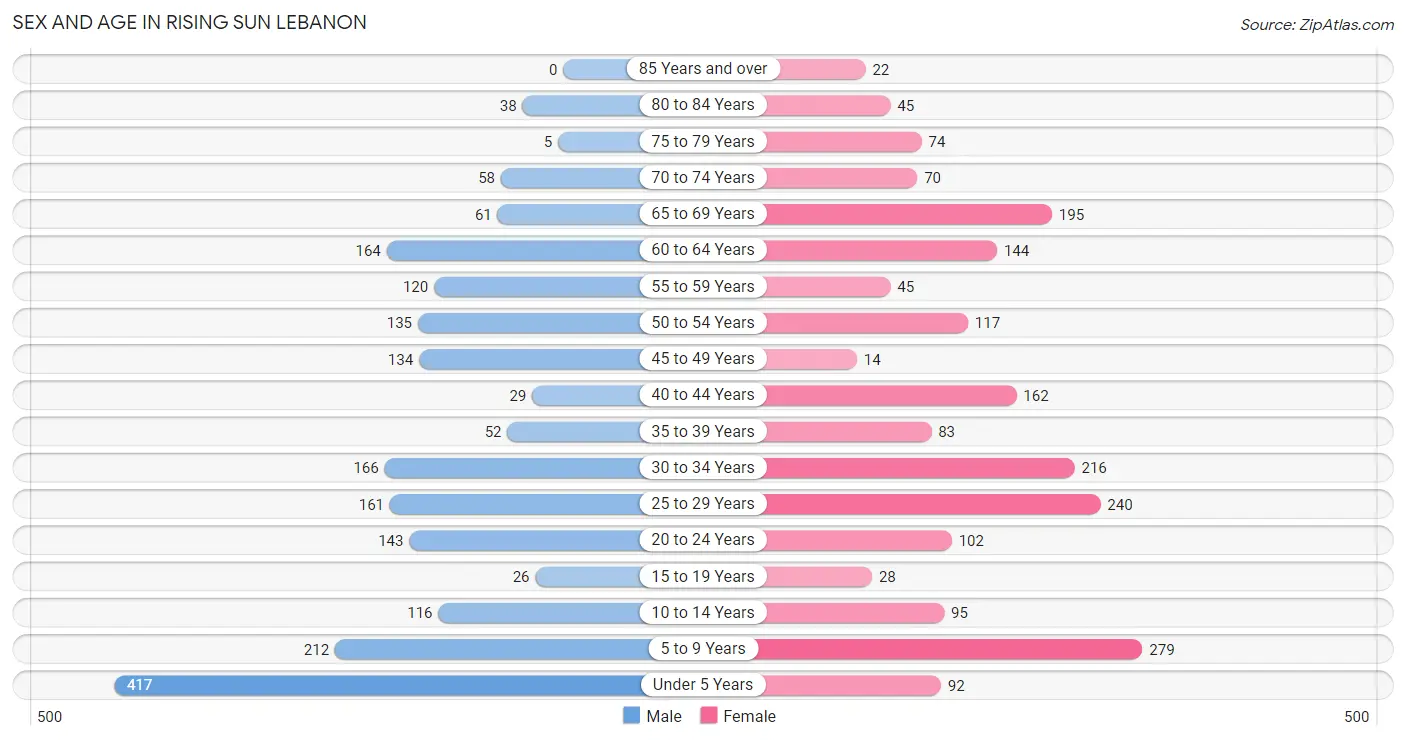
| Age Bracket | Male | Female |
| Under 5 Years | 417 (20.5%) | 92 (4.5%) |
| 5 to 9 Years | 212 (10.4%) | 279 (13.8%) |
| 10 to 14 Years | 116 (5.7%) | 95 (4.7%) |
| 15 to 19 Years | 26 (1.3%) | 28 (1.4%) |
| 20 to 24 Years | 143 (7.0%) | 102 (5.0%) |
| 25 to 29 Years | 161 (7.9%) | 240 (11.9%) |
| 30 to 34 Years | 166 (8.2%) | 216 (10.7%) |
| 35 to 39 Years | 52 (2.5%) | 83 (4.1%) |
| 40 to 44 Years | 29 (1.4%) | 162 (8.0%) |
| 45 to 49 Years | 134 (6.6%) | 14 (0.7%) |
| 50 to 54 Years | 135 (6.6%) | 117 (5.8%) |
| 55 to 59 Years | 120 (5.9%) | 45 (2.2%) |
| 60 to 64 Years | 164 (8.1%) | 144 (7.1%) |
| 65 to 69 Years | 61 (3.0%) | 195 (9.6%) |
| 70 to 74 Years | 58 (2.9%) | 70 (3.5%) |
| 75 to 79 Years | 5 (0.3%) | 74 (3.7%) |
| 80 to 84 Years | 38 (1.9%) | 45 (2.2%) |
| 85 Years and over | 0 (0.0%) | 22 (1.1%) |
| Total | 2,037 (100.0%) | 2,023 (100.0%) |
Families and Households in Rising Sun Lebanon
Median Family Size in Rising Sun Lebanon
The median family size in Rising Sun Lebanon is 3.41 persons per family, with married-couple families (701 | 69.6%) accounting for the largest median family size of 3.64 persons per family. On the other hand, single male/father families (127 | 12.6%) represent the smallest median family size with 2.54 persons per family.
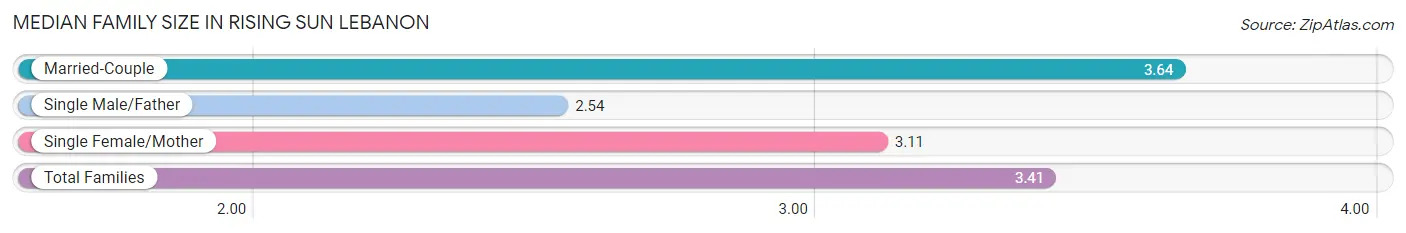
| Family Type | # Families | Family Size |
| Married-Couple | 701 (69.6%) | 3.64 |
| Single Male/Father | 127 (12.6%) | 2.54 |
| Single Female/Mother | 179 (17.8%) | 3.11 |
| Total Families | 1,007 (100.0%) | 3.41 |
Median Household Size in Rising Sun Lebanon
The median household size in Rising Sun Lebanon is 3.37 persons per household, with married-couple households (701 | 58.2%) accounting for the largest median household size of 3.98 persons per household. non-family households (197 | 16.4%) represent the smallest median household size with 1.25 persons per household.
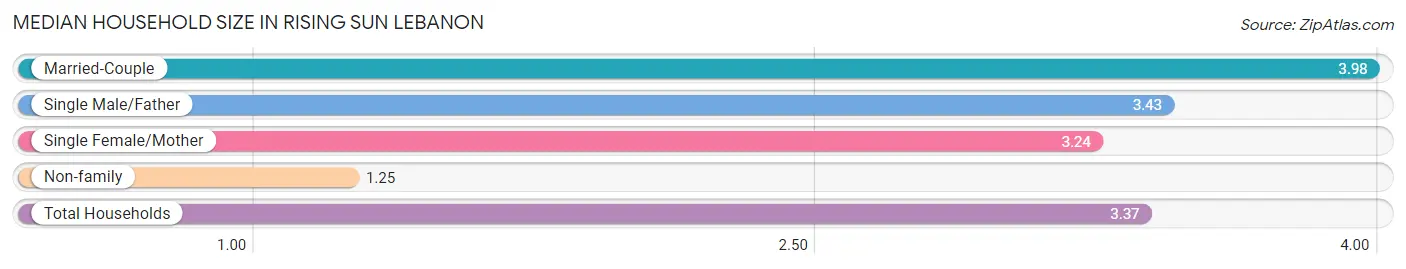
| Household Type | # Households | Household Size |
| Married-Couple | 701 (58.2%) | 3.98 |
| Single Male/Father | 127 (10.5%) | 3.43 |
| Single Female/Mother | 179 (14.9%) | 3.24 |
| Non-family | 197 (16.4%) | 1.25 |
| Total Households | 1,204 (100.0%) | 3.37 |
Household Size by Marriage Status in Rising Sun Lebanon
Out of a total of 1,204 households in Rising Sun Lebanon, 1,007 (83.6%) are family households, while 197 (16.4%) are nonfamily households. The most numerous type of family households are 2-person households, comprising 292, and the most common type of nonfamily households are 1-person households, comprising 167.
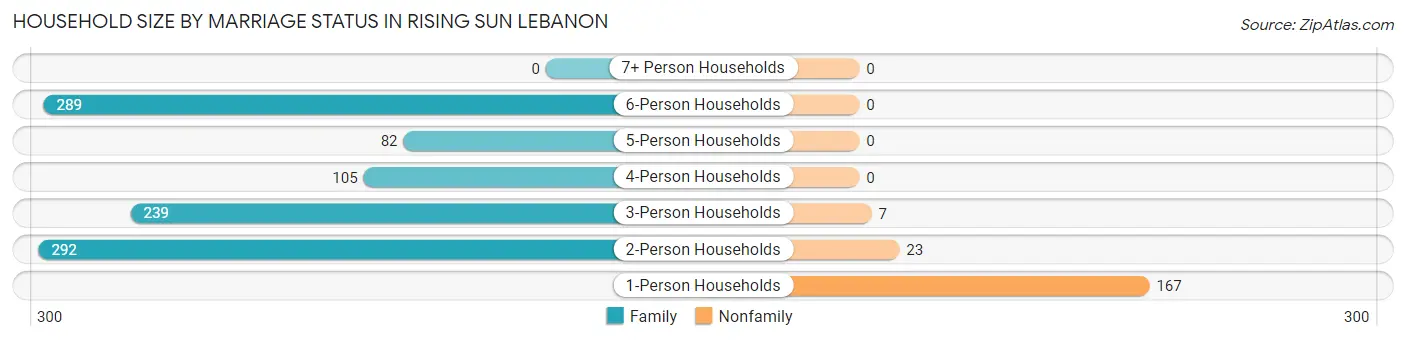
| Household Size | Family Households | Nonfamily Households |
| 1-Person Households | - | 167 (13.9%) |
| 2-Person Households | 292 (24.2%) | 23 (1.9%) |
| 3-Person Households | 239 (19.9%) | 7 (0.6%) |
| 4-Person Households | 105 (8.7%) | 0 (0.0%) |
| 5-Person Households | 82 (6.8%) | 0 (0.0%) |
| 6-Person Households | 289 (24.0%) | 0 (0.0%) |
| 7+ Person Households | 0 (0.0%) | 0 (0.0%) |
| Total | 1,007 (83.6%) | 197 (16.4%) |
Female Fertility in Rising Sun Lebanon
Fertility by Age in Rising Sun Lebanon
Average fertility rate in Rising Sun Lebanon is 102.0 births per 1,000 women. Women in the age bracket of 35 to 50 years have the highest fertility rate with 194.0 births per 1,000 women. Women in the age bracket of 35 to 50 years acount for 60.2% of all women with births.
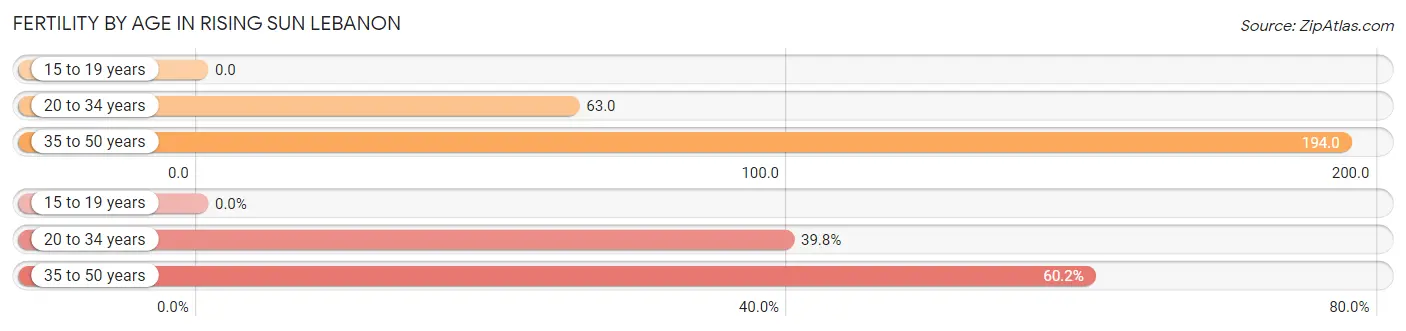
| Age Bracket | Women with Births | Births / 1,000 Women |
| 15 to 19 years | 0 (0.0%) | 0.0 |
| 20 to 34 years | 35 (39.8%) | 63.0 |
| 35 to 50 years | 53 (60.2%) | 194.0 |
| Total | 88 (100.0%) | 102.0 |
Fertility by Age by Marriage Status in Rising Sun Lebanon
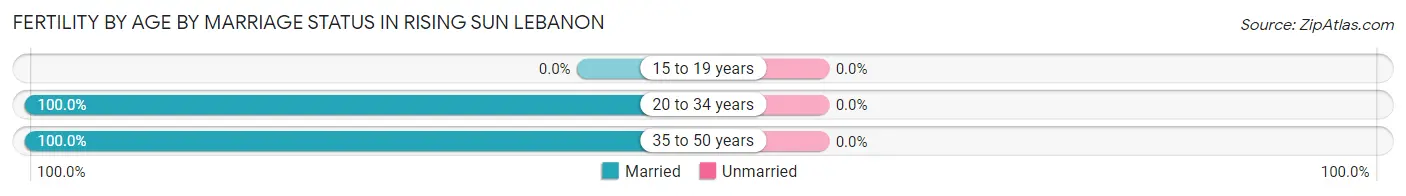
| Age Bracket | Married | Unmarried |
| 15 to 19 years | 0 (0.0%) | 0 (0.0%) |
| 20 to 34 years | 35 (100.0%) | 0 (0.0%) |
| 35 to 50 years | 53 (100.0%) | 0 (0.0%) |
| Total | 88 (100.0%) | 0 (0.0%) |
Fertility by Education in Rising Sun Lebanon
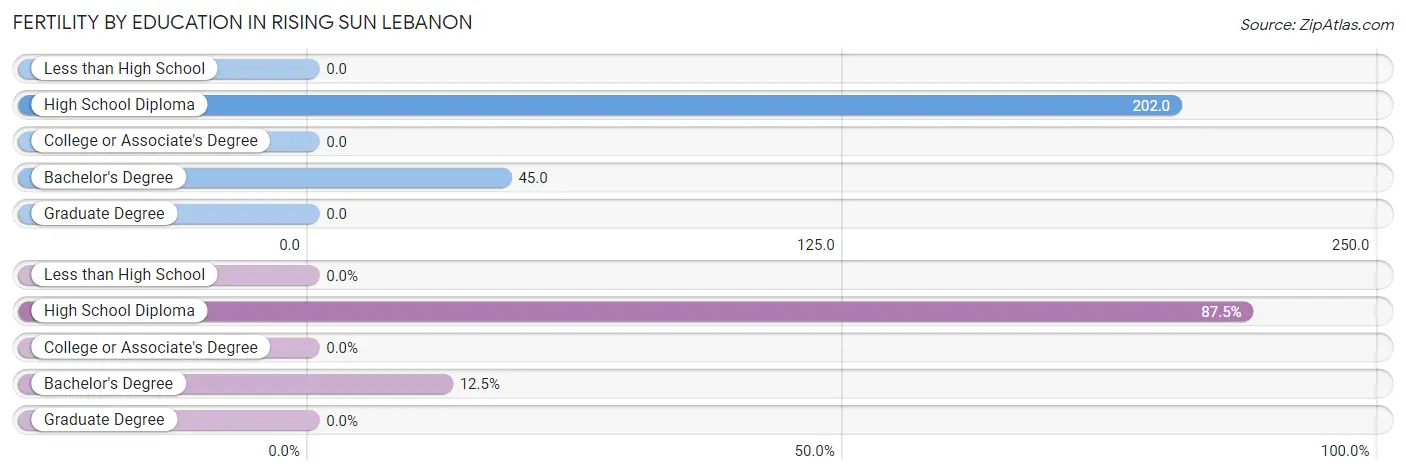
| Educational Attainment | Women with Births | Births / 1,000 Women |
| Less than High School | 0 (0.0%) | 0.0 |
| High School Diploma | 77 (87.5%) | 202.0 |
| College or Associate's Degree | 0 (0.0%) | 0.0 |
| Bachelor's Degree | 11 (12.5%) | 45.0 |
| Graduate Degree | 0 (0.0%) | 0.0 |
| Total | 88 (100.0%) | 102.0 |
Fertility by Education by Marriage Status in Rising Sun Lebanon
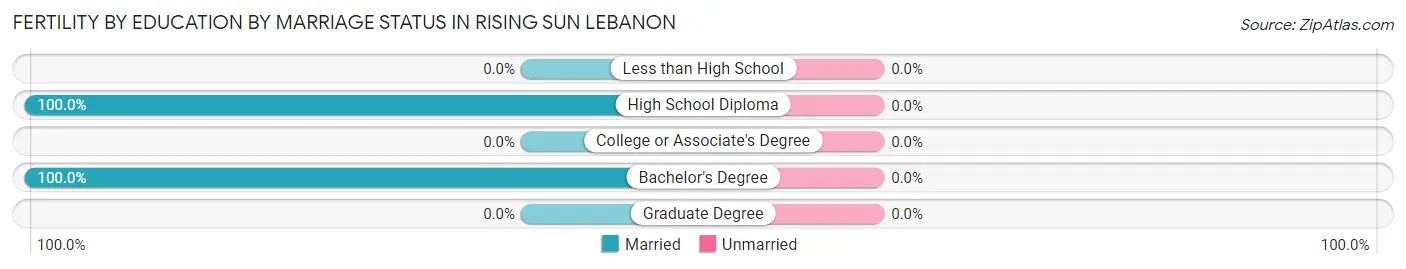
| Educational Attainment | Married | Unmarried |
| Less than High School | 0 (0.0%) | 0 (0.0%) |
| High School Diploma | 77 (100.0%) | 0 (0.0%) |
| College or Associate's Degree | 0 (0.0%) | 0 (0.0%) |
| Bachelor's Degree | 11 (100.0%) | 0 (0.0%) |
| Graduate Degree | 0 (0.0%) | 0 (0.0%) |
| Total | 88 (100.0%) | 0 (0.0%) |
Income in Rising Sun Lebanon
Income Overview in Rising Sun Lebanon
Per Capita Income in Rising Sun Lebanon is $29,812, while median incomes of families and households are $76,370 and $78,205 respectively.
| Characteristic | Number | Measure |
| Per Capita Income | 4,060 | $29,812 |
| Median Family Income | 1,007 | $76,370 |
| Mean Family Income | 1,007 | $98,053 |
| Median Household Income | 1,204 | $78,205 |
| Mean Household Income | 1,204 | $100,627 |
| Income Deficit | 1,007 | $0 |
| Wage / Income Gap (%) | 4,060 | 5.03% |
| Wage / Income Gap ($) | 4,060 | 94.97¢ per $1 |
| Gini / Inequality Index | 4,060 | 0.32 |
Earnings by Sex in Rising Sun Lebanon
Average Earnings in Rising Sun Lebanon are $44,558, $44,148 for men and $46,488 for women, a difference of 5.0%.
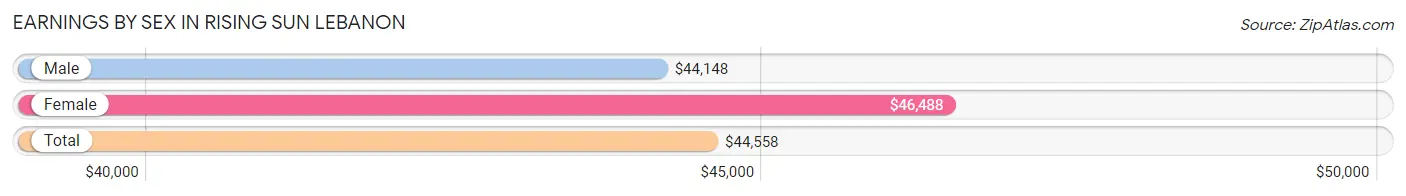
| Sex | Number | Average Earnings |
| Male | 944 (52.4%) | $44,148 |
| Female | 857 (47.6%) | $46,488 |
| Total | 1,801 (100.0%) | $44,558 |
Earnings by Sex by Income Bracket in Rising Sun Lebanon
The most common earnings brackets in Rising Sun Lebanon are $40,000 to $44,999 for men (236 | 25.0%) and $55,000 to $64,999 for women (196 | 22.9%).
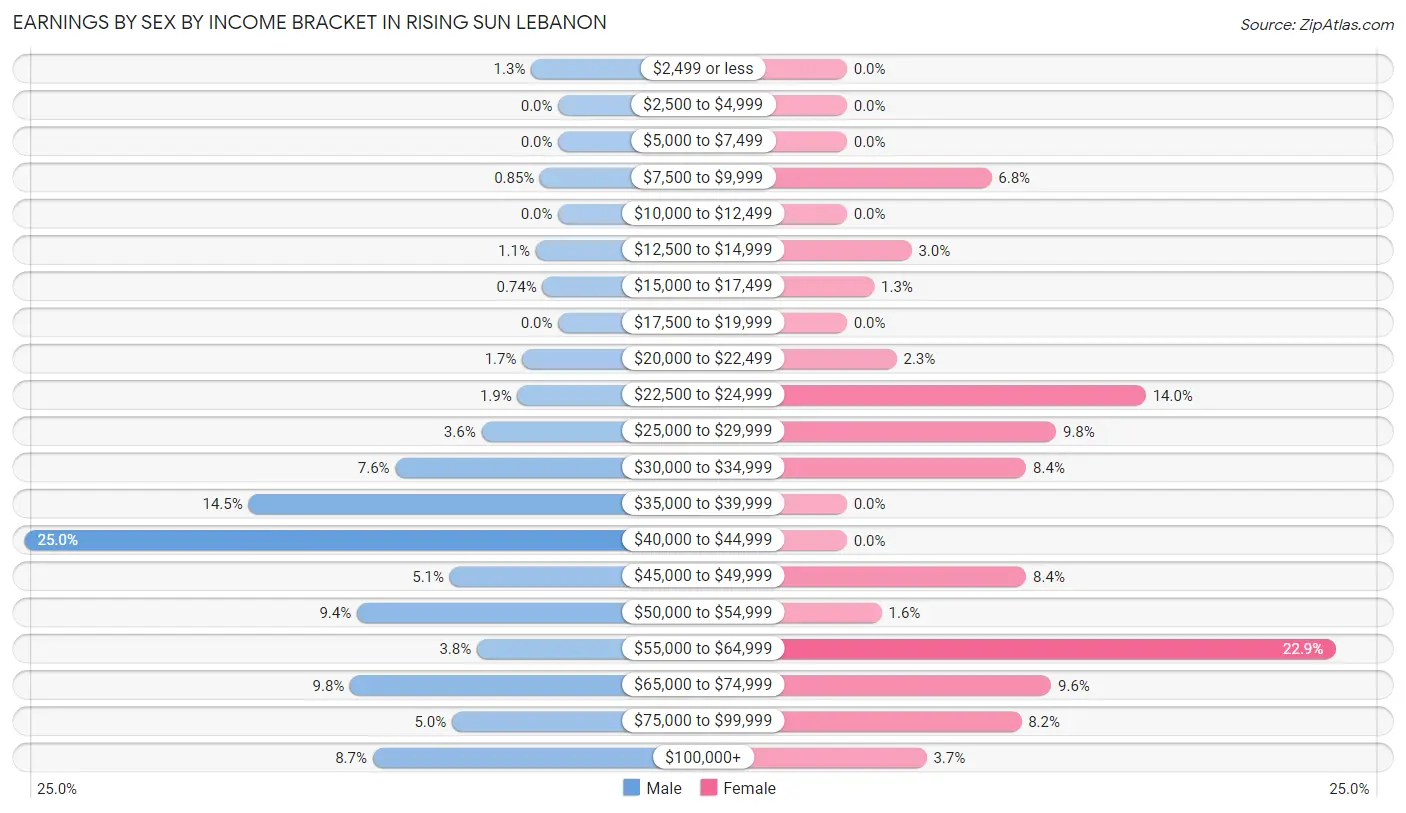
| Income | Male | Female |
| $2,499 or less | 12 (1.3%) | 0 (0.0%) |
| $2,500 to $4,999 | 0 (0.0%) | 0 (0.0%) |
| $5,000 to $7,499 | 0 (0.0%) | 0 (0.0%) |
| $7,500 to $9,999 | 8 (0.9%) | 58 (6.8%) |
| $10,000 to $12,499 | 0 (0.0%) | 0 (0.0%) |
| $12,500 to $14,999 | 10 (1.1%) | 26 (3.0%) |
| $15,000 to $17,499 | 7 (0.7%) | 11 (1.3%) |
| $17,500 to $19,999 | 0 (0.0%) | 0 (0.0%) |
| $20,000 to $22,499 | 16 (1.7%) | 20 (2.3%) |
| $22,500 to $24,999 | 18 (1.9%) | 120 (14.0%) |
| $25,000 to $29,999 | 34 (3.6%) | 84 (9.8%) |
| $30,000 to $34,999 | 72 (7.6%) | 72 (8.4%) |
| $35,000 to $39,999 | 137 (14.5%) | 0 (0.0%) |
| $40,000 to $44,999 | 236 (25.0%) | 0 (0.0%) |
| $45,000 to $49,999 | 48 (5.1%) | 72 (8.4%) |
| $50,000 to $54,999 | 89 (9.4%) | 14 (1.6%) |
| $55,000 to $64,999 | 36 (3.8%) | 196 (22.9%) |
| $65,000 to $74,999 | 92 (9.8%) | 82 (9.6%) |
| $75,000 to $99,999 | 47 (5.0%) | 70 (8.2%) |
| $100,000+ | 82 (8.7%) | 32 (3.7%) |
| Total | 944 (100.0%) | 857 (100.0%) |
Earnings by Sex by Educational Attainment in Rising Sun Lebanon
Average earnings in Rising Sun Lebanon are $44,880 for men and $55,043 for women, a difference of 18.5%. Men with an educational attainment of graduate degree enjoy the highest average annual earnings of $135,391, while those with college or associate's degree education earn the least with $43,393. Women with an educational attainment of bachelor's degree earn the most with the average annual earnings of $63,850, while those with college or associate's degree education have the smallest earnings of $32,414.
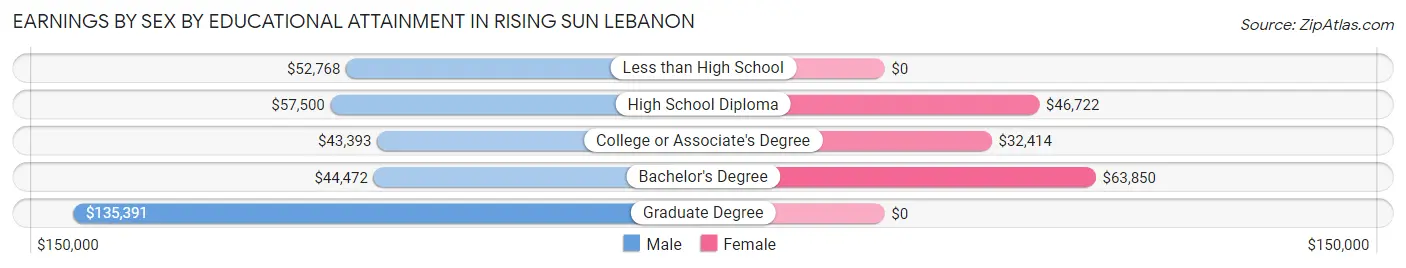
| Educational Attainment | Male Income | Female Income |
| Less than High School | $52,768 | $0 |
| High School Diploma | $57,500 | $46,722 |
| College or Associate's Degree | $43,393 | $32,414 |
| Bachelor's Degree | $44,472 | $63,850 |
| Graduate Degree | $135,391 | $0 |
| Total | $44,880 | $55,043 |
Family Income in Rising Sun Lebanon
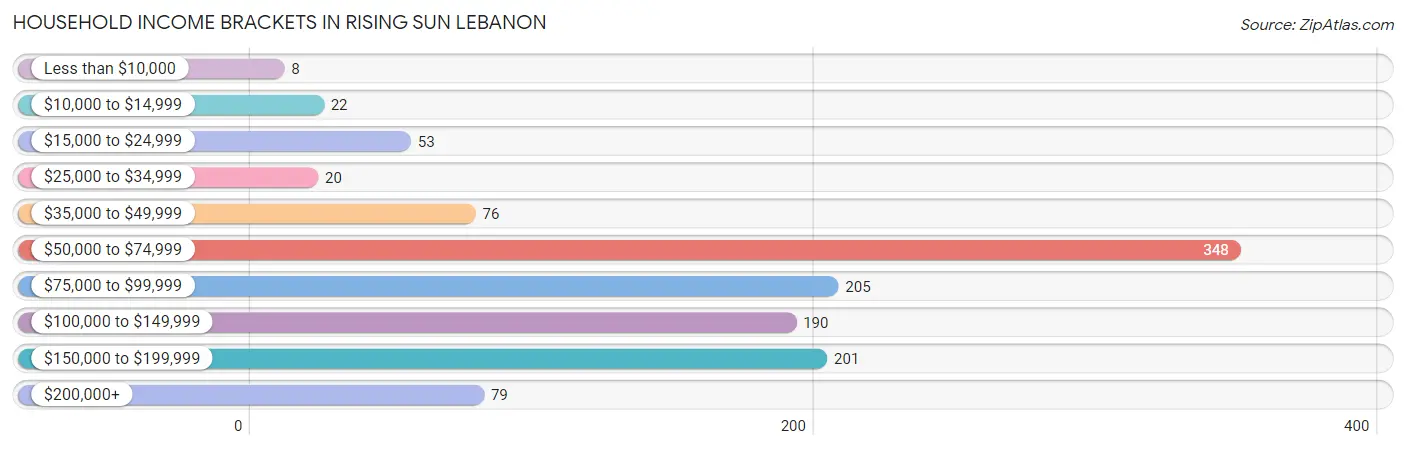
Family Income Brackets in Rising Sun Lebanon
According to the Rising Sun Lebanon family income data, there are 373 families falling into the $50,000 to $74,999 income range, which is the most common income bracket and makes up 37.0% of all families.
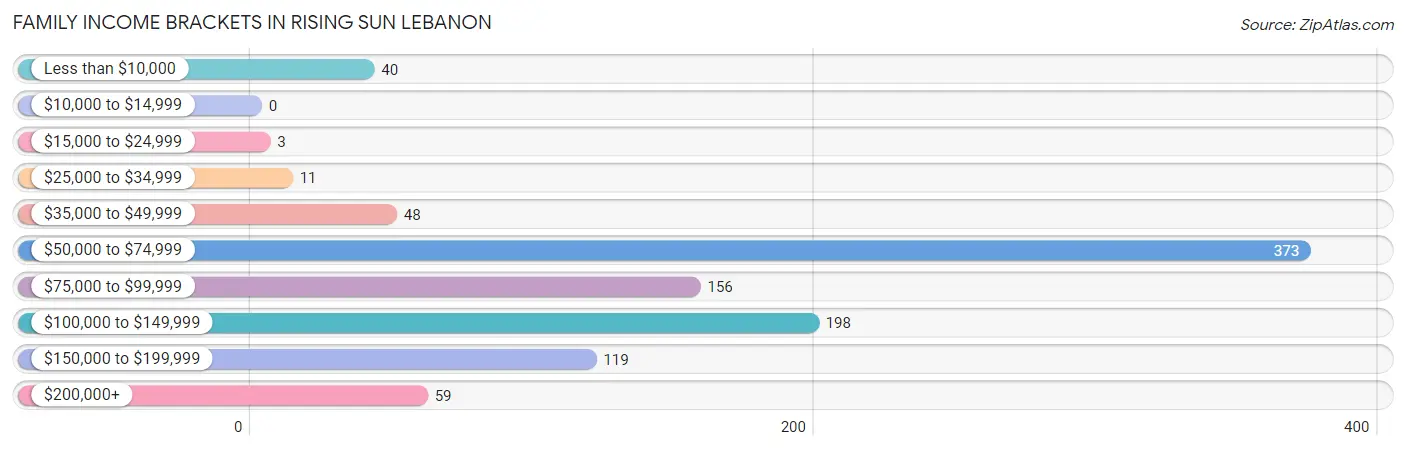
| Income Bracket | # Families | % Families |
| Less than $10,000 | 40 | 4.0% |
| $10,000 to $14,999 | 0 | 0.0% |
| $15,000 to $24,999 | 3 | 0.3% |
| $25,000 to $34,999 | 11 | 1.1% |
| $35,000 to $49,999 | 48 | 4.8% |
| $50,000 to $74,999 | 373 | 37.0% |
| $75,000 to $99,999 | 156 | 15.5% |
| $100,000 to $149,999 | 198 | 19.7% |
| $150,000 to $199,999 | 119 | 11.8% |
| $200,000+ | 59 | 5.9% |
Family Income by Famaliy Size in Rising Sun Lebanon
5-person families (91 | 9.0%) account for the highest median family income in Rising Sun Lebanon with $145,967 per family, while 3-person families (246 | 24.4%) have the highest median income of $37,673 per family member.
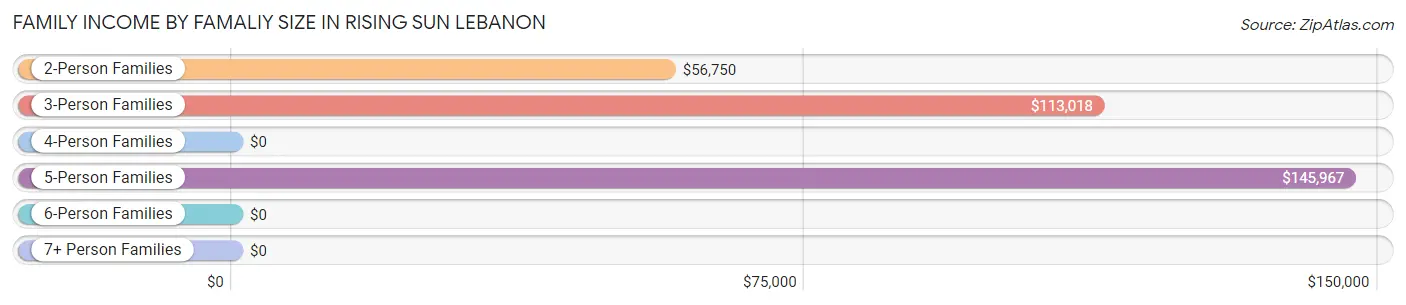
| Income Bracket | # Families | Median Income |
| 2-Person Families | 386 (38.3%) | $56,750 |
| 3-Person Families | 246 (24.4%) | $113,018 |
| 4-Person Families | 102 (10.1%) | $0 |
| 5-Person Families | 91 (9.0%) | $145,967 |
| 6-Person Families | 182 (18.1%) | $0 |
| 7+ Person Families | 0 (0.0%) | $0 |
| Total | 1,007 (100.0%) | $76,370 |
Family Income by Number of Earners in Rising Sun Lebanon
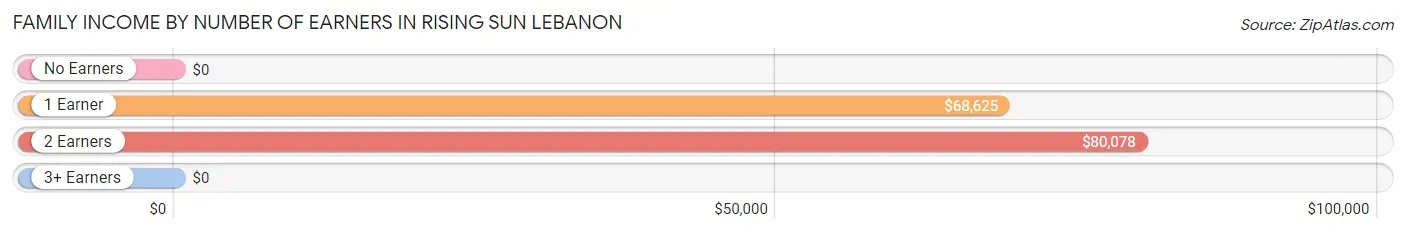
| Number of Earners | # Families | Median Income |
| No Earners | 103 (10.2%) | $0 |
| 1 Earner | 365 (36.2%) | $68,625 |
| 2 Earners | 457 (45.4%) | $80,078 |
| 3+ Earners | 82 (8.1%) | $0 |
| Total | 1,007 (100.0%) | $76,370 |
Household Income in Rising Sun Lebanon
Household Income Brackets in Rising Sun Lebanon
With 348 households falling in the category, the $50,000 to $74,999 income range is the most frequent in Rising Sun Lebanon, accounting for 28.9% of all households. In contrast, only 8 households (0.7%) fall into the less than $10,000 income bracket, making it the least populous group.
| Income Bracket | # Households | % Households |
| Less than $10,000 | 8 | 0.7% |
| $10,000 to $14,999 | 22 | 1.8% |
| $15,000 to $24,999 | 53 | 4.4% |
| $25,000 to $34,999 | 20 | 1.7% |
| $35,000 to $49,999 | 76 | 6.3% |
| $50,000 to $74,999 | 348 | 28.9% |
| $75,000 to $99,999 | 205 | 17.0% |
| $100,000 to $149,999 | 190 | 15.8% |
| $150,000 to $199,999 | 201 | 16.7% |
| $200,000+ | 79 | 6.6% |
Household Income by Householder Age in Rising Sun Lebanon
The median household income in Rising Sun Lebanon is $78,205, with the highest median household income of $127,411 found in the 45 to 64 years age bracket for the primary householder. A total of 233 households (19.4%) fall into this category. Meanwhile, the 65+ years age bracket for the primary householder has the lowest median household income of $54,330, with 257 households (21.3%) in this group.
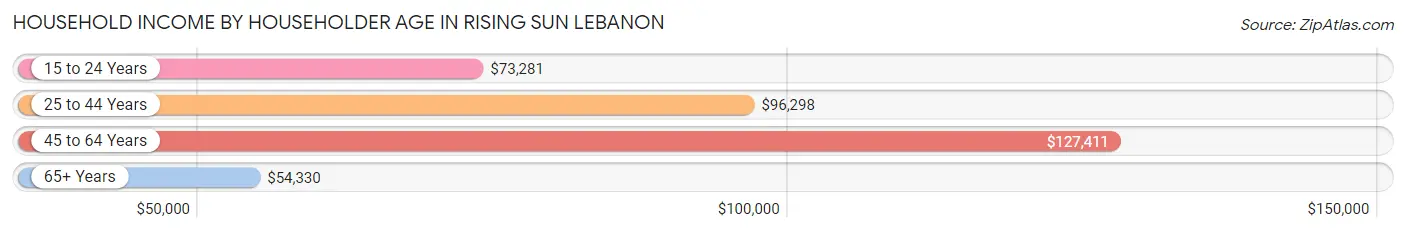
| Income Bracket | # Households | Median Income |
| 15 to 24 Years | 77 (6.4%) | $73,281 |
| 25 to 44 Years | 637 (52.9%) | $96,298 |
| 45 to 64 Years | 233 (19.4%) | $127,411 |
| 65+ Years | 257 (21.3%) | $54,330 |
| Total | 1,204 (100.0%) | $78,205 |
Poverty in Rising Sun Lebanon
Income Below Poverty by Sex and Age in Rising Sun Lebanon
With 4.9% poverty level for males and 5.9% for females among the residents of Rising Sun Lebanon, 5 year old males and 12 to 14 year old females are the most vulnerable to poverty, with 20 males (47.6%) and 13 females (15.5%) in their respective age groups living below the poverty level.
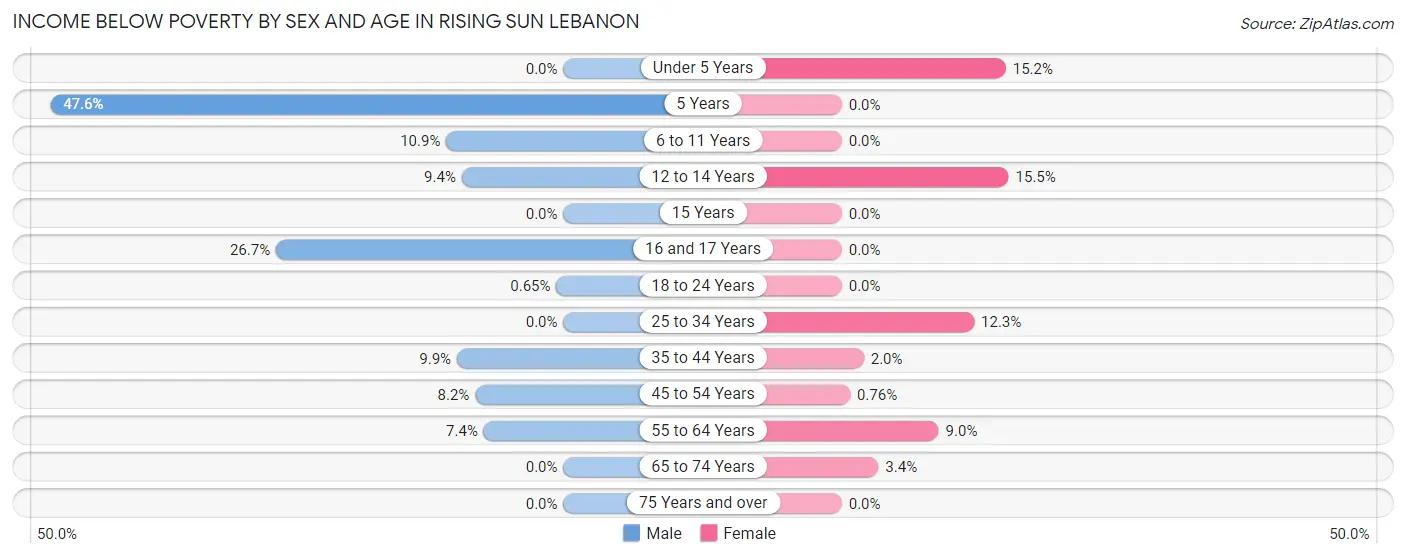
| Age Bracket | Male | Female |
| Under 5 Years | 0 (0.0%) | 14 (15.2%) |
| 5 Years | 20 (47.6%) | 0 (0.0%) |
| 6 to 11 Years | 10 (10.9%) | 0 (0.0%) |
| 12 to 14 Years | 10 (9.4%) | 13 (15.5%) |
| 15 Years | 0 (0.0%) | 0 (0.0%) |
| 16 and 17 Years | 4 (26.7%) | 0 (0.0%) |
| 18 to 24 Years | 1 (0.6%) | 0 (0.0%) |
| 25 to 34 Years | 0 (0.0%) | 56 (12.3%) |
| 35 to 44 Years | 8 (9.9%) | 5 (2.0%) |
| 45 to 54 Years | 22 (8.2%) | 1 (0.8%) |
| 55 to 64 Years | 21 (7.4%) | 17 (9.0%) |
| 65 to 74 Years | 0 (0.0%) | 9 (3.4%) |
| 75 Years and over | 0 (0.0%) | 0 (0.0%) |
| Total | 96 (4.9%) | 115 (5.9%) |
Income Above Poverty by Sex and Age in Rising Sun Lebanon
According to the poverty statistics in Rising Sun Lebanon, males aged under 5 years and females aged 5 years are the age groups that are most secure financially, with 100.0% of males and 100.0% of females in these age groups living above the poverty line.
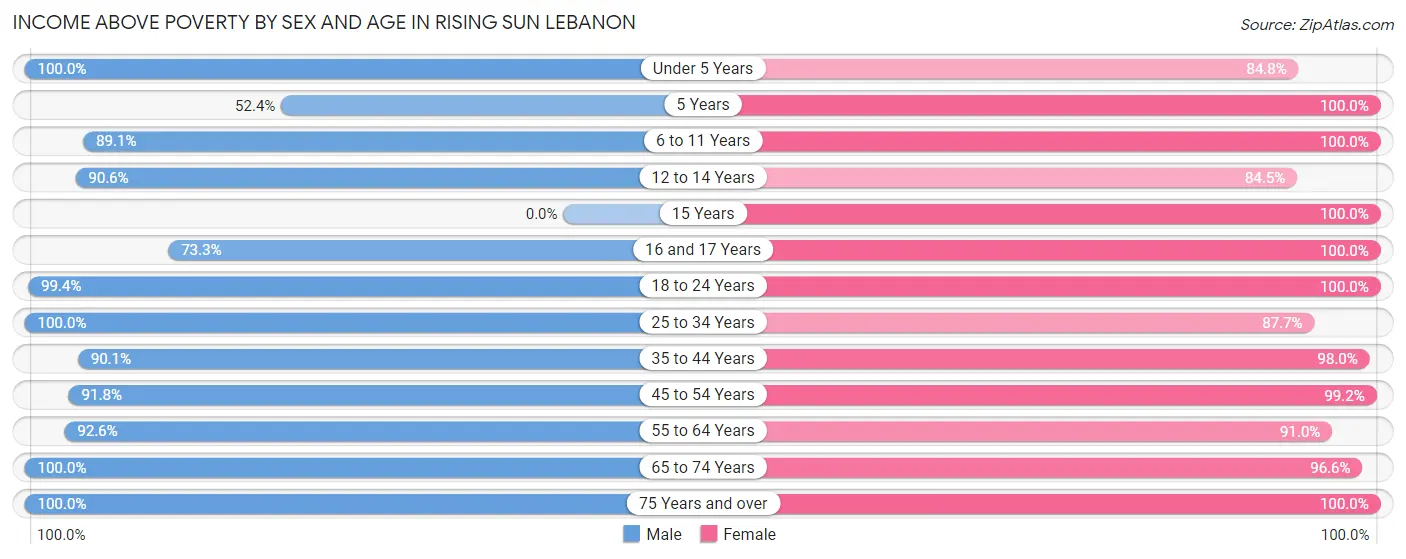
| Age Bracket | Male | Female |
| Under 5 Years | 417 (100.0%) | 78 (84.8%) |
| 5 Years | 22 (52.4%) | 38 (100.0%) |
| 6 to 11 Years | 82 (89.1%) | 177 (100.0%) |
| 12 to 14 Years | 96 (90.6%) | 71 (84.5%) |
| 15 Years | 0 (0.0%) | 8 (100.0%) |
| 16 and 17 Years | 11 (73.3%) | 14 (100.0%) |
| 18 to 24 Years | 153 (99.4%) | 108 (100.0%) |
| 25 to 34 Years | 327 (100.0%) | 400 (87.7%) |
| 35 to 44 Years | 73 (90.1%) | 240 (98.0%) |
| 45 to 54 Years | 247 (91.8%) | 130 (99.2%) |
| 55 to 64 Years | 263 (92.6%) | 172 (91.0%) |
| 65 to 74 Years | 119 (100.0%) | 256 (96.6%) |
| 75 Years and over | 43 (100.0%) | 141 (100.0%) |
| Total | 1,853 (95.1%) | 1,833 (94.1%) |
Income Below Poverty Among Married-Couple Families in Rising Sun Lebanon
The poverty statistics for married-couple families in Rising Sun Lebanon show that 0.4% or 3 of the total 701 families live below the poverty line. Families with 1 or 2 children have the highest poverty rate of 1.6%, comprising of 3 families. On the other hand, families with no children have the lowest poverty rate of 0.0%, which includes 0 families.
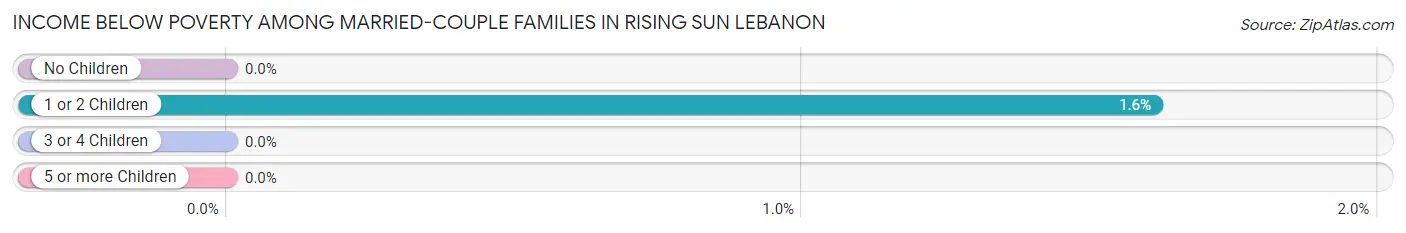
| Children | Above Poverty | Below Poverty |
| No Children | 320 (100.0%) | 0 (0.0%) |
| 1 or 2 Children | 183 (98.4%) | 3 (1.6%) |
| 3 or 4 Children | 195 (100.0%) | 0 (0.0%) |
| 5 or more Children | 0 (0.0%) | 0 (0.0%) |
| Total | 698 (99.6%) | 3 (0.4%) |
Income Below Poverty Among Single-Parent Households in Rising Sun Lebanon
According to the poverty data in Rising Sun Lebanon, 22.8% or 29 single-father households and 6.1% or 11 single-mother households are living below the poverty line. Among single-father households, those with no children have the highest poverty rate, with 21 households (70.0%) experiencing poverty. Likewise, among single-mother households, those with 3 or 4 children have the highest poverty rate, with 11 households (100.0%) falling below the poverty line.
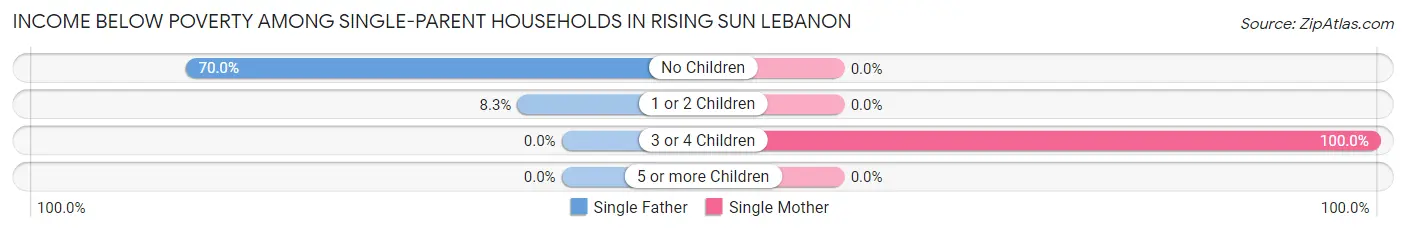
| Children | Single Father | Single Mother |
| No Children | 21 (70.0%) | 0 (0.0%) |
| 1 or 2 Children | 8 (8.3%) | 0 (0.0%) |
| 3 or 4 Children | 0 (0.0%) | 11 (100.0%) |
| 5 or more Children | 0 (0.0%) | 0 (0.0%) |
| Total | 29 (22.8%) | 11 (6.1%) |
Income Below Poverty Among Married-Couple vs Single-Parent Households in Rising Sun Lebanon
The poverty data for Rising Sun Lebanon shows that 3 of the married-couple family households (0.4%) and 40 of the single-parent households (13.1%) are living below the poverty level. Within the married-couple family households, those with 1 or 2 children have the highest poverty rate, with 3 households (1.6%) falling below the poverty line. Among the single-parent households, those with 3 or 4 children have the highest poverty rate, with 11 household (100.0%) living below poverty.
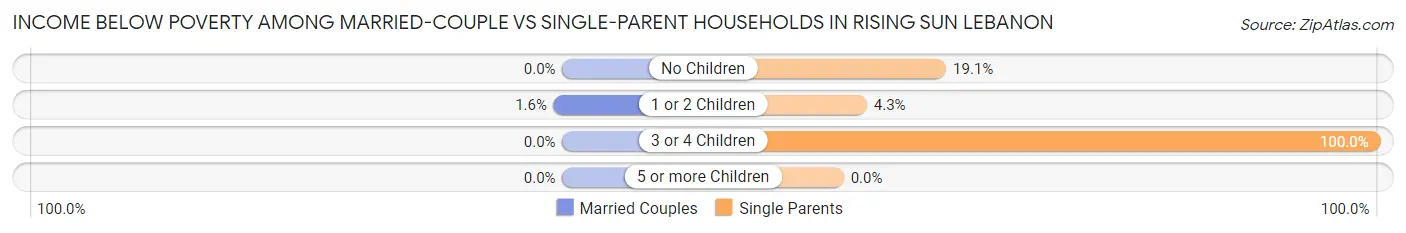
| Children | Married-Couple Families | Single-Parent Households |
| No Children | 0 (0.0%) | 21 (19.1%) |
| 1 or 2 Children | 3 (1.6%) | 8 (4.3%) |
| 3 or 4 Children | 0 (0.0%) | 11 (100.0%) |
| 5 or more Children | 0 (0.0%) | 0 (0.0%) |
| Total | 3 (0.4%) | 40 (13.1%) |
Employment Characteristics in Rising Sun Lebanon
Employment by Class of Employer in Rising Sun Lebanon
Among the 1,679 employed individuals in Rising Sun Lebanon, private company employees (962 | 57.3%), self-employed (incorporated) (169 | 10.1%), and not-for-profit organizations (168 | 10.0%) make up the most common classes of employment.
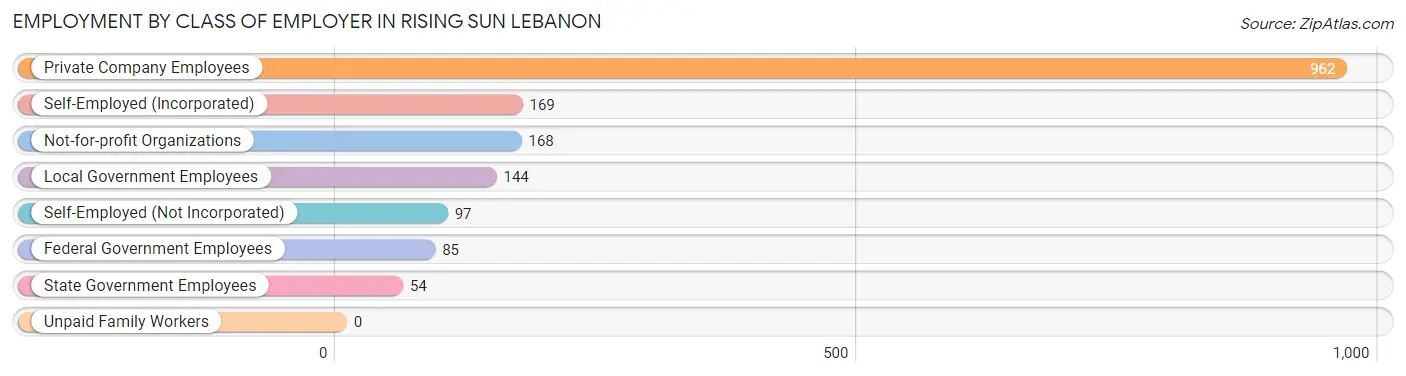
| Employer Class | # Employees | % Employees |
| Private Company Employees | 962 | 57.3% |
| Self-Employed (Incorporated) | 169 | 10.1% |
| Self-Employed (Not Incorporated) | 97 | 5.8% |
| Not-for-profit Organizations | 168 | 10.0% |
| Local Government Employees | 144 | 8.6% |
| State Government Employees | 54 | 3.2% |
| Federal Government Employees | 85 | 5.1% |
| Unpaid Family Workers | 0 | 0.0% |
| Total | 1,679 | 100.0% |
Employment Status by Age in Rising Sun Lebanon
According to the labor force statistics for Rising Sun Lebanon, out of the total population over 16 years of age (2,841), 59.9% or 1,702 individuals are in the labor force, with 1.3% or 22 of them unemployed. The age group with the highest labor force participation rate is 20 to 24 years, with 100.0% or 245 individuals in the labor force. Within the labor force, the 25 to 29 years age range has the highest percentage of unemployed individuals, with 7.5% or 23 of them being unemployed.
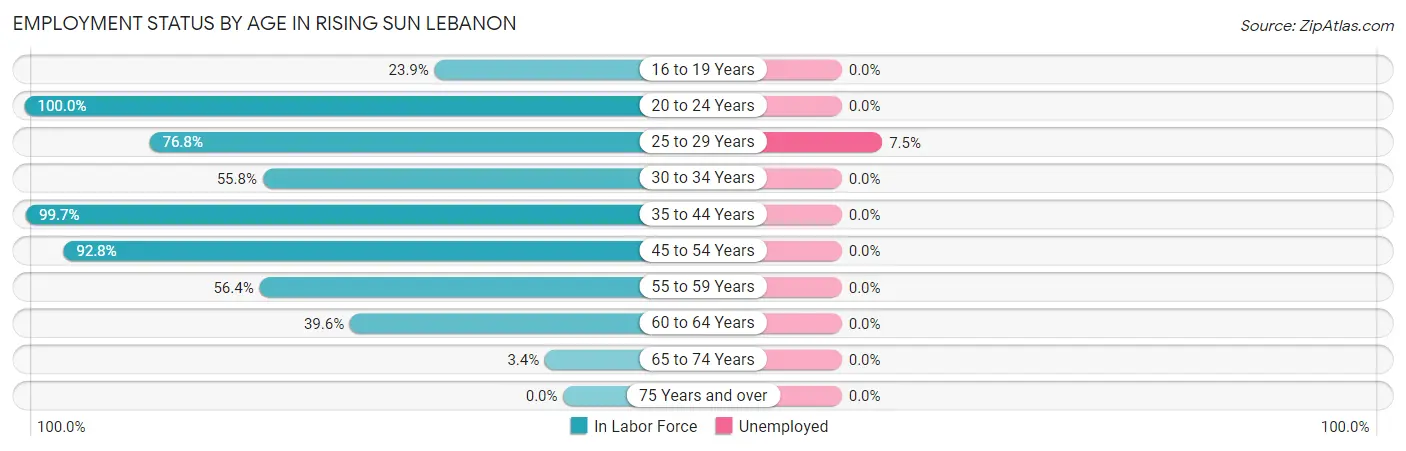
| Age Bracket | In Labor Force | Unemployed |
| 16 to 19 Years | 11 (23.9%) | 0 (0.0%) |
| 20 to 24 Years | 245 (100.0%) | 0 (0.0%) |
| 25 to 29 Years | 308 (76.8%) | 23 (7.5%) |
| 30 to 34 Years | 213 (55.8%) | 0 (0.0%) |
| 35 to 44 Years | 325 (99.7%) | 0 (0.0%) |
| 45 to 54 Years | 371 (92.8%) | 0 (0.0%) |
| 55 to 59 Years | 93 (56.4%) | 0 (0.0%) |
| 60 to 64 Years | 122 (39.6%) | 0 (0.0%) |
| 65 to 74 Years | 13 (3.4%) | 0 (0.0%) |
| 75 Years and over | 0 (0.0%) | 0 (0.0%) |
| Total | 1,702 (59.9%) | 22 (1.3%) |
Employment Status by Educational Attainment in Rising Sun Lebanon
According to labor force statistics for Rising Sun Lebanon, 72.3% of individuals (1,433) out of the total population between 25 and 64 years of age (1,982) are in the labor force, with 1.6% or 23 of them being unemployed. The group with the highest labor force participation rate are those with the educational attainment of bachelor's degree or higher, with 98.4% or 698 individuals in the labor force. Within the labor force, individuals with less than high school education have the highest percentage of unemployment, with 33.8% or 22 of them being unemployed.
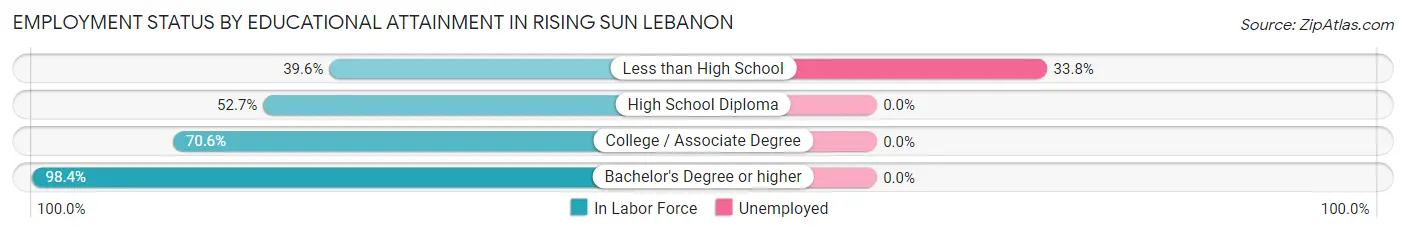
| Educational Attainment | In Labor Force | Unemployed |
| Less than High School | 65 (39.6%) | 55 (33.8%) |
| High School Diploma | 337 (52.7%) | 0 (0.0%) |
| College / Associate Degree | 332 (70.6%) | 0 (0.0%) |
| Bachelor's Degree or higher | 698 (98.4%) | 0 (0.0%) |
| Total | 1,433 (72.3%) | 32 (1.6%) |
Employment Occupations by Sex in Rising Sun Lebanon
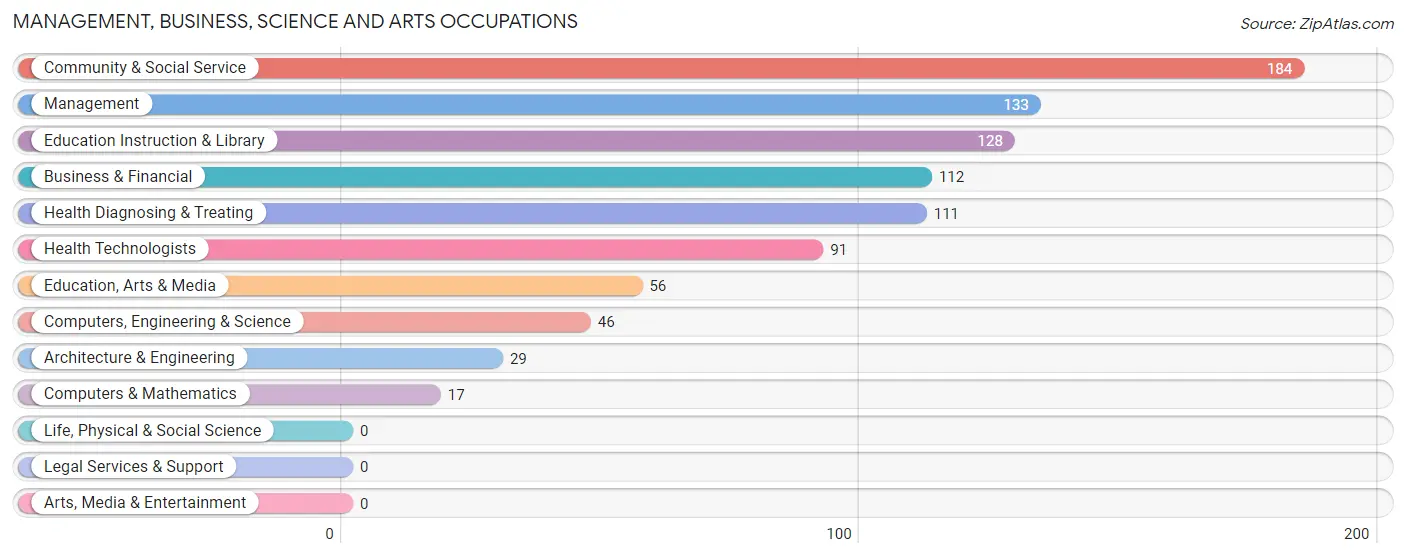
Management, Business, Science and Arts Occupations
The most common Management, Business, Science and Arts occupations in Rising Sun Lebanon are Community & Social Service (184 | 11.4%), Management (133 | 8.2%), Education Instruction & Library (128 | 7.9%), Business & Financial (112 | 6.9%), and Health Diagnosing & Treating (111 | 6.9%).
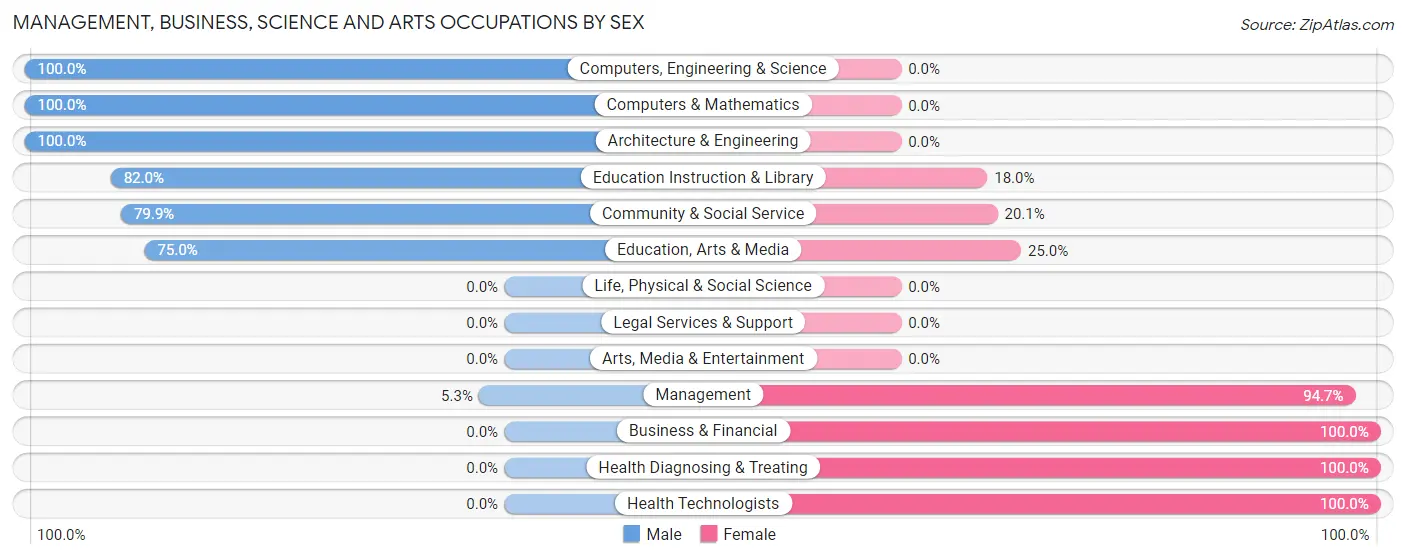
Management, Business, Science and Arts Occupations by Sex
Within the Management, Business, Science and Arts occupations in Rising Sun Lebanon, the most male-oriented occupations are Computers, Engineering & Science (100.0%), Computers & Mathematics (100.0%), and Architecture & Engineering (100.0%), while the most female-oriented occupations are Business & Financial (100.0%), Health Diagnosing & Treating (100.0%), and Health Technologists (100.0%).
| Occupation | Male | Female |
| Management | 7 (5.3%) | 126 (94.7%) |
| Business & Financial | 0 (0.0%) | 112 (100.0%) |
| Computers, Engineering & Science | 46 (100.0%) | 0 (0.0%) |
| Computers & Mathematics | 17 (100.0%) | 0 (0.0%) |
| Architecture & Engineering | 29 (100.0%) | 0 (0.0%) |
| Life, Physical & Social Science | 0 (0.0%) | 0 (0.0%) |
| Community & Social Service | 147 (79.9%) | 37 (20.1%) |
| Education, Arts & Media | 42 (75.0%) | 14 (25.0%) |
| Legal Services & Support | 0 (0.0%) | 0 (0.0%) |
| Education Instruction & Library | 105 (82.0%) | 23 (18.0%) |
| Arts, Media & Entertainment | 0 (0.0%) | 0 (0.0%) |
| Health Diagnosing & Treating | 0 (0.0%) | 111 (100.0%) |
| Health Technologists | 0 (0.0%) | 91 (100.0%) |
| Total (Category) | 200 (34.1%) | 386 (65.9%) |
| Total (Overall) | 859 (53.0%) | 761 (47.0%) |
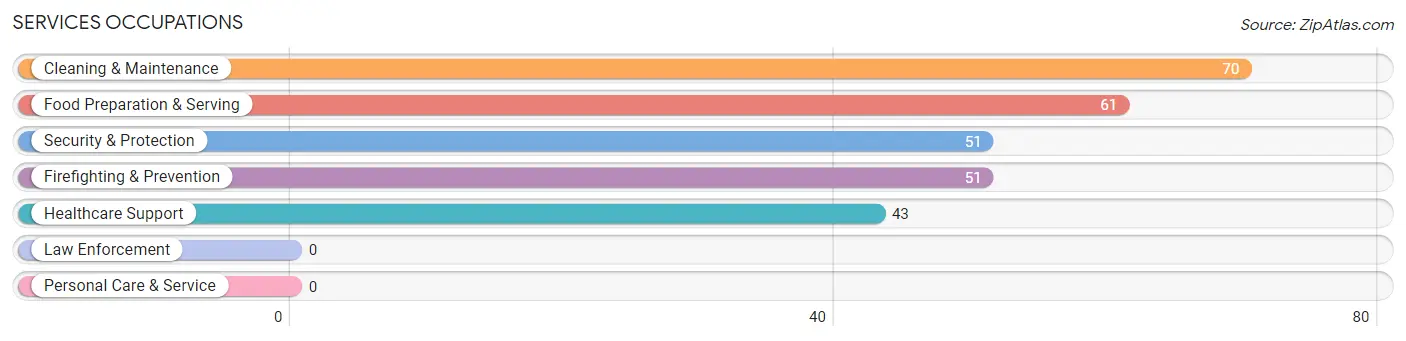
Services Occupations
The most common Services occupations in Rising Sun Lebanon are Cleaning & Maintenance (70 | 4.3%), Food Preparation & Serving (61 | 3.8%), Security & Protection (51 | 3.2%), Firefighting & Prevention (51 | 3.2%), and Healthcare Support (43 | 2.6%).
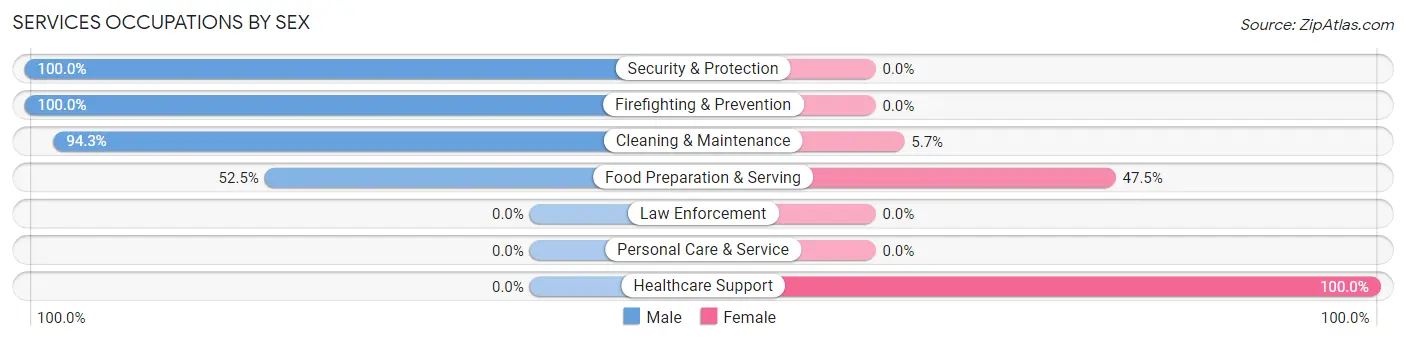
Services Occupations by Sex
Within the Services occupations in Rising Sun Lebanon, the most male-oriented occupations are Security & Protection (100.0%), Firefighting & Prevention (100.0%), and Cleaning & Maintenance (94.3%), while the most female-oriented occupations are Healthcare Support (100.0%), Food Preparation & Serving (47.5%), and Cleaning & Maintenance (5.7%).
| Occupation | Male | Female |
| Healthcare Support | 0 (0.0%) | 43 (100.0%) |
| Security & Protection | 51 (100.0%) | 0 (0.0%) |
| Firefighting & Prevention | 51 (100.0%) | 0 (0.0%) |
| Law Enforcement | 0 (0.0%) | 0 (0.0%) |
| Food Preparation & Serving | 32 (52.5%) | 29 (47.5%) |
| Cleaning & Maintenance | 66 (94.3%) | 4 (5.7%) |
| Personal Care & Service | 0 (0.0%) | 0 (0.0%) |
| Total (Category) | 149 (66.2%) | 76 (33.8%) |
| Total (Overall) | 859 (53.0%) | 761 (47.0%) |
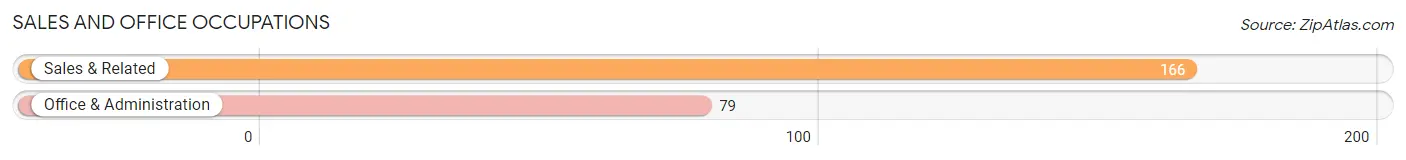
Sales and Office Occupations
The most common Sales and Office occupations in Rising Sun Lebanon are Sales & Related (166 | 10.2%), and Office & Administration (79 | 4.9%).
Sales and Office Occupations by Sex
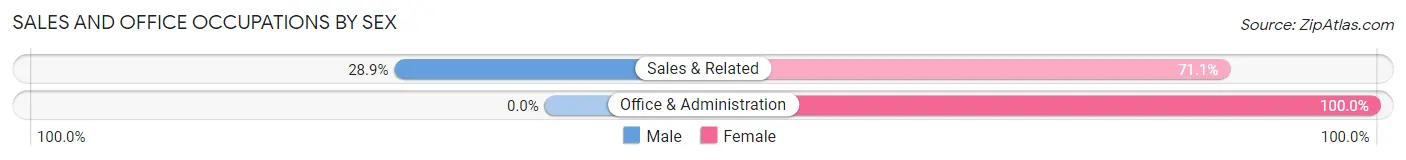
| Occupation | Male | Female |
| Sales & Related | 48 (28.9%) | 118 (71.1%) |
| Office & Administration | 0 (0.0%) | 79 (100.0%) |
| Total (Category) | 48 (19.6%) | 197 (80.4%) |
| Total (Overall) | 859 (53.0%) | 761 (47.0%) |
Natural Resources, Construction and Maintenance Occupations
The most common Natural Resources, Construction and Maintenance occupations in Rising Sun Lebanon are , and Construction & Extraction (96 | 5.9%).
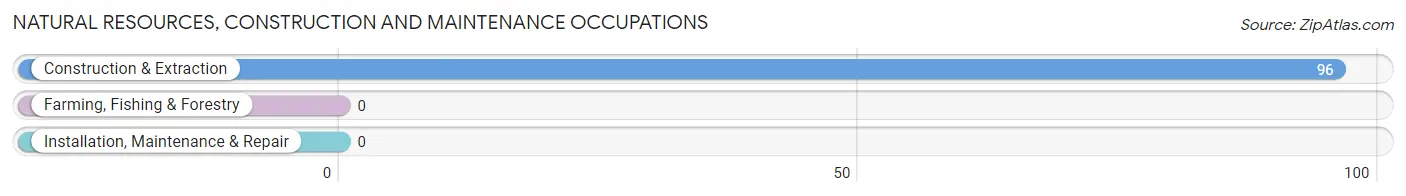
Natural Resources, Construction and Maintenance Occupations by Sex
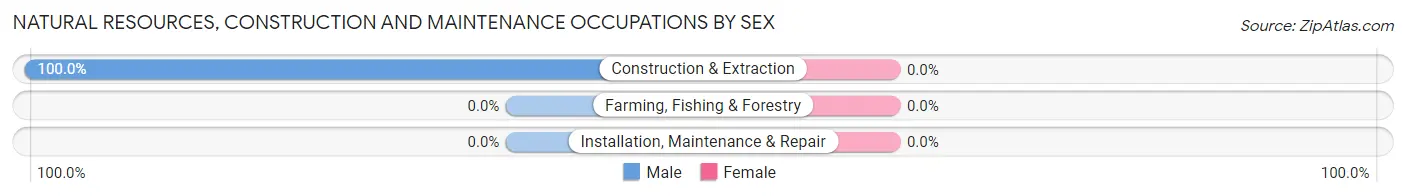
| Occupation | Male | Female |
| Farming, Fishing & Forestry | 0 (0.0%) | 0 (0.0%) |
| Construction & Extraction | 96 (100.0%) | 0 (0.0%) |
| Installation, Maintenance & Repair | 0 (0.0%) | 0 (0.0%) |
| Total (Category) | 96 (100.0%) | 0 (0.0%) |
| Total (Overall) | 859 (53.0%) | 761 (47.0%) |
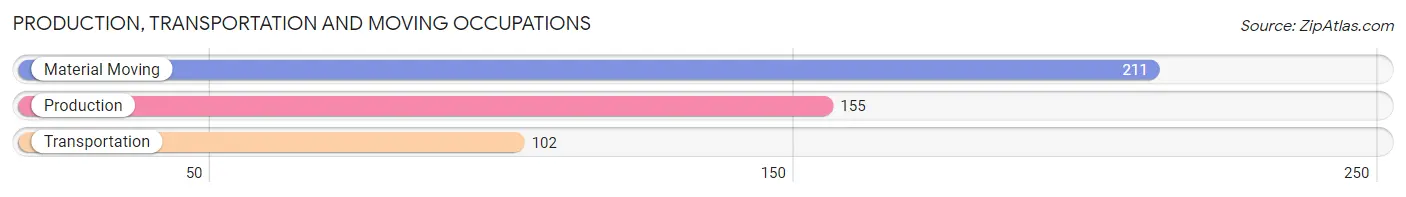
Production, Transportation and Moving Occupations
The most common Production, Transportation and Moving occupations in Rising Sun Lebanon are Material Moving (211 | 13.0%), Production (155 | 9.6%), and Transportation (102 | 6.3%).
Production, Transportation and Moving Occupations by Sex
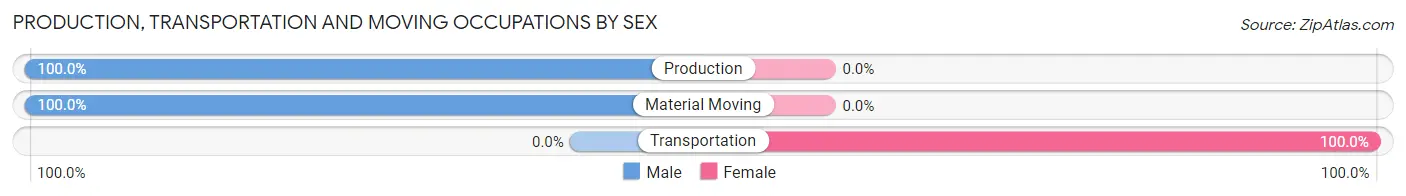
| Occupation | Male | Female |
| Production | 155 (100.0%) | 0 (0.0%) |
| Transportation | 0 (0.0%) | 102 (100.0%) |
| Material Moving | 211 (100.0%) | 0 (0.0%) |
| Total (Category) | 366 (78.2%) | 102 (21.8%) |
| Total (Overall) | 859 (53.0%) | 761 (47.0%) |
Employment Industries by Sex in Rising Sun Lebanon
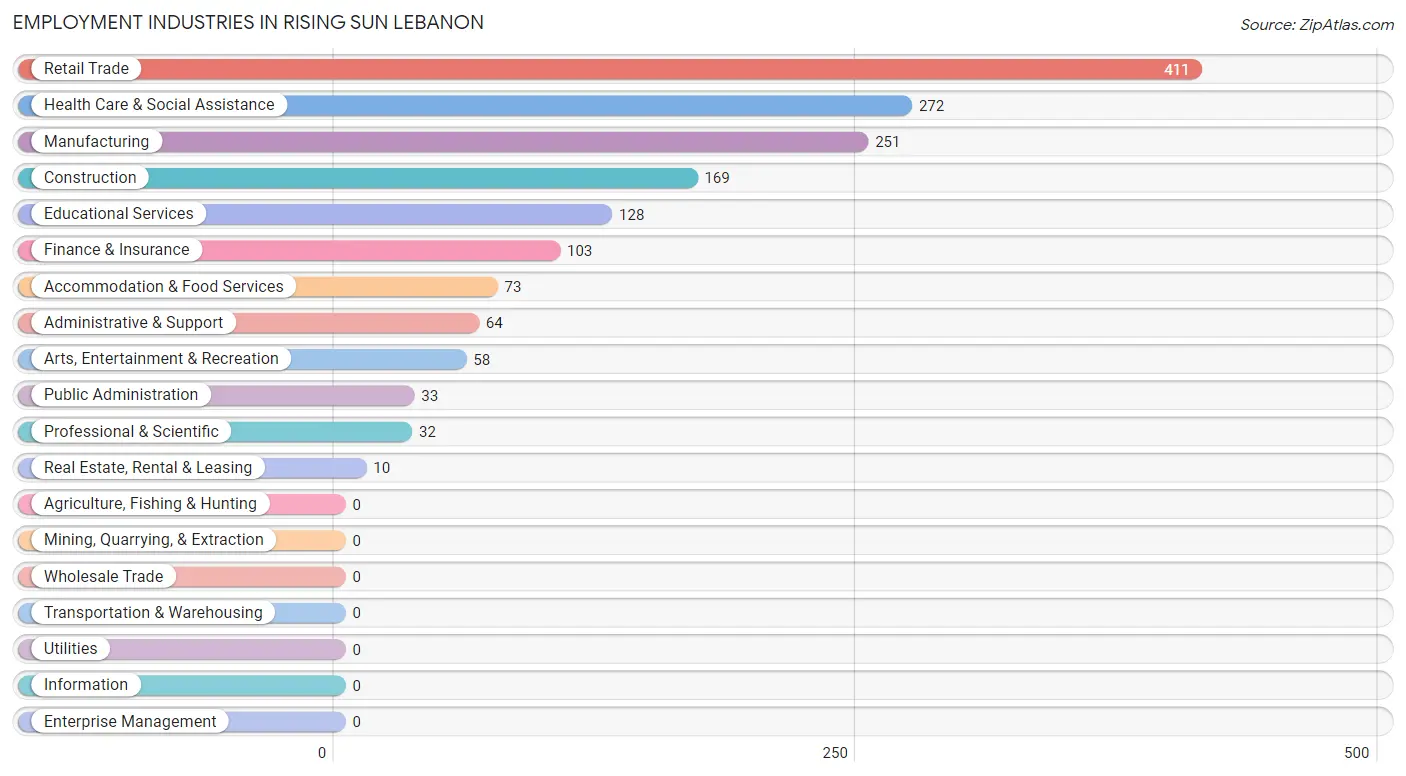
Employment Industries in Rising Sun Lebanon
The major employment industries in Rising Sun Lebanon include Retail Trade (411 | 25.4%), Health Care & Social Assistance (272 | 16.8%), Manufacturing (251 | 15.5%), Construction (169 | 10.4%), and Educational Services (128 | 7.9%).
Employment Industries by Sex in Rising Sun Lebanon
The Rising Sun Lebanon industries that see more men than women are Construction (100.0%), Public Administration (100.0%), and Manufacturing (89.2%), whereas the industries that tend to have a higher number of women are Finance & Insurance (100.0%), Real Estate, Rental & Leasing (100.0%), and Professional & Scientific (100.0%).
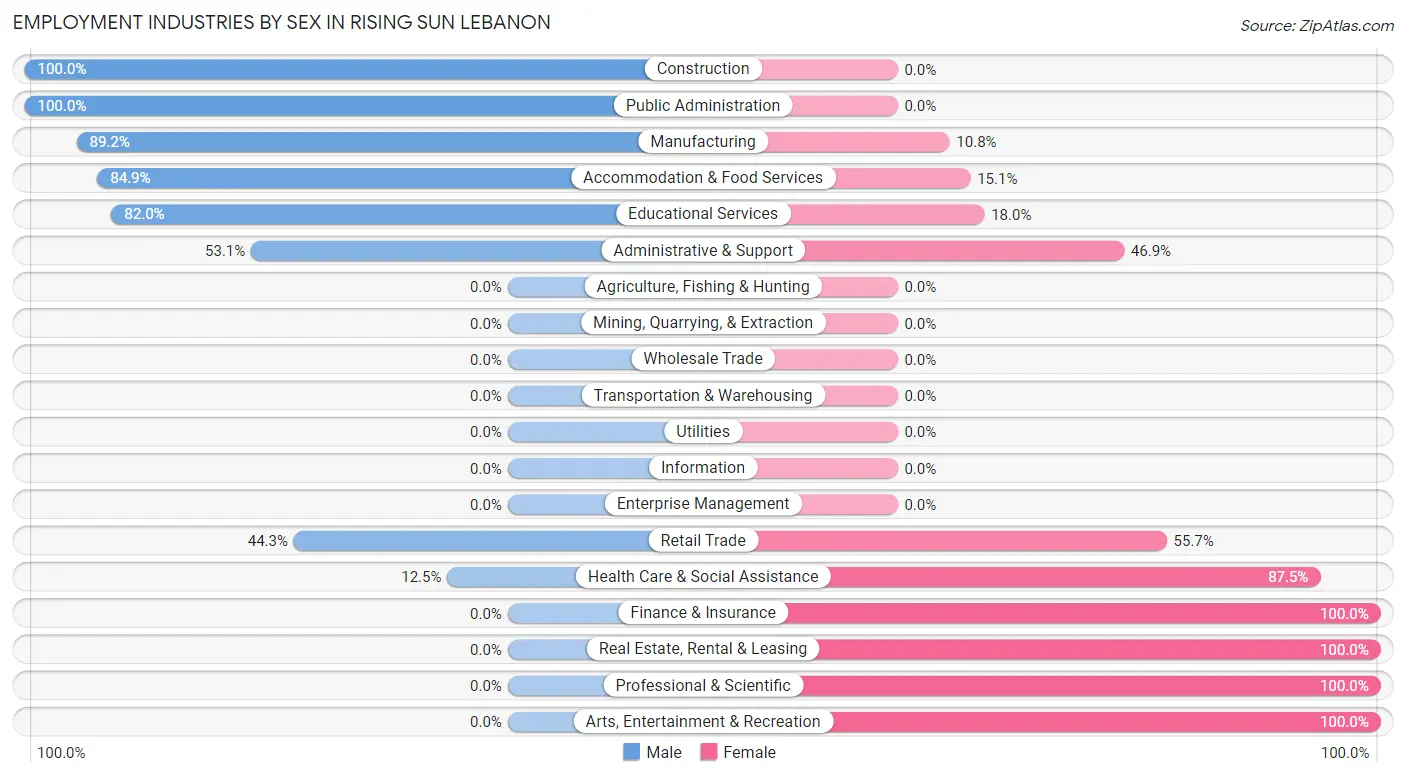
| Industry | Male | Female |
| Agriculture, Fishing & Hunting | 0 (0.0%) | 0 (0.0%) |
| Mining, Quarrying, & Extraction | 0 (0.0%) | 0 (0.0%) |
| Construction | 169 (100.0%) | 0 (0.0%) |
| Manufacturing | 224 (89.2%) | 27 (10.8%) |
| Wholesale Trade | 0 (0.0%) | 0 (0.0%) |
| Retail Trade | 182 (44.3%) | 229 (55.7%) |
| Transportation & Warehousing | 0 (0.0%) | 0 (0.0%) |
| Utilities | 0 (0.0%) | 0 (0.0%) |
| Information | 0 (0.0%) | 0 (0.0%) |
| Finance & Insurance | 0 (0.0%) | 103 (100.0%) |
| Real Estate, Rental & Leasing | 0 (0.0%) | 10 (100.0%) |
| Professional & Scientific | 0 (0.0%) | 32 (100.0%) |
| Enterprise Management | 0 (0.0%) | 0 (0.0%) |
| Administrative & Support | 34 (53.1%) | 30 (46.9%) |
| Educational Services | 105 (82.0%) | 23 (18.0%) |
| Health Care & Social Assistance | 34 (12.5%) | 238 (87.5%) |
| Arts, Entertainment & Recreation | 0 (0.0%) | 58 (100.0%) |
| Accommodation & Food Services | 62 (84.9%) | 11 (15.1%) |
| Public Administration | 33 (100.0%) | 0 (0.0%) |
| Total | 859 (53.0%) | 761 (47.0%) |
Education in Rising Sun Lebanon
School Enrollment in Rising Sun Lebanon
The most common levels of schooling among the 688 students in Rising Sun Lebanon are elementary school (329 | 47.8%), middle school (200 | 29.1%), and high school (59 | 8.6%).
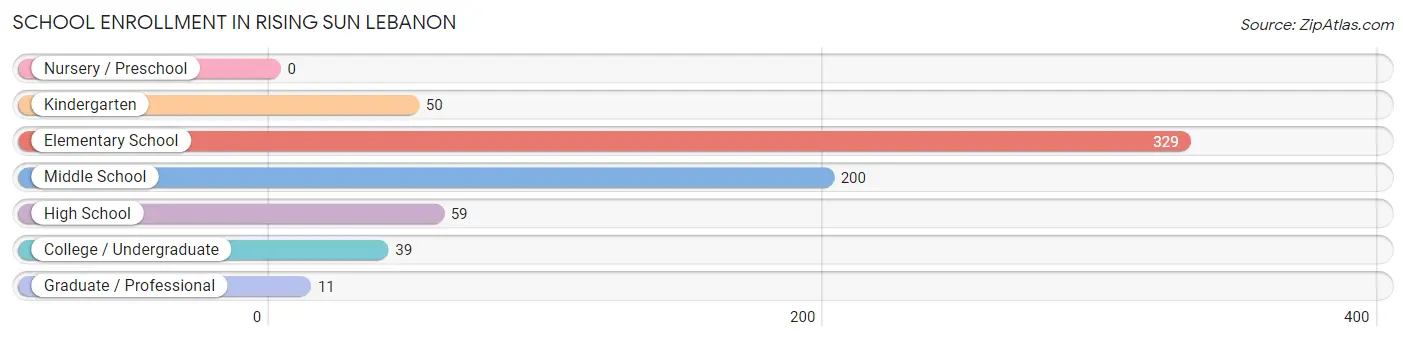
| School Level | # Students | % Students |
| Nursery / Preschool | 0 | 0.0% |
| Kindergarten | 50 | 7.3% |
| Elementary School | 329 | 47.8% |
| Middle School | 200 | 29.1% |
| High School | 59 | 8.6% |
| College / Undergraduate | 39 | 5.7% |
| Graduate / Professional | 11 | 1.6% |
| Total | 688 | 100.0% |
School Enrollment by Age by Funding Source in Rising Sun Lebanon
Out of a total of 688 students who are enrolled in schools in Rising Sun Lebanon, 26 (3.8%) attend a private institution, while the remaining 662 (96.2%) are enrolled in public schools. The age group of 25 to 34 year olds has the highest likelihood of being enrolled in private schools, with 11 (15.3% in the age bracket) enrolled. Conversely, the age group of 3 to 4 year olds has the lowest likelihood of being enrolled in a private school, with 10 (100.0% in the age bracket) attending a public institution.
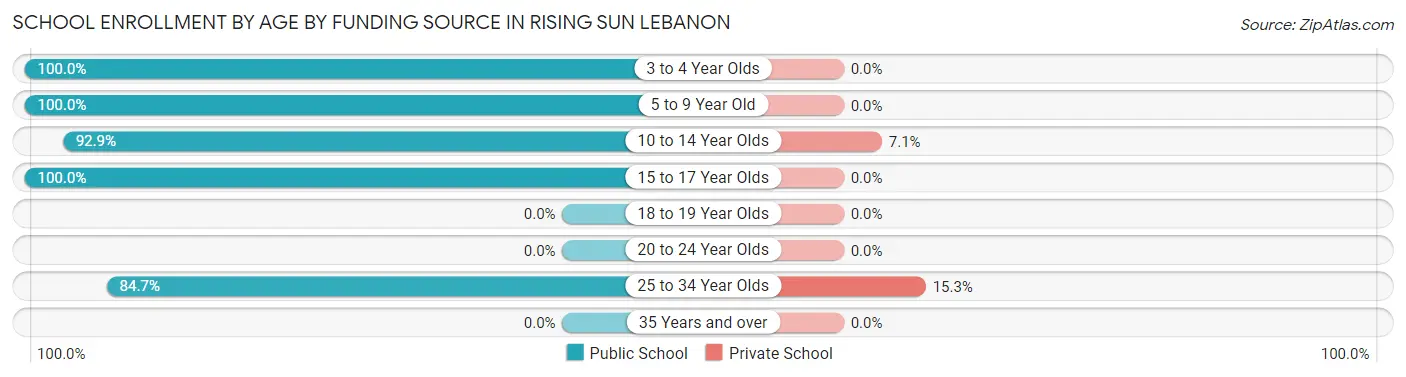
| Age Bracket | Public School | Private School |
| 3 to 4 Year Olds | 10 (100.0%) | 0 (0.0%) |
| 5 to 9 Year Old | 358 (100.0%) | 0 (0.0%) |
| 10 to 14 Year Olds | 196 (92.9%) | 15 (7.1%) |
| 15 to 17 Year Olds | 37 (100.0%) | 0 (0.0%) |
| 18 to 19 Year Olds | 0 (0.0%) | 0 (0.0%) |
| 20 to 24 Year Olds | 0 (0.0%) | 0 (0.0%) |
| 25 to 34 Year Olds | 61 (84.7%) | 11 (15.3%) |
| 35 Years and over | 0 (0.0%) | 0 (0.0%) |
| Total | 662 (96.2%) | 26 (3.8%) |
Educational Attainment by Field of Study in Rising Sun Lebanon
Business (277 | 36.7%), science & technology (160 | 21.2%), education (98 | 13.0%), multidisciplinary studies (60 | 8.0%), and arts & humanities (54 | 7.1%) are the most common fields of study among 755 individuals in Rising Sun Lebanon who have obtained a bachelor's degree or higher.
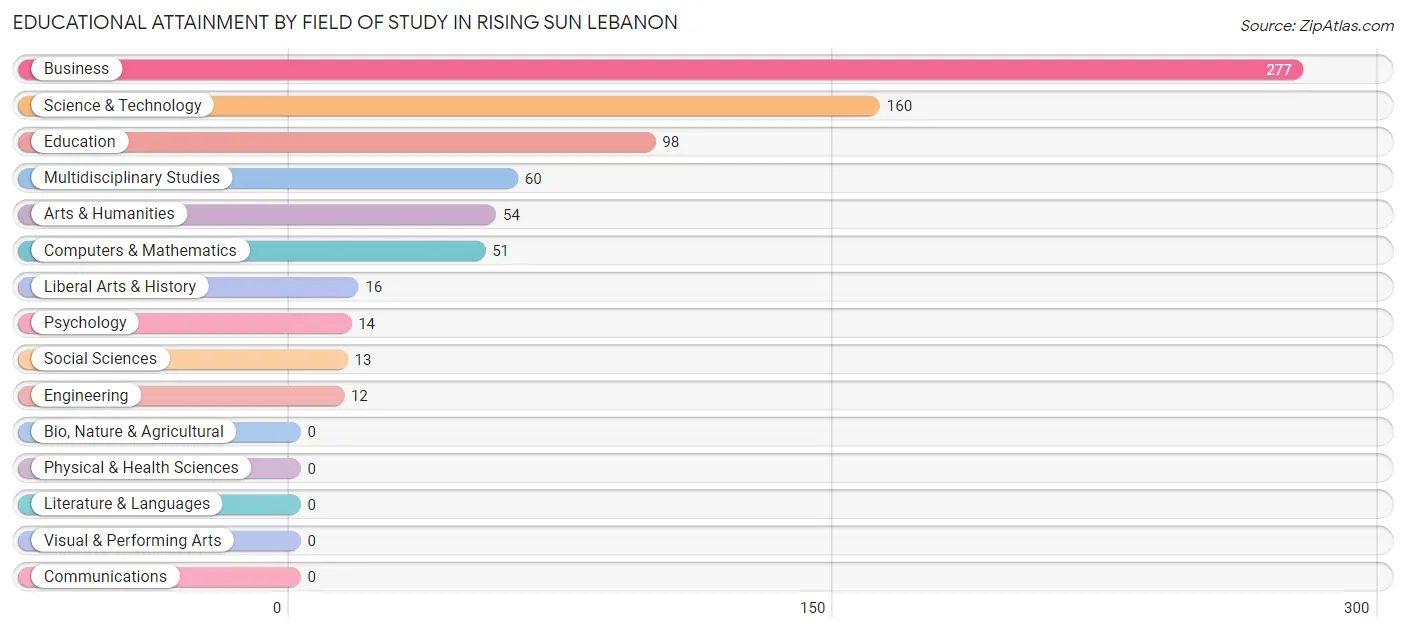
| Field of Study | # Graduates | % Graduates |
| Computers & Mathematics | 51 | 6.8% |
| Bio, Nature & Agricultural | 0 | 0.0% |
| Physical & Health Sciences | 0 | 0.0% |
| Psychology | 14 | 1.8% |
| Social Sciences | 13 | 1.7% |
| Engineering | 12 | 1.6% |
| Multidisciplinary Studies | 60 | 8.0% |
| Science & Technology | 160 | 21.2% |
| Business | 277 | 36.7% |
| Education | 98 | 13.0% |
| Literature & Languages | 0 | 0.0% |
| Liberal Arts & History | 16 | 2.1% |
| Visual & Performing Arts | 0 | 0.0% |
| Communications | 0 | 0.0% |
| Arts & Humanities | 54 | 7.1% |
| Total | 755 | 100.0% |
Transportation & Commute in Rising Sun Lebanon
Vehicle Availability by Sex in Rising Sun Lebanon
The most prevalent vehicle ownership categories in Rising Sun Lebanon are males with 2 vehicles (597, accounting for 66.3%) and females with 2 vehicles (699, making up 76.8%).
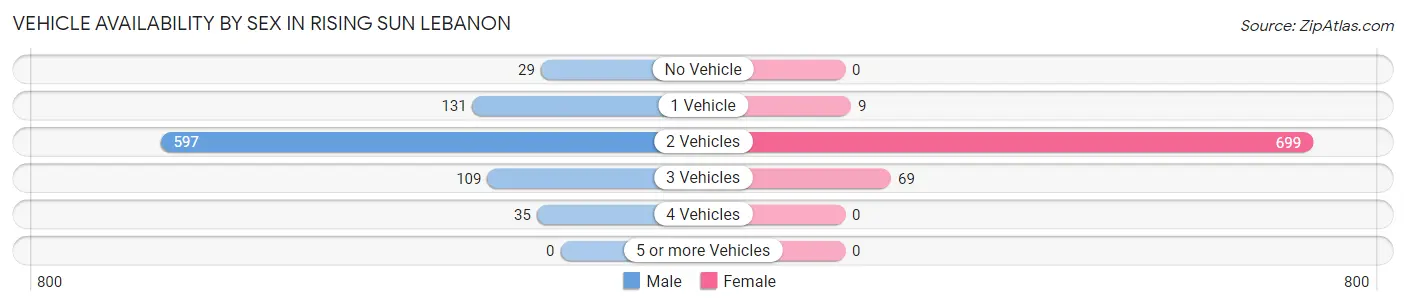
| Vehicles Available | Male | Female |
| No Vehicle | 29 (3.2%) | 0 (0.0%) |
| 1 Vehicle | 131 (14.5%) | 9 (1.2%) |
| 2 Vehicles | 597 (66.3%) | 699 (90.0%) |
| 3 Vehicles | 109 (12.1%) | 69 (8.9%) |
| 4 Vehicles | 35 (3.9%) | 0 (0.0%) |
| 5 or more Vehicles | 0 (0.0%) | 0 (0.0%) |
| Total | 901 (100.0%) | 777 (100.0%) |
Commute Time in Rising Sun Lebanon
The most frequently occuring commute durations in Rising Sun Lebanon are 20 to 24 minutes (373 commuters, 22.9%), 60 to 89 minutes (320 commuters, 19.7%), and 10 to 14 minutes (316 commuters, 19.4%).
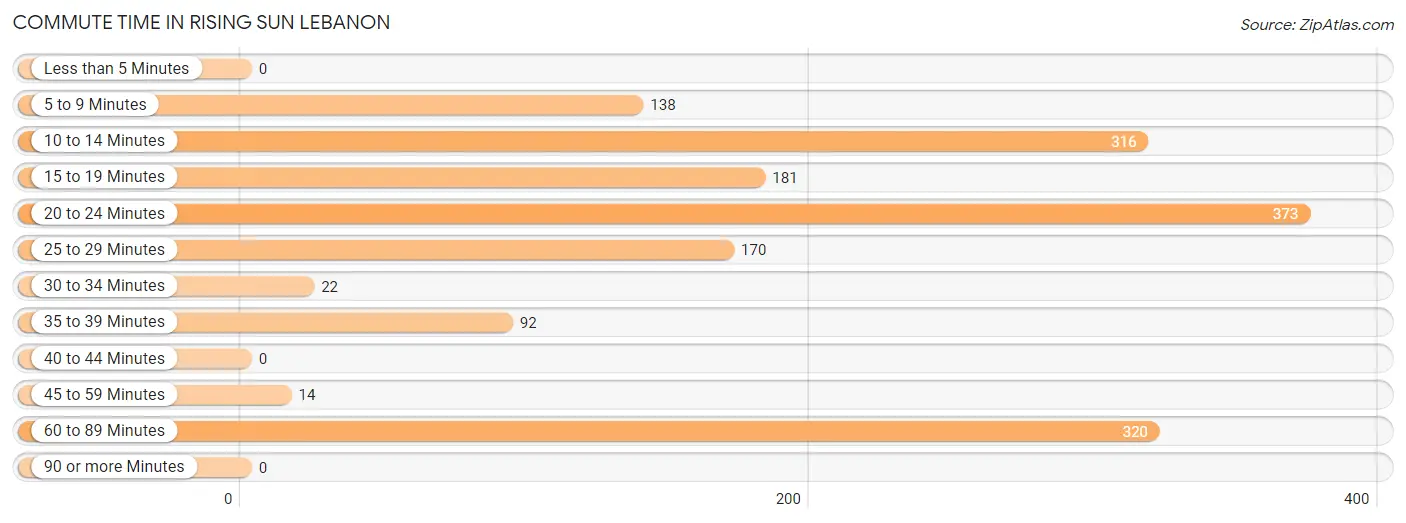
| Commute Time | # Commuters | % Commuters |
| Less than 5 Minutes | 0 | 0.0% |
| 5 to 9 Minutes | 138 | 8.5% |
| 10 to 14 Minutes | 316 | 19.4% |
| 15 to 19 Minutes | 181 | 11.1% |
| 20 to 24 Minutes | 373 | 22.9% |
| 25 to 29 Minutes | 170 | 10.5% |
| 30 to 34 Minutes | 22 | 1.3% |
| 35 to 39 Minutes | 92 | 5.7% |
| 40 to 44 Minutes | 0 | 0.0% |
| 45 to 59 Minutes | 14 | 0.9% |
| 60 to 89 Minutes | 320 | 19.7% |
| 90 or more Minutes | 0 | 0.0% |
Commute Time by Sex in Rising Sun Lebanon
The most common commute times in Rising Sun Lebanon are 60 to 89 minutes (286 commuters, 32.5%) for males and 10 to 14 minutes (248 commuters, 33.2%) for females.
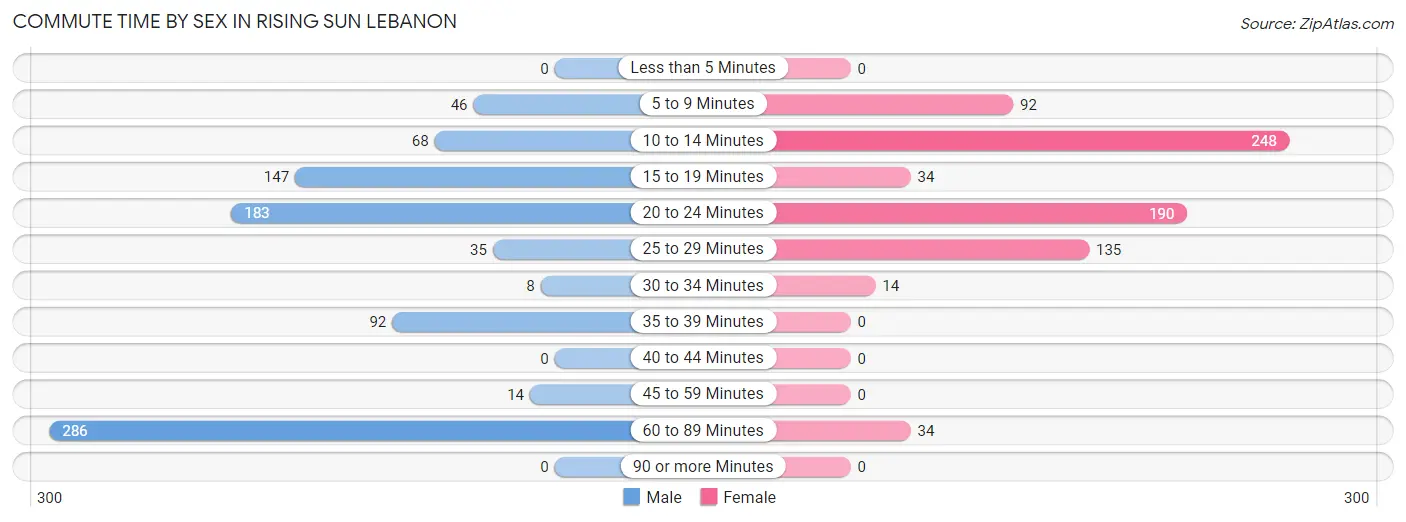
| Commute Time | Male | Female |
| Less than 5 Minutes | 0 (0.0%) | 0 (0.0%) |
| 5 to 9 Minutes | 46 (5.2%) | 92 (12.3%) |
| 10 to 14 Minutes | 68 (7.7%) | 248 (33.2%) |
| 15 to 19 Minutes | 147 (16.7%) | 34 (4.5%) |
| 20 to 24 Minutes | 183 (20.8%) | 190 (25.4%) |
| 25 to 29 Minutes | 35 (4.0%) | 135 (18.1%) |
| 30 to 34 Minutes | 8 (0.9%) | 14 (1.9%) |
| 35 to 39 Minutes | 92 (10.5%) | 0 (0.0%) |
| 40 to 44 Minutes | 0 (0.0%) | 0 (0.0%) |
| 45 to 59 Minutes | 14 (1.6%) | 0 (0.0%) |
| 60 to 89 Minutes | 286 (32.5%) | 34 (4.5%) |
| 90 or more Minutes | 0 (0.0%) | 0 (0.0%) |
Time of Departure to Work by Sex in Rising Sun Lebanon
The most frequent times of departure to work in Rising Sun Lebanon are 6:00 AM to 6:29 AM (169, 19.2%) for males and 6:30 AM to 6:59 AM (216, 28.9%) for females.
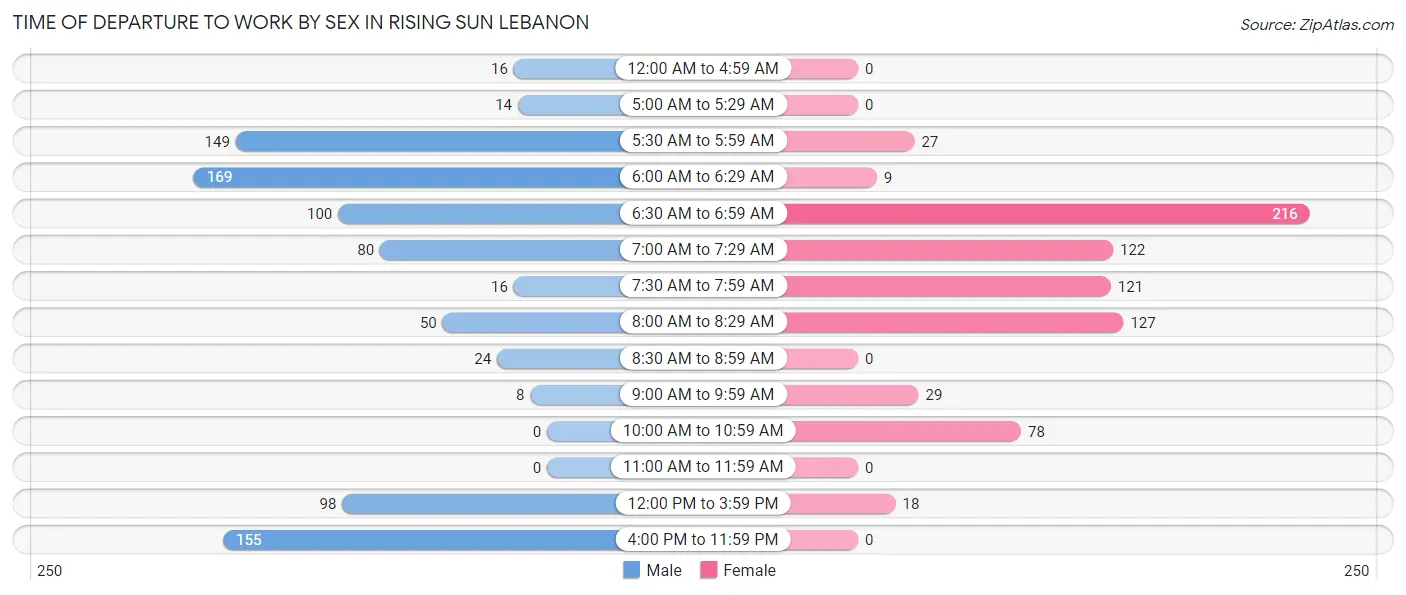
| Time of Departure | Male | Female |
| 12:00 AM to 4:59 AM | 16 (1.8%) | 0 (0.0%) |
| 5:00 AM to 5:29 AM | 14 (1.6%) | 0 (0.0%) |
| 5:30 AM to 5:59 AM | 149 (17.0%) | 27 (3.6%) |
| 6:00 AM to 6:29 AM | 169 (19.2%) | 9 (1.2%) |
| 6:30 AM to 6:59 AM | 100 (11.4%) | 216 (28.9%) |
| 7:00 AM to 7:29 AM | 80 (9.1%) | 122 (16.3%) |
| 7:30 AM to 7:59 AM | 16 (1.8%) | 121 (16.2%) |
| 8:00 AM to 8:29 AM | 50 (5.7%) | 127 (17.0%) |
| 8:30 AM to 8:59 AM | 24 (2.7%) | 0 (0.0%) |
| 9:00 AM to 9:59 AM | 8 (0.9%) | 29 (3.9%) |
| 10:00 AM to 10:59 AM | 0 (0.0%) | 78 (10.4%) |
| 11:00 AM to 11:59 AM | 0 (0.0%) | 0 (0.0%) |
| 12:00 PM to 3:59 PM | 98 (11.2%) | 18 (2.4%) |
| 4:00 PM to 11:59 PM | 155 (17.6%) | 0 (0.0%) |
| Total | 879 (100.0%) | 747 (100.0%) |
Housing Occupancy in Rising Sun Lebanon
Occupancy by Ownership in Rising Sun Lebanon
Of the total 1,204 dwellings in Rising Sun Lebanon, owner-occupied units account for 675 (56.1%), while renter-occupied units make up 529 (43.9%).
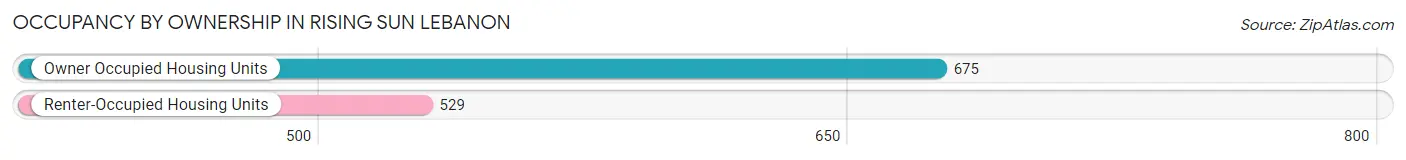
| Occupancy | # Housing Units | % Housing Units |
| Owner Occupied Housing Units | 675 | 56.1% |
| Renter-Occupied Housing Units | 529 | 43.9% |
| Total Occupied Housing Units | 1,204 | 100.0% |
Occupancy by Household Size in Rising Sun Lebanon
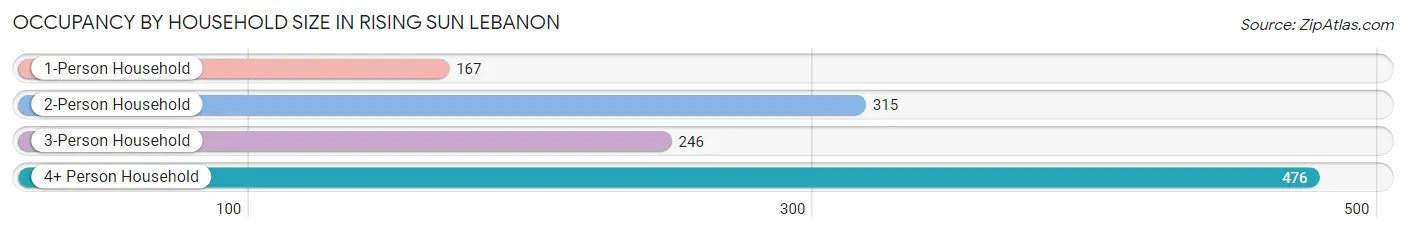
| Household Size | # Housing Units | % Housing Units |
| 1-Person Household | 167 | 13.9% |
| 2-Person Household | 315 | 26.2% |
| 3-Person Household | 246 | 20.4% |
| 4+ Person Household | 476 | 39.5% |
| Total Housing Units | 1,204 | 100.0% |
Occupancy by Ownership by Household Size in Rising Sun Lebanon
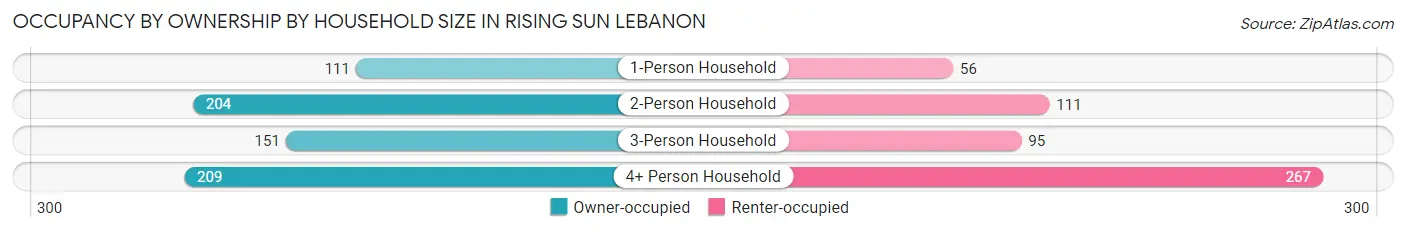
| Household Size | Owner-occupied | Renter-occupied |
| 1-Person Household | 111 (66.5%) | 56 (33.5%) |
| 2-Person Household | 204 (64.8%) | 111 (35.2%) |
| 3-Person Household | 151 (61.4%) | 95 (38.6%) |
| 4+ Person Household | 209 (43.9%) | 267 (56.1%) |
| Total Housing Units | 675 (56.1%) | 529 (43.9%) |
Occupancy by Educational Attainment in Rising Sun Lebanon
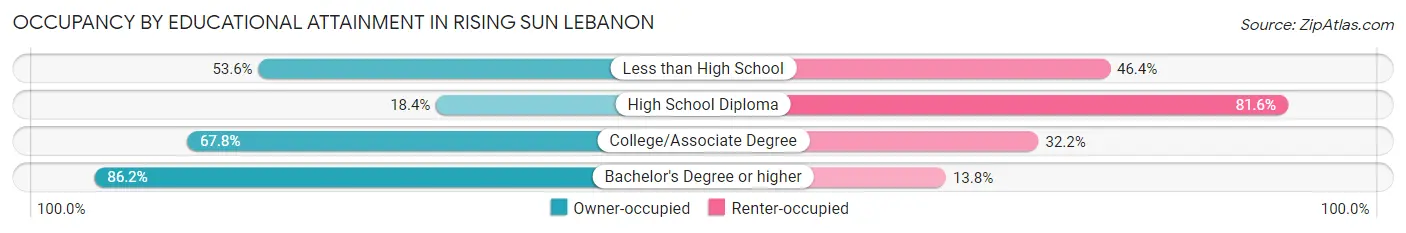
| Household Size | Owner-occupied | Renter-occupied |
| Less than High School | 59 (53.6%) | 51 (46.4%) |
| High School Diploma | 71 (18.4%) | 315 (81.6%) |
| College/Associate Degree | 240 (67.8%) | 114 (32.2%) |
| Bachelor's Degree or higher | 305 (86.2%) | 49 (13.8%) |
Occupancy by Age of Householder in Rising Sun Lebanon
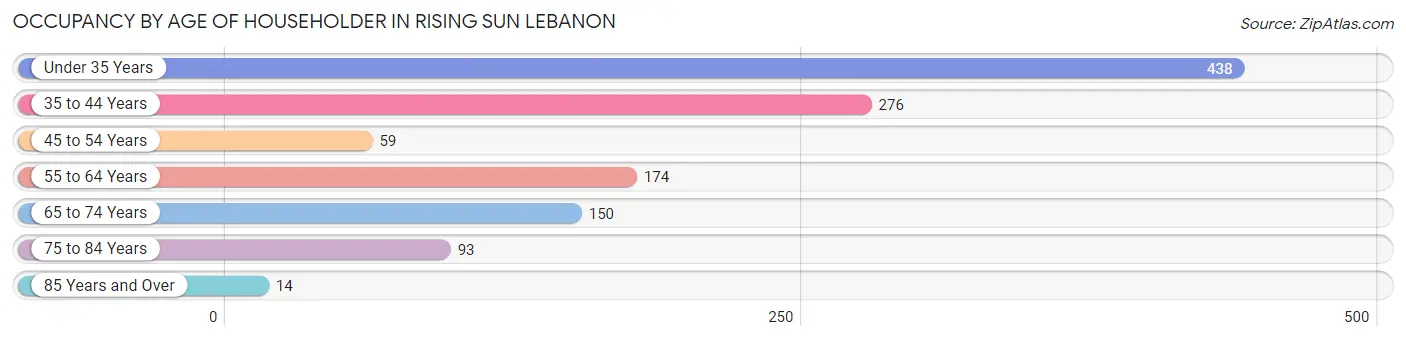
| Age Bracket | # Households | % Households |
| Under 35 Years | 438 | 36.4% |
| 35 to 44 Years | 276 | 22.9% |
| 45 to 54 Years | 59 | 4.9% |
| 55 to 64 Years | 174 | 14.4% |
| 65 to 74 Years | 150 | 12.5% |
| 75 to 84 Years | 93 | 7.7% |
| 85 Years and Over | 14 | 1.2% |
| Total | 1,204 | 100.0% |
Housing Finances in Rising Sun Lebanon
Median Income by Occupancy in Rising Sun Lebanon
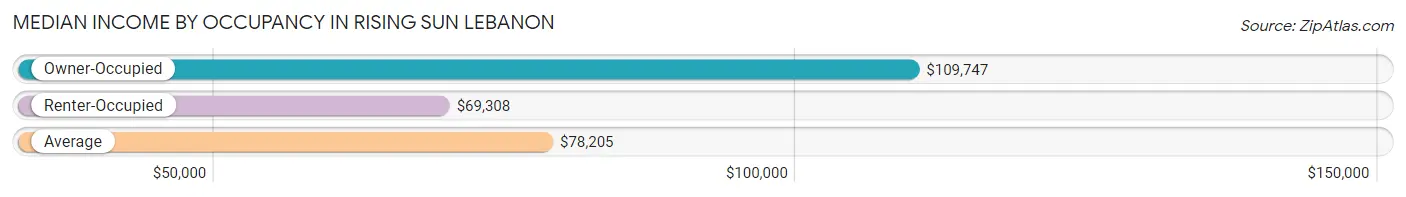
| Occupancy Type | # Households | Median Income |
| Owner-Occupied | 675 (56.1%) | $109,747 |
| Renter-Occupied | 529 (43.9%) | $69,308 |
| Average | 1,204 (100.0%) | $78,205 |
Occupancy by Householder Income Bracket in Rising Sun Lebanon
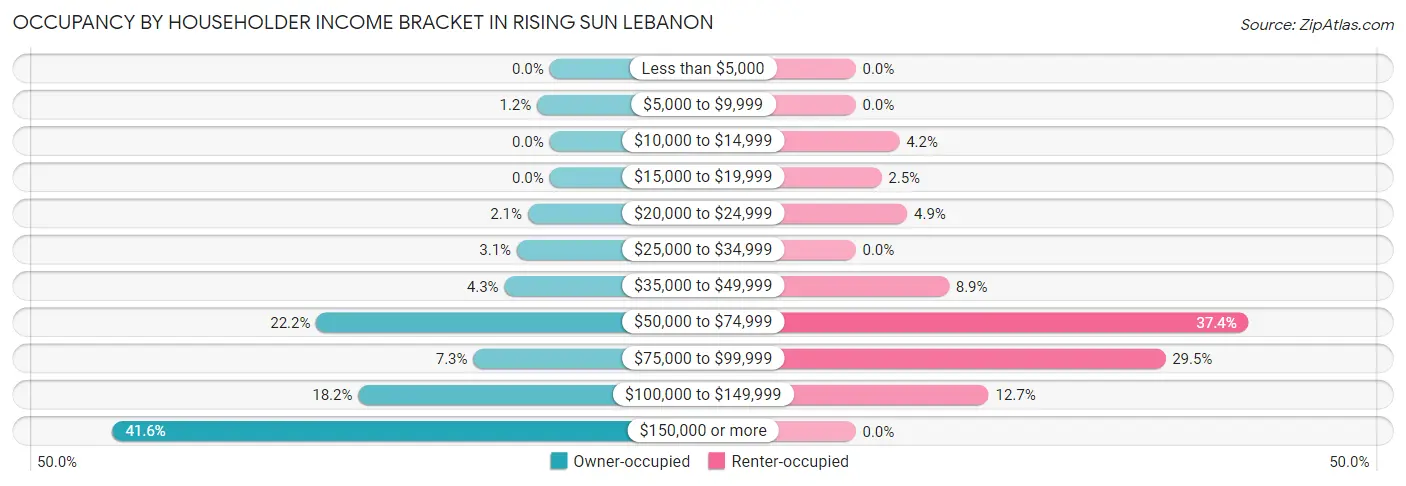
| Income Bracket | Owner-occupied | Renter-occupied |
| Less than $5,000 | 0 (0.0%) | 0 (0.0%) |
| $5,000 to $9,999 | 8 (1.2%) | 0 (0.0%) |
| $10,000 to $14,999 | 0 (0.0%) | 22 (4.2%) |
| $15,000 to $19,999 | 0 (0.0%) | 13 (2.5%) |
| $20,000 to $24,999 | 14 (2.1%) | 26 (4.9%) |
| $25,000 to $34,999 | 21 (3.1%) | 0 (0.0%) |
| $35,000 to $49,999 | 29 (4.3%) | 47 (8.9%) |
| $50,000 to $74,999 | 150 (22.2%) | 198 (37.4%) |
| $75,000 to $99,999 | 49 (7.3%) | 156 (29.5%) |
| $100,000 to $149,999 | 123 (18.2%) | 67 (12.7%) |
| $150,000 or more | 281 (41.6%) | 0 (0.0%) |
| Total | 675 (100.0%) | 529 (100.0%) |
Monthly Housing Cost Tiers in Rising Sun Lebanon
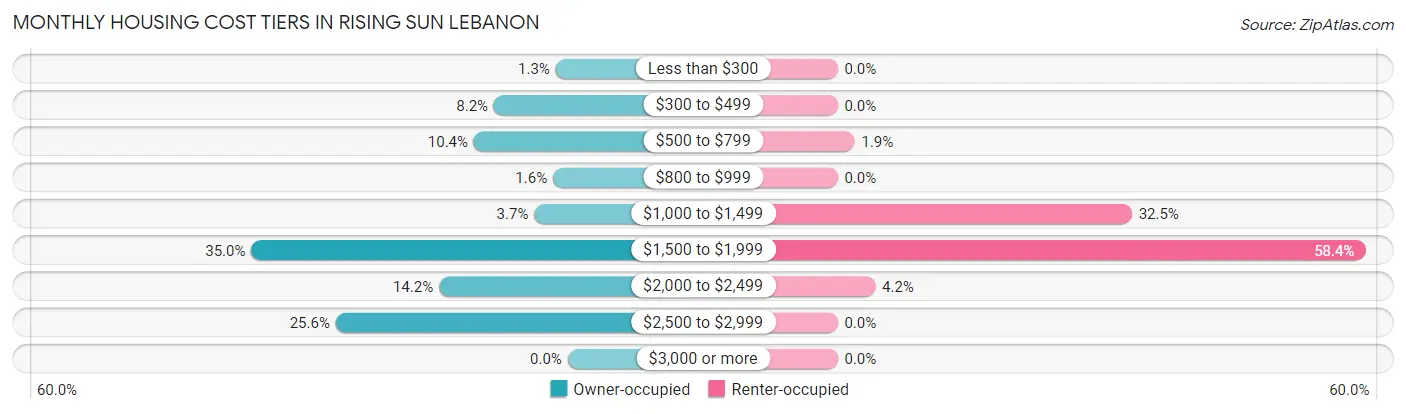
| Monthly Cost | Owner-occupied | Renter-occupied |
| Less than $300 | 9 (1.3%) | 0 (0.0%) |
| $300 to $499 | 55 (8.2%) | 0 (0.0%) |
| $500 to $799 | 70 (10.4%) | 10 (1.9%) |
| $800 to $999 | 11 (1.6%) | 0 (0.0%) |
| $1,000 to $1,499 | 25 (3.7%) | 172 (32.5%) |
| $1,500 to $1,999 | 236 (35.0%) | 309 (58.4%) |
| $2,000 to $2,499 | 96 (14.2%) | 22 (4.2%) |
| $2,500 to $2,999 | 173 (25.6%) | 0 (0.0%) |
| $3,000 or more | 0 (0.0%) | 0 (0.0%) |
| Total | 675 (100.0%) | 529 (100.0%) |
Physical Housing Characteristics in Rising Sun Lebanon
Housing Structures in Rising Sun Lebanon
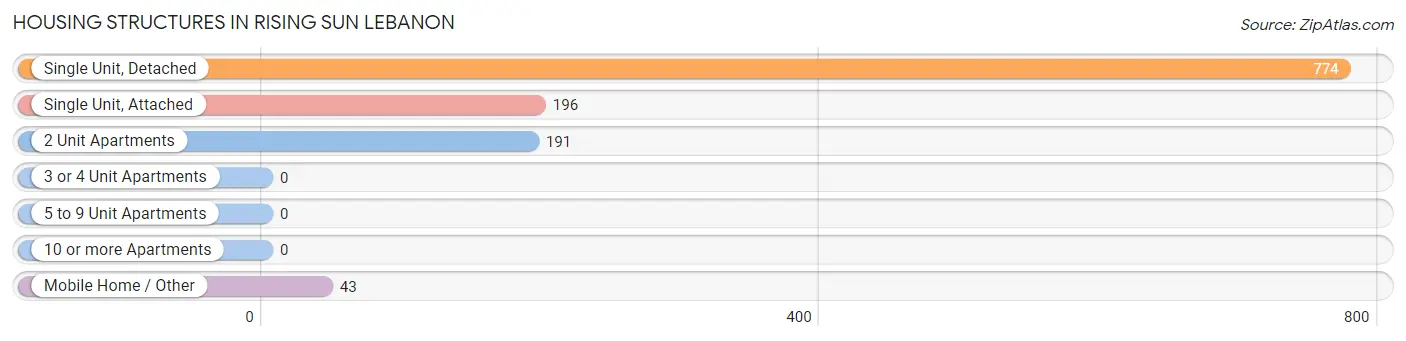
| Structure Type | # Housing Units | % Housing Units |
| Single Unit, Detached | 774 | 64.3% |
| Single Unit, Attached | 196 | 16.3% |
| 2 Unit Apartments | 191 | 15.9% |
| 3 or 4 Unit Apartments | 0 | 0.0% |
| 5 to 9 Unit Apartments | 0 | 0.0% |
| 10 or more Apartments | 0 | 0.0% |
| Mobile Home / Other | 43 | 3.6% |
| Total | 1,204 | 100.0% |
Housing Structures by Occupancy in Rising Sun Lebanon
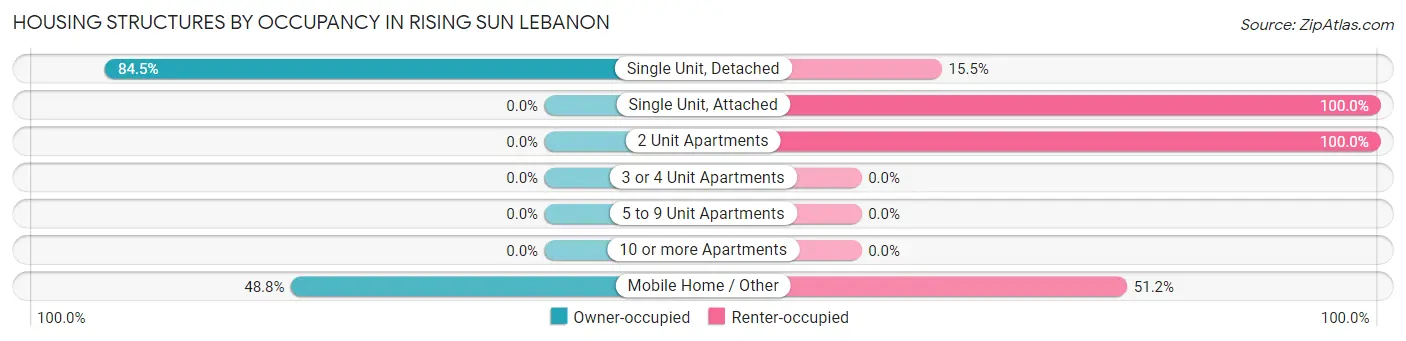
| Structure Type | Owner-occupied | Renter-occupied |
| Single Unit, Detached | 654 (84.5%) | 120 (15.5%) |
| Single Unit, Attached | 0 (0.0%) | 196 (100.0%) |
| 2 Unit Apartments | 0 (0.0%) | 191 (100.0%) |
| 3 or 4 Unit Apartments | 0 (0.0%) | 0 (0.0%) |
| 5 to 9 Unit Apartments | 0 (0.0%) | 0 (0.0%) |
| 10 or more Apartments | 0 (0.0%) | 0 (0.0%) |
| Mobile Home / Other | 21 (48.8%) | 22 (51.2%) |
| Total | 675 (56.1%) | 529 (43.9%) |
Housing Structures by Number of Rooms in Rising Sun Lebanon
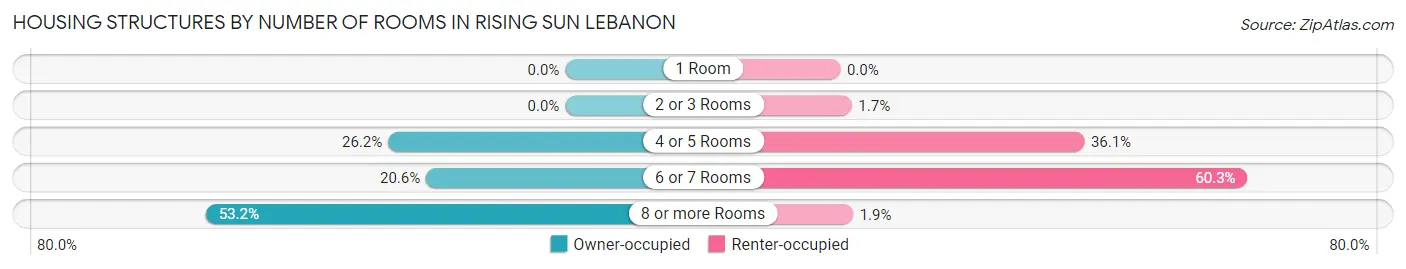
| Number of Rooms | Owner-occupied | Renter-occupied |
| 1 Room | 0 (0.0%) | 0 (0.0%) |
| 2 or 3 Rooms | 0 (0.0%) | 9 (1.7%) |
| 4 or 5 Rooms | 177 (26.2%) | 191 (36.1%) |
| 6 or 7 Rooms | 139 (20.6%) | 319 (60.3%) |
| 8 or more Rooms | 359 (53.2%) | 10 (1.9%) |
| Total | 675 (100.0%) | 529 (100.0%) |
Housing Structure by Heating Type in Rising Sun Lebanon
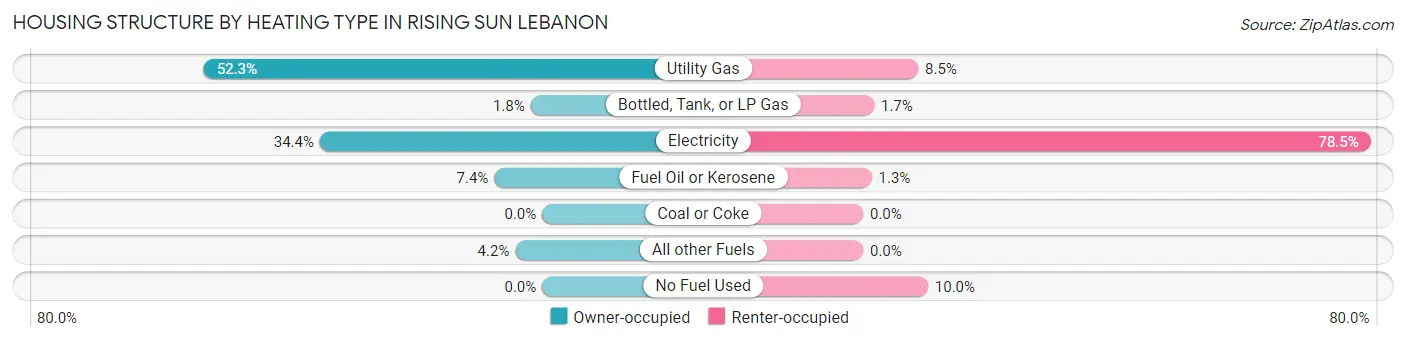
| Heating Type | Owner-occupied | Renter-occupied |
| Utility Gas | 353 (52.3%) | 45 (8.5%) |
| Bottled, Tank, or LP Gas | 12 (1.8%) | 9 (1.7%) |
| Electricity | 232 (34.4%) | 415 (78.4%) |
| Fuel Oil or Kerosene | 50 (7.4%) | 7 (1.3%) |
| Coal or Coke | 0 (0.0%) | 0 (0.0%) |
| All other Fuels | 28 (4.2%) | 0 (0.0%) |
| No Fuel Used | 0 (0.0%) | 53 (10.0%) |
| Total | 675 (100.0%) | 529 (100.0%) |
Household Vehicle Usage in Rising Sun Lebanon
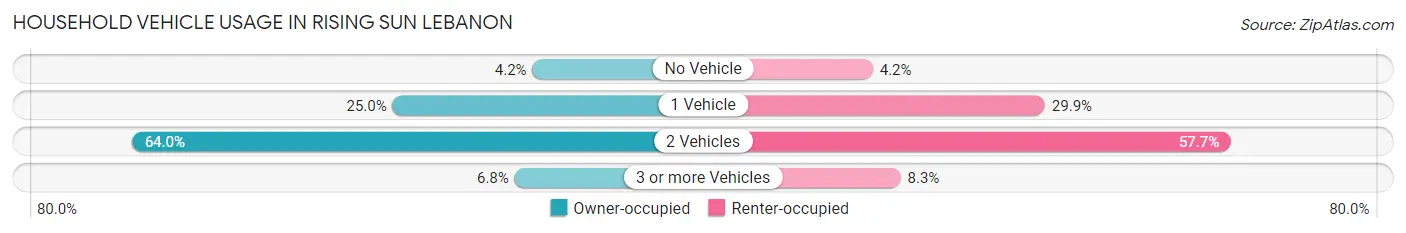
| Vehicles per Household | Owner-occupied | Renter-occupied |
| No Vehicle | 28 (4.2%) | 22 (4.2%) |
| 1 Vehicle | 169 (25.0%) | 158 (29.9%) |
| 2 Vehicles | 432 (64.0%) | 305 (57.7%) |
| 3 or more Vehicles | 46 (6.8%) | 44 (8.3%) |
| Total | 675 (100.0%) | 529 (100.0%) |
Real Estate & Mortgages in Rising Sun Lebanon
Real Estate and Mortgage Overview in Rising Sun Lebanon
| Characteristic | Without Mortgage | With Mortgage |
| Housing Units | 111 | 564 |
| Median Property Value | $431,800 | $407,800 |
| Median Household Income | - | - |
| Monthly Housing Costs | $476 | $0 |
| Real Estate Taxes | $2,043 | $64 |
Property Value by Mortgage Status in Rising Sun Lebanon
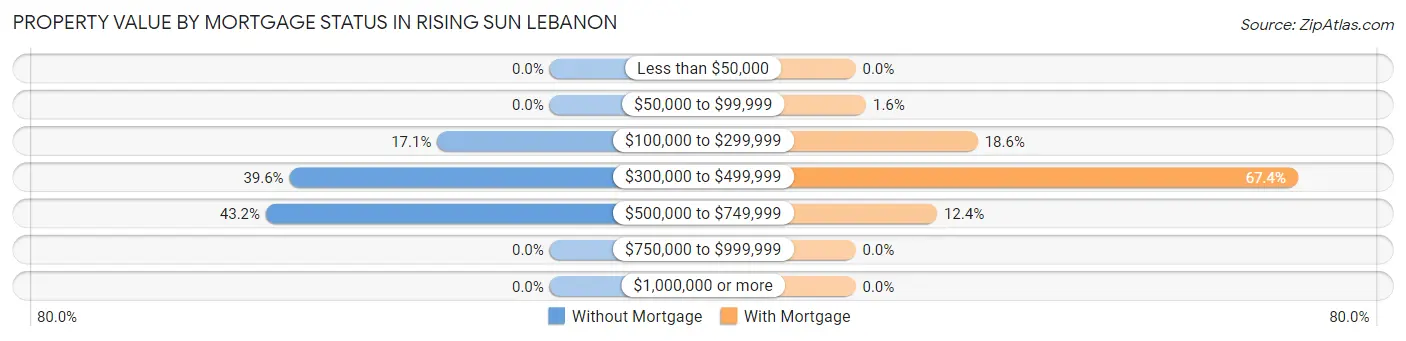
| Property Value | Without Mortgage | With Mortgage |
| Less than $50,000 | 0 (0.0%) | 0 (0.0%) |
| $50,000 to $99,999 | 0 (0.0%) | 9 (1.6%) |
| $100,000 to $299,999 | 19 (17.1%) | 105 (18.6%) |
| $300,000 to $499,999 | 44 (39.6%) | 380 (67.4%) |
| $500,000 to $749,999 | 48 (43.2%) | 70 (12.4%) |
| $750,000 to $999,999 | 0 (0.0%) | 0 (0.0%) |
| $1,000,000 or more | 0 (0.0%) | 0 (0.0%) |
| Total | 111 (100.0%) | 564 (100.0%) |
Household Income by Mortgage Status in Rising Sun Lebanon
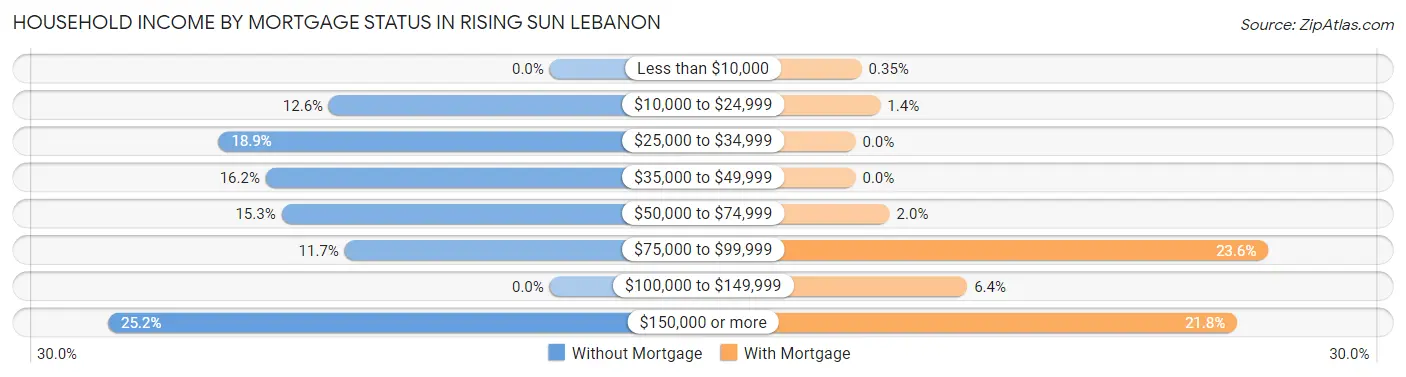
| Household Income | Without Mortgage | With Mortgage |
| Less than $10,000 | 0 (0.0%) | 2 (0.4%) |
| $10,000 to $24,999 | 14 (12.6%) | 8 (1.4%) |
| $25,000 to $34,999 | 21 (18.9%) | 0 (0.0%) |
| $35,000 to $49,999 | 18 (16.2%) | 0 (0.0%) |
| $50,000 to $74,999 | 17 (15.3%) | 11 (1.9%) |
| $75,000 to $99,999 | 13 (11.7%) | 133 (23.6%) |
| $100,000 to $149,999 | 0 (0.0%) | 36 (6.4%) |
| $150,000 or more | 28 (25.2%) | 123 (21.8%) |
| Total | 111 (100.0%) | 564 (100.0%) |
Property Value to Household Income Ratio in Rising Sun Lebanon
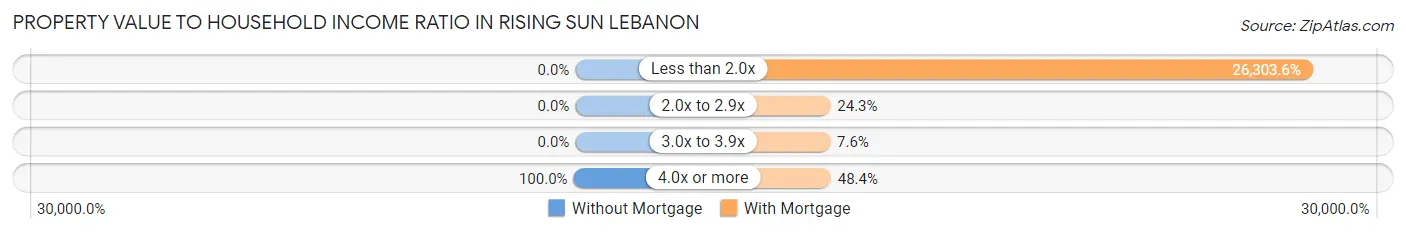
| Value-to-Income Ratio | Without Mortgage | With Mortgage |
| Less than 2.0x | 0 (0.0%) | 148,352 (26,303.6%) |
| 2.0x to 2.9x | 0 (0.0%) | 137 (24.3%) |
| 3.0x to 3.9x | 0 (0.0%) | 43 (7.6%) |
| 4.0x or more | 111 (100.0%) | 273 (48.4%) |
| Total | 111 (100.0%) | 564 (100.0%) |
Real Estate Taxes by Mortgage Status in Rising Sun Lebanon
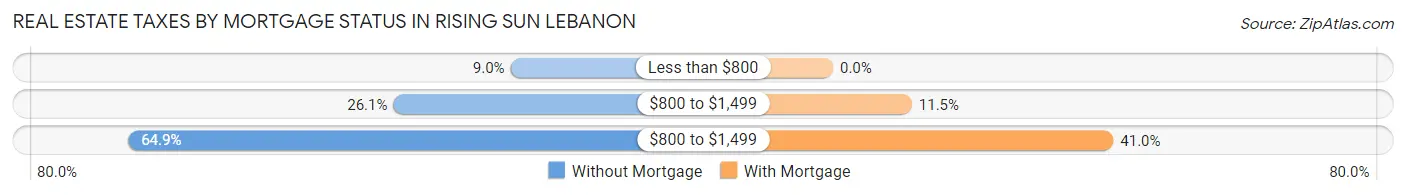
| Property Taxes | Without Mortgage | With Mortgage |
| Less than $800 | 10 (9.0%) | 0 (0.0%) |
| $800 to $1,499 | 29 (26.1%) | 65 (11.5%) |
| $800 to $1,499 | 72 (64.9%) | 231 (41.0%) |
| Total | 111 (100.0%) | 564 (100.0%) |
Health & Disability in Rising Sun Lebanon
Health Insurance Coverage by Age in Rising Sun Lebanon
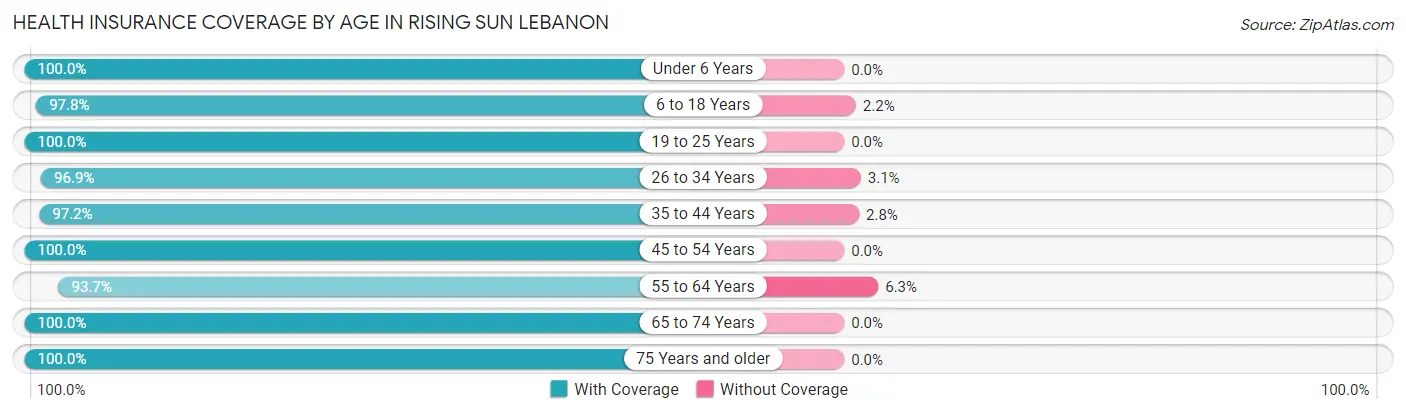
| Age Bracket | With Coverage | Without Coverage |
| Under 6 Years | 604 (100.0%) | 0 (0.0%) |
| 6 to 18 Years | 631 (97.8%) | 14 (2.2%) |
| 19 to 25 Years | 306 (100.0%) | 0 (0.0%) |
| 26 to 34 Years | 658 (96.9%) | 21 (3.1%) |
| 35 to 44 Years | 317 (97.2%) | 9 (2.8%) |
| 45 to 54 Years | 400 (100.0%) | 0 (0.0%) |
| 55 to 64 Years | 443 (93.7%) | 30 (6.3%) |
| 65 to 74 Years | 384 (100.0%) | 0 (0.0%) |
| 75 Years and older | 184 (100.0%) | 0 (0.0%) |
| Total | 3,927 (98.2%) | 74 (1.8%) |
Health Insurance Coverage by Citizenship Status in Rising Sun Lebanon
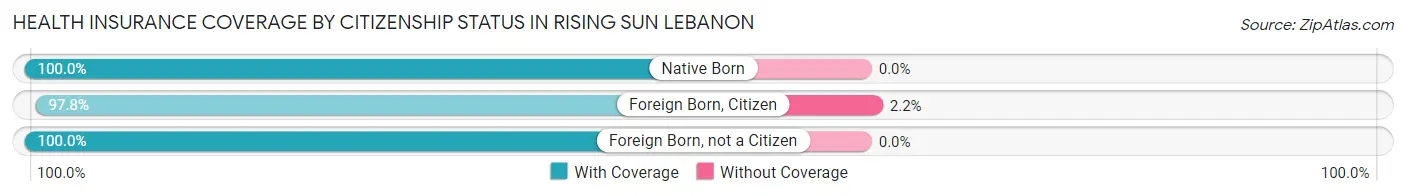
| Citizenship Status | With Coverage | Without Coverage |
| Native Born | 604 (100.0%) | 0 (0.0%) |
| Foreign Born, Citizen | 631 (97.8%) | 14 (2.2%) |
| Foreign Born, not a Citizen | 306 (100.0%) | 0 (0.0%) |
Health Insurance Coverage by Household Income in Rising Sun Lebanon
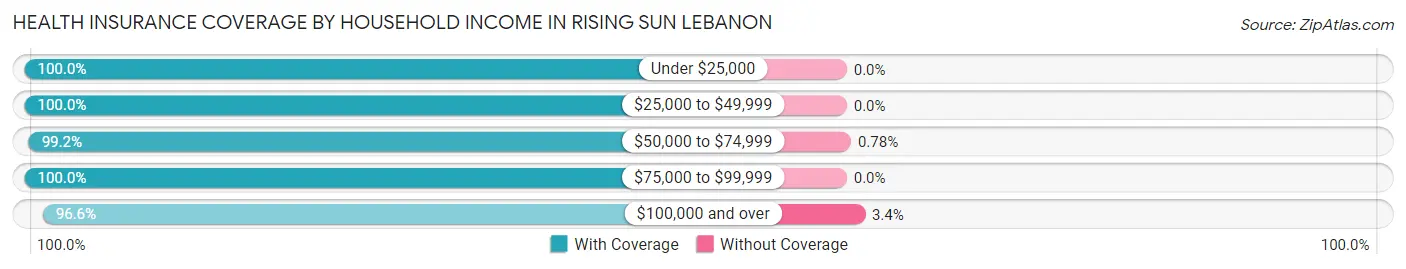
| Household Income | With Coverage | Without Coverage |
| Under $25,000 | 174 (100.0%) | 0 (0.0%) |
| $25,000 to $49,999 | 167 (100.0%) | 0 (0.0%) |
| $50,000 to $74,999 | 1,152 (99.2%) | 9 (0.8%) |
| $75,000 to $99,999 | 588 (100.0%) | 0 (0.0%) |
| $100,000 and over | 1,841 (96.6%) | 65 (3.4%) |
Public vs Private Health Insurance Coverage by Age in Rising Sun Lebanon
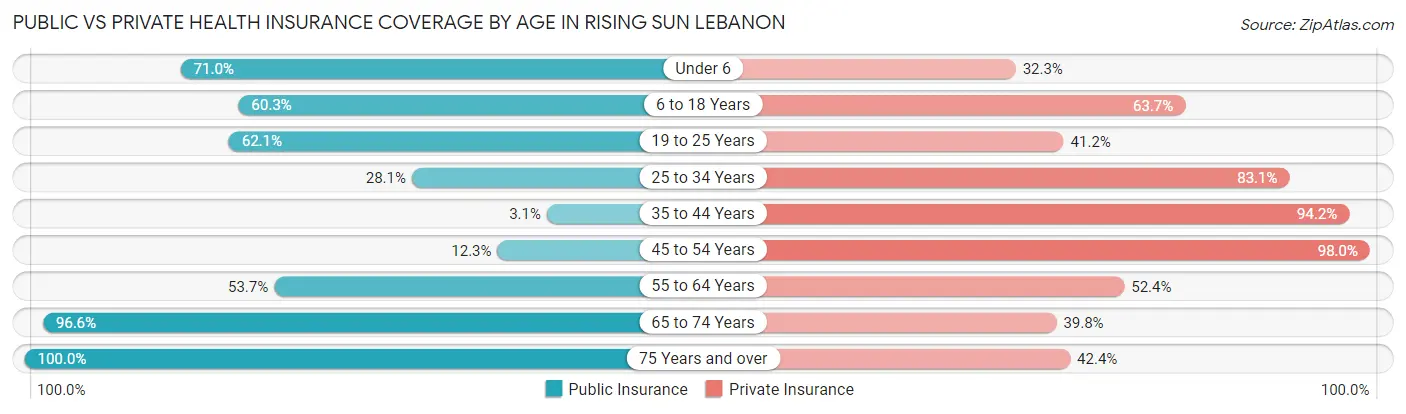
| Age Bracket | Public Insurance | Private Insurance |
| Under 6 | 429 (71.0%) | 195 (32.3%) |
| 6 to 18 Years | 389 (60.3%) | 411 (63.7%) |
| 19 to 25 Years | 190 (62.1%) | 126 (41.2%) |
| 25 to 34 Years | 191 (28.1%) | 564 (83.1%) |
| 35 to 44 Years | 10 (3.1%) | 307 (94.2%) |
| 45 to 54 Years | 49 (12.2%) | 392 (98.0%) |
| 55 to 64 Years | 254 (53.7%) | 248 (52.4%) |
| 65 to 74 Years | 371 (96.6%) | 153 (39.8%) |
| 75 Years and over | 184 (100.0%) | 78 (42.4%) |
| Total | 2,067 (51.7%) | 2,474 (61.8%) |
Disability Status by Sex by Age in Rising Sun Lebanon
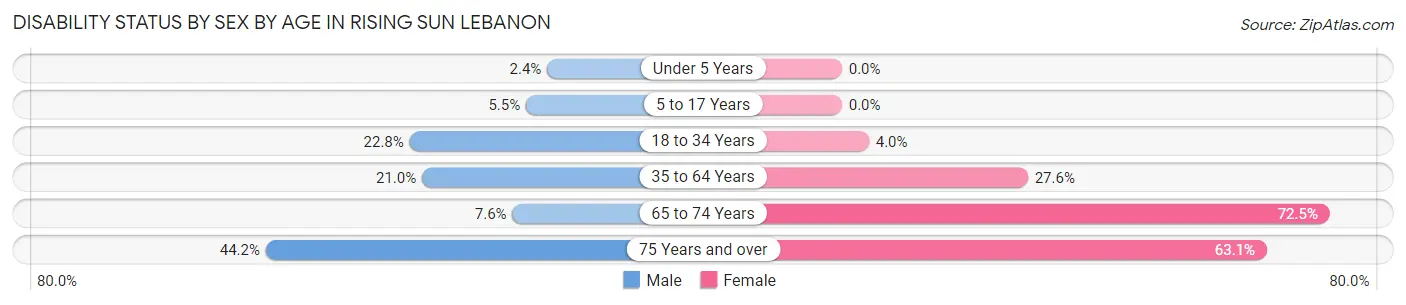
| Age Bracket | Male | Female |
| Under 5 Years | 10 (2.4%) | 0 (0.0%) |
| 5 to 17 Years | 19 (5.5%) | 0 (0.0%) |
| 18 to 34 Years | 100 (22.8%) | 22 (4.0%) |
| 35 to 64 Years | 133 (21.0%) | 156 (27.6%) |
| 65 to 74 Years | 9 (7.6%) | 192 (72.5%) |
| 75 Years and over | 19 (44.2%) | 89 (63.1%) |
Disability Class by Sex by Age in Rising Sun Lebanon
Disability Class: Hearing Difficulty
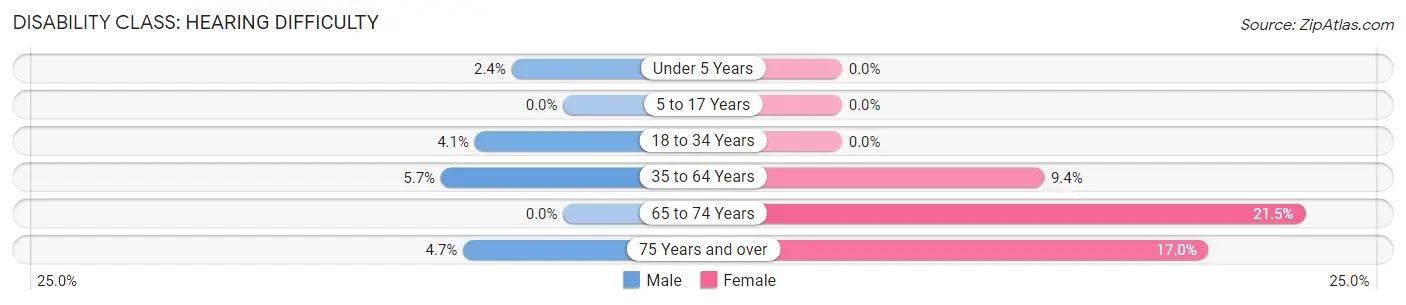
| Age Bracket | Male | Female |
| Under 5 Years | 10 (2.4%) | 0 (0.0%) |
| 5 to 17 Years | 0 (0.0%) | 0 (0.0%) |
| 18 to 34 Years | 18 (4.1%) | 0 (0.0%) |
| 35 to 64 Years | 36 (5.7%) | 53 (9.4%) |
| 65 to 74 Years | 0 (0.0%) | 57 (21.5%) |
| 75 Years and over | 2 (4.6%) | 24 (17.0%) |
Disability Class: Vision Difficulty
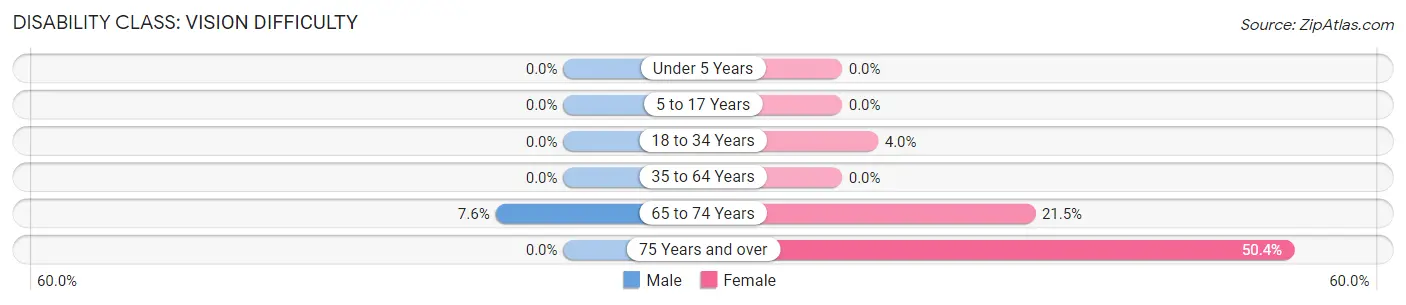
| Age Bracket | Male | Female |
| Under 5 Years | 0 (0.0%) | 0 (0.0%) |
| 5 to 17 Years | 0 (0.0%) | 0 (0.0%) |
| 18 to 34 Years | 0 (0.0%) | 22 (4.0%) |
| 35 to 64 Years | 0 (0.0%) | 0 (0.0%) |
| 65 to 74 Years | 9 (7.6%) | 57 (21.5%) |
| 75 Years and over | 0 (0.0%) | 71 (50.3%) |
Disability Class: Cognitive Difficulty
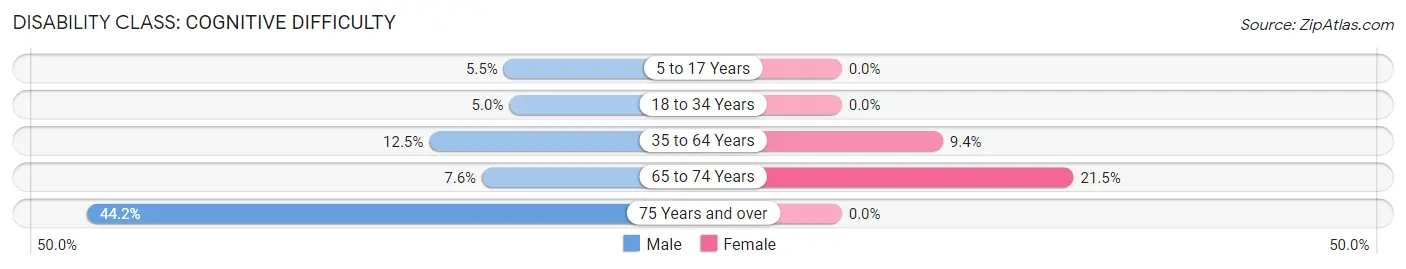
| Age Bracket | Male | Female |
| 5 to 17 Years | 19 (5.5%) | 0 (0.0%) |
| 18 to 34 Years | 22 (5.0%) | 0 (0.0%) |
| 35 to 64 Years | 79 (12.5%) | 53 (9.4%) |
| 65 to 74 Years | 9 (7.6%) | 57 (21.5%) |
| 75 Years and over | 19 (44.2%) | 0 (0.0%) |
Disability Class: Ambulatory Difficulty
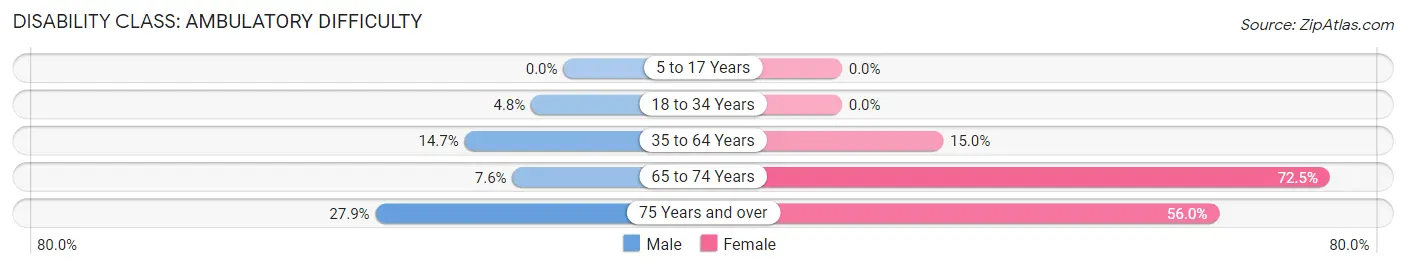
| Age Bracket | Male | Female |
| 5 to 17 Years | 0 (0.0%) | 0 (0.0%) |
| 18 to 34 Years | 21 (4.8%) | 0 (0.0%) |
| 35 to 64 Years | 93 (14.7%) | 85 (15.0%) |
| 65 to 74 Years | 9 (7.6%) | 192 (72.5%) |
| 75 Years and over | 12 (27.9%) | 79 (56.0%) |
Disability Class: Self-Care Difficulty
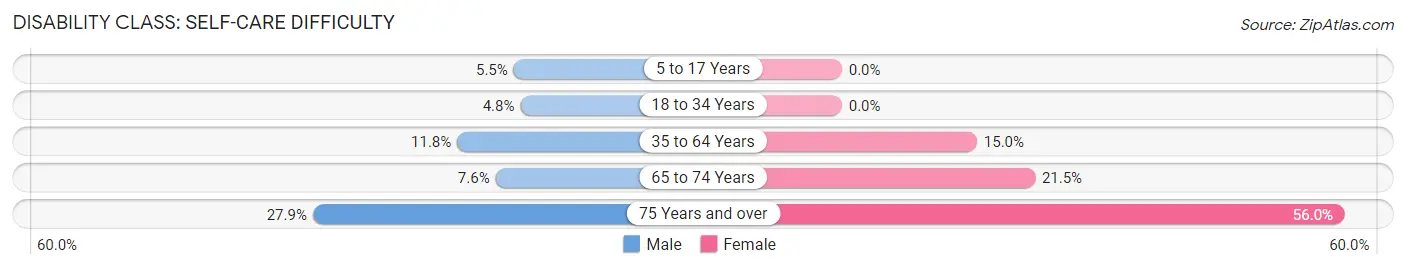
| Age Bracket | Male | Female |
| 5 to 17 Years | 19 (5.5%) | 0 (0.0%) |
| 18 to 34 Years | 21 (4.8%) | 0 (0.0%) |
| 35 to 64 Years | 75 (11.8%) | 85 (15.0%) |
| 65 to 74 Years | 9 (7.6%) | 57 (21.5%) |
| 75 Years and over | 12 (27.9%) | 79 (56.0%) |
Technology Access in Rising Sun Lebanon
Computing Device Access in Rising Sun Lebanon
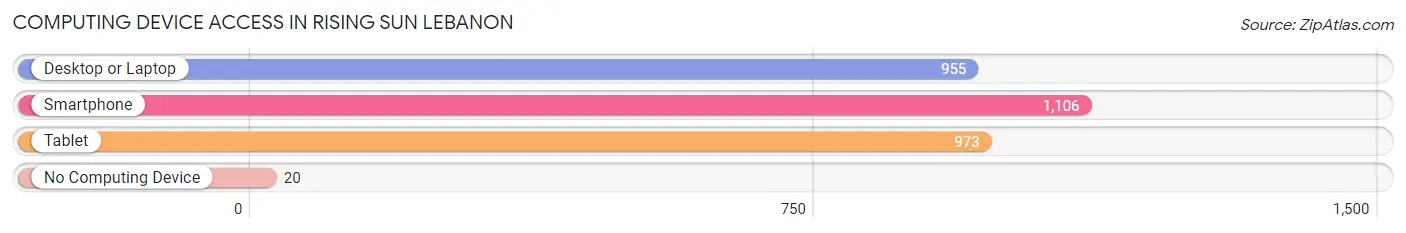
| Device Type | # Households | % Households |
| Desktop or Laptop | 955 | 79.3% |
| Smartphone | 1,106 | 91.9% |
| Tablet | 973 | 80.8% |
| No Computing Device | 20 | 1.7% |
| Total | 1,204 | 100.0% |
Internet Access in Rising Sun Lebanon
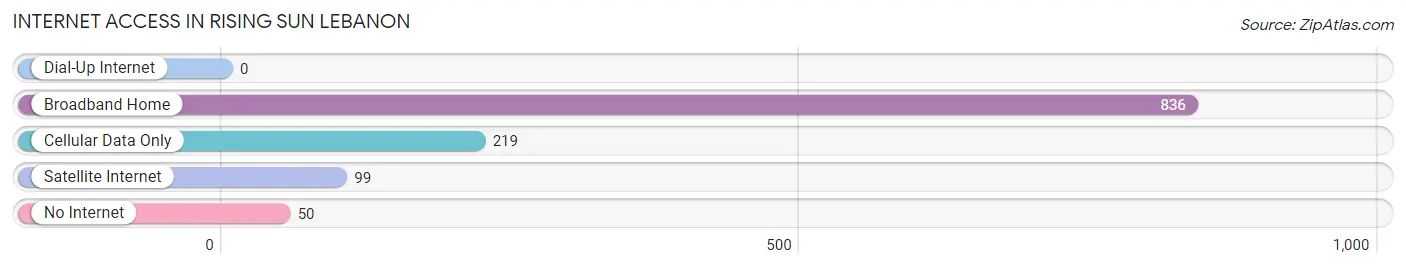
| Internet Type | # Households | % Households |
| Dial-Up Internet | 0 | 0.0% |
| Broadband Home | 836 | 69.4% |
| Cellular Data Only | 219 | 18.2% |
| Satellite Internet | 99 | 8.2% |
| No Internet | 50 | 4.2% |
| Total | 1,204 | 100.0% |
Rising Sun Lebanon Summary
Lebanon, Delaware is a small town located in New Castle County, Delaware. It is situated on the banks of the Christina River, just south of the city of Wilmington. The town has a population of just over 1,000 people and is part of the greater Wilmington metropolitan area.
History
Lebanon was first settled in the late 1600s by Swedish and Dutch immigrants. The town was originally known as Rising Sun, and was named after a tavern that was located in the area. The tavern was owned by a man named John Rising, who was a prominent figure in the area. The town was officially incorporated in 1845 and was renamed Lebanon in 1847.
The town was an important stop on the Underground Railroad, and many escaped slaves passed through the area on their way to freedom. The town was also home to a number of prominent abolitionists, including William Still and Thomas Garrett.
Geography
Lebanon is located in northern New Castle County, Delaware. It is situated on the banks of the Christina River, just south of the city of Wilmington. The town is bordered by the towns of Newark to the north, Bear to the east, and Hockessin to the south. The town covers an area of 1.3 square miles and has a population of just over 1,000 people.
The town is located in a rural area and is surrounded by farmland. The town is also home to a number of parks and recreational areas, including Rising Sun Park, which is located on the banks of the Christina River.
Economy
Lebanon is a small, rural town and does not have a large economy. The town is home to a number of small businesses, including a few restaurants, a grocery store, and a few other retail stores. The town is also home to a number of farms, which produce a variety of crops, including corn, soybeans, and wheat.
The town is also home to a number of manufacturing companies, including a plastics manufacturer and a metal fabrication company. The town is also home to a number of small technology companies, which provide services to the greater Wilmington area.
Demographics
As of the 2010 census, the population of Lebanon was 1,037. The town has a population that is predominantly white (94.3%), with a small percentage of African Americans (2.7%) and Hispanics (2.1%). The median household income in the town is $50,000, and the median home value is $170,000.
The town is served by the Red Clay Consolidated School District, which includes a number of elementary, middle, and high schools. The town is also home to a number of churches, including the Rising Sun United Methodist Church and the Lebanon Presbyterian Church.
Conclusion
Lebanon, Delaware is a small town located in New Castle County, Delaware. It is situated on the banks of the Christina River, just south of the city of Wilmington. The town has a population of just over 1,000 people and is part of the greater Wilmington metropolitan area. The town was first settled in the late 1600s by Swedish and Dutch immigrants and was an important stop on the Underground Railroad. The town is home to a number of small businesses, farms, and manufacturing companies, and is served by the Red Clay Consolidated School District. The town has a predominantly white population, with a small percentage of African Americans and Hispanics.
Common Questions
What is the Total Population of Rising Sun Lebanon?
Total Population of Rising Sun Lebanon is 4,060.
What is the Total Male Population of Rising Sun Lebanon?
Total Male Population of Rising Sun Lebanon is 2,037.
What is the Total Female Population of Rising Sun Lebanon?
Total Female Population of Rising Sun Lebanon is 2,023.
What is the Ratio of Males per 100 Females in Rising Sun Lebanon?
There are 100.69 Males per 100 Females in Rising Sun Lebanon.
What is the Ratio of Females per 100 Males in Rising Sun Lebanon?
There are 99.31 Females per 100 Males in Rising Sun Lebanon.
What is the Median Population Age in Rising Sun Lebanon?
Median Population Age in Rising Sun Lebanon is 31.5 Years.
What is the Average Family Size in Rising Sun Lebanon
Average Family Size in Rising Sun Lebanon is 3.4 People.
What is the Average Household Size in Rising Sun Lebanon
Average Household Size in Rising Sun Lebanon is 3.4 People.
What is Per Capita Income in Rising Sun Lebanon?
Per Capita income in Rising Sun Lebanon is $29,812.
What is the Median Family Income in Rising Sun Lebanon?
Median Family Income in Rising Sun Lebanon is $76,370.
What is the Median Household income in Rising Sun Lebanon?
Median Household Income in Rising Sun Lebanon is $78,205.
What is Income or Wage Gap in Rising Sun Lebanon?
Income or Wage Gap in Rising Sun Lebanon is 5.0%.
Women in Rising Sun Lebanon earn 95.0 cents for every dollar earned by a man.
What is Inequality or Gini Index in Rising Sun Lebanon?
Inequality or Gini Index in Rising Sun Lebanon is 0.32.
How Large is the Labor Force in Rising Sun Lebanon?
There are 1,702 People in the Labor Forcein in Rising Sun Lebanon.
What is the Percentage of People in the Labor Force in Rising Sun Lebanon?
59.9% of People are in the Labor Force in Rising Sun Lebanon.
What is the Unemployment Rate in Rising Sun Lebanon?
Unemployment Rate in Rising Sun Lebanon is 1.3%.