Houston, DE
Houston Map
Houston Overview
426
TOTAL POPULATION
229
MALE POPULATION
197
FEMALE POPULATION
116.24
MALES / 100 FEMALES
86.03
FEMALES / 100 MALES
49.6
MEDIAN AGE
2.2
AVG FAMILY SIZE
2.0
AVG HOUSEHOLD SIZE
$45,092
PER CAPITA INCOME
$97,500
AVG FAMILY INCOME
$92,500
AVG HOUSEHOLD INCOME
60.2%
WAGE / INCOME GAP [ % ]
39.8¢/ $1
WAGE / INCOME GAP [ $ ]
0.39
INEQUALITY / GINI INDEX
279
LABOR FORCE [ PEOPLE ]
71.9%
PERCENT IN LABOR FORCE
8.4%
UNEMPLOYMENT RATE
Houston Zip Codes
Houston Area Codes
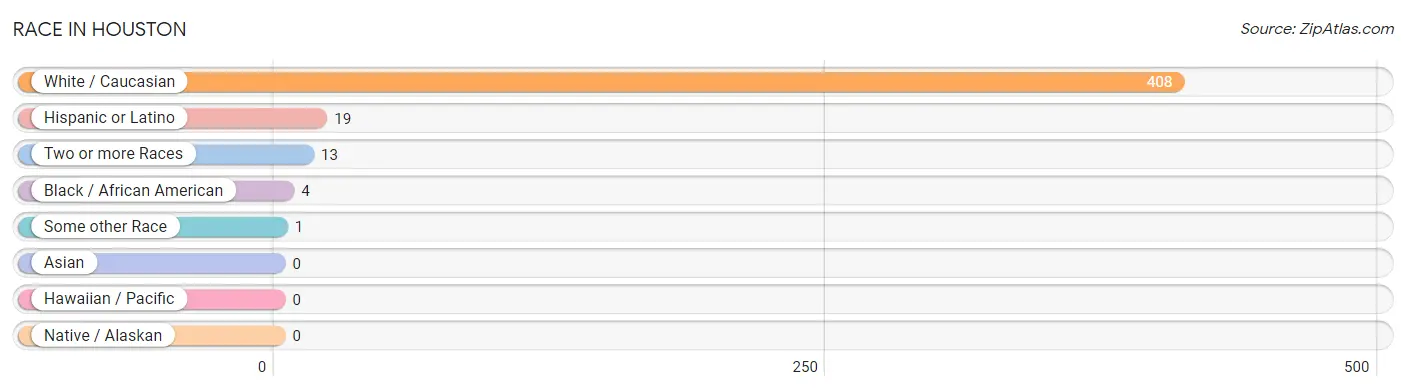
Race in Houston
The most populous races in Houston are White / Caucasian (408 | 95.8%), Hispanic or Latino (19 | 4.5%), and Two or more Races (13 | 3.0%).
| Race | # Population | % Population |
| Asian | 0 | 0.0% |
| Black / African American | 4 | 0.9% |
| Hawaiian / Pacific | 0 | 0.0% |
| Hispanic or Latino | 19 | 4.5% |
| Native / Alaskan | 0 | 0.0% |
| White / Caucasian | 408 | 95.8% |
| Two or more Races | 13 | 3.0% |
| Some other Race | 1 | 0.2% |
| Total | 426 | 100.0% |
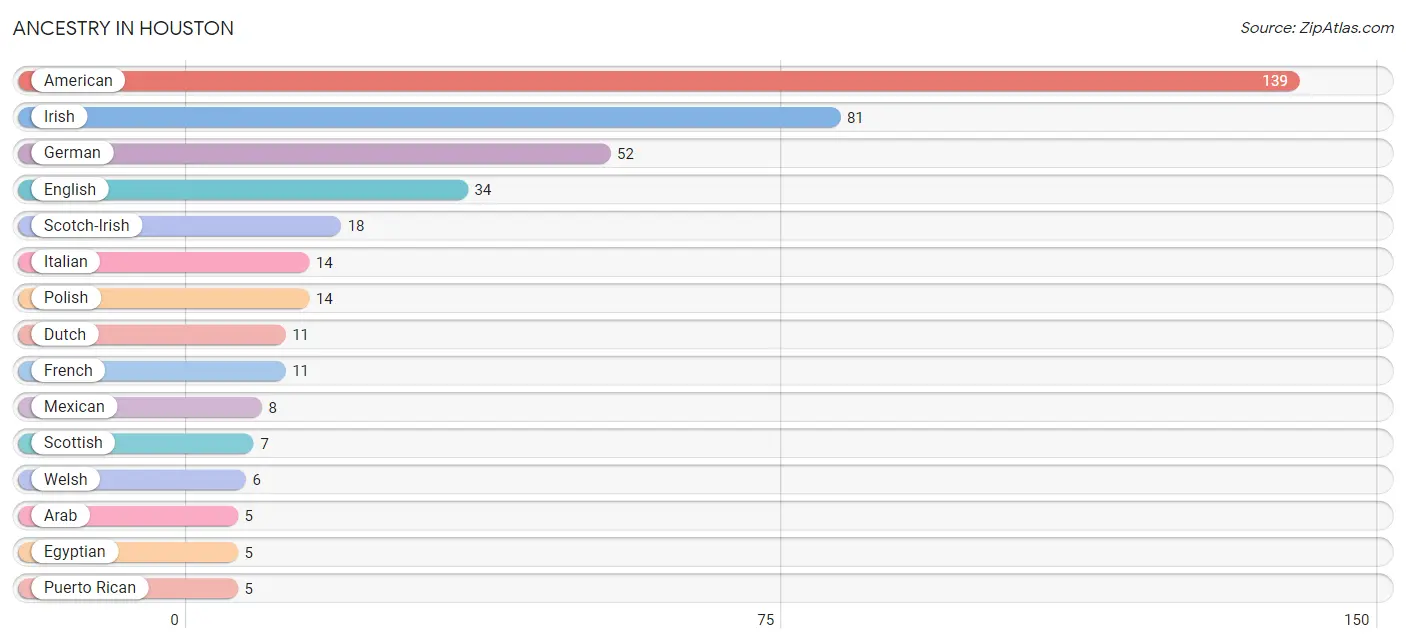
Ancestry in Houston
The most populous ancestries reported in Houston are American (139 | 32.6%), Irish (81 | 19.0%), German (52 | 12.2%), English (34 | 8.0%), and Scotch-Irish (18 | 4.2%), together accounting for 76.1% of all Houston residents.
| Ancestry | # Population | % Population |
| American | 139 | 32.6% |
| Arab | 5 | 1.2% |
| Croatian | 3 | 0.7% |
| Delaware | 2 | 0.5% |
| Dutch | 11 | 2.6% |
| Egyptian | 5 | 1.2% |
| English | 34 | 8.0% |
| Finnish | 2 | 0.5% |
| French | 11 | 2.6% |
| German | 52 | 12.2% |
| Hungarian | 2 | 0.5% |
| Irish | 81 | 19.0% |
| Italian | 14 | 3.3% |
| Mexican | 8 | 1.9% |
| Norwegian | 1 | 0.2% |
| Pennsylvania German | 3 | 0.7% |
| Peruvian | 1 | 0.2% |
| Polish | 14 | 3.3% |
| Puerto Rican | 5 | 1.2% |
| Russian | 2 | 0.5% |
| Scandinavian | 5 | 1.2% |
| Scotch-Irish | 18 | 4.2% |
| Scottish | 7 | 1.6% |
| Slovak | 3 | 0.7% |
| South American | 1 | 0.2% |
| Spaniard | 5 | 1.2% |
| Welsh | 6 | 1.4% | View All 27 Rows |
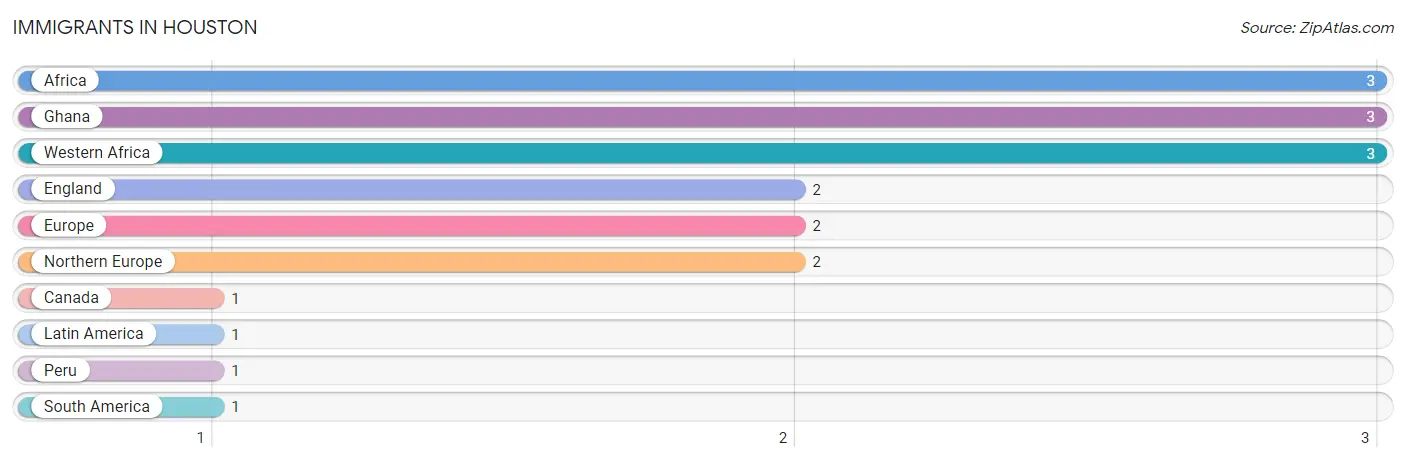
Immigrants in Houston
The most numerous immigrant groups reported in Houston came from Africa (3 | 0.7%), Ghana (3 | 0.7%), Western Africa (3 | 0.7%), England (2 | 0.5%), and Europe (2 | 0.5%), together accounting for 3.0% of all Houston residents.
| Immigration Origin | # Population | % Population |
| Africa | 3 | 0.7% |
| Canada | 1 | 0.2% |
| England | 2 | 0.5% |
| Europe | 2 | 0.5% |
| Ghana | 3 | 0.7% |
| Latin America | 1 | 0.2% |
| Northern Europe | 2 | 0.5% |
| Peru | 1 | 0.2% |
| South America | 1 | 0.2% |
| Western Africa | 3 | 0.7% | View All 10 Rows |
Sex and Age in Houston
Sex and Age in Houston
The most populous age groups in Houston are 65 to 69 Years (61 | 26.6%) for men and 15 to 19 Years (26 | 13.2%) for women.
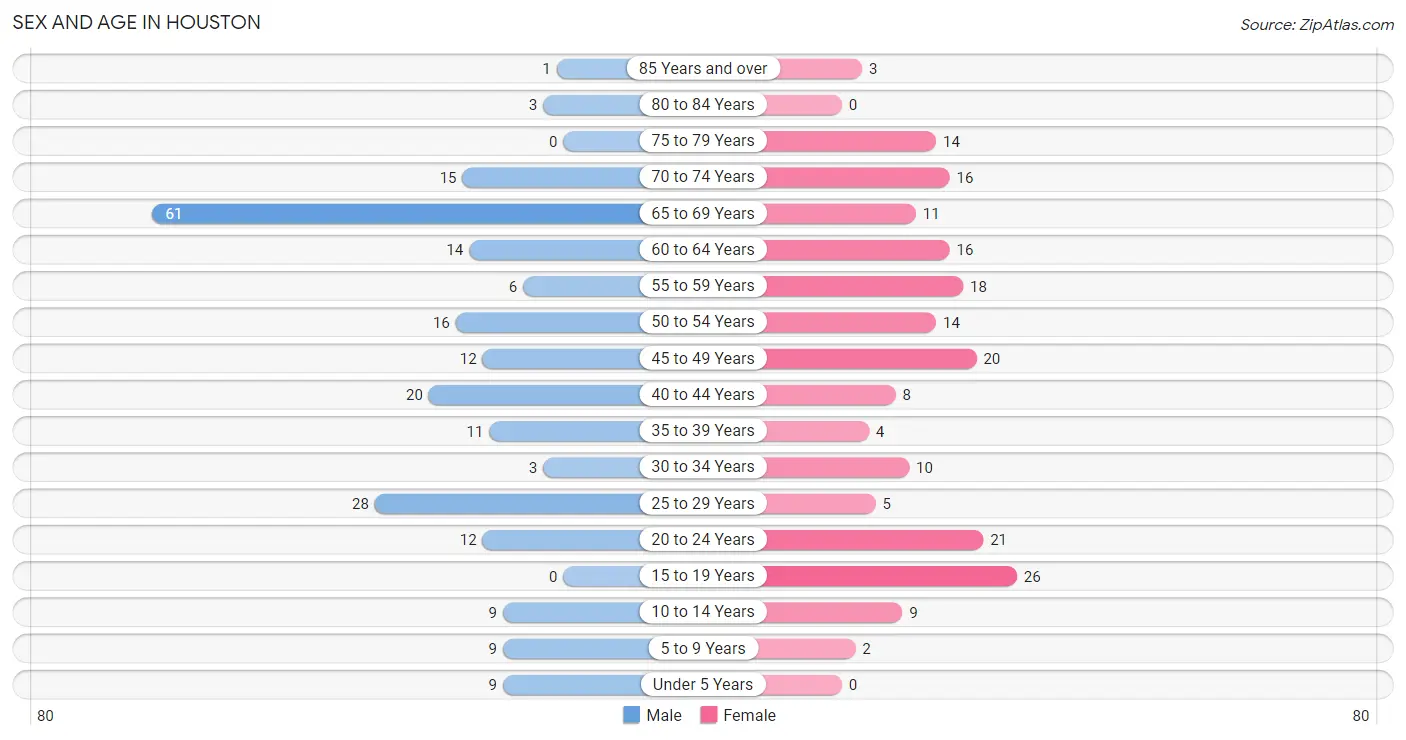
| Age Bracket | Male | Female |
| Under 5 Years | 9 (3.9%) | 0 (0.0%) |
| 5 to 9 Years | 9 (3.9%) | 2 (1.0%) |
| 10 to 14 Years | 9 (3.9%) | 9 (4.6%) |
| 15 to 19 Years | 0 (0.0%) | 26 (13.2%) |
| 20 to 24 Years | 12 (5.2%) | 21 (10.7%) |
| 25 to 29 Years | 28 (12.2%) | 5 (2.5%) |
| 30 to 34 Years | 3 (1.3%) | 10 (5.1%) |
| 35 to 39 Years | 11 (4.8%) | 4 (2.0%) |
| 40 to 44 Years | 20 (8.7%) | 8 (4.1%) |
| 45 to 49 Years | 12 (5.2%) | 20 (10.2%) |
| 50 to 54 Years | 16 (7.0%) | 14 (7.1%) |
| 55 to 59 Years | 6 (2.6%) | 18 (9.1%) |
| 60 to 64 Years | 14 (6.1%) | 16 (8.1%) |
| 65 to 69 Years | 61 (26.6%) | 11 (5.6%) |
| 70 to 74 Years | 15 (6.6%) | 16 (8.1%) |
| 75 to 79 Years | 0 (0.0%) | 14 (7.1%) |
| 80 to 84 Years | 3 (1.3%) | 0 (0.0%) |
| 85 Years and over | 1 (0.4%) | 3 (1.5%) |
| Total | 229 (100.0%) | 197 (100.0%) |
Families and Households in Houston
Median Family Size in Houston
The median family size in Houston is 2.22 persons per family, with single female/mother families (18 | 11.5%) accounting for the largest median family size of 3.39 persons per family. On the other hand, single male/father families (2 | 1.3%) represent the smallest median family size with 2.00 persons per family.
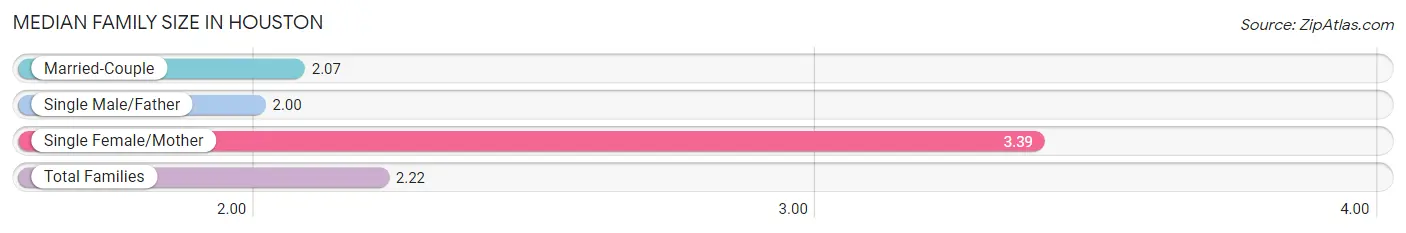
| Family Type | # Families | Family Size |
| Married-Couple | 136 (87.2%) | 2.07 |
| Single Male/Father | 2 (1.3%) | 2.00 |
| Single Female/Mother | 18 (11.5%) | 3.39 |
| Total Families | 156 (100.0%) | 2.22 |
Median Household Size in Houston
The median household size in Houston is 2.05 persons per household, with single female/mother households (18 | 8.6%) accounting for the largest median household size of 3.56 persons per household. non-family households (52 | 25.0%) represent the smallest median household size with 1.15 persons per household.
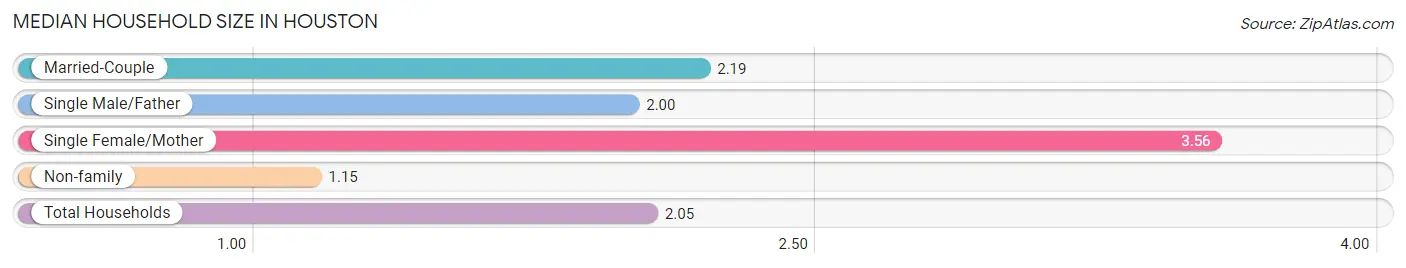
| Household Type | # Households | Household Size |
| Married-Couple | 136 (65.4%) | 2.19 |
| Single Male/Father | 2 (1.0%) | 2.00 |
| Single Female/Mother | 18 (8.6%) | 3.56 |
| Non-family | 52 (25.0%) | 1.15 |
| Total Households | 208 (100.0%) | 2.05 |
Household Size by Marriage Status in Houston
Out of a total of 208 households in Houston, 156 (75.0%) are family households, while 52 (25.0%) are nonfamily households. The most numerous type of family households are 2-person households, comprising 92, and the most common type of nonfamily households are 1-person households, comprising 41.
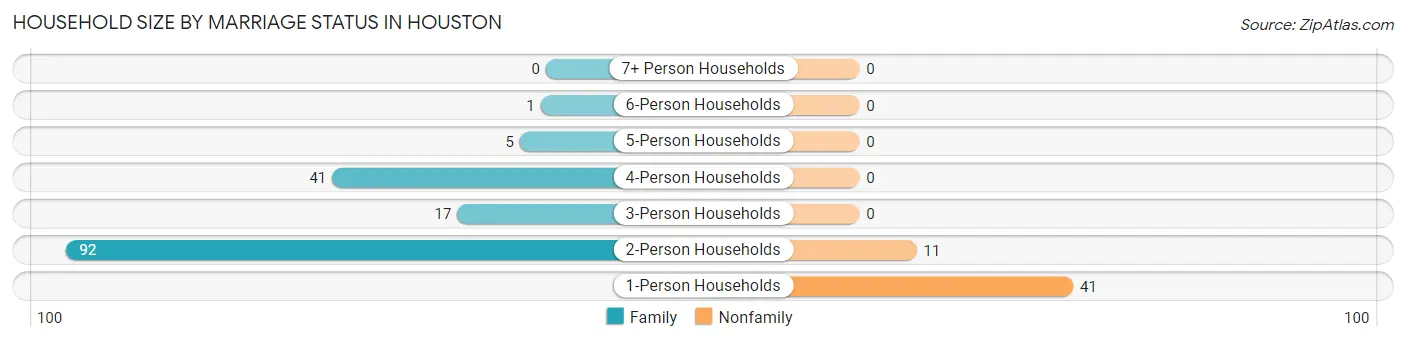
| Household Size | Family Households | Nonfamily Households |
| 1-Person Households | - | 41 (19.7%) |
| 2-Person Households | 92 (44.2%) | 11 (5.3%) |
| 3-Person Households | 17 (8.2%) | 0 (0.0%) |
| 4-Person Households | 41 (19.7%) | 0 (0.0%) |
| 5-Person Households | 5 (2.4%) | 0 (0.0%) |
| 6-Person Households | 1 (0.5%) | 0 (0.0%) |
| 7+ Person Households | 0 (0.0%) | 0 (0.0%) |
| Total | 156 (75.0%) | 52 (25.0%) |
Female Fertility in Houston
Fertility by Age in Houston
Average fertility rate in Houston is 20.0 births per 1,000 women. Women in the age bracket of 20 to 34 years have the highest fertility rate with 56.0 births per 1,000 women. Women in the age bracket of 20 to 34 years acount for 100.0% of all women with births.
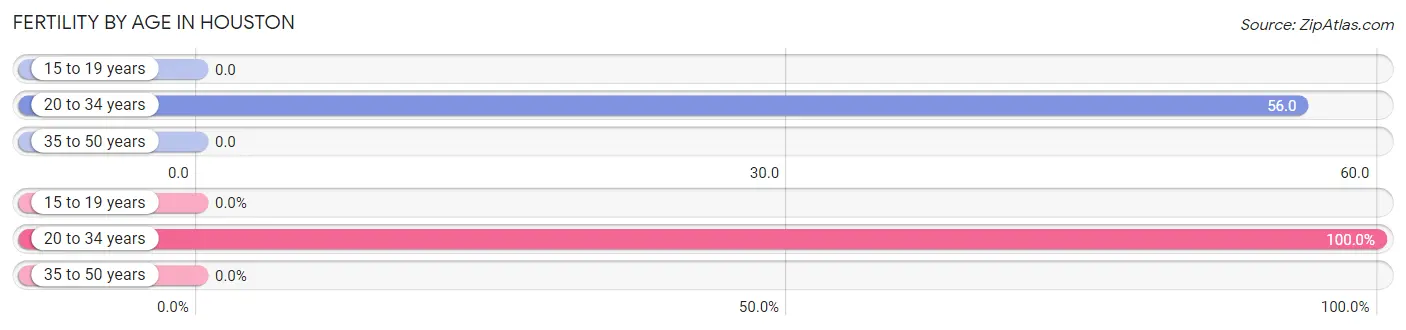
| Age Bracket | Women with Births | Births / 1,000 Women |
| 15 to 19 years | 0 (0.0%) | 0.0 |
| 20 to 34 years | 2 (100.0%) | 56.0 |
| 35 to 50 years | 0 (0.0%) | 0.0 |
| Total | 2 (100.0%) | 20.0 |
Fertility by Age by Marriage Status in Houston
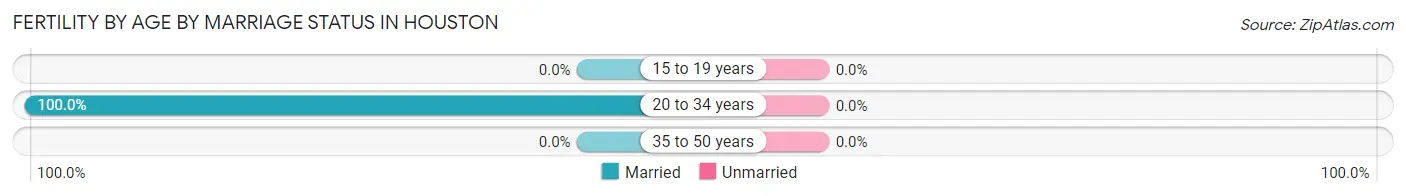
| Age Bracket | Married | Unmarried |
| 15 to 19 years | 0 (0.0%) | 0 (0.0%) |
| 20 to 34 years | 2 (100.0%) | 0 (0.0%) |
| 35 to 50 years | 0 (0.0%) | 0 (0.0%) |
| Total | 2 (100.0%) | 0 (0.0%) |
Fertility by Education in Houston
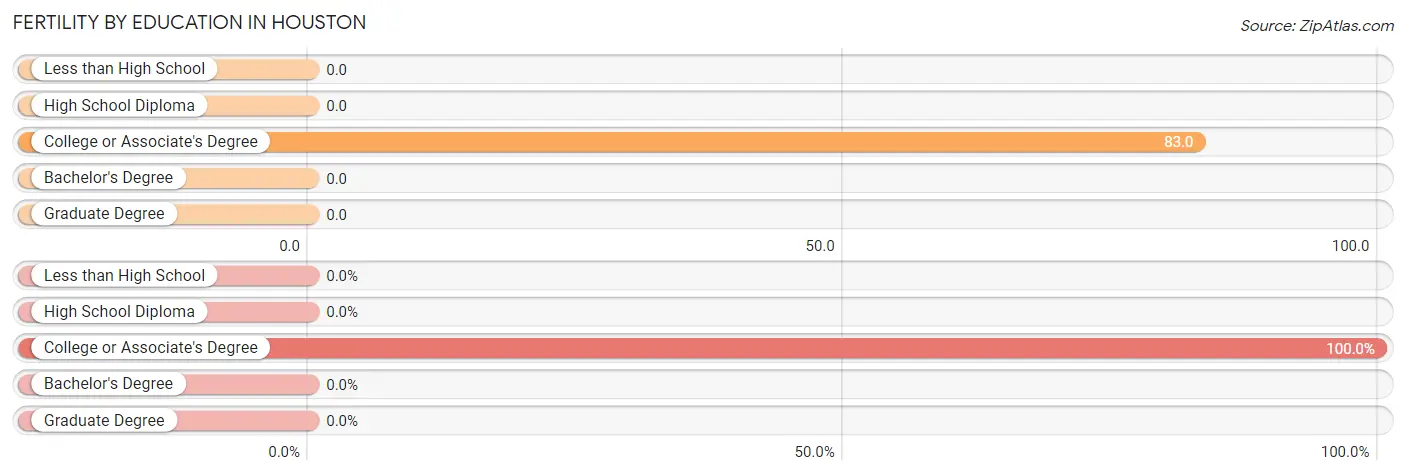
| Educational Attainment | Women with Births | Births / 1,000 Women |
| Less than High School | 0 (0.0%) | 0.0 |
| High School Diploma | 0 (0.0%) | 0.0 |
| College or Associate's Degree | 2 (100.0%) | 83.0 |
| Bachelor's Degree | 0 (0.0%) | 0.0 |
| Graduate Degree | 0 (0.0%) | 0.0 |
| Total | 2 (100.0%) | 20.0 |
Fertility by Education by Marriage Status in Houston
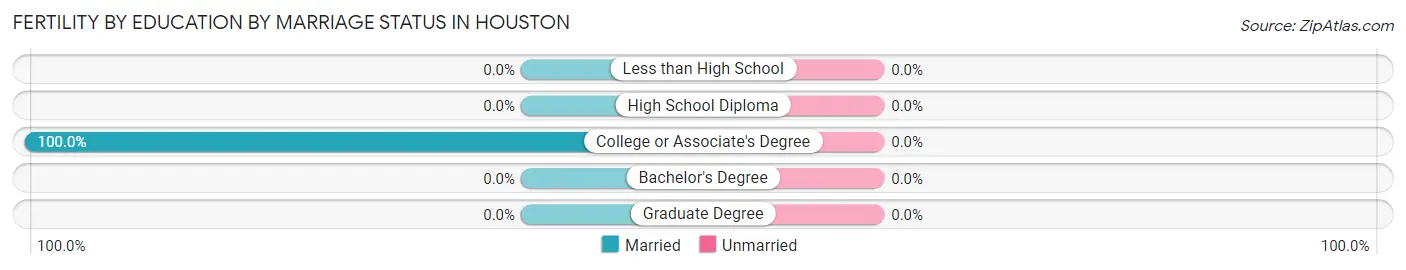
| Educational Attainment | Married | Unmarried |
| Less than High School | 0 (0.0%) | 0 (0.0%) |
| High School Diploma | 0 (0.0%) | 0 (0.0%) |
| College or Associate's Degree | 2 (100.0%) | 0 (0.0%) |
| Bachelor's Degree | 0 (0.0%) | 0 (0.0%) |
| Graduate Degree | 0 (0.0%) | 0 (0.0%) |
| Total | 2 (100.0%) | 0 (0.0%) |
Income in Houston
Income Overview in Houston
Per Capita Income in Houston is $45,092, while median incomes of families and households are $97,500 and $92,500 respectively.
| Characteristic | Number | Measure |
| Per Capita Income | 426 | $45,092 |
| Median Family Income | 156 | $97,500 |
| Mean Family Income | 156 | $121,369 |
| Median Household Income | 208 | $92,500 |
| Mean Household Income | 208 | $107,845 |
| Income Deficit | 156 | $0 |
| Wage / Income Gap (%) | 426 | 60.24% |
| Wage / Income Gap ($) | 426 | 39.76¢ per $1 |
| Gini / Inequality Index | 426 | 0.39 |
Earnings by Sex in Houston
Average Earnings in Houston are $45,588, $64,844 for men and $25,781 for women, a difference of 60.2%.
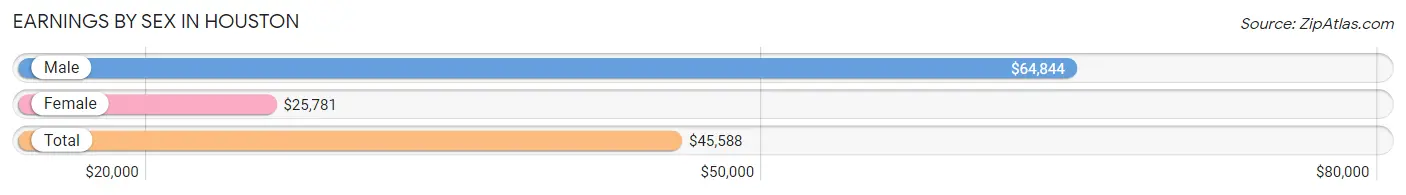
| Sex | Number | Average Earnings |
| Male | 163 (61.3%) | $64,844 |
| Female | 103 (38.7%) | $25,781 |
| Total | 266 (100.0%) | $45,588 |
Earnings by Sex by Income Bracket in Houston
The most common earnings brackets in Houston are $100,000+ for men (60 | 36.8%) and $15,000 to $17,499 for women (14 | 13.6%).
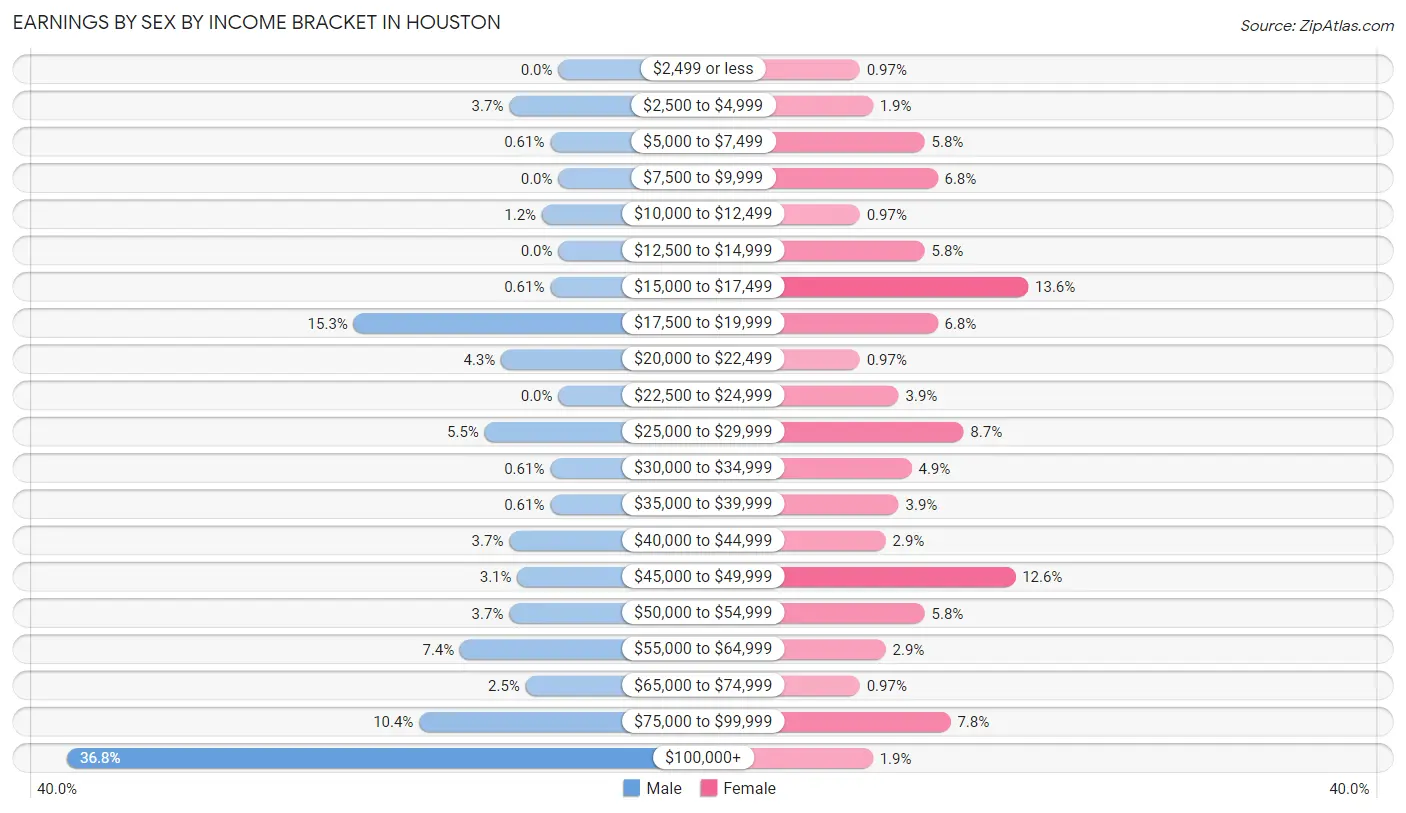
| Income | Male | Female |
| $2,499 or less | 0 (0.0%) | 1 (1.0%) |
| $2,500 to $4,999 | 6 (3.7%) | 2 (1.9%) |
| $5,000 to $7,499 | 1 (0.6%) | 6 (5.8%) |
| $7,500 to $9,999 | 0 (0.0%) | 7 (6.8%) |
| $10,000 to $12,499 | 2 (1.2%) | 1 (1.0%) |
| $12,500 to $14,999 | 0 (0.0%) | 6 (5.8%) |
| $15,000 to $17,499 | 1 (0.6%) | 14 (13.6%) |
| $17,500 to $19,999 | 25 (15.3%) | 7 (6.8%) |
| $20,000 to $22,499 | 7 (4.3%) | 1 (1.0%) |
| $22,500 to $24,999 | 0 (0.0%) | 4 (3.9%) |
| $25,000 to $29,999 | 9 (5.5%) | 9 (8.7%) |
| $30,000 to $34,999 | 1 (0.6%) | 5 (4.9%) |
| $35,000 to $39,999 | 1 (0.6%) | 4 (3.9%) |
| $40,000 to $44,999 | 6 (3.7%) | 3 (2.9%) |
| $45,000 to $49,999 | 5 (3.1%) | 13 (12.6%) |
| $50,000 to $54,999 | 6 (3.7%) | 6 (5.8%) |
| $55,000 to $64,999 | 12 (7.4%) | 3 (2.9%) |
| $65,000 to $74,999 | 4 (2.5%) | 1 (1.0%) |
| $75,000 to $99,999 | 17 (10.4%) | 8 (7.8%) |
| $100,000+ | 60 (36.8%) | 2 (1.9%) |
| Total | 163 (100.0%) | 103 (100.0%) |
Earnings by Sex by Educational Attainment in Houston
Average earnings in Houston are $65,938 for men and $33,125 for women, a difference of 49.8%. Men with an educational attainment of college or associate's degree enjoy the highest average annual earnings of $110,611, while those with college or associate's degree education earn the least with $110,611. Women with an educational attainment of bachelor's degree earn the most with the average annual earnings of $63,750, while those with less than high school education have the smallest earnings of $26,875.
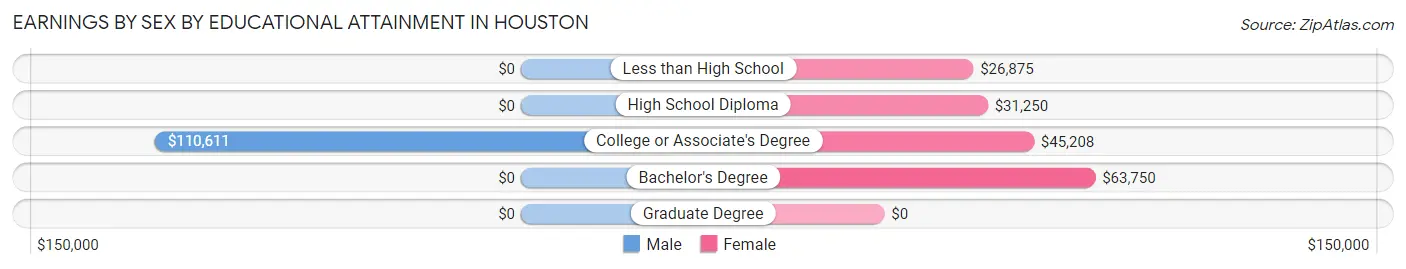
| Educational Attainment | Male Income | Female Income |
| Less than High School | - | - |
| High School Diploma | - | - |
| College or Associate's Degree | $110,611 | $45,208 |
| Bachelor's Degree | - | - |
| Graduate Degree | - | - |
| Total | $65,938 | $33,125 |
Family Income in Houston
Family Income Brackets in Houston
According to the Houston family income data, there are 49 families falling into the $200,000+ income range, which is the most common income bracket and makes up 31.4% of all families.
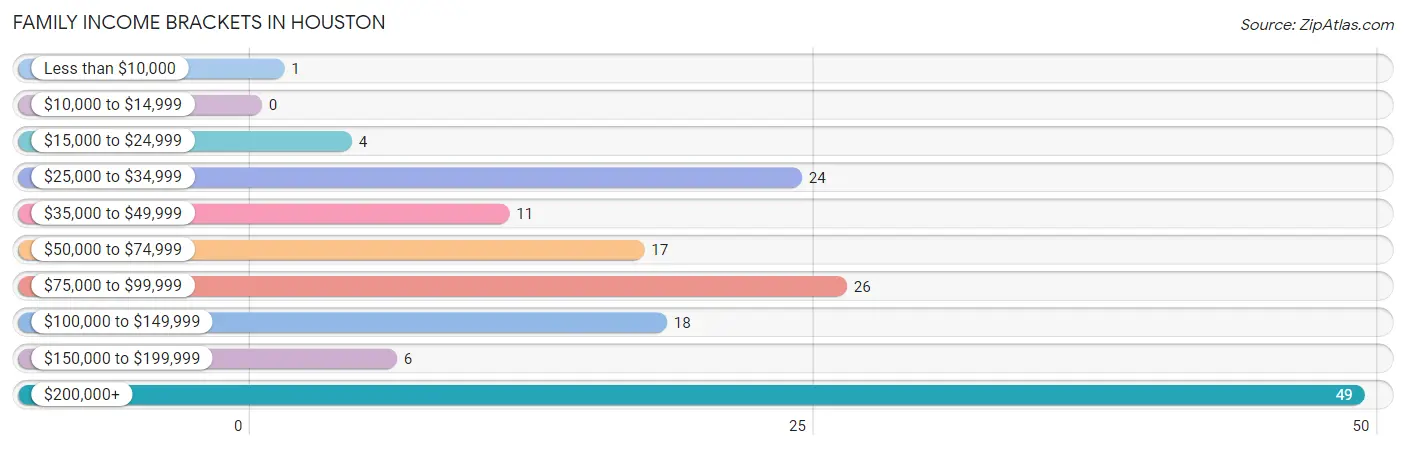
| Income Bracket | # Families | % Families |
| Less than $10,000 | 1 | 0.6% |
| $10,000 to $14,999 | 0 | 0.0% |
| $15,000 to $24,999 | 4 | 2.6% |
| $25,000 to $34,999 | 24 | 15.4% |
| $35,000 to $49,999 | 11 | 7.1% |
| $50,000 to $74,999 | 17 | 10.9% |
| $75,000 to $99,999 | 26 | 16.7% |
| $100,000 to $149,999 | 18 | 11.5% |
| $150,000 to $199,999 | 6 | 3.8% |
| $200,000+ | 49 | 31.4% |
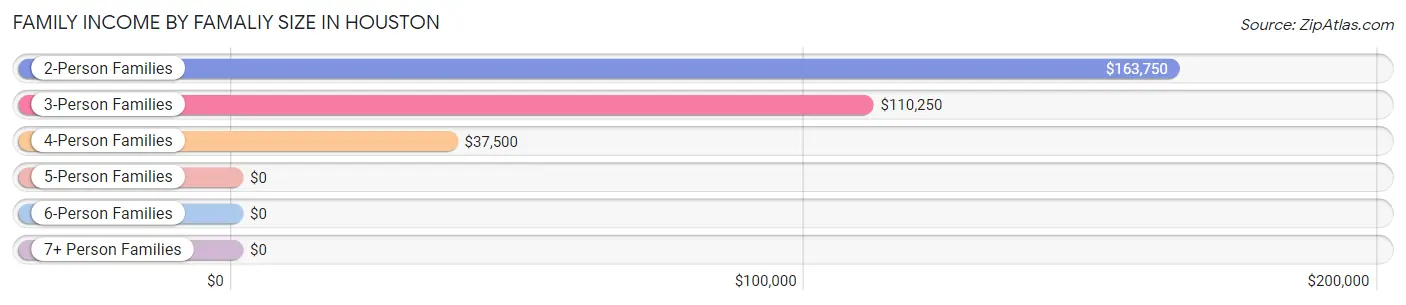
Family Income by Famaliy Size in Houston
2-person families (98 | 62.8%) account for the highest median family income in Houston with $163,750 per family, while 2-person families (98 | 62.8%) have the highest median income of $81,875 per family member.
| Income Bracket | # Families | Median Income |
| 2-Person Families | 98 (62.8%) | $163,750 |
| 3-Person Families | 17 (10.9%) | $110,250 |
| 4-Person Families | 40 (25.6%) | $37,500 |
| 5-Person Families | 0 (0.0%) | $0 |
| 6-Person Families | 1 (0.6%) | $0 |
| 7+ Person Families | 0 (0.0%) | $0 |
| Total | 156 (100.0%) | $97,500 |
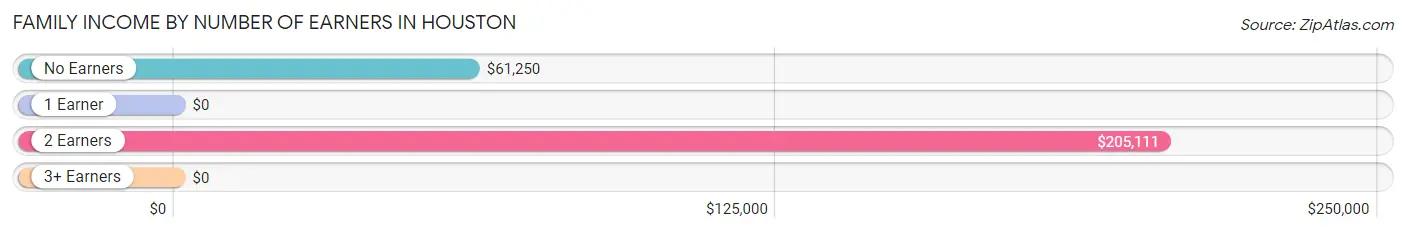
Family Income by Number of Earners in Houston
| Number of Earners | # Families | Median Income |
| No Earners | 11 (7.0%) | $61,250 |
| 1 Earner | 51 (32.7%) | $0 |
| 2 Earners | 86 (55.1%) | $205,111 |
| 3+ Earners | 8 (5.1%) | $0 |
| Total | 156 (100.0%) | $97,500 |
Household Income in Houston
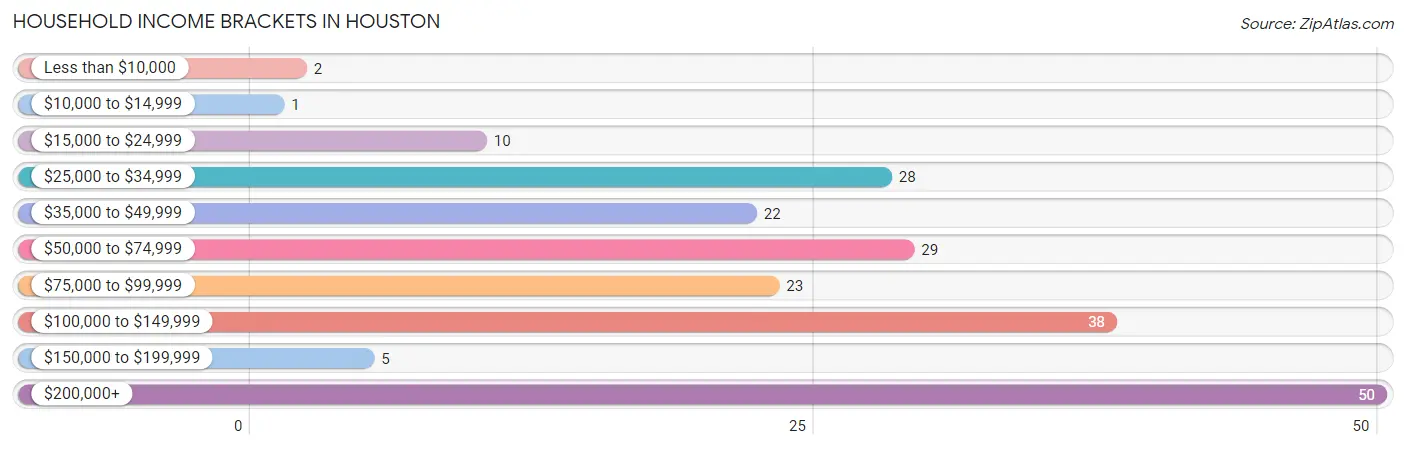
Household Income Brackets in Houston
With 50 households falling in the category, the $200,000+ income range is the most frequent in Houston, accounting for 24.0% of all households. In contrast, only 1 households (0.5%) fall into the $10,000 to $14,999 income bracket, making it the least populous group.
| Income Bracket | # Households | % Households |
| Less than $10,000 | 2 | 1.0% |
| $10,000 to $14,999 | 1 | 0.5% |
| $15,000 to $24,999 | 10 | 4.8% |
| $25,000 to $34,999 | 28 | 13.5% |
| $35,000 to $49,999 | 22 | 10.6% |
| $50,000 to $74,999 | 29 | 13.9% |
| $75,000 to $99,999 | 23 | 11.1% |
| $100,000 to $149,999 | 38 | 18.3% |
| $150,000 to $199,999 | 5 | 2.4% |
| $200,000+ | 50 | 24.0% |
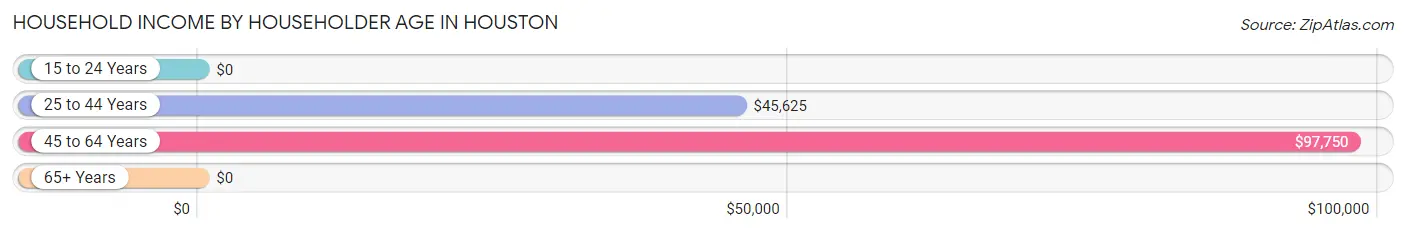
Household Income by Householder Age in Houston
The median household income in Houston is $92,500, with the highest median household income of $97,750 found in the 45 to 64 years age bracket for the primary householder. A total of 57 households (27.4%) fall into this category. Meanwhile, the 15 to 24 years age bracket for the primary householder has the lowest median household income of $0, with 8 households (3.8%) in this group.
| Income Bracket | # Households | Median Income |
| 15 to 24 Years | 8 (3.8%) | $0 |
| 25 to 44 Years | 46 (22.1%) | $45,625 |
| 45 to 64 Years | 57 (27.4%) | $97,750 |
| 65+ Years | 97 (46.6%) | $0 |
| Total | 208 (100.0%) | $92,500 |
Poverty in Houston
Income Below Poverty by Sex and Age in Houston
With 11.2% poverty level for males and 15.5% for females among the residents of Houston, 35 to 44 year old males and 16 and 17 year old females are the most vulnerable to poverty, with 20 males (64.5%) and 14 females (70.0%) in their respective age groups living below the poverty level.
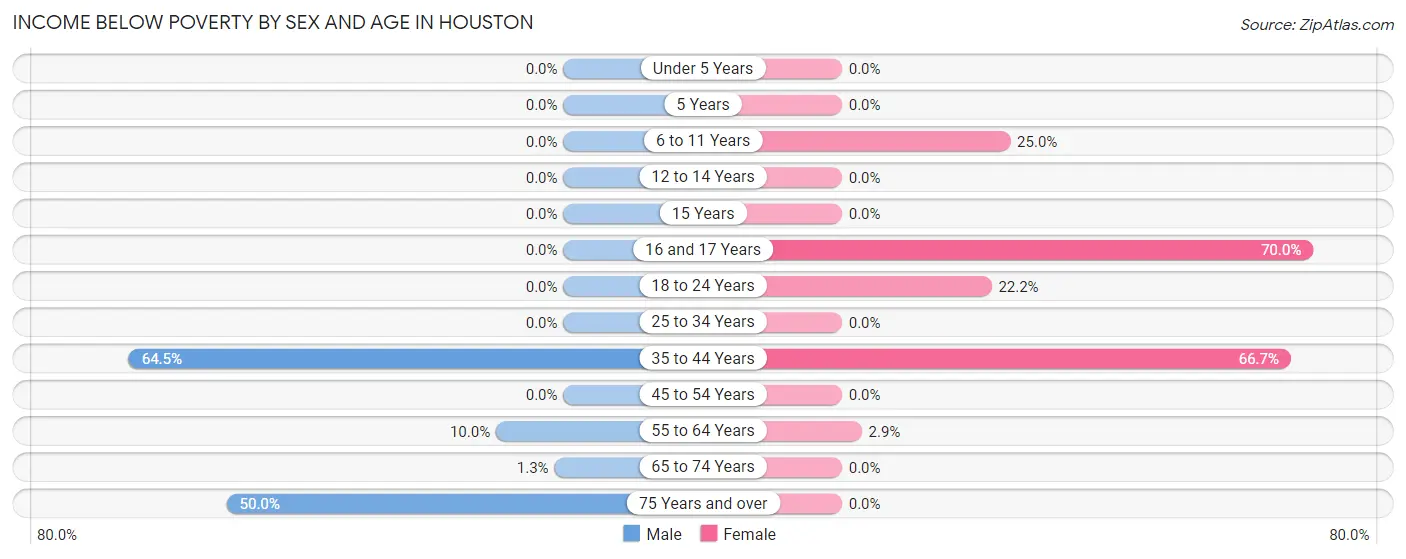
| Age Bracket | Male | Female |
| Under 5 Years | 0 (0.0%) | 0 (0.0%) |
| 5 Years | 0 (0.0%) | 0 (0.0%) |
| 6 to 11 Years | 0 (0.0%) | 1 (25.0%) |
| 12 to 14 Years | 0 (0.0%) | 0 (0.0%) |
| 15 Years | 0 (0.0%) | 0 (0.0%) |
| 16 and 17 Years | 0 (0.0%) | 14 (70.0%) |
| 18 to 24 Years | 0 (0.0%) | 6 (22.2%) |
| 25 to 34 Years | 0 (0.0%) | 0 (0.0%) |
| 35 to 44 Years | 20 (64.5%) | 8 (66.7%) |
| 45 to 54 Years | 0 (0.0%) | 0 (0.0%) |
| 55 to 64 Years | 2 (10.0%) | 1 (2.9%) |
| 65 to 74 Years | 1 (1.3%) | 0 (0.0%) |
| 75 Years and over | 2 (50.0%) | 0 (0.0%) |
| Total | 25 (11.2%) | 30 (15.5%) |
Income Above Poverty by Sex and Age in Houston
According to the poverty statistics in Houston, males aged under 5 years and females aged 12 to 14 years are the age groups that are most secure financially, with 100.0% of males and 100.0% of females in these age groups living above the poverty line.
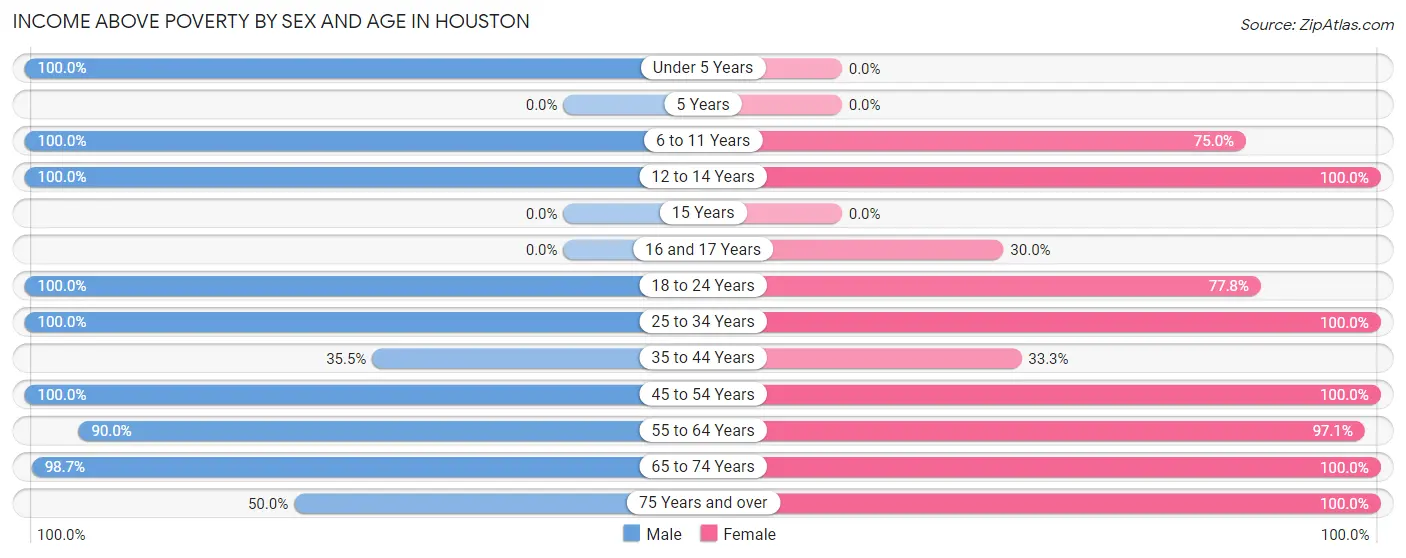
| Age Bracket | Male | Female |
| Under 5 Years | 9 (100.0%) | 0 (0.0%) |
| 5 Years | 0 (0.0%) | 0 (0.0%) |
| 6 to 11 Years | 10 (100.0%) | 3 (75.0%) |
| 12 to 14 Years | 3 (100.0%) | 3 (100.0%) |
| 15 Years | 0 (0.0%) | 0 (0.0%) |
| 16 and 17 Years | 0 (0.0%) | 6 (30.0%) |
| 18 to 24 Years | 12 (100.0%) | 21 (77.8%) |
| 25 to 34 Years | 31 (100.0%) | 15 (100.0%) |
| 35 to 44 Years | 11 (35.5%) | 4 (33.3%) |
| 45 to 54 Years | 28 (100.0%) | 34 (100.0%) |
| 55 to 64 Years | 18 (90.0%) | 33 (97.1%) |
| 65 to 74 Years | 75 (98.7%) | 27 (100.0%) |
| 75 Years and over | 2 (50.0%) | 17 (100.0%) |
| Total | 199 (88.8%) | 163 (84.5%) |
Income Below Poverty Among Married-Couple Families in Houston
The poverty statistics for married-couple families in Houston show that 14.7% or 20 of the total 136 families live below the poverty line. Families with 1 or 2 children have the highest poverty rate of 58.8%, comprising of 20 families. On the other hand, families with no children have the lowest poverty rate of 0.0%, which includes 0 families.
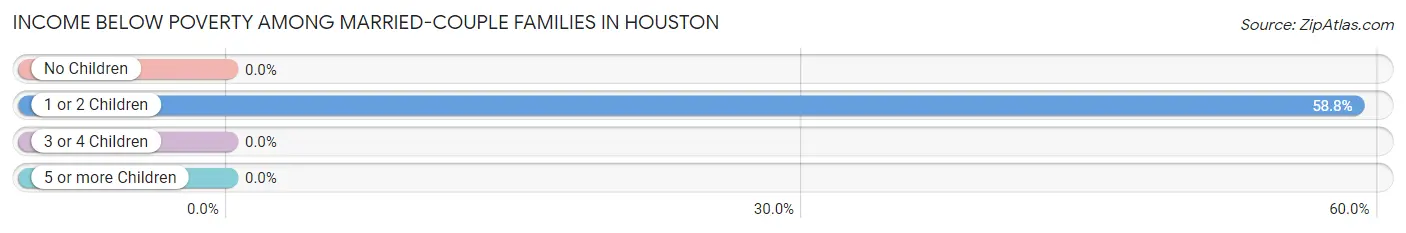
| Children | Above Poverty | Below Poverty |
| No Children | 101 (100.0%) | 0 (0.0%) |
| 1 or 2 Children | 14 (41.2%) | 20 (58.8%) |
| 3 or 4 Children | 1 (100.0%) | 0 (0.0%) |
| 5 or more Children | 0 (0.0%) | 0 (0.0%) |
| Total | 116 (85.3%) | 20 (14.7%) |
Income Below Poverty Among Single-Parent Households in Houston
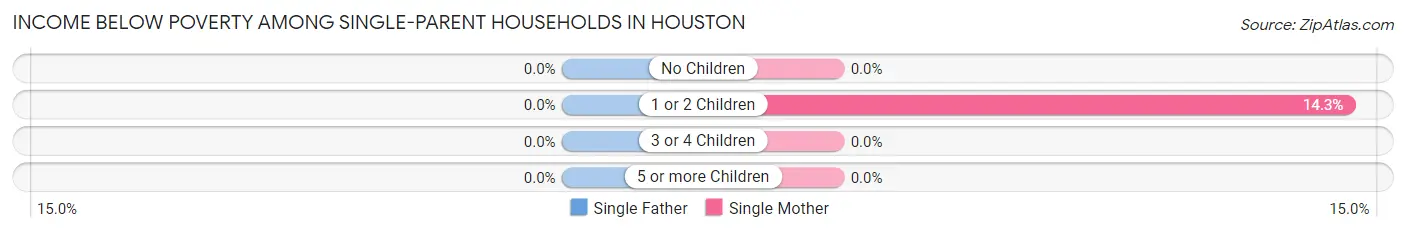
| Children | Single Father | Single Mother |
| No Children | 0 (0.0%) | 0 (0.0%) |
| 1 or 2 Children | 0 (0.0%) | 1 (14.3%) |
| 3 or 4 Children | 0 (0.0%) | 0 (0.0%) |
| 5 or more Children | 0 (0.0%) | 0 (0.0%) |
| Total | 0 (0.0%) | 1 (5.6%) |
Income Below Poverty Among Married-Couple vs Single-Parent Households in Houston
The poverty data for Houston shows that 20 of the married-couple family households (14.7%) and 1 of the single-parent households (5.0%) are living below the poverty level. Within the married-couple family households, those with 1 or 2 children have the highest poverty rate, with 20 households (58.8%) falling below the poverty line. Among the single-parent households, those with 1 or 2 children have the highest poverty rate, with 1 household (11.1%) living below poverty.
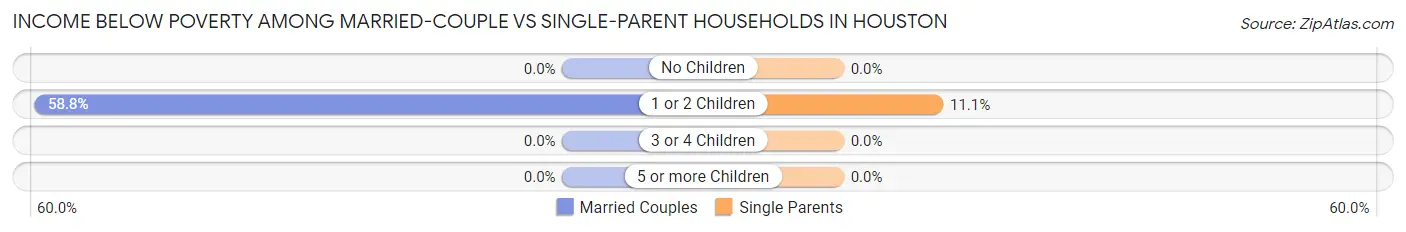
| Children | Married-Couple Families | Single-Parent Households |
| No Children | 0 (0.0%) | 0 (0.0%) |
| 1 or 2 Children | 20 (58.8%) | 1 (11.1%) |
| 3 or 4 Children | 0 (0.0%) | 0 (0.0%) |
| 5 or more Children | 0 (0.0%) | 0 (0.0%) |
| Total | 20 (14.7%) | 1 (5.0%) |
Employment Characteristics in Houston
Employment by Class of Employer in Houston
Among the 250 employed individuals in Houston, private company employees (129 | 51.6%), self-employed (incorporated) (57 | 22.8%), and not-for-profit organizations (25 | 10.0%) make up the most common classes of employment.
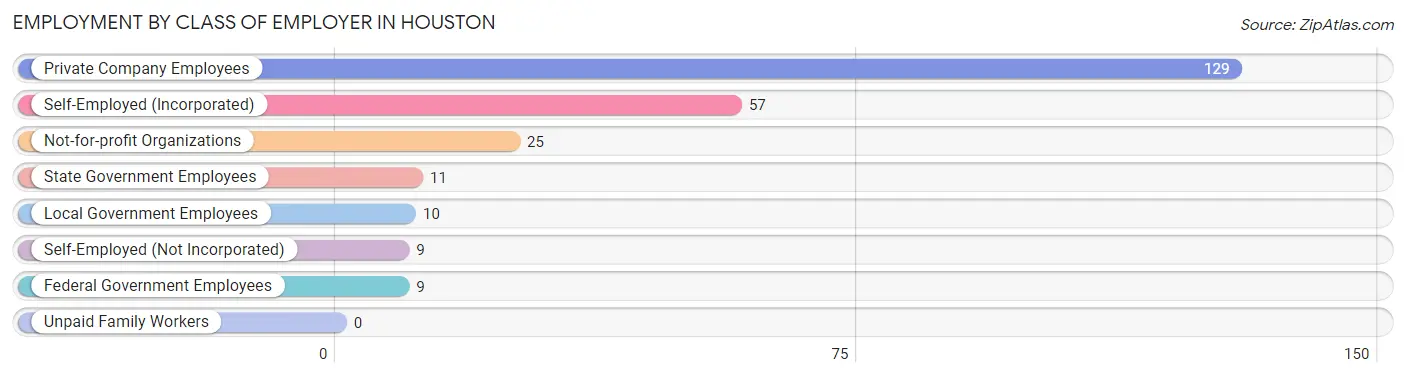
| Employer Class | # Employees | % Employees |
| Private Company Employees | 129 | 51.6% |
| Self-Employed (Incorporated) | 57 | 22.8% |
| Self-Employed (Not Incorporated) | 9 | 3.6% |
| Not-for-profit Organizations | 25 | 10.0% |
| Local Government Employees | 10 | 4.0% |
| State Government Employees | 11 | 4.4% |
| Federal Government Employees | 9 | 3.6% |
| Unpaid Family Workers | 0 | 0.0% |
| Total | 250 | 100.0% |
Employment Status by Age in Houston
According to the labor force statistics for Houston, out of the total population over 16 years of age (388), 71.9% or 279 individuals are in the labor force, with 8.4% or 23 of them unemployed. The age group with the highest labor force participation rate is 20 to 24 years, with 100.0% or 33 individuals in the labor force. Within the labor force, the 20 to 24 years age range has the highest percentage of unemployed individuals, with 37.9% or 13 of them being unemployed.
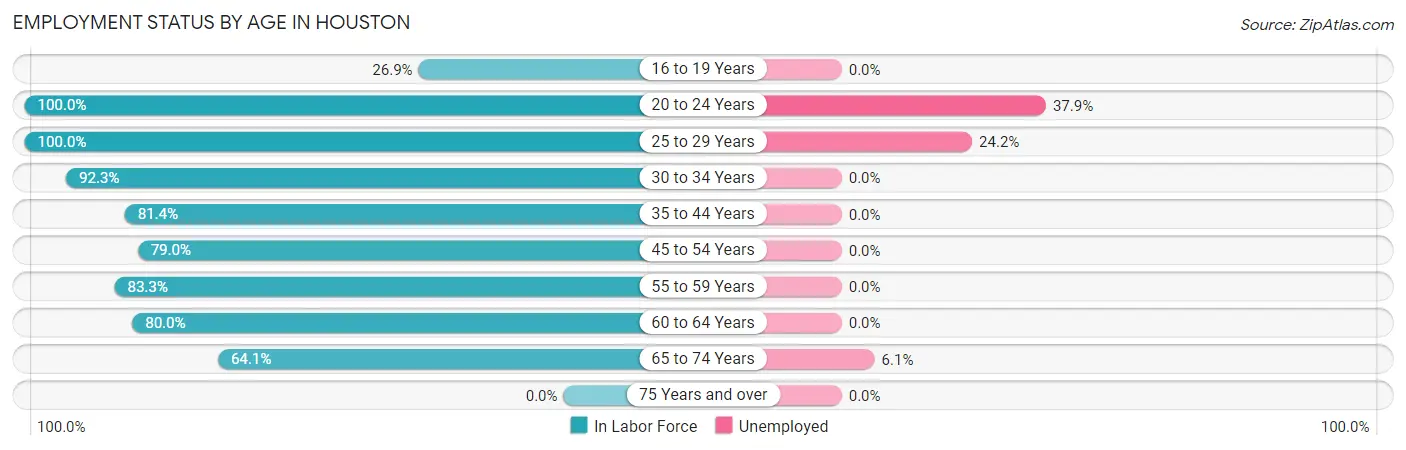
| Age Bracket | In Labor Force | Unemployed |
| 16 to 19 Years | 7 (26.9%) | 0 (0.0%) |
| 20 to 24 Years | 33 (100.0%) | 13 (37.9%) |
| 25 to 29 Years | 33 (100.0%) | 8 (24.2%) |
| 30 to 34 Years | 12 (92.3%) | 0 (0.0%) |
| 35 to 44 Years | 35 (81.4%) | 0 (0.0%) |
| 45 to 54 Years | 49 (79.0%) | 0 (0.0%) |
| 55 to 59 Years | 20 (83.3%) | 0 (0.0%) |
| 60 to 64 Years | 24 (80.0%) | 0 (0.0%) |
| 65 to 74 Years | 66 (64.1%) | 4 (6.1%) |
| 75 Years and over | 0 (0.0%) | 0 (0.0%) |
| Total | 279 (71.9%) | 23 (8.4%) |
Employment Status by Educational Attainment in Houston
According to labor force statistics for Houston, 84.4% of individuals (173) out of the total population between 25 and 64 years of age (205) are in the labor force, with 4.6% or 8 of them being unemployed. The group with the highest labor force participation rate are those with the educational attainment of bachelor's degree or higher, with 88.9% or 8 individuals in the labor force. Within the labor force, individuals with less than high school education have the highest percentage of unemployment, with 42.1% or 8 of them being unemployed.
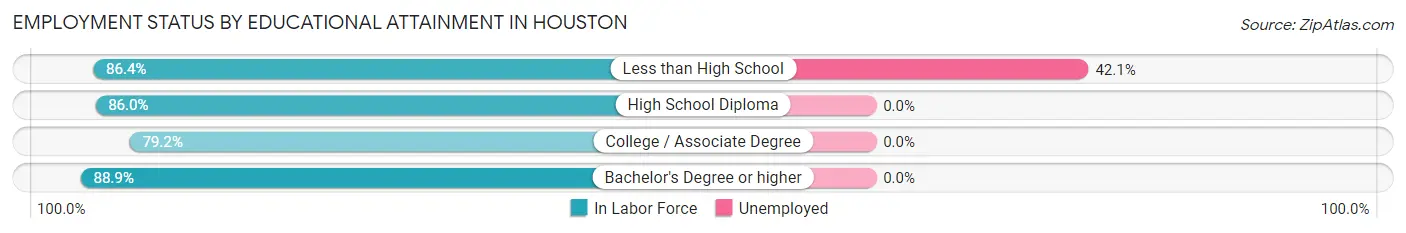
| Educational Attainment | In Labor Force | Unemployed |
| Less than High School | 19 (86.4%) | 9 (42.1%) |
| High School Diploma | 104 (86.0%) | 0 (0.0%) |
| College / Associate Degree | 42 (79.2%) | 0 (0.0%) |
| Bachelor's Degree or higher | 8 (88.9%) | 0 (0.0%) |
| Total | 173 (84.4%) | 9 (4.6%) |
Employment Occupations by Sex in Houston
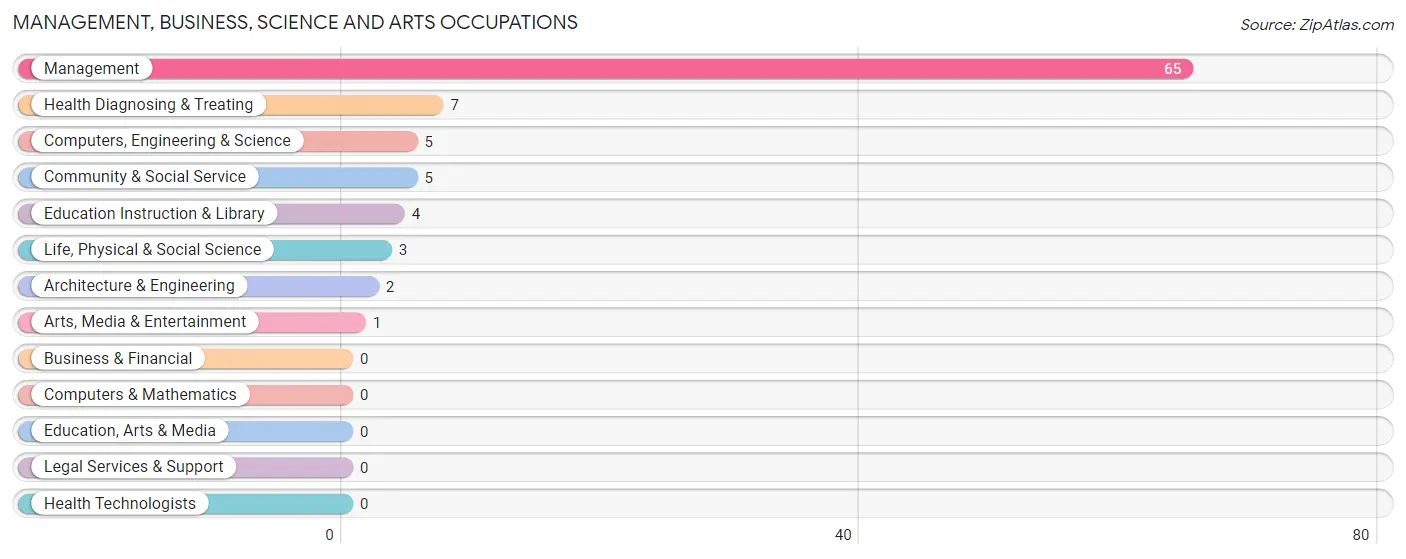
Management, Business, Science and Arts Occupations
The most common Management, Business, Science and Arts occupations in Houston are Management (65 | 25.8%), Health Diagnosing & Treating (7 | 2.8%), Computers, Engineering & Science (5 | 2.0%), Community & Social Service (5 | 2.0%), and Education Instruction & Library (4 | 1.6%).
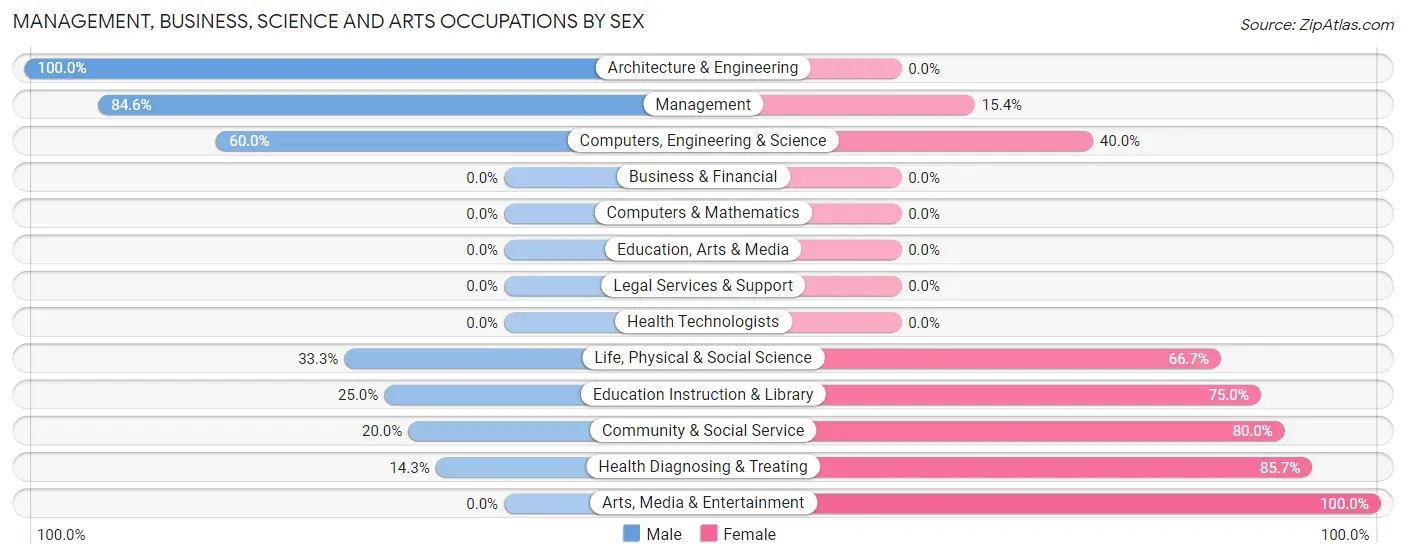
Management, Business, Science and Arts Occupations by Sex
Within the Management, Business, Science and Arts occupations in Houston, the most male-oriented occupations are Architecture & Engineering (100.0%), Management (84.6%), and Computers, Engineering & Science (60.0%), while the most female-oriented occupations are Arts, Media & Entertainment (100.0%), Health Diagnosing & Treating (85.7%), and Community & Social Service (80.0%).
| Occupation | Male | Female |
| Management | 55 (84.6%) | 10 (15.4%) |
| Business & Financial | 0 (0.0%) | 0 (0.0%) |
| Computers, Engineering & Science | 3 (60.0%) | 2 (40.0%) |
| Computers & Mathematics | 0 (0.0%) | 0 (0.0%) |
| Architecture & Engineering | 2 (100.0%) | 0 (0.0%) |
| Life, Physical & Social Science | 1 (33.3%) | 2 (66.7%) |
| Community & Social Service | 1 (20.0%) | 4 (80.0%) |
| Education, Arts & Media | 0 (0.0%) | 0 (0.0%) |
| Legal Services & Support | 0 (0.0%) | 0 (0.0%) |
| Education Instruction & Library | 1 (25.0%) | 3 (75.0%) |
| Arts, Media & Entertainment | 0 (0.0%) | 1 (100.0%) |
| Health Diagnosing & Treating | 1 (14.3%) | 6 (85.7%) |
| Health Technologists | 0 (0.0%) | 0 (0.0%) |
| Total (Category) | 60 (73.2%) | 22 (26.8%) |
| Total (Overall) | 155 (61.5%) | 97 (38.5%) |
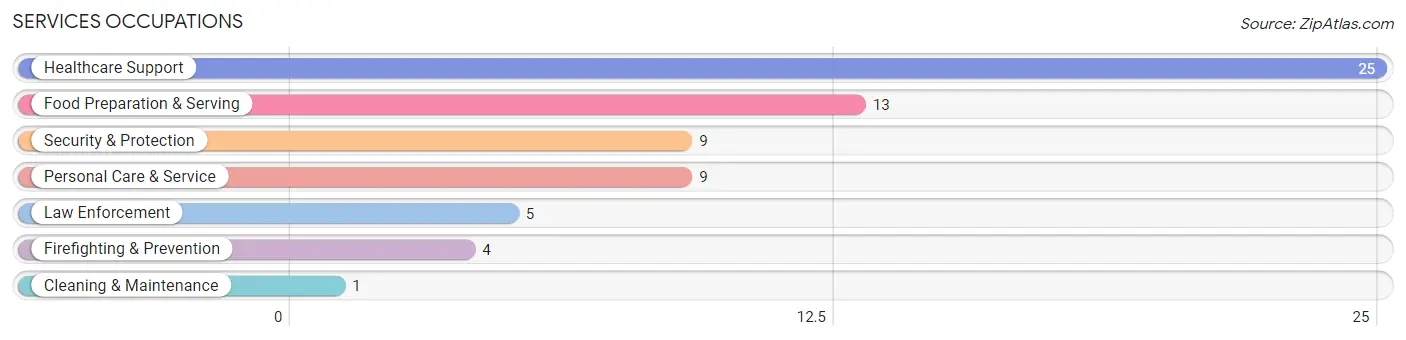
Services Occupations
The most common Services occupations in Houston are Healthcare Support (25 | 9.9%), Food Preparation & Serving (13 | 5.2%), Security & Protection (9 | 3.6%), Personal Care & Service (9 | 3.6%), and Law Enforcement (5 | 2.0%).
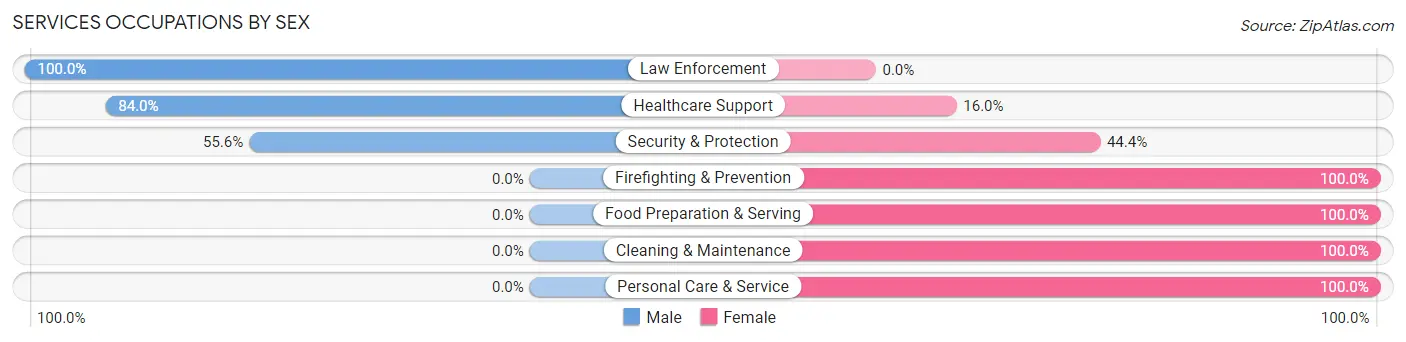
Services Occupations by Sex
Within the Services occupations in Houston, the most male-oriented occupations are Law Enforcement (100.0%), Healthcare Support (84.0%), and Security & Protection (55.6%), while the most female-oriented occupations are Firefighting & Prevention (100.0%), Food Preparation & Serving (100.0%), and Cleaning & Maintenance (100.0%).
| Occupation | Male | Female |
| Healthcare Support | 21 (84.0%) | 4 (16.0%) |
| Security & Protection | 5 (55.6%) | 4 (44.4%) |
| Firefighting & Prevention | 0 (0.0%) | 4 (100.0%) |
| Law Enforcement | 5 (100.0%) | 0 (0.0%) |
| Food Preparation & Serving | 0 (0.0%) | 13 (100.0%) |
| Cleaning & Maintenance | 0 (0.0%) | 1 (100.0%) |
| Personal Care & Service | 0 (0.0%) | 9 (100.0%) |
| Total (Category) | 26 (45.6%) | 31 (54.4%) |
| Total (Overall) | 155 (61.5%) | 97 (38.5%) |
Sales and Office Occupations
The most common Sales and Office occupations in Houston are Sales & Related (28 | 11.1%), and Office & Administration (11 | 4.4%).
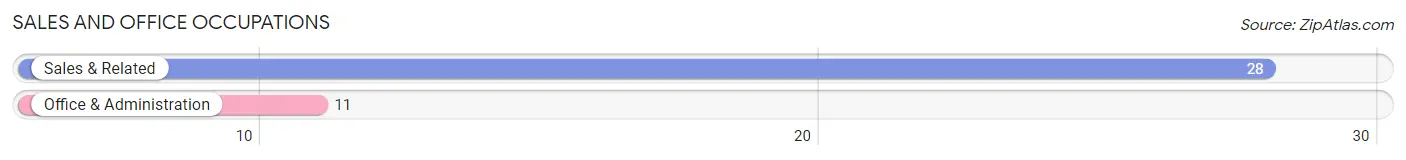
Sales and Office Occupations by Sex

| Occupation | Male | Female |
| Sales & Related | 12 (42.9%) | 16 (57.1%) |
| Office & Administration | 0 (0.0%) | 11 (100.0%) |
| Total (Category) | 12 (30.8%) | 27 (69.2%) |
| Total (Overall) | 155 (61.5%) | 97 (38.5%) |
Natural Resources, Construction and Maintenance Occupations
The most common Natural Resources, Construction and Maintenance occupations in Houston are Construction & Extraction (27 | 10.7%), Farming, Fishing & Forestry (12 | 4.8%), and Installation, Maintenance & Repair (12 | 4.8%).
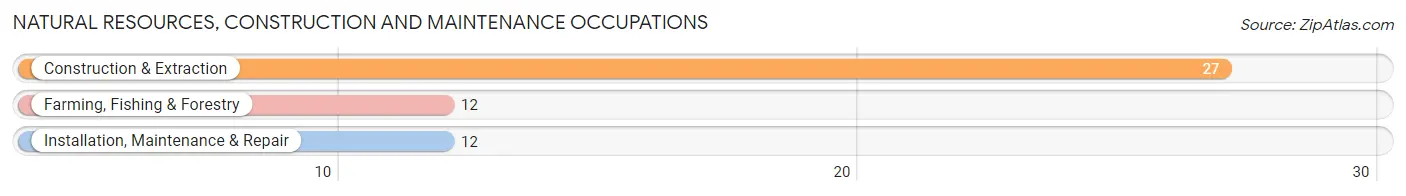
Natural Resources, Construction and Maintenance Occupations by Sex
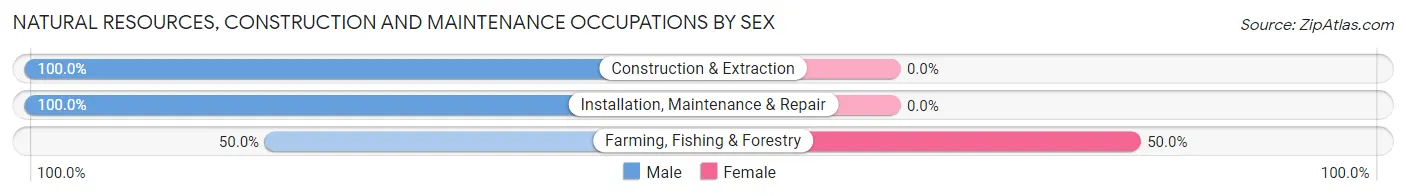
| Occupation | Male | Female |
| Farming, Fishing & Forestry | 6 (50.0%) | 6 (50.0%) |
| Construction & Extraction | 27 (100.0%) | 0 (0.0%) |
| Installation, Maintenance & Repair | 12 (100.0%) | 0 (0.0%) |
| Total (Category) | 45 (88.2%) | 6 (11.8%) |
| Total (Overall) | 155 (61.5%) | 97 (38.5%) |
Production, Transportation and Moving Occupations
The most common Production, Transportation and Moving occupations in Houston are Transportation (12 | 4.8%), Material Moving (9 | 3.6%), and Production (2 | 0.8%).
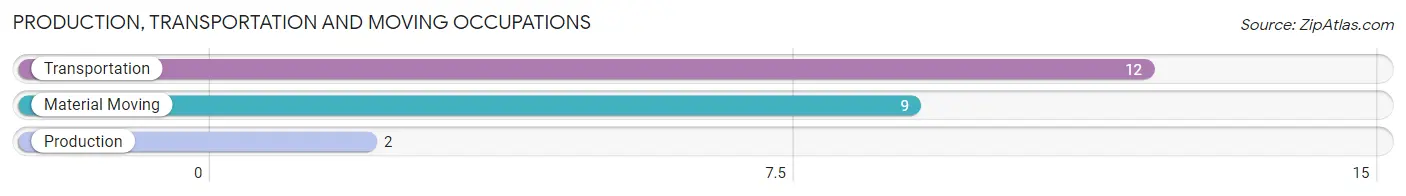
Production, Transportation and Moving Occupations by Sex
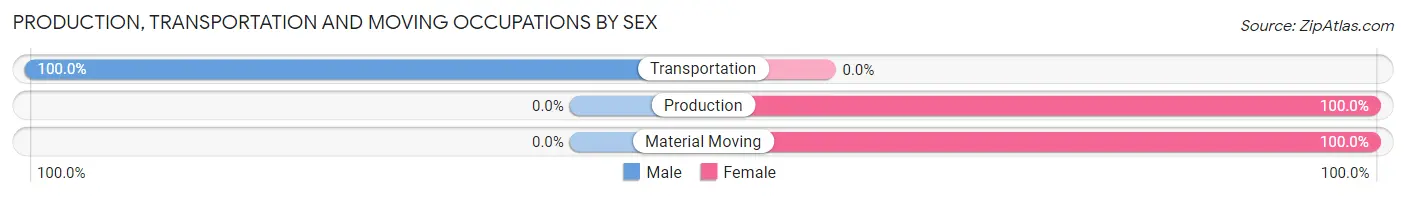
| Occupation | Male | Female |
| Production | 0 (0.0%) | 2 (100.0%) |
| Transportation | 12 (100.0%) | 0 (0.0%) |
| Material Moving | 0 (0.0%) | 9 (100.0%) |
| Total (Category) | 12 (52.2%) | 11 (47.8%) |
| Total (Overall) | 155 (61.5%) | 97 (38.5%) |
Employment Industries by Sex in Houston
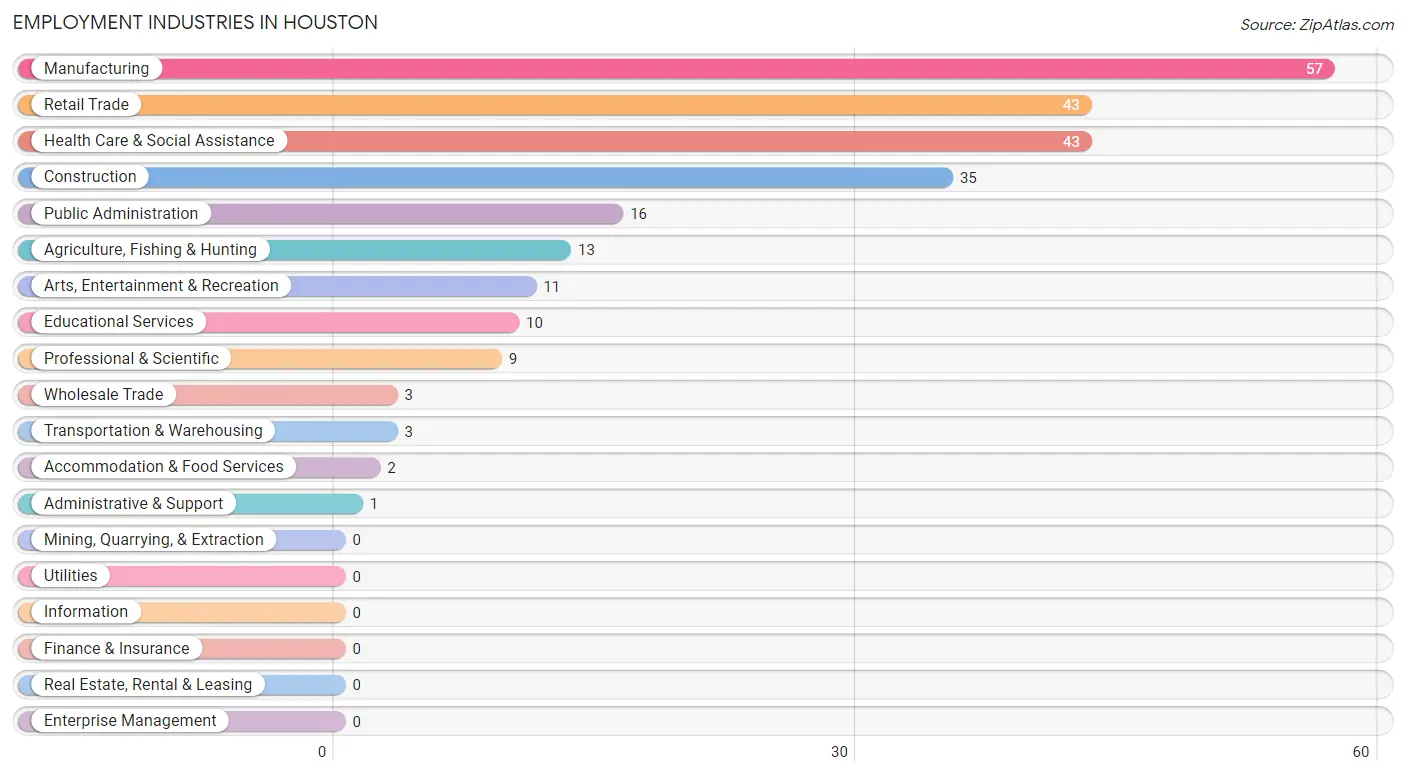
Employment Industries in Houston
The major employment industries in Houston include Manufacturing (57 | 22.6%), Retail Trade (43 | 17.1%), Health Care & Social Assistance (43 | 17.1%), Construction (35 | 13.9%), and Public Administration (16 | 6.4%).
Employment Industries by Sex in Houston
The Houston industries that see more men than women are Construction (100.0%), Wholesale Trade (100.0%), and Transportation & Warehousing (100.0%), whereas the industries that tend to have a higher number of women are Administrative & Support (100.0%), Accommodation & Food Services (100.0%), and Educational Services (90.0%).
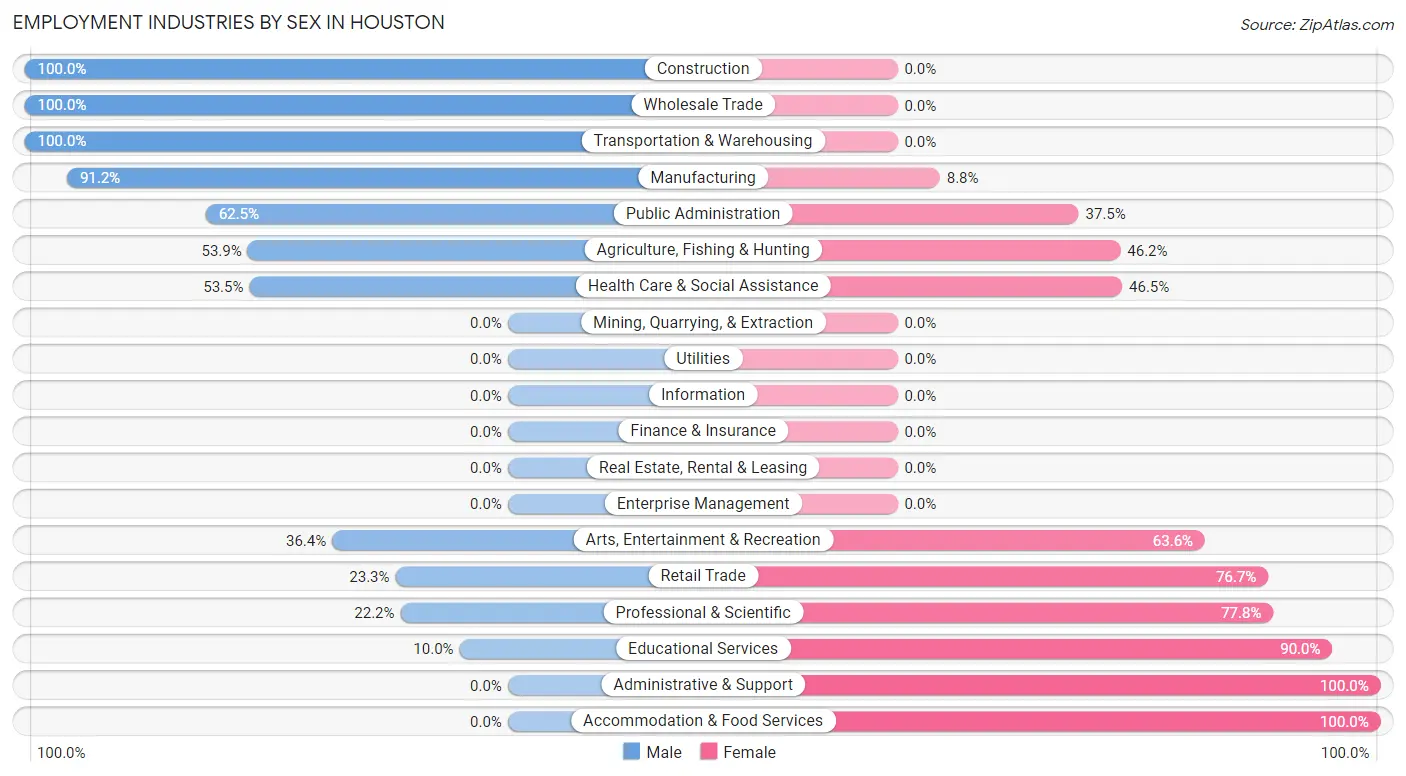
| Industry | Male | Female |
| Agriculture, Fishing & Hunting | 7 (53.8%) | 6 (46.2%) |
| Mining, Quarrying, & Extraction | 0 (0.0%) | 0 (0.0%) |
| Construction | 35 (100.0%) | 0 (0.0%) |
| Manufacturing | 52 (91.2%) | 5 (8.8%) |
| Wholesale Trade | 3 (100.0%) | 0 (0.0%) |
| Retail Trade | 10 (23.3%) | 33 (76.7%) |
| Transportation & Warehousing | 3 (100.0%) | 0 (0.0%) |
| Utilities | 0 (0.0%) | 0 (0.0%) |
| Information | 0 (0.0%) | 0 (0.0%) |
| Finance & Insurance | 0 (0.0%) | 0 (0.0%) |
| Real Estate, Rental & Leasing | 0 (0.0%) | 0 (0.0%) |
| Professional & Scientific | 2 (22.2%) | 7 (77.8%) |
| Enterprise Management | 0 (0.0%) | 0 (0.0%) |
| Administrative & Support | 0 (0.0%) | 1 (100.0%) |
| Educational Services | 1 (10.0%) | 9 (90.0%) |
| Health Care & Social Assistance | 23 (53.5%) | 20 (46.5%) |
| Arts, Entertainment & Recreation | 4 (36.4%) | 7 (63.6%) |
| Accommodation & Food Services | 0 (0.0%) | 2 (100.0%) |
| Public Administration | 10 (62.5%) | 6 (37.5%) |
| Total | 155 (61.5%) | 97 (38.5%) |
Education in Houston
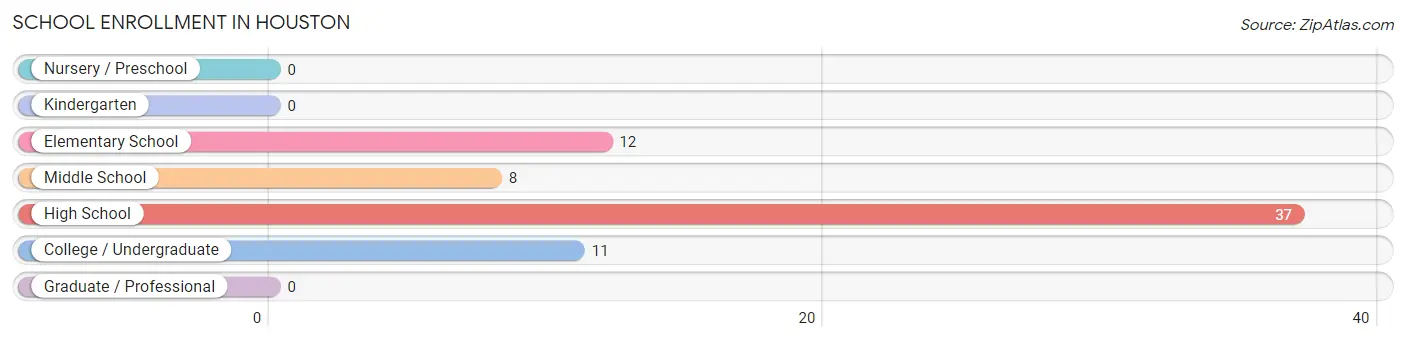
School Enrollment in Houston
The most common levels of schooling among the 68 students in Houston are high school (37 | 54.4%), elementary school (12 | 17.6%), and college / undergraduate (11 | 16.2%).
| School Level | # Students | % Students |
| Nursery / Preschool | 0 | 0.0% |
| Kindergarten | 0 | 0.0% |
| Elementary School | 12 | 17.6% |
| Middle School | 8 | 11.8% |
| High School | 37 | 54.4% |
| College / Undergraduate | 11 | 16.2% |
| Graduate / Professional | 0 | 0.0% |
| Total | 68 | 100.0% |
School Enrollment by Age by Funding Source in Houston
Out of a total of 68 students who are enrolled in schools in Houston, 6 (8.8%) attend a private institution, while the remaining 62 (91.2%) are enrolled in public schools. The age group of 35 years and over has the highest likelihood of being enrolled in private schools, with 5 (100.0% in the age bracket) enrolled. Conversely, the age group of 5 to 9 year old has the lowest likelihood of being enrolled in a private school, with 11 (100.0% in the age bracket) attending a public institution.
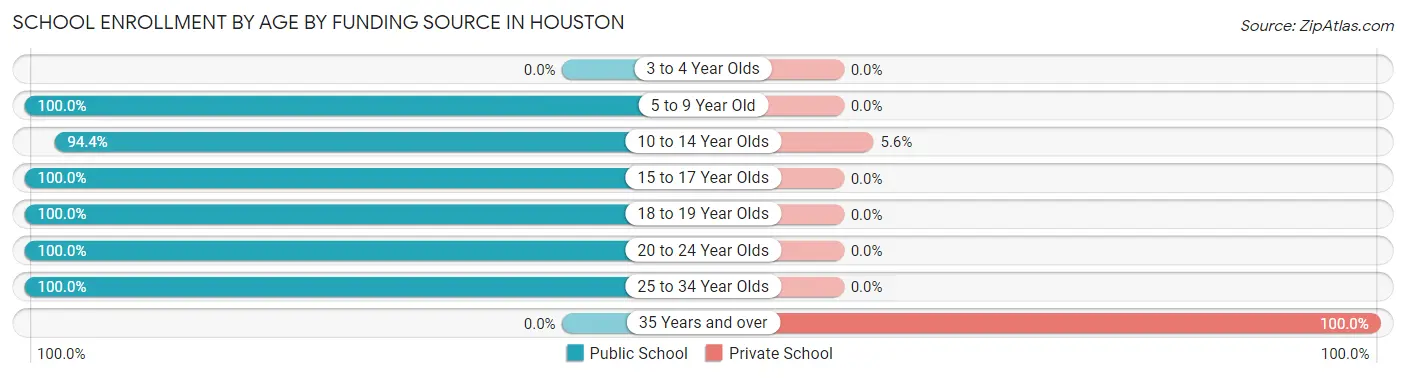
| Age Bracket | Public School | Private School |
| 3 to 4 Year Olds | 0 (0.0%) | 0 (0.0%) |
| 5 to 9 Year Old | 11 (100.0%) | 0 (0.0%) |
| 10 to 14 Year Olds | 17 (94.4%) | 1 (5.6%) |
| 15 to 17 Year Olds | 20 (100.0%) | 0 (0.0%) |
| 18 to 19 Year Olds | 6 (100.0%) | 0 (0.0%) |
| 20 to 24 Year Olds | 6 (100.0%) | 0 (0.0%) |
| 25 to 34 Year Olds | 2 (100.0%) | 0 (0.0%) |
| 35 Years and over | 0 (0.0%) | 5 (100.0%) |
| Total | 62 (91.2%) | 6 (8.8%) |
Educational Attainment by Field of Study in Houston
Business (6 | 35.3%), multidisciplinary studies (3 | 17.6%), education (3 | 17.6%), social sciences (2 | 11.8%), and science & technology (2 | 11.8%) are the most common fields of study among 17 individuals in Houston who have obtained a bachelor's degree or higher.
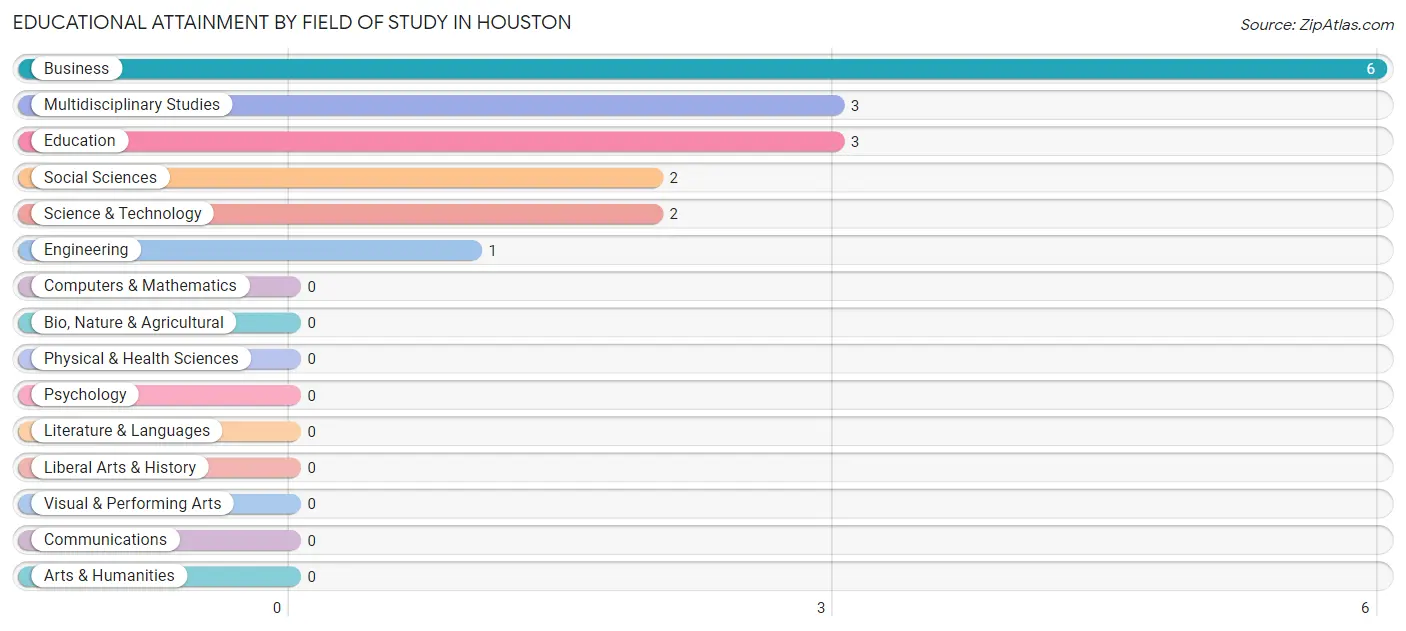
| Field of Study | # Graduates | % Graduates |
| Computers & Mathematics | 0 | 0.0% |
| Bio, Nature & Agricultural | 0 | 0.0% |
| Physical & Health Sciences | 0 | 0.0% |
| Psychology | 0 | 0.0% |
| Social Sciences | 2 | 11.8% |
| Engineering | 1 | 5.9% |
| Multidisciplinary Studies | 3 | 17.6% |
| Science & Technology | 2 | 11.8% |
| Business | 6 | 35.3% |
| Education | 3 | 17.6% |
| Literature & Languages | 0 | 0.0% |
| Liberal Arts & History | 0 | 0.0% |
| Visual & Performing Arts | 0 | 0.0% |
| Communications | 0 | 0.0% |
| Arts & Humanities | 0 | 0.0% |
| Total | 17 | 100.0% |
Transportation & Commute in Houston
Vehicle Availability by Sex in Houston
The most prevalent vehicle ownership categories in Houston are males with 3 vehicles (51, accounting for 33.3%) and females with 3 vehicles (41, making up 52.6%).
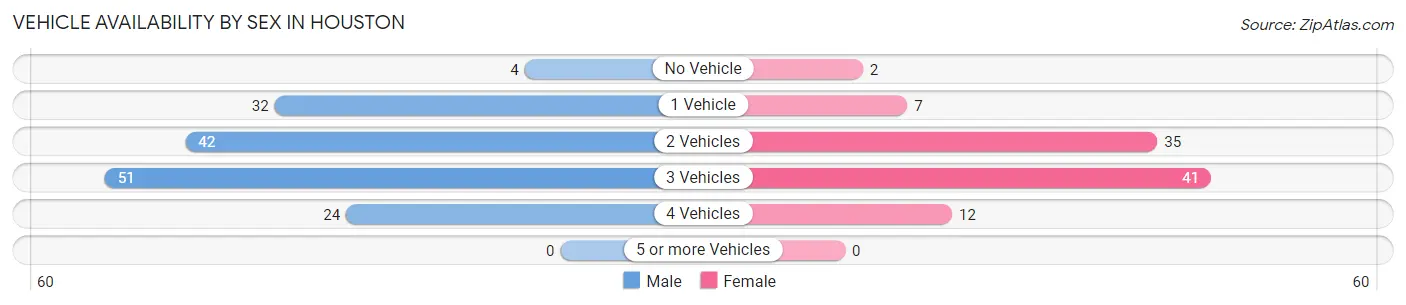
| Vehicles Available | Male | Female |
| No Vehicle | 4 (2.6%) | 2 (2.1%) |
| 1 Vehicle | 32 (20.9%) | 7 (7.2%) |
| 2 Vehicles | 42 (27.5%) | 35 (36.1%) |
| 3 Vehicles | 51 (33.3%) | 41 (42.3%) |
| 4 Vehicles | 24 (15.7%) | 12 (12.4%) |
| 5 or more Vehicles | 0 (0.0%) | 0 (0.0%) |
| Total | 153 (100.0%) | 97 (100.0%) |
Commute Time in Houston
The most frequently occuring commute durations in Houston are 15 to 19 minutes (40 commuters, 22.7%), 25 to 29 minutes (31 commuters, 17.6%), and 10 to 14 minutes (26 commuters, 14.8%).
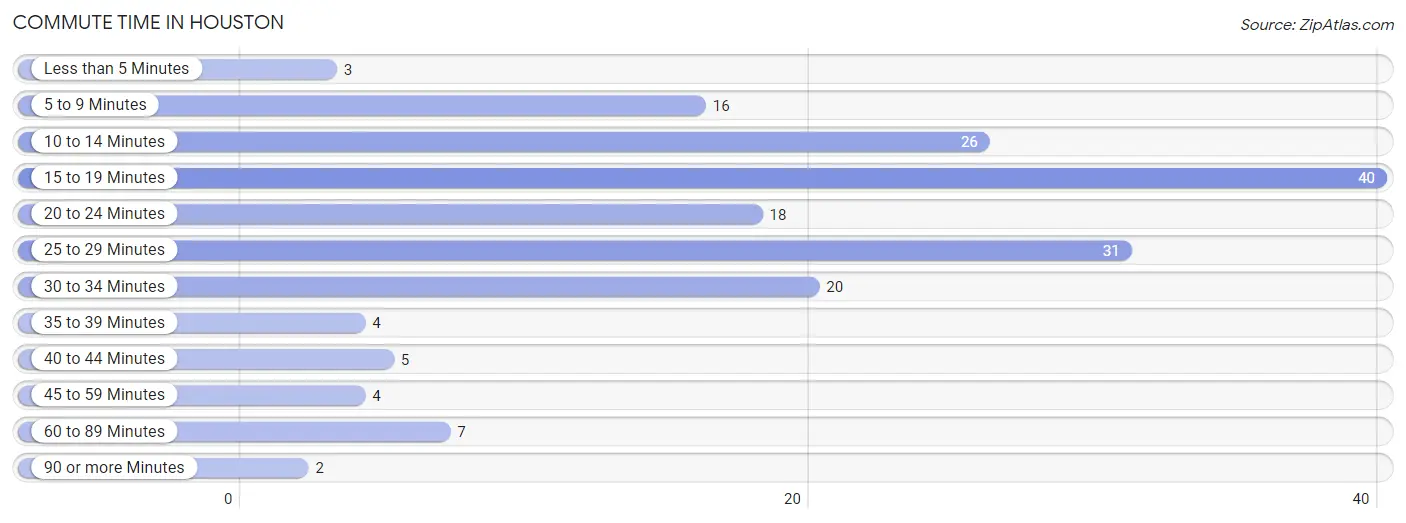
| Commute Time | # Commuters | % Commuters |
| Less than 5 Minutes | 3 | 1.7% |
| 5 to 9 Minutes | 16 | 9.1% |
| 10 to 14 Minutes | 26 | 14.8% |
| 15 to 19 Minutes | 40 | 22.7% |
| 20 to 24 Minutes | 18 | 10.2% |
| 25 to 29 Minutes | 31 | 17.6% |
| 30 to 34 Minutes | 20 | 11.4% |
| 35 to 39 Minutes | 4 | 2.3% |
| 40 to 44 Minutes | 5 | 2.8% |
| 45 to 59 Minutes | 4 | 2.3% |
| 60 to 89 Minutes | 7 | 4.0% |
| 90 or more Minutes | 2 | 1.1% |
Commute Time by Sex in Houston
The most common commute times in Houston are 25 to 29 minutes (20 commuters, 23.3%) for males and 15 to 19 minutes (22 commuters, 24.4%) for females.
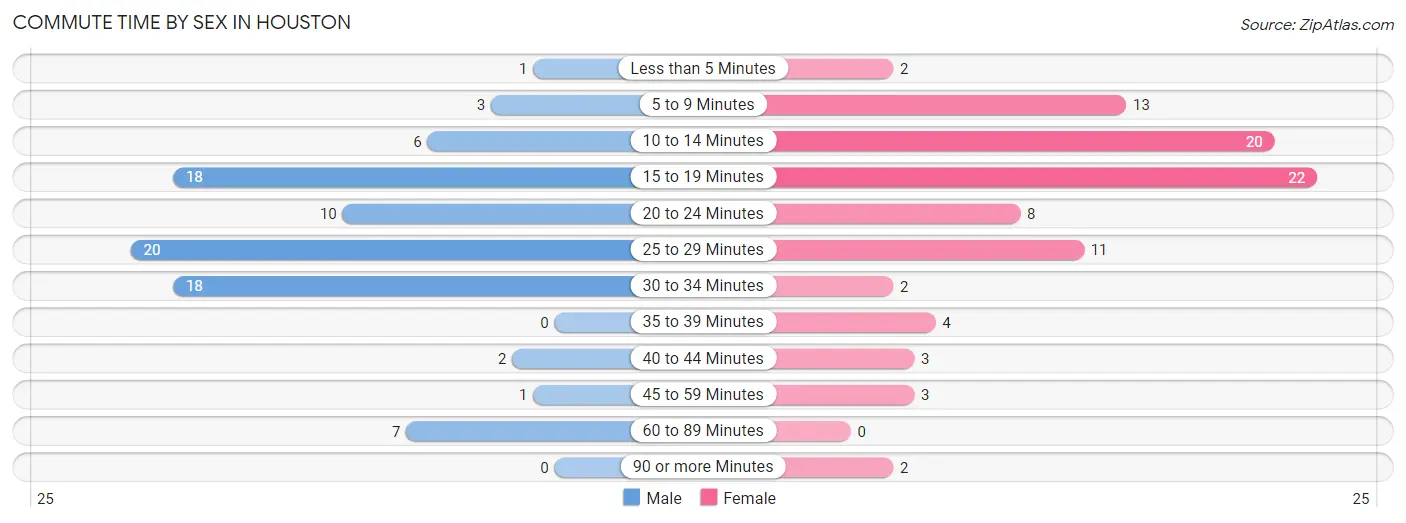
| Commute Time | Male | Female |
| Less than 5 Minutes | 1 (1.2%) | 2 (2.2%) |
| 5 to 9 Minutes | 3 (3.5%) | 13 (14.4%) |
| 10 to 14 Minutes | 6 (7.0%) | 20 (22.2%) |
| 15 to 19 Minutes | 18 (20.9%) | 22 (24.4%) |
| 20 to 24 Minutes | 10 (11.6%) | 8 (8.9%) |
| 25 to 29 Minutes | 20 (23.3%) | 11 (12.2%) |
| 30 to 34 Minutes | 18 (20.9%) | 2 (2.2%) |
| 35 to 39 Minutes | 0 (0.0%) | 4 (4.4%) |
| 40 to 44 Minutes | 2 (2.3%) | 3 (3.3%) |
| 45 to 59 Minutes | 1 (1.2%) | 3 (3.3%) |
| 60 to 89 Minutes | 7 (8.1%) | 0 (0.0%) |
| 90 or more Minutes | 0 (0.0%) | 2 (2.2%) |
Time of Departure to Work by Sex in Houston
The most frequent times of departure to work in Houston are 7:00 AM to 7:29 AM (24, 27.9%) for males and 12:00 PM to 3:59 PM (18, 20.0%) for females.
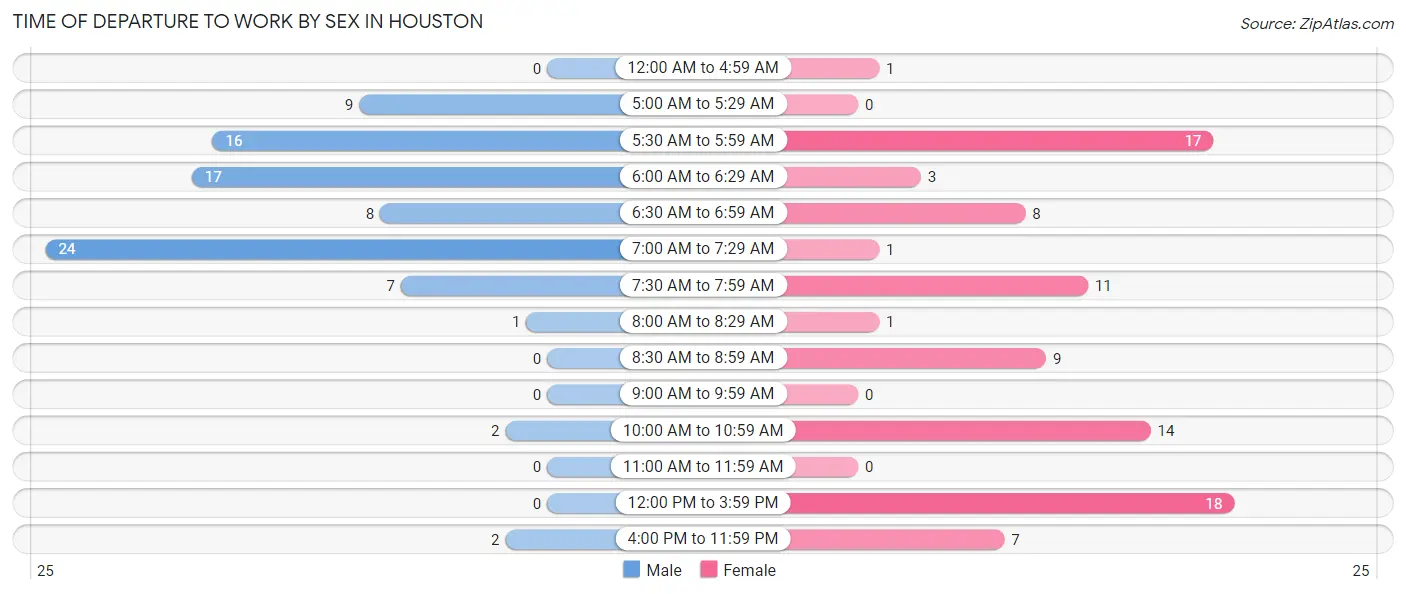
| Time of Departure | Male | Female |
| 12:00 AM to 4:59 AM | 0 (0.0%) | 1 (1.1%) |
| 5:00 AM to 5:29 AM | 9 (10.5%) | 0 (0.0%) |
| 5:30 AM to 5:59 AM | 16 (18.6%) | 17 (18.9%) |
| 6:00 AM to 6:29 AM | 17 (19.8%) | 3 (3.3%) |
| 6:30 AM to 6:59 AM | 8 (9.3%) | 8 (8.9%) |
| 7:00 AM to 7:29 AM | 24 (27.9%) | 1 (1.1%) |
| 7:30 AM to 7:59 AM | 7 (8.1%) | 11 (12.2%) |
| 8:00 AM to 8:29 AM | 1 (1.2%) | 1 (1.1%) |
| 8:30 AM to 8:59 AM | 0 (0.0%) | 9 (10.0%) |
| 9:00 AM to 9:59 AM | 0 (0.0%) | 0 (0.0%) |
| 10:00 AM to 10:59 AM | 2 (2.3%) | 14 (15.6%) |
| 11:00 AM to 11:59 AM | 0 (0.0%) | 0 (0.0%) |
| 12:00 PM to 3:59 PM | 0 (0.0%) | 18 (20.0%) |
| 4:00 PM to 11:59 PM | 2 (2.3%) | 7 (7.8%) |
| Total | 86 (100.0%) | 90 (100.0%) |
Housing Occupancy in Houston
Occupancy by Ownership in Houston
Of the total 208 dwellings in Houston, owner-occupied units account for 181 (87.0%), while renter-occupied units make up 27 (13.0%).
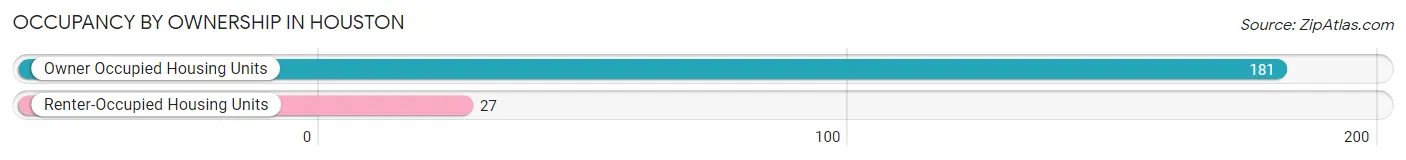
| Occupancy | # Housing Units | % Housing Units |
| Owner Occupied Housing Units | 181 | 87.0% |
| Renter-Occupied Housing Units | 27 | 13.0% |
| Total Occupied Housing Units | 208 | 100.0% |
Occupancy by Household Size in Houston
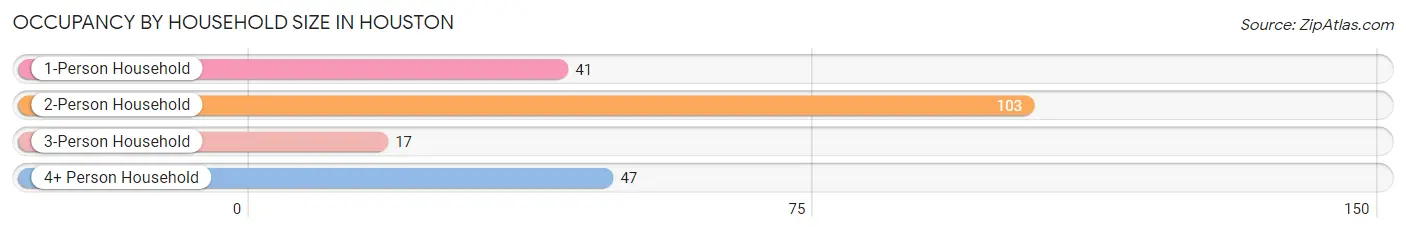
| Household Size | # Housing Units | % Housing Units |
| 1-Person Household | 41 | 19.7% |
| 2-Person Household | 103 | 49.5% |
| 3-Person Household | 17 | 8.2% |
| 4+ Person Household | 47 | 22.6% |
| Total Housing Units | 208 | 100.0% |
Occupancy by Ownership by Household Size in Houston
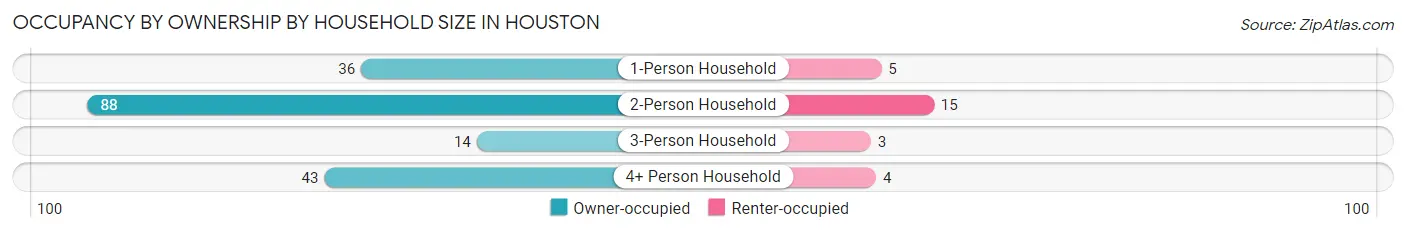
| Household Size | Owner-occupied | Renter-occupied |
| 1-Person Household | 36 (87.8%) | 5 (12.2%) |
| 2-Person Household | 88 (85.4%) | 15 (14.6%) |
| 3-Person Household | 14 (82.4%) | 3 (17.6%) |
| 4+ Person Household | 43 (91.5%) | 4 (8.5%) |
| Total Housing Units | 181 (87.0%) | 27 (13.0%) |
Occupancy by Educational Attainment in Houston
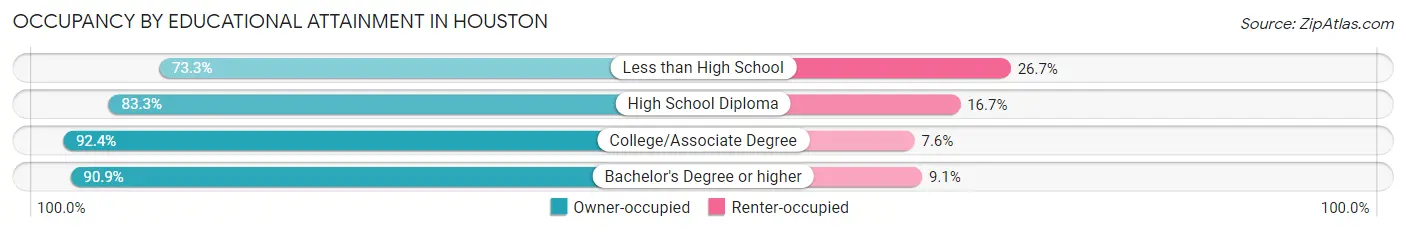
| Household Size | Owner-occupied | Renter-occupied |
| Less than High School | 11 (73.3%) | 4 (26.7%) |
| High School Diploma | 75 (83.3%) | 15 (16.7%) |
| College/Associate Degree | 85 (92.4%) | 7 (7.6%) |
| Bachelor's Degree or higher | 10 (90.9%) | 1 (9.1%) |
Occupancy by Age of Householder in Houston
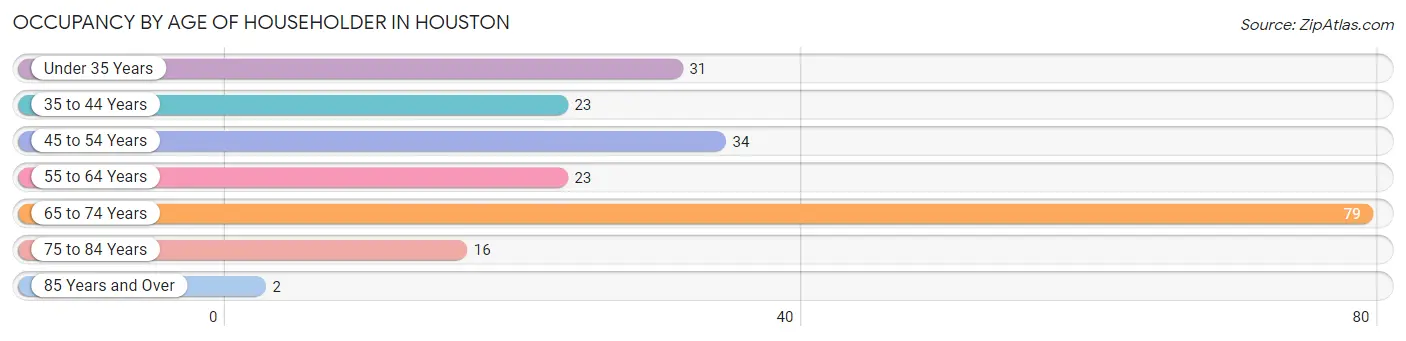
| Age Bracket | # Households | % Households |
| Under 35 Years | 31 | 14.9% |
| 35 to 44 Years | 23 | 11.1% |
| 45 to 54 Years | 34 | 16.4% |
| 55 to 64 Years | 23 | 11.1% |
| 65 to 74 Years | 79 | 38.0% |
| 75 to 84 Years | 16 | 7.7% |
| 85 Years and Over | 2 | 1.0% |
| Total | 208 | 100.0% |
Housing Finances in Houston
Median Income by Occupancy in Houston
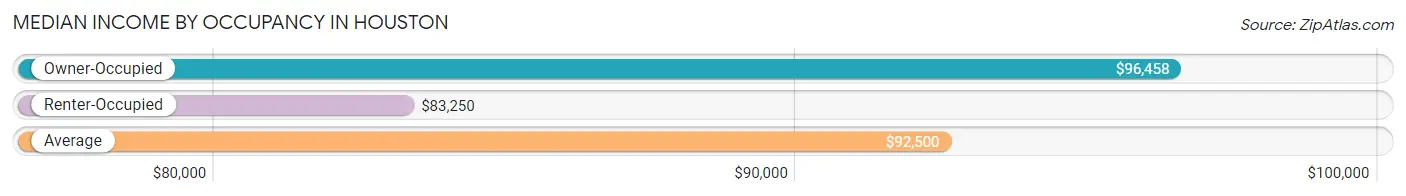
| Occupancy Type | # Households | Median Income |
| Owner-Occupied | 181 (87.0%) | $96,458 |
| Renter-Occupied | 27 (13.0%) | $83,250 |
| Average | 208 (100.0%) | $92,500 |
Occupancy by Householder Income Bracket in Houston
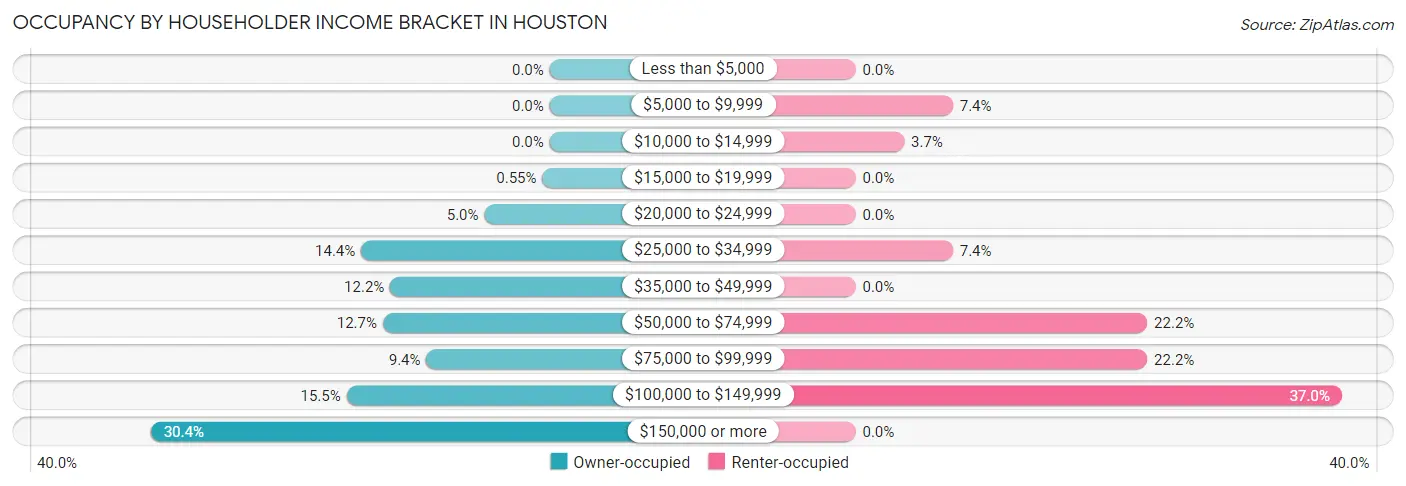
| Income Bracket | Owner-occupied | Renter-occupied |
| Less than $5,000 | 0 (0.0%) | 0 (0.0%) |
| $5,000 to $9,999 | 0 (0.0%) | 2 (7.4%) |
| $10,000 to $14,999 | 0 (0.0%) | 1 (3.7%) |
| $15,000 to $19,999 | 1 (0.5%) | 0 (0.0%) |
| $20,000 to $24,999 | 9 (5.0%) | 0 (0.0%) |
| $25,000 to $34,999 | 26 (14.4%) | 2 (7.4%) |
| $35,000 to $49,999 | 22 (12.1%) | 0 (0.0%) |
| $50,000 to $74,999 | 23 (12.7%) | 6 (22.2%) |
| $75,000 to $99,999 | 17 (9.4%) | 6 (22.2%) |
| $100,000 to $149,999 | 28 (15.5%) | 10 (37.0%) |
| $150,000 or more | 55 (30.4%) | 0 (0.0%) |
| Total | 181 (100.0%) | 27 (100.0%) |
Monthly Housing Cost Tiers in Houston
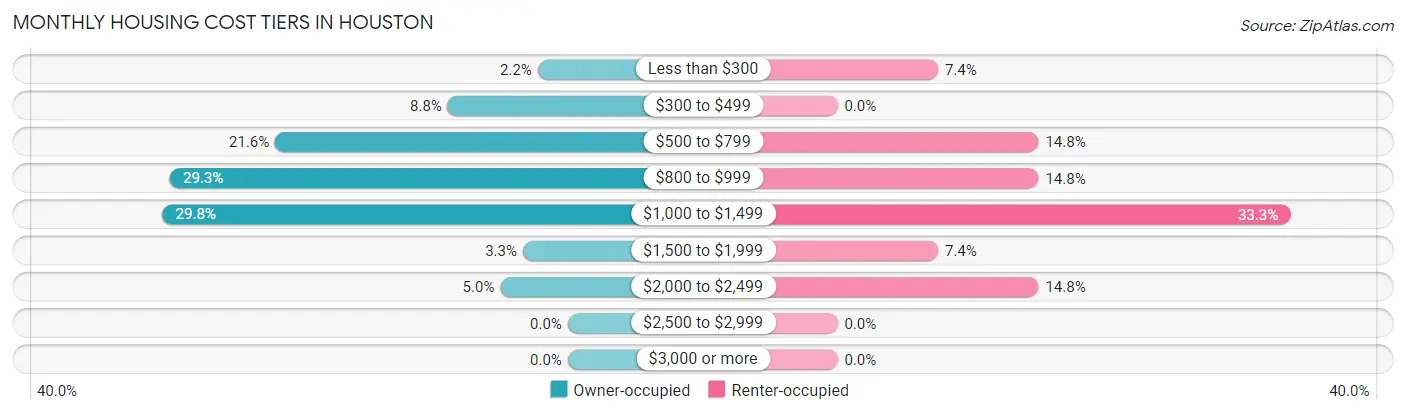
| Monthly Cost | Owner-occupied | Renter-occupied |
| Less than $300 | 4 (2.2%) | 2 (7.4%) |
| $300 to $499 | 16 (8.8%) | 0 (0.0%) |
| $500 to $799 | 39 (21.5%) | 4 (14.8%) |
| $800 to $999 | 53 (29.3%) | 4 (14.8%) |
| $1,000 to $1,499 | 54 (29.8%) | 9 (33.3%) |
| $1,500 to $1,999 | 6 (3.3%) | 2 (7.4%) |
| $2,000 to $2,499 | 9 (5.0%) | 4 (14.8%) |
| $2,500 to $2,999 | 0 (0.0%) | 0 (0.0%) |
| $3,000 or more | 0 (0.0%) | 0 (0.0%) |
| Total | 181 (100.0%) | 27 (100.0%) |
Physical Housing Characteristics in Houston
Housing Structures in Houston
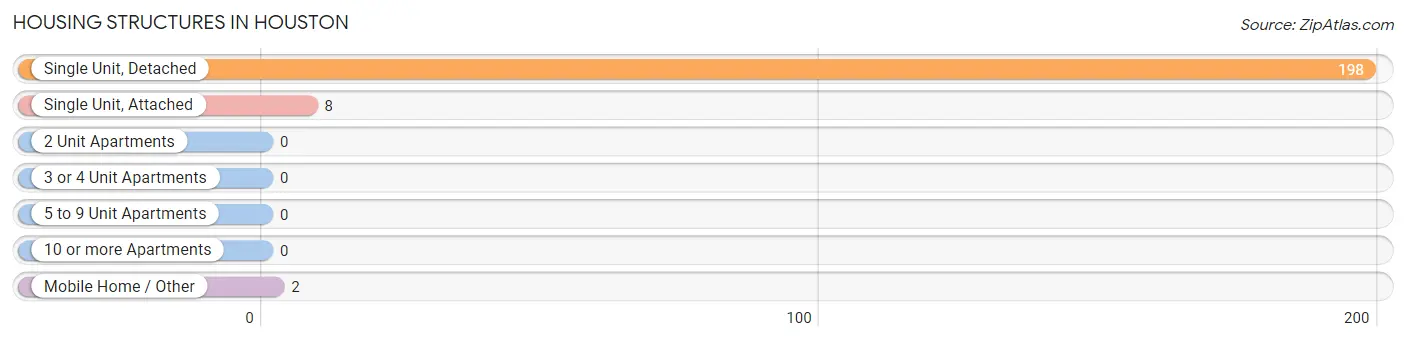
| Structure Type | # Housing Units | % Housing Units |
| Single Unit, Detached | 198 | 95.2% |
| Single Unit, Attached | 8 | 3.8% |
| 2 Unit Apartments | 0 | 0.0% |
| 3 or 4 Unit Apartments | 0 | 0.0% |
| 5 to 9 Unit Apartments | 0 | 0.0% |
| 10 or more Apartments | 0 | 0.0% |
| Mobile Home / Other | 2 | 1.0% |
| Total | 208 | 100.0% |
Housing Structures by Occupancy in Houston
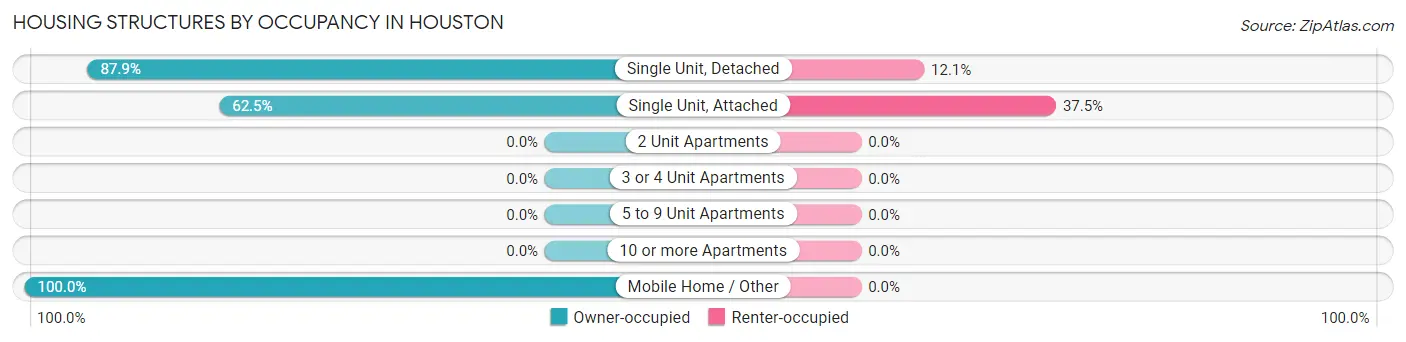
| Structure Type | Owner-occupied | Renter-occupied |
| Single Unit, Detached | 174 (87.9%) | 24 (12.1%) |
| Single Unit, Attached | 5 (62.5%) | 3 (37.5%) |
| 2 Unit Apartments | 0 (0.0%) | 0 (0.0%) |
| 3 or 4 Unit Apartments | 0 (0.0%) | 0 (0.0%) |
| 5 to 9 Unit Apartments | 0 (0.0%) | 0 (0.0%) |
| 10 or more Apartments | 0 (0.0%) | 0 (0.0%) |
| Mobile Home / Other | 2 (100.0%) | 0 (0.0%) |
| Total | 181 (87.0%) | 27 (13.0%) |
Housing Structures by Number of Rooms in Houston
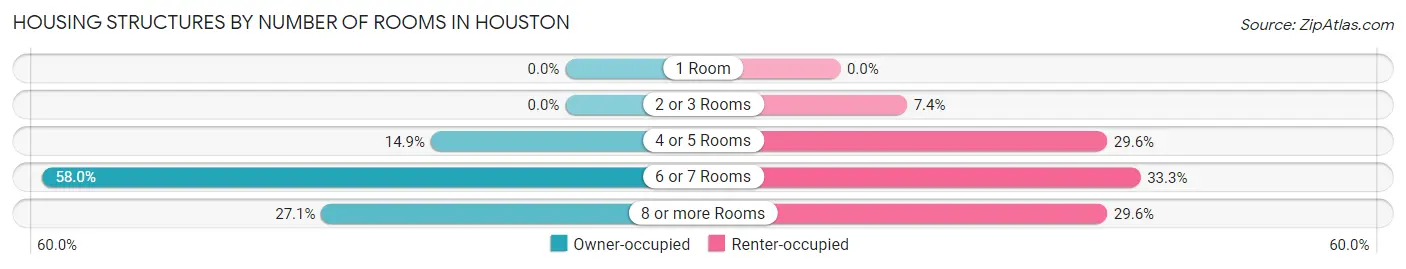
| Number of Rooms | Owner-occupied | Renter-occupied |
| 1 Room | 0 (0.0%) | 0 (0.0%) |
| 2 or 3 Rooms | 0 (0.0%) | 2 (7.4%) |
| 4 or 5 Rooms | 27 (14.9%) | 8 (29.6%) |
| 6 or 7 Rooms | 105 (58.0%) | 9 (33.3%) |
| 8 or more Rooms | 49 (27.1%) | 8 (29.6%) |
| Total | 181 (100.0%) | 27 (100.0%) |
Housing Structure by Heating Type in Houston
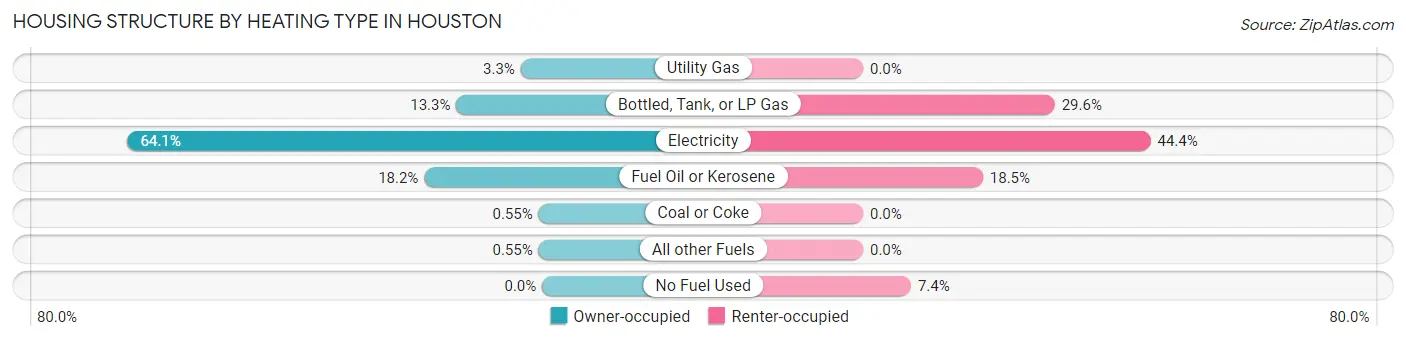
| Heating Type | Owner-occupied | Renter-occupied |
| Utility Gas | 6 (3.3%) | 0 (0.0%) |
| Bottled, Tank, or LP Gas | 24 (13.3%) | 8 (29.6%) |
| Electricity | 116 (64.1%) | 12 (44.4%) |
| Fuel Oil or Kerosene | 33 (18.2%) | 5 (18.5%) |
| Coal or Coke | 1 (0.5%) | 0 (0.0%) |
| All other Fuels | 1 (0.5%) | 0 (0.0%) |
| No Fuel Used | 0 (0.0%) | 2 (7.4%) |
| Total | 181 (100.0%) | 27 (100.0%) |
Household Vehicle Usage in Houston
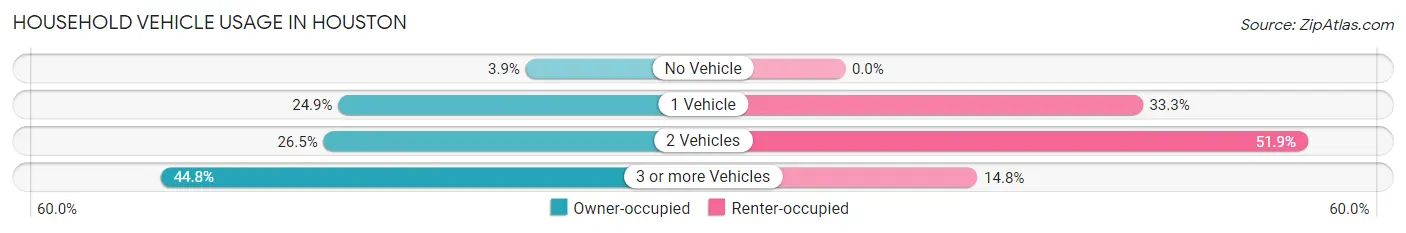
| Vehicles per Household | Owner-occupied | Renter-occupied |
| No Vehicle | 7 (3.9%) | 0 (0.0%) |
| 1 Vehicle | 45 (24.9%) | 9 (33.3%) |
| 2 Vehicles | 48 (26.5%) | 14 (51.8%) |
| 3 or more Vehicles | 81 (44.8%) | 4 (14.8%) |
| Total | 181 (100.0%) | 27 (100.0%) |
Real Estate & Mortgages in Houston
Real Estate and Mortgage Overview in Houston
| Characteristic | Without Mortgage | With Mortgage |
| Housing Units | 56 | 125 |
| Median Property Value | $291,700 | $239,800 |
| Median Household Income | - | - |
| Monthly Housing Costs | $529 | $0 |
| Real Estate Taxes | $700 | $6 |
Property Value by Mortgage Status in Houston
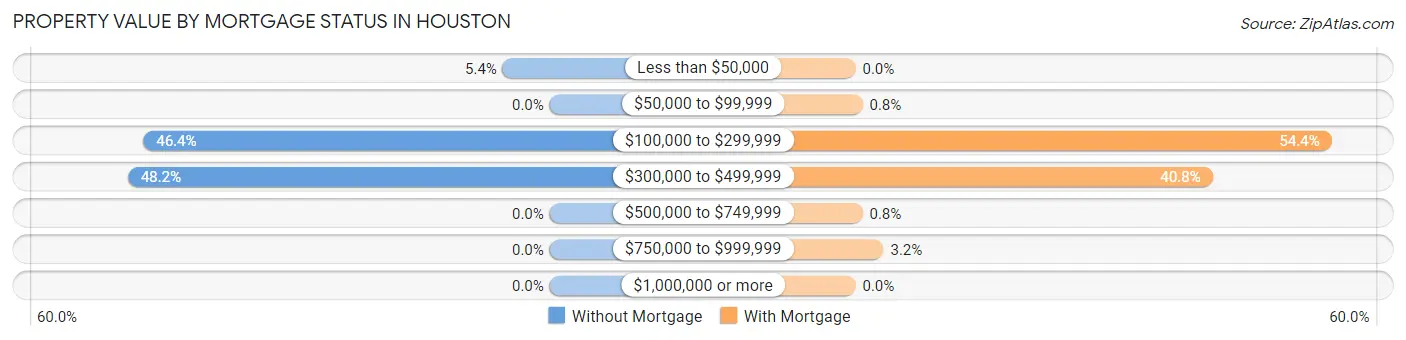
| Property Value | Without Mortgage | With Mortgage |
| Less than $50,000 | 3 (5.4%) | 0 (0.0%) |
| $50,000 to $99,999 | 0 (0.0%) | 1 (0.8%) |
| $100,000 to $299,999 | 26 (46.4%) | 68 (54.4%) |
| $300,000 to $499,999 | 27 (48.2%) | 51 (40.8%) |
| $500,000 to $749,999 | 0 (0.0%) | 1 (0.8%) |
| $750,000 to $999,999 | 0 (0.0%) | 4 (3.2%) |
| $1,000,000 or more | 0 (0.0%) | 0 (0.0%) |
| Total | 56 (100.0%) | 125 (100.0%) |
Household Income by Mortgage Status in Houston
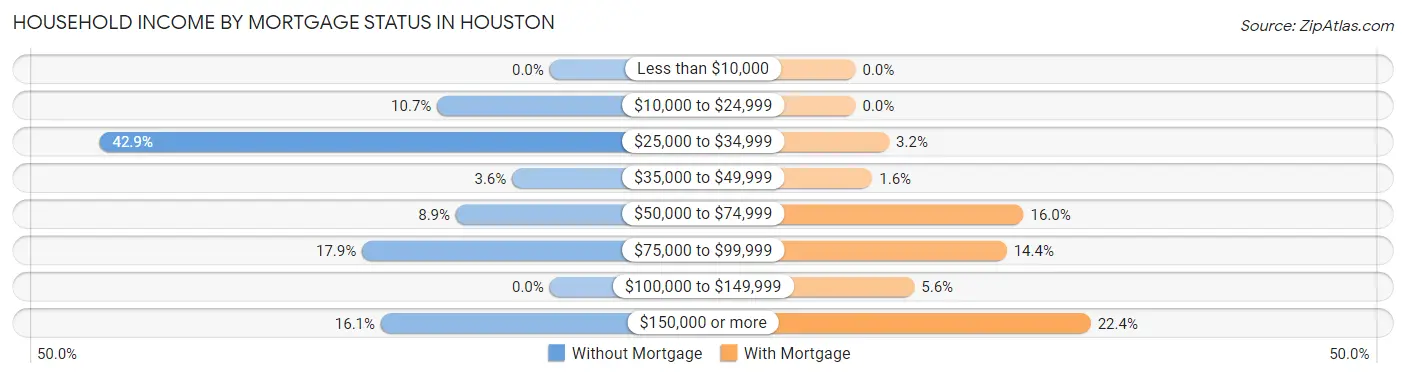
| Household Income | Without Mortgage | With Mortgage |
| Less than $10,000 | 0 (0.0%) | 0 (0.0%) |
| $10,000 to $24,999 | 6 (10.7%) | 0 (0.0%) |
| $25,000 to $34,999 | 24 (42.9%) | 4 (3.2%) |
| $35,000 to $49,999 | 2 (3.6%) | 2 (1.6%) |
| $50,000 to $74,999 | 5 (8.9%) | 20 (16.0%) |
| $75,000 to $99,999 | 10 (17.9%) | 18 (14.4%) |
| $100,000 to $149,999 | 0 (0.0%) | 7 (5.6%) |
| $150,000 or more | 9 (16.1%) | 28 (22.4%) |
| Total | 56 (100.0%) | 125 (100.0%) |
Property Value to Household Income Ratio in Houston
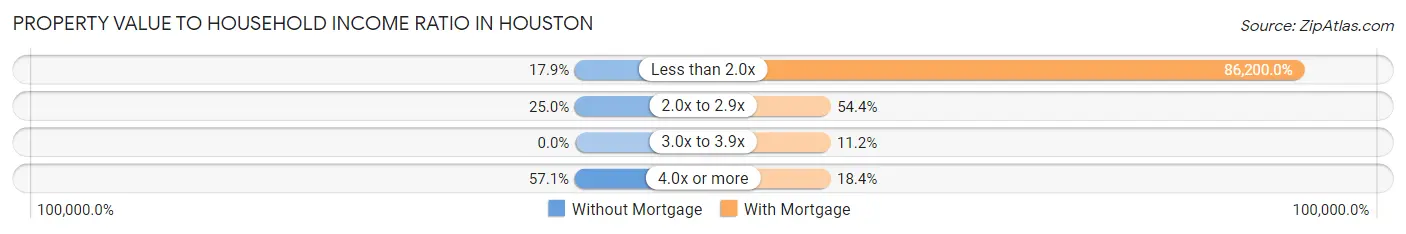
| Value-to-Income Ratio | Without Mortgage | With Mortgage |
| Less than 2.0x | 10 (17.9%) | 107,750 (86,200.0%) |
| 2.0x to 2.9x | 14 (25.0%) | 68 (54.4%) |
| 3.0x to 3.9x | 0 (0.0%) | 14 (11.2%) |
| 4.0x or more | 32 (57.1%) | 23 (18.4%) |
| Total | 56 (100.0%) | 125 (100.0%) |
Real Estate Taxes by Mortgage Status in Houston
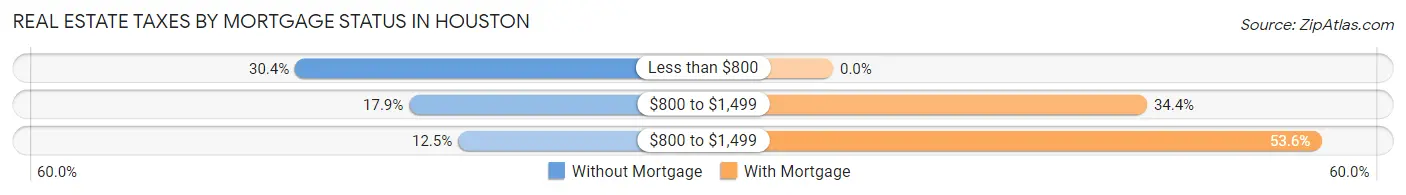
| Property Taxes | Without Mortgage | With Mortgage |
| Less than $800 | 17 (30.4%) | 0 (0.0%) |
| $800 to $1,499 | 10 (17.9%) | 43 (34.4%) |
| $800 to $1,499 | 7 (12.5%) | 67 (53.6%) |
| Total | 56 (100.0%) | 125 (100.0%) |
Health & Disability in Houston
Health Insurance Coverage by Age in Houston
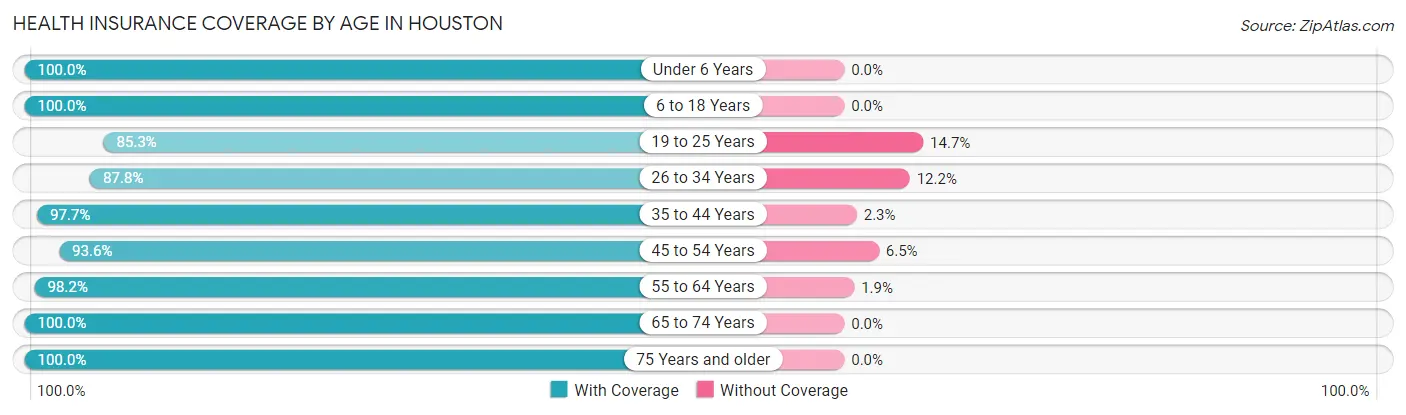
| Age Bracket | With Coverage | Without Coverage |
| Under 6 Years | 9 (100.0%) | 0 (0.0%) |
| 6 to 18 Years | 55 (100.0%) | 0 (0.0%) |
| 19 to 25 Years | 29 (85.3%) | 5 (14.7%) |
| 26 to 34 Years | 36 (87.8%) | 5 (12.2%) |
| 35 to 44 Years | 42 (97.7%) | 1 (2.3%) |
| 45 to 54 Years | 58 (93.5%) | 4 (6.5%) |
| 55 to 64 Years | 53 (98.2%) | 1 (1.8%) |
| 65 to 74 Years | 103 (100.0%) | 0 (0.0%) |
| 75 Years and older | 21 (100.0%) | 0 (0.0%) |
| Total | 406 (96.2%) | 16 (3.8%) |
Health Insurance Coverage by Citizenship Status in Houston
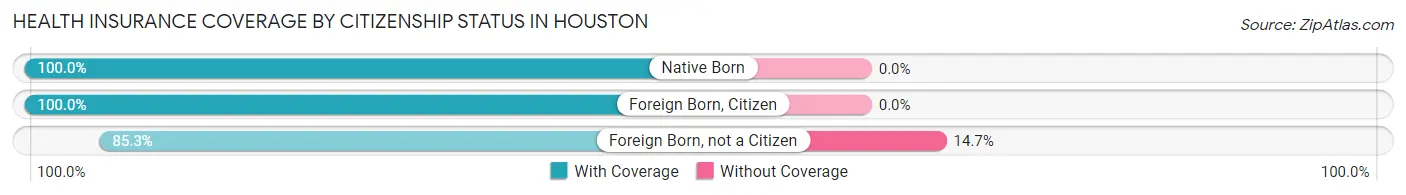
| Citizenship Status | With Coverage | Without Coverage |
| Native Born | 9 (100.0%) | 0 (0.0%) |
| Foreign Born, Citizen | 55 (100.0%) | 0 (0.0%) |
| Foreign Born, not a Citizen | 29 (85.3%) | 5 (14.7%) |
Health Insurance Coverage by Household Income in Houston
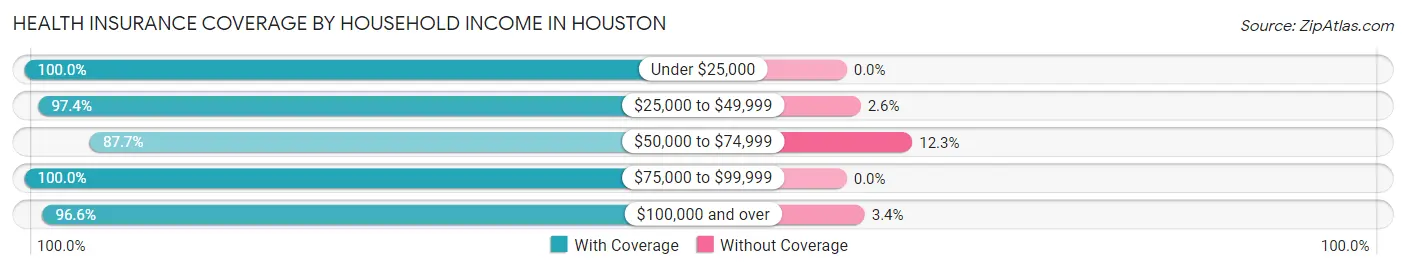
| Household Income | With Coverage | Without Coverage |
| Under $25,000 | 14 (100.0%) | 0 (0.0%) |
| $25,000 to $49,999 | 112 (97.4%) | 3 (2.6%) |
| $50,000 to $74,999 | 50 (87.7%) | 7 (12.3%) |
| $75,000 to $99,999 | 58 (100.0%) | 0 (0.0%) |
| $100,000 and over | 172 (96.6%) | 6 (3.4%) |
Public vs Private Health Insurance Coverage by Age in Houston
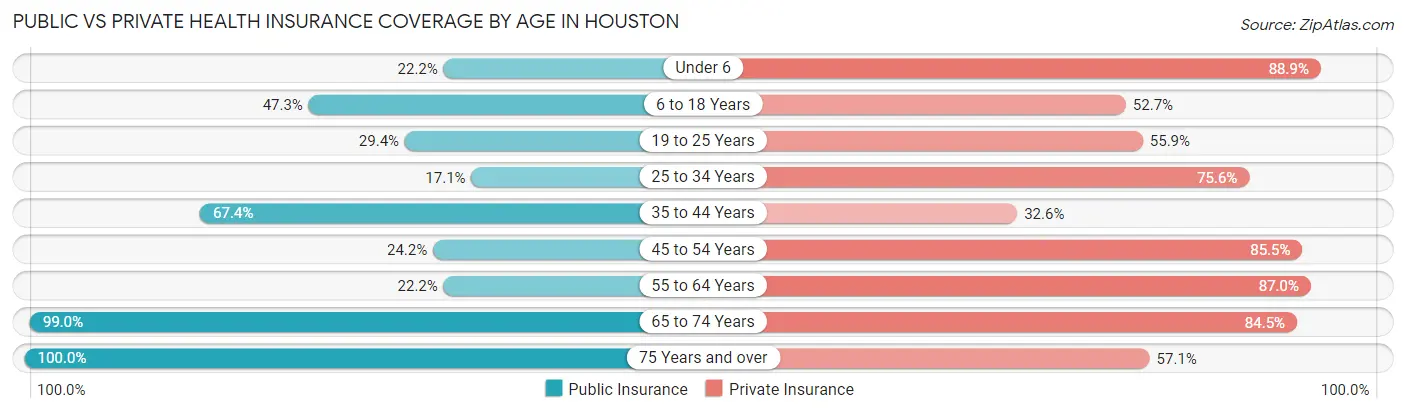
| Age Bracket | Public Insurance | Private Insurance |
| Under 6 | 2 (22.2%) | 8 (88.9%) |
| 6 to 18 Years | 26 (47.3%) | 29 (52.7%) |
| 19 to 25 Years | 10 (29.4%) | 19 (55.9%) |
| 25 to 34 Years | 7 (17.1%) | 31 (75.6%) |
| 35 to 44 Years | 29 (67.4%) | 14 (32.6%) |
| 45 to 54 Years | 15 (24.2%) | 53 (85.5%) |
| 55 to 64 Years | 12 (22.2%) | 47 (87.0%) |
| 65 to 74 Years | 102 (99.0%) | 87 (84.5%) |
| 75 Years and over | 21 (100.0%) | 12 (57.1%) |
| Total | 224 (53.1%) | 300 (71.1%) |
Disability Status by Sex by Age in Houston
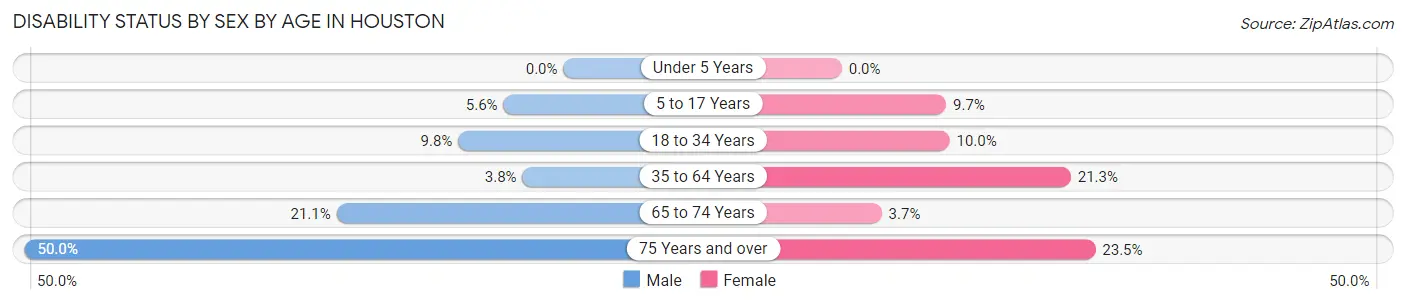
| Age Bracket | Male | Female |
| Under 5 Years | 0 (0.0%) | 0 (0.0%) |
| 5 to 17 Years | 1 (5.6%) | 3 (9.7%) |
| 18 to 34 Years | 4 (9.8%) | 4 (10.0%) |
| 35 to 64 Years | 3 (3.8%) | 17 (21.2%) |
| 65 to 74 Years | 16 (21.0%) | 1 (3.7%) |
| 75 Years and over | 2 (50.0%) | 4 (23.5%) |
Disability Class by Sex by Age in Houston
Disability Class: Hearing Difficulty
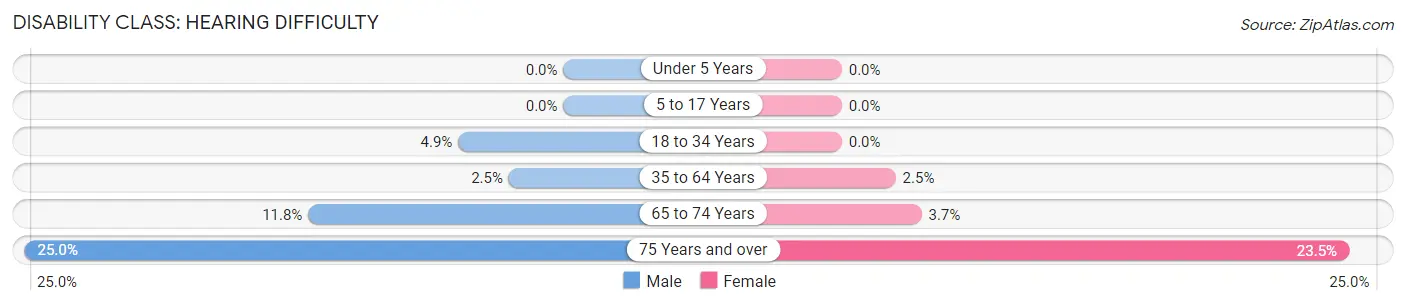
| Age Bracket | Male | Female |
| Under 5 Years | 0 (0.0%) | 0 (0.0%) |
| 5 to 17 Years | 0 (0.0%) | 0 (0.0%) |
| 18 to 34 Years | 2 (4.9%) | 0 (0.0%) |
| 35 to 64 Years | 2 (2.5%) | 2 (2.5%) |
| 65 to 74 Years | 9 (11.8%) | 1 (3.7%) |
| 75 Years and over | 1 (25.0%) | 4 (23.5%) |
Disability Class: Vision Difficulty
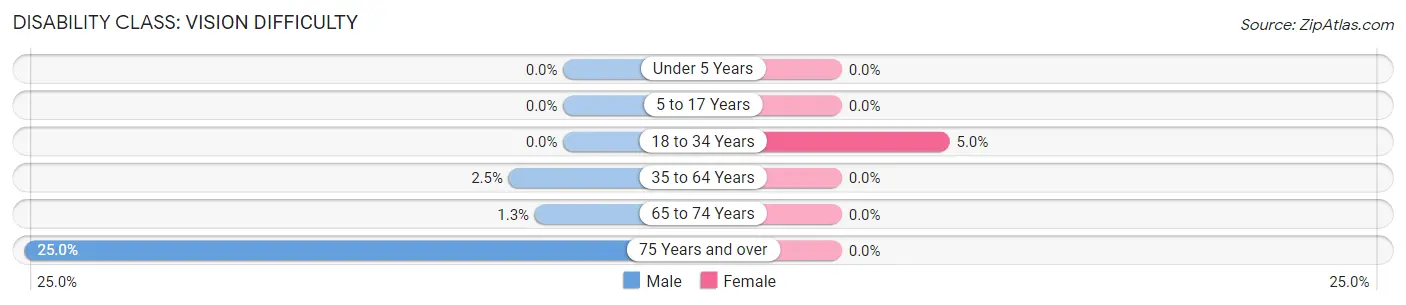
| Age Bracket | Male | Female |
| Under 5 Years | 0 (0.0%) | 0 (0.0%) |
| 5 to 17 Years | 0 (0.0%) | 0 (0.0%) |
| 18 to 34 Years | 0 (0.0%) | 2 (5.0%) |
| 35 to 64 Years | 2 (2.5%) | 0 (0.0%) |
| 65 to 74 Years | 1 (1.3%) | 0 (0.0%) |
| 75 Years and over | 1 (25.0%) | 0 (0.0%) |
Disability Class: Cognitive Difficulty
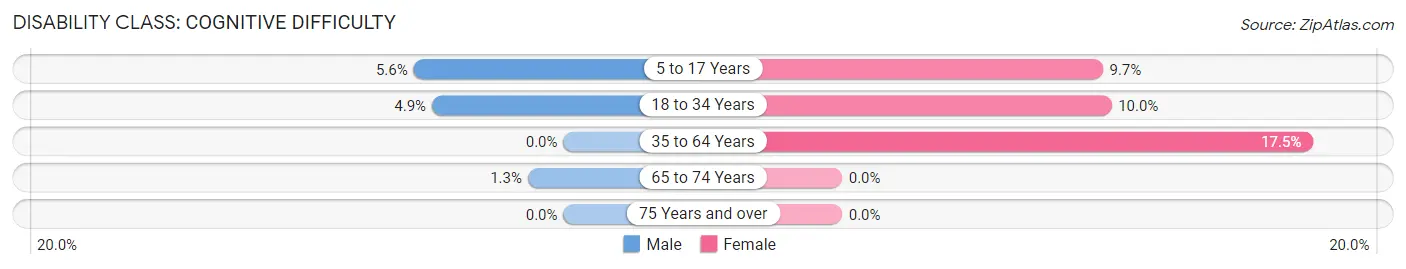
| Age Bracket | Male | Female |
| 5 to 17 Years | 1 (5.6%) | 3 (9.7%) |
| 18 to 34 Years | 2 (4.9%) | 4 (10.0%) |
| 35 to 64 Years | 0 (0.0%) | 14 (17.5%) |
| 65 to 74 Years | 1 (1.3%) | 0 (0.0%) |
| 75 Years and over | 0 (0.0%) | 0 (0.0%) |
Disability Class: Ambulatory Difficulty
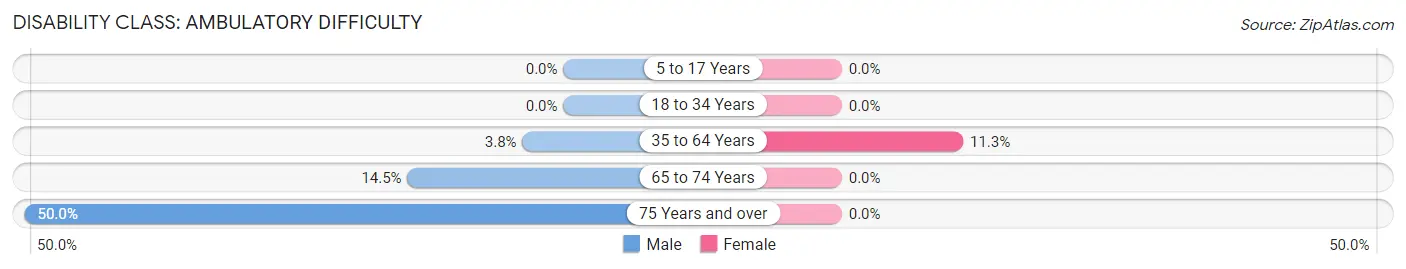
| Age Bracket | Male | Female |
| 5 to 17 Years | 0 (0.0%) | 0 (0.0%) |
| 18 to 34 Years | 0 (0.0%) | 0 (0.0%) |
| 35 to 64 Years | 3 (3.8%) | 9 (11.3%) |
| 65 to 74 Years | 11 (14.5%) | 0 (0.0%) |
| 75 Years and over | 2 (50.0%) | 0 (0.0%) |
Disability Class: Self-Care Difficulty
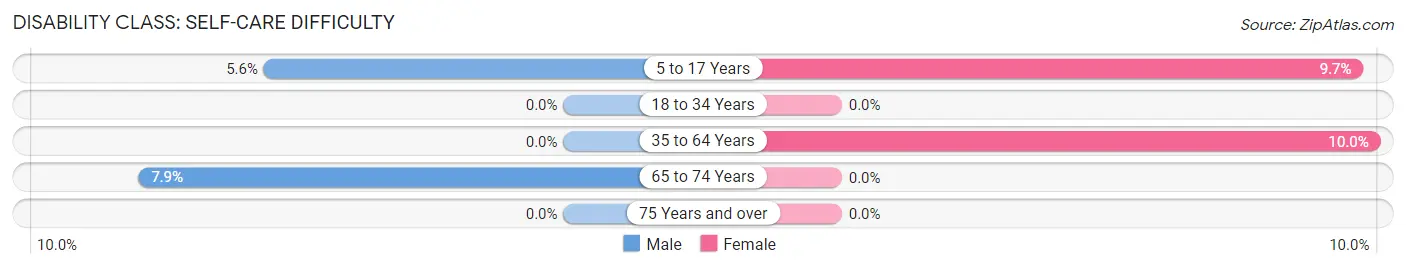
| Age Bracket | Male | Female |
| 5 to 17 Years | 1 (5.6%) | 3 (9.7%) |
| 18 to 34 Years | 0 (0.0%) | 0 (0.0%) |
| 35 to 64 Years | 0 (0.0%) | 8 (10.0%) |
| 65 to 74 Years | 6 (7.9%) | 0 (0.0%) |
| 75 Years and over | 0 (0.0%) | 0 (0.0%) |
Technology Access in Houston
Computing Device Access in Houston
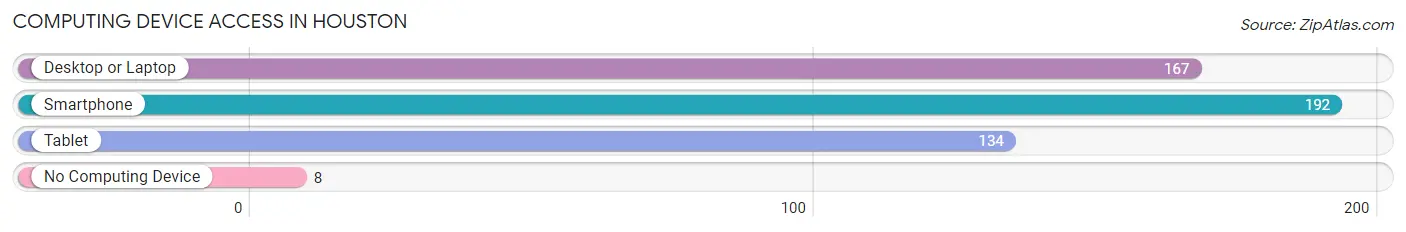
| Device Type | # Households | % Households |
| Desktop or Laptop | 167 | 80.3% |
| Smartphone | 192 | 92.3% |
| Tablet | 134 | 64.4% |
| No Computing Device | 8 | 3.8% |
| Total | 208 | 100.0% |
Internet Access in Houston
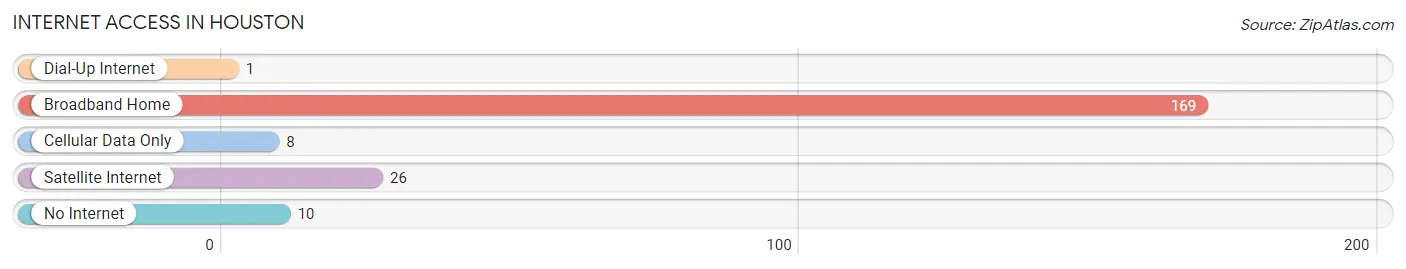
| Internet Type | # Households | % Households |
| Dial-Up Internet | 1 | 0.5% |
| Broadband Home | 169 | 81.2% |
| Cellular Data Only | 8 | 3.8% |
| Satellite Internet | 26 | 12.5% |
| No Internet | 10 | 4.8% |
| Total | 208 | 100.0% |
Houston Summary
Houston is the largest city in the state of Texas and the fourth-largest city in the United States. It is located in the southeastern part of the state, near the Gulf of Mexico. The city is known for its diverse population, its vibrant economy, and its rich cultural heritage.
Geography
Houston is located in the southeastern part of Texas, near the Gulf of Mexico. It is situated on the banks of the Buffalo Bayou, a slow-moving river that runs through the city. The city is surrounded by several smaller towns and cities, including Galveston, Baytown, and Pasadena. The city is also close to the Houston Ship Channel, which connects the city to the Gulf of Mexico. The city is divided into several distinct neighborhoods, each with its own unique character and culture.
The city has a humid subtropical climate, with hot summers and mild winters. The average temperature in the summer is around 90 degrees Fahrenheit, while the average temperature in the winter is around 60 degrees Fahrenheit. The city receives an average of 48 inches of rain per year.
Economy
Houston is a major economic center in the United States. The city is home to several Fortune 500 companies, including ExxonMobil, ConocoPhillips, and Sysco. The city is also home to several major universities, including the University of Houston, Rice University, and Texas Southern University.
The city is a major hub for the oil and gas industry, and is home to several major oil refineries. The city is also a major center for the aerospace industry, and is home to the Johnson Space Center, the home of NASA’s astronaut training program.
The city is also a major center for the medical industry, and is home to several major hospitals and medical research centers. The city is also a major center for the financial industry, and is home to several major banks and financial institutions.
Demographics
As of the 2010 census, the population of Houston was 2,099,451. The city is racially and ethnically diverse, with a population that is 44.8% White, 25.3% African American, 0.7% Native American, 5.6% Asian, and 22.6% Hispanic or Latino. The city is also home to a large immigrant population, with over 20% of the population being foreign-born.
The median household income in Houston is $45,845, and the median home value is $164,800. The city has a poverty rate of 18.3%, and the unemployment rate is 5.2%.
Conclusion
Houston is a vibrant and diverse city with a rich cultural heritage. The city is a major economic center in the United States, and is home to several Fortune 500 companies, major universities, and several major hospitals and medical research centers. The city is also home to a large immigrant population, and is racially and ethnically diverse. The city has a humid subtropical climate, with hot summers and mild winters. The city is a major hub for the oil and gas industry, and is a major center for the aerospace and medical industries. The city has a median household income of $45,845, and a median home value of $164,800.
Common Questions
What is the Total Population of Houston?
Total Population of Houston is 426.
What is the Total Male Population of Houston?
Total Male Population of Houston is 229.
What is the Total Female Population of Houston?
Total Female Population of Houston is 197.
What is the Ratio of Males per 100 Females in Houston?
There are 116.24 Males per 100 Females in Houston.
What is the Ratio of Females per 100 Males in Houston?
There are 86.03 Females per 100 Males in Houston.
What is the Median Population Age in Houston?
Median Population Age in Houston is 49.6 Years.
What is the Average Family Size in Houston
Average Family Size in Houston is 2.2 People.
What is the Average Household Size in Houston
Average Household Size in Houston is 2.0 People.
What is Per Capita Income in Houston?
Per Capita income in Houston is $45,092.
What is the Median Family Income in Houston?
Median Family Income in Houston is $97,500.
What is the Median Household income in Houston?
Median Household Income in Houston is $92,500.
What is Income or Wage Gap in Houston?
Income or Wage Gap in Houston is 60.2%.
Women in Houston earn 39.8 cents for every dollar earned by a man.
What is Inequality or Gini Index in Houston?
Inequality or Gini Index in Houston is 0.39.
How Large is the Labor Force in Houston?
There are 279 People in the Labor Forcein in Houston.
What is the Percentage of People in the Labor Force in Houston?
71.9% of People are in the Labor Force in Houston.
What is the Unemployment Rate in Houston?
Unemployment Rate in Houston is 8.4%.