Milton, DE
Milton Map
Milton Overview
3,349
TOTAL POPULATION
1,409
MALE POPULATION
1,940
FEMALE POPULATION
72.63
MALES / 100 FEMALES
137.69
FEMALES / 100 MALES
48.2
MEDIAN AGE
2.9
AVG FAMILY SIZE
2.3
AVG HOUSEHOLD SIZE
$35,412
PER CAPITA INCOME
$79,893
AVG FAMILY INCOME
$67,763
AVG HOUSEHOLD INCOME
10.3%
WAGE / INCOME GAP [ % ]
89.7¢/ $1
WAGE / INCOME GAP [ $ ]
0.45
INEQUALITY / GINI INDEX
1,185
LABOR FORCE [ PEOPLE ]
44.3%
PERCENT IN LABOR FORCE
7.4%
UNEMPLOYMENT RATE
Milton Zip Codes
Milton Area Codes
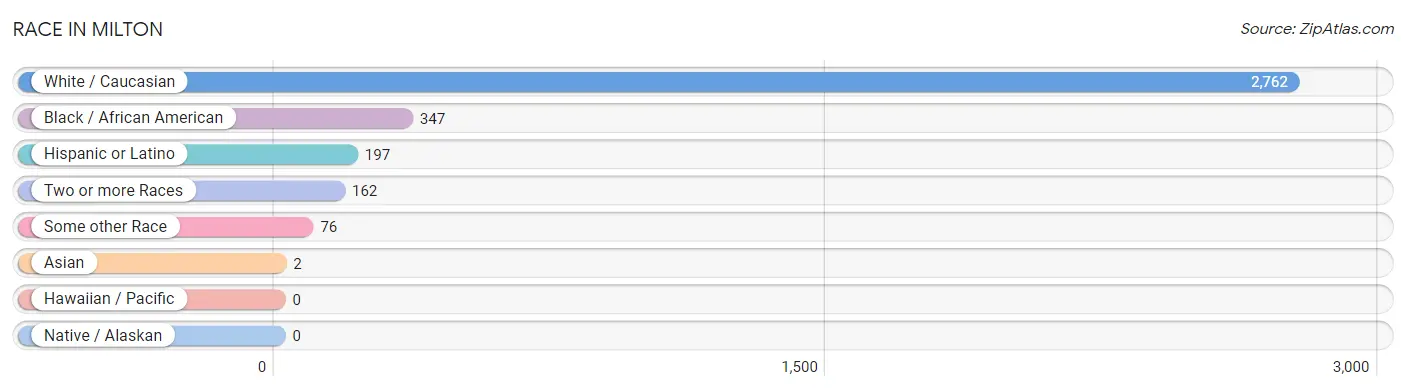
Race in Milton
The most populous races in Milton are White / Caucasian (2,762 | 82.5%), Black / African American (347 | 10.4%), and Hispanic or Latino (197 | 5.9%).
| Race | # Population | % Population |
| Asian | 2 | 0.1% |
| Black / African American | 347 | 10.4% |
| Hawaiian / Pacific | 0 | 0.0% |
| Hispanic or Latino | 197 | 5.9% |
| Native / Alaskan | 0 | 0.0% |
| White / Caucasian | 2,762 | 82.5% |
| Two or more Races | 162 | 4.8% |
| Some other Race | 76 | 2.3% |
| Total | 3,349 | 100.0% |
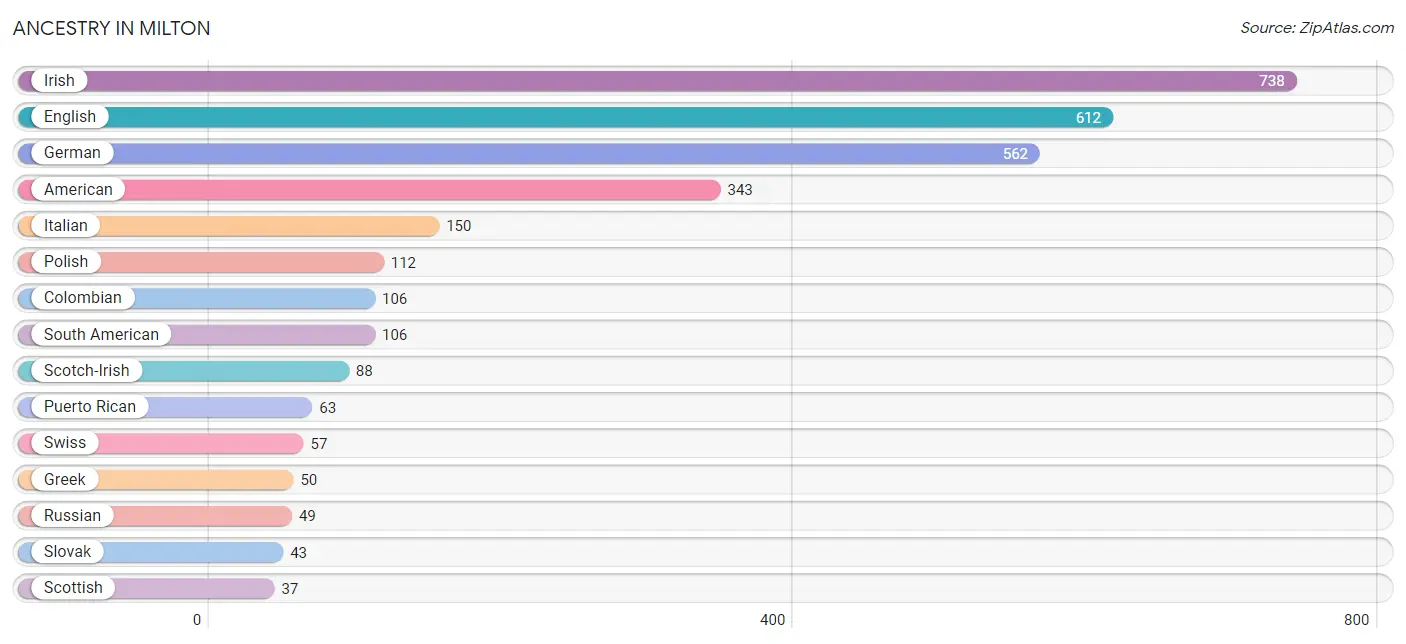
Ancestry in Milton
The most populous ancestries reported in Milton are Irish (738 | 22.0%), English (612 | 18.3%), German (562 | 16.8%), American (343 | 10.2%), and Italian (150 | 4.5%), together accounting for 71.8% of all Milton residents.
| Ancestry | # Population | % Population |
| American | 343 | 10.2% |
| Austrian | 8 | 0.2% |
| Bhutanese | 18 | 0.5% |
| Central American | 17 | 0.5% |
| Colombian | 106 | 3.2% |
| Costa Rican | 17 | 0.5% |
| Cuban | 11 | 0.3% |
| Danish | 32 | 1.0% |
| Eastern European | 9 | 0.3% |
| English | 612 | 18.3% |
| European | 16 | 0.5% |
| French | 28 | 0.8% |
| French Canadian | 8 | 0.2% |
| German | 562 | 16.8% |
| Greek | 50 | 1.5% |
| Hungarian | 14 | 0.4% |
| Irish | 738 | 22.0% |
| Iroquois | 1 | 0.0% |
| Italian | 150 | 4.5% |
| Korean | 2 | 0.1% |
| Nigerian | 12 | 0.4% |
| Polish | 112 | 3.3% |
| Portuguese | 30 | 0.9% |
| Puerto Rican | 63 | 1.9% |
| Romanian | 8 | 0.2% |
| Russian | 49 | 1.5% |
| Scotch-Irish | 88 | 2.6% |
| Scottish | 37 | 1.1% |
| Slovak | 43 | 1.3% |
| South American | 106 | 3.2% |
| Subsaharan African | 12 | 0.4% |
| Swedish | 28 | 0.8% |
| Swiss | 57 | 1.7% |
| Ukrainian | 15 | 0.4% |
| Welsh | 16 | 0.5% | View All 35 Rows |
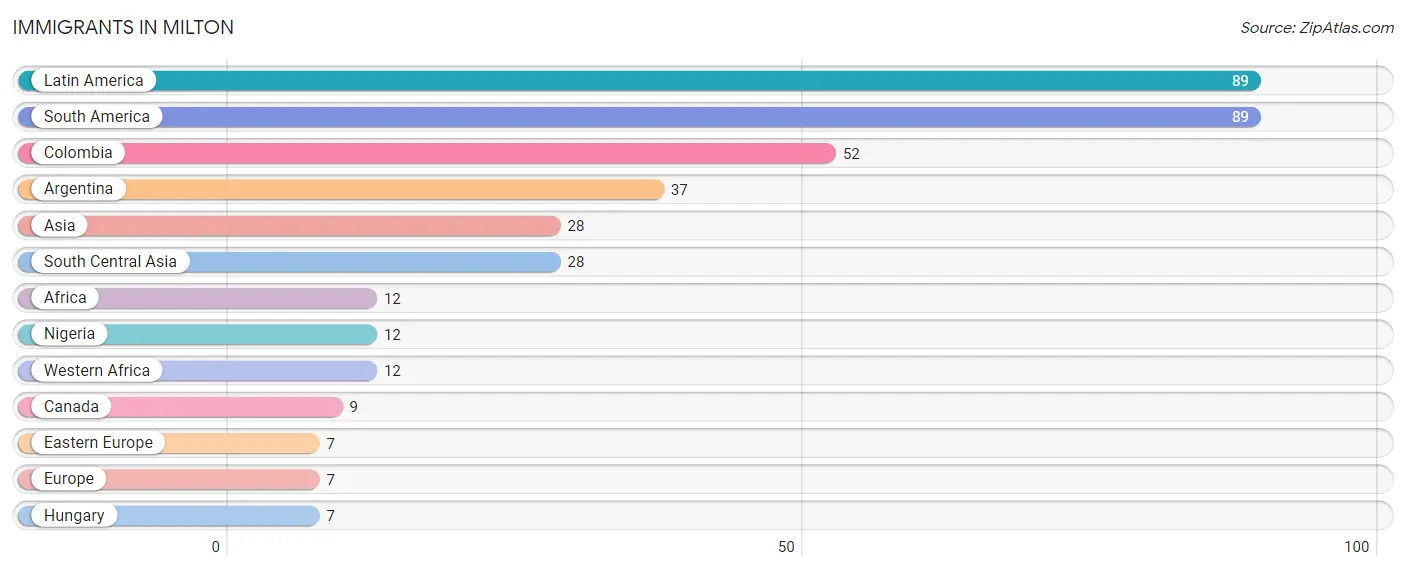
Immigrants in Milton
The most numerous immigrant groups reported in Milton came from Latin America (89 | 2.7%), South America (89 | 2.7%), Colombia (52 | 1.5%), Argentina (37 | 1.1%), and Asia (28 | 0.8%), together accounting for 8.8% of all Milton residents.
| Immigration Origin | # Population | % Population |
| Africa | 12 | 0.4% |
| Argentina | 37 | 1.1% |
| Asia | 28 | 0.8% |
| Canada | 9 | 0.3% |
| Colombia | 52 | 1.5% |
| Eastern Europe | 7 | 0.2% |
| Europe | 7 | 0.2% |
| Hungary | 7 | 0.2% |
| Latin America | 89 | 2.7% |
| Nigeria | 12 | 0.4% |
| South America | 89 | 2.7% |
| South Central Asia | 28 | 0.8% |
| Western Africa | 12 | 0.4% | View All 13 Rows |
Sex and Age in Milton
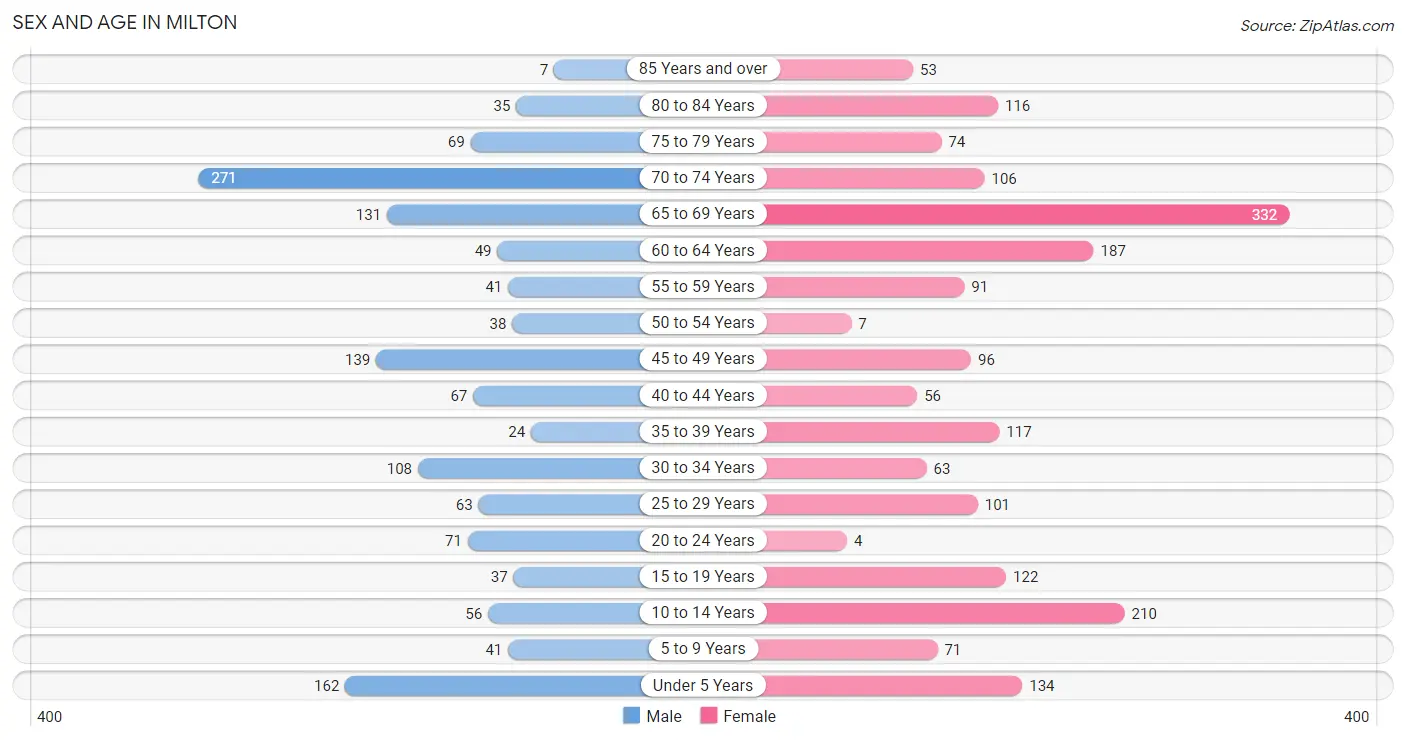
Sex and Age in Milton
The most populous age groups in Milton are 70 to 74 Years (271 | 19.2%) for men and 65 to 69 Years (332 | 17.1%) for women.
| Age Bracket | Male | Female |
| Under 5 Years | 162 (11.5%) | 134 (6.9%) |
| 5 to 9 Years | 41 (2.9%) | 71 (3.7%) |
| 10 to 14 Years | 56 (4.0%) | 210 (10.8%) |
| 15 to 19 Years | 37 (2.6%) | 122 (6.3%) |
| 20 to 24 Years | 71 (5.0%) | 4 (0.2%) |
| 25 to 29 Years | 63 (4.5%) | 101 (5.2%) |
| 30 to 34 Years | 108 (7.7%) | 63 (3.3%) |
| 35 to 39 Years | 24 (1.7%) | 117 (6.0%) |
| 40 to 44 Years | 67 (4.8%) | 56 (2.9%) |
| 45 to 49 Years | 139 (9.9%) | 96 (5.0%) |
| 50 to 54 Years | 38 (2.7%) | 7 (0.4%) |
| 55 to 59 Years | 41 (2.9%) | 91 (4.7%) |
| 60 to 64 Years | 49 (3.5%) | 187 (9.6%) |
| 65 to 69 Years | 131 (9.3%) | 332 (17.1%) |
| 70 to 74 Years | 271 (19.2%) | 106 (5.5%) |
| 75 to 79 Years | 69 (4.9%) | 74 (3.8%) |
| 80 to 84 Years | 35 (2.5%) | 116 (6.0%) |
| 85 Years and over | 7 (0.5%) | 53 (2.7%) |
| Total | 1,409 (100.0%) | 1,940 (100.0%) |
Families and Households in Milton
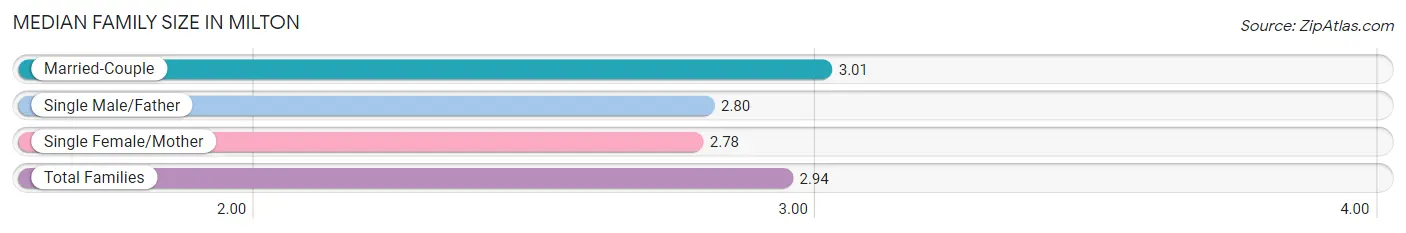
Median Family Size in Milton
The median family size in Milton is 2.94 persons per family, with married-couple families (643 | 68.8%) accounting for the largest median family size of 3.01 persons per family. On the other hand, single female/mother families (232 | 24.8%) represent the smallest median family size with 2.78 persons per family.
| Family Type | # Families | Family Size |
| Married-Couple | 643 (68.8%) | 3.01 |
| Single Male/Father | 60 (6.4%) | 2.80 |
| Single Female/Mother | 232 (24.8%) | 2.78 |
| Total Families | 935 (100.0%) | 2.94 |
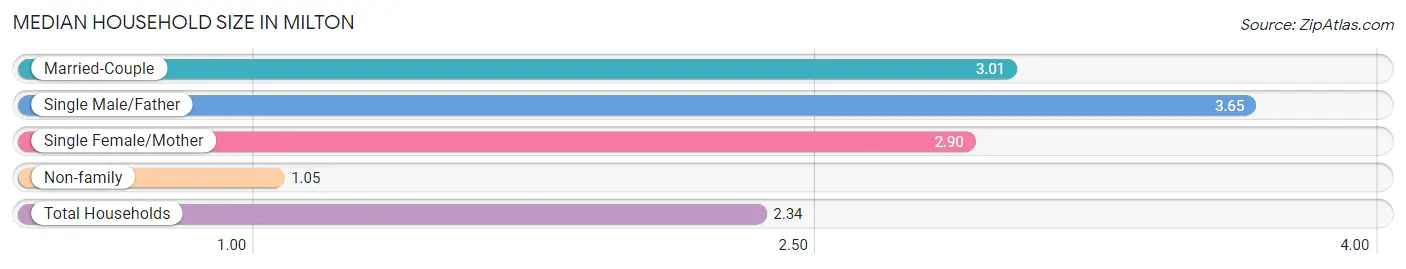
Median Household Size in Milton
The median household size in Milton is 2.34 persons per household, with single male/father households (60 | 4.2%) accounting for the largest median household size of 3.65 persons per household. non-family households (489 | 34.3%) represent the smallest median household size with 1.05 persons per household.
| Household Type | # Households | Household Size |
| Married-Couple | 643 (45.2%) | 3.01 |
| Single Male/Father | 60 (4.2%) | 3.65 |
| Single Female/Mother | 232 (16.3%) | 2.90 |
| Non-family | 489 (34.3%) | 1.05 |
| Total Households | 1,424 (100.0%) | 2.34 |
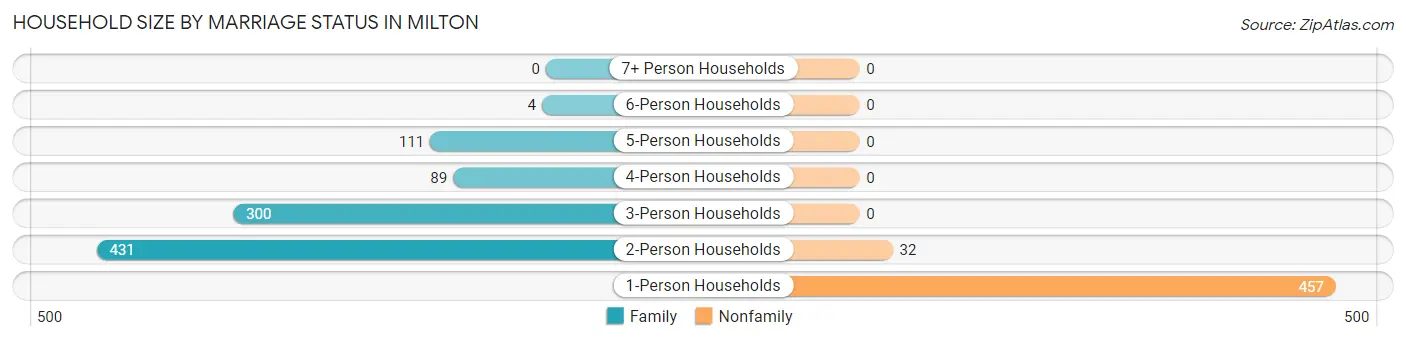
Household Size by Marriage Status in Milton
Out of a total of 1,424 households in Milton, 935 (65.7%) are family households, while 489 (34.3%) are nonfamily households. The most numerous type of family households are 2-person households, comprising 431, and the most common type of nonfamily households are 1-person households, comprising 457.
| Household Size | Family Households | Nonfamily Households |
| 1-Person Households | - | 457 (32.1%) |
| 2-Person Households | 431 (30.3%) | 32 (2.2%) |
| 3-Person Households | 300 (21.1%) | 0 (0.0%) |
| 4-Person Households | 89 (6.2%) | 0 (0.0%) |
| 5-Person Households | 111 (7.8%) | 0 (0.0%) |
| 6-Person Households | 4 (0.3%) | 0 (0.0%) |
| 7+ Person Households | 0 (0.0%) | 0 (0.0%) |
| Total | 935 (65.7%) | 489 (34.3%) |
Female Fertility in Milton
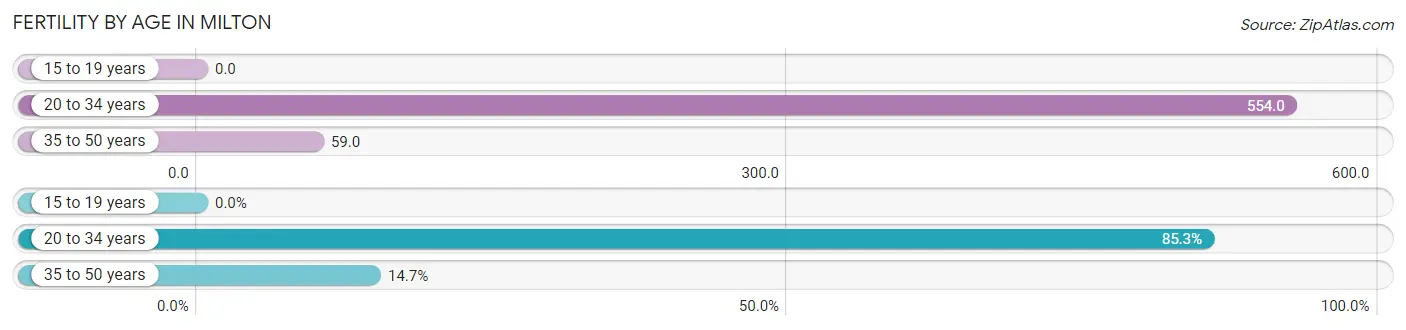
Fertility by Age in Milton
Average fertility rate in Milton is 195.0 births per 1,000 women. Women in the age bracket of 20 to 34 years have the highest fertility rate with 554.0 births per 1,000 women. Women in the age bracket of 20 to 34 years acount for 85.3% of all women with births.
| Age Bracket | Women with Births | Births / 1,000 Women |
| 15 to 19 years | 0 (0.0%) | 0.0 |
| 20 to 34 years | 93 (85.3%) | 554.0 |
| 35 to 50 years | 16 (14.7%) | 59.0 |
| Total | 109 (100.0%) | 195.0 |
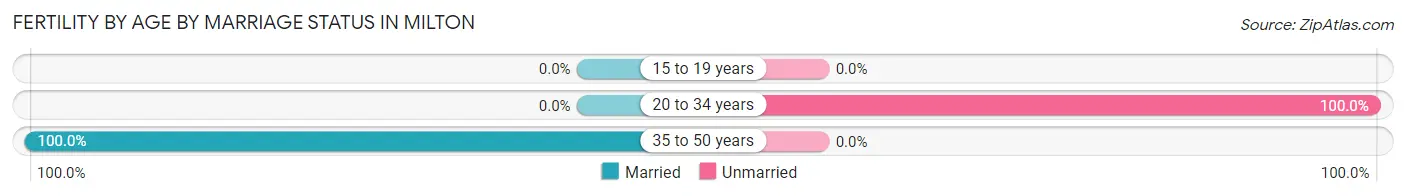
Fertility by Age by Marriage Status in Milton
14.7% of women with births (109) in Milton are married. The highest percentage of unmarried women with births falls into 20 to 34 years age bracket with 100.0% of them unmarried at the time of birth, while the lowest percentage of unmarried women with births belong to 35 to 50 years age bracket with 0.0% of them unmarried.
| Age Bracket | Married | Unmarried |
| 15 to 19 years | 0 (0.0%) | 0 (0.0%) |
| 20 to 34 years | 0 (0.0%) | 93 (100.0%) |
| 35 to 50 years | 16 (100.0%) | 0 (0.0%) |
| Total | 16 (14.7%) | 93 (85.3%) |
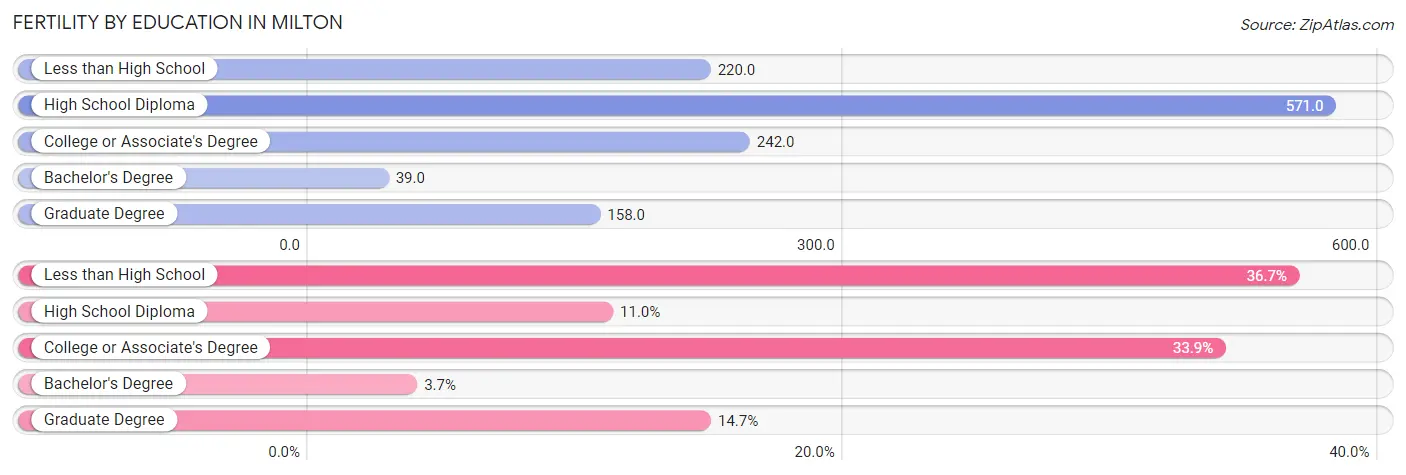
Fertility by Education in Milton
Average fertility rate in Milton is 195.0 births per 1,000 women. Women with the education attainment of high school diploma have the highest fertility rate of 571.0 births per 1,000 women, while women with the education attainment of bachelor's degree have the lowest fertility at 39.0 births per 1,000 women. Women with the education attainment of less than high school represent 36.7% of all women with births.
| Educational Attainment | Women with Births | Births / 1,000 Women |
| Less than High School | 40 (36.7%) | 220.0 |
| High School Diploma | 12 (11.0%) | 571.0 |
| College or Associate's Degree | 37 (33.9%) | 242.0 |
| Bachelor's Degree | 4 (3.7%) | 39.0 |
| Graduate Degree | 16 (14.7%) | 158.0 |
| Total | 109 (100.0%) | 195.0 |
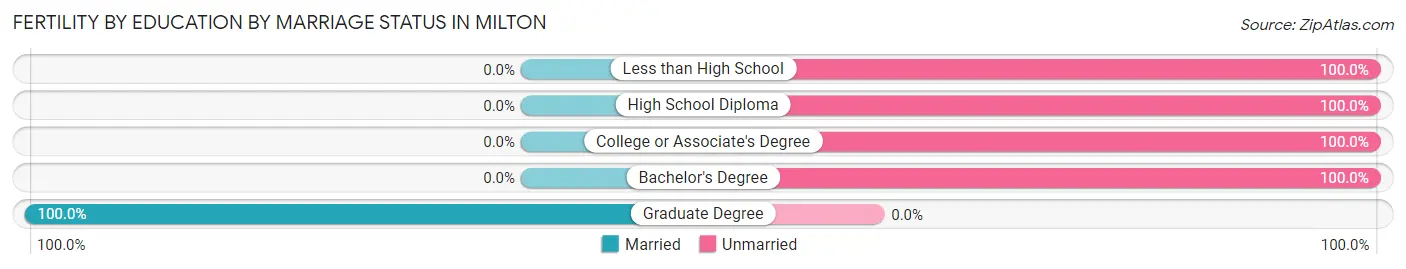
Fertility by Education by Marriage Status in Milton
85.3% of women with births in Milton are unmarried. Women with the educational attainment of graduate degree are most likely to be married with 100.0% of them married at childbirth, while women with the educational attainment of less than high school are least likely to be married with 100.0% of them unmarried at childbirth.
| Educational Attainment | Married | Unmarried |
| Less than High School | 0 (0.0%) | 40 (100.0%) |
| High School Diploma | 0 (0.0%) | 12 (100.0%) |
| College or Associate's Degree | 0 (0.0%) | 37 (100.0%) |
| Bachelor's Degree | 0 (0.0%) | 4 (100.0%) |
| Graduate Degree | 16 (100.0%) | 0 (0.0%) |
| Total | 16 (14.7%) | 93 (85.3%) |
Income in Milton
Income Overview in Milton
Per Capita Income in Milton is $35,412, while median incomes of families and households are $79,893 and $67,763 respectively.
| Characteristic | Number | Measure |
| Per Capita Income | 3,349 | $35,412 |
| Median Family Income | 935 | $79,893 |
| Mean Family Income | 935 | $99,112 |
| Median Household Income | 1,424 | $67,763 |
| Mean Household Income | 1,424 | $85,062 |
| Income Deficit | 935 | $0 |
| Wage / Income Gap (%) | 3,349 | 10.28% |
| Wage / Income Gap ($) | 3,349 | 89.72¢ per $1 |
| Gini / Inequality Index | 3,349 | 0.45 |
Earnings by Sex in Milton
Average Earnings in Milton are $29,119, $31,219 for men and $28,011 for women, a difference of 10.3%.
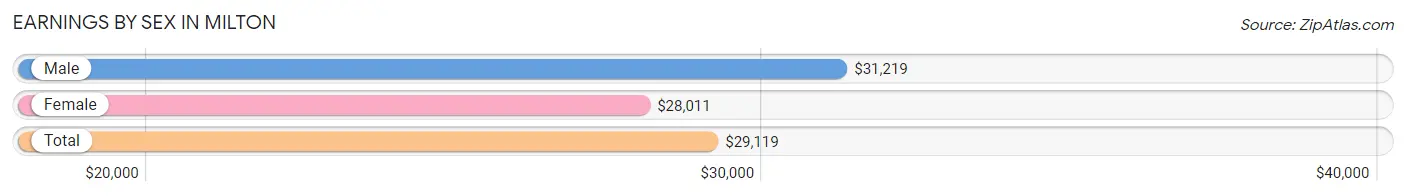
| Sex | Number | Average Earnings |
| Male | 643 (44.6%) | $31,219 |
| Female | 798 (55.4%) | $28,011 |
| Total | 1,441 (100.0%) | $29,119 |
Earnings by Sex by Income Bracket in Milton
The most common earnings brackets in Milton are $75,000 to $99,999 for men (103 | 16.0%) and $30,000 to $34,999 for women (107 | 13.4%).
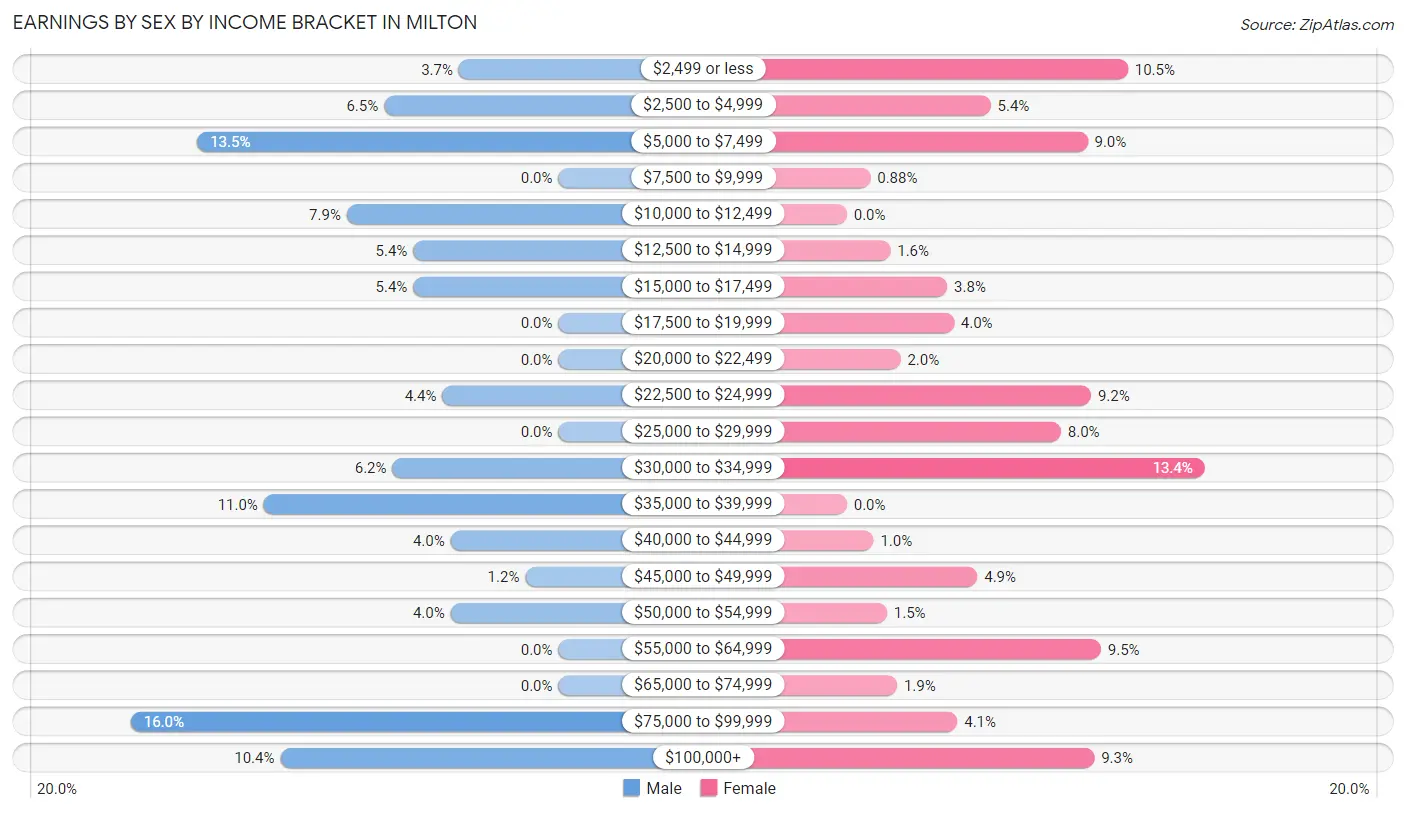
| Income | Male | Female |
| $2,499 or less | 24 (3.7%) | 84 (10.5%) |
| $2,500 to $4,999 | 42 (6.5%) | 43 (5.4%) |
| $5,000 to $7,499 | 87 (13.5%) | 72 (9.0%) |
| $7,500 to $9,999 | 0 (0.0%) | 7 (0.9%) |
| $10,000 to $12,499 | 51 (7.9%) | 0 (0.0%) |
| $12,500 to $14,999 | 35 (5.4%) | 13 (1.6%) |
| $15,000 to $17,499 | 35 (5.4%) | 30 (3.8%) |
| $17,500 to $19,999 | 0 (0.0%) | 32 (4.0%) |
| $20,000 to $22,499 | 0 (0.0%) | 16 (2.0%) |
| $22,500 to $24,999 | 28 (4.3%) | 73 (9.1%) |
| $25,000 to $29,999 | 0 (0.0%) | 64 (8.0%) |
| $30,000 to $34,999 | 40 (6.2%) | 107 (13.4%) |
| $35,000 to $39,999 | 71 (11.0%) | 0 (0.0%) |
| $40,000 to $44,999 | 26 (4.0%) | 8 (1.0%) |
| $45,000 to $49,999 | 8 (1.2%) | 39 (4.9%) |
| $50,000 to $54,999 | 26 (4.0%) | 12 (1.5%) |
| $55,000 to $64,999 | 0 (0.0%) | 76 (9.5%) |
| $65,000 to $74,999 | 0 (0.0%) | 15 (1.9%) |
| $75,000 to $99,999 | 103 (16.0%) | 33 (4.1%) |
| $100,000+ | 67 (10.4%) | 74 (9.3%) |
| Total | 643 (100.0%) | 798 (100.0%) |
Earnings by Sex by Educational Attainment in Milton
Average earnings in Milton are $35,933 for men and $31,250 for women, a difference of 13.0%. Men with an educational attainment of college or associate's degree enjoy the highest average annual earnings of $37,230, while those with high school diploma education earn the least with $35,313. Women with an educational attainment of graduate degree earn the most with the average annual earnings of $60,875, while those with less than high school education have the smallest earnings of $22,938.
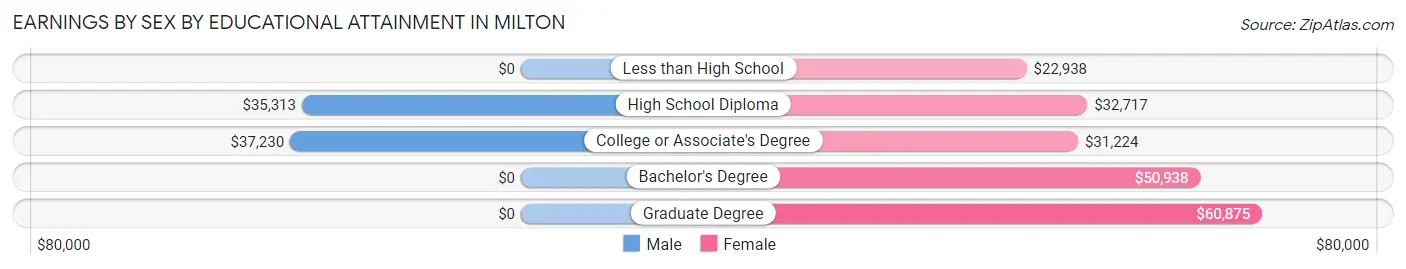
| Educational Attainment | Male Income | Female Income |
| Less than High School | - | - |
| High School Diploma | $35,313 | $32,717 |
| College or Associate's Degree | $37,230 | $31,224 |
| Bachelor's Degree | - | - |
| Graduate Degree | - | - |
| Total | $35,933 | $31,250 |
Family Income in Milton
Family Income Brackets in Milton
According to the Milton family income data, there are 201 families falling into the $100,000 to $149,999 income range, which is the most common income bracket and makes up 21.5% of all families.
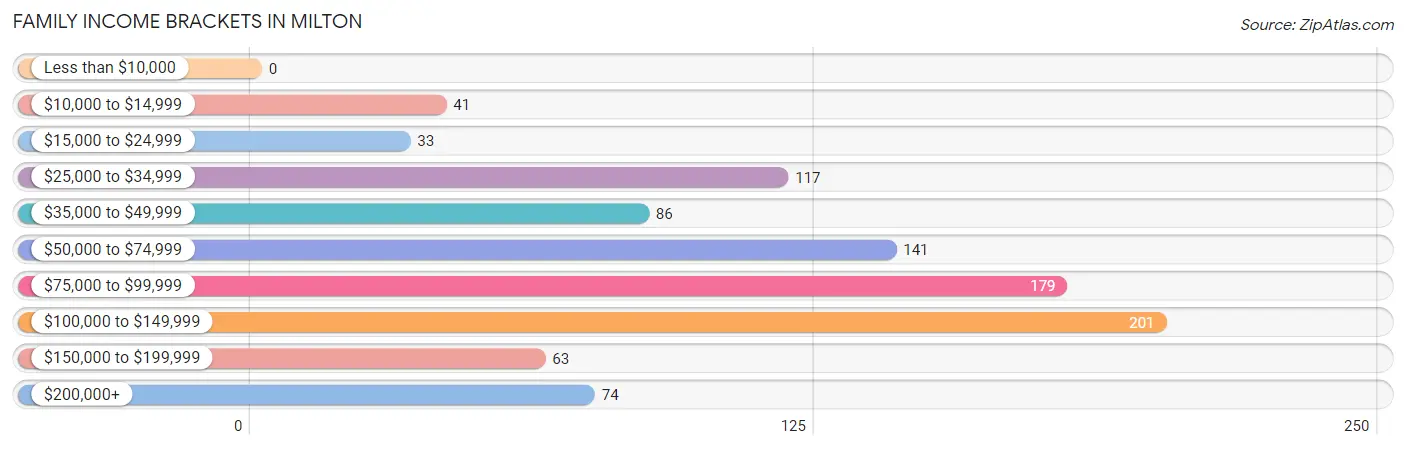
| Income Bracket | # Families | % Families |
| Less than $10,000 | 0 | 0.0% |
| $10,000 to $14,999 | 41 | 4.4% |
| $15,000 to $24,999 | 33 | 3.5% |
| $25,000 to $34,999 | 117 | 12.5% |
| $35,000 to $49,999 | 86 | 9.2% |
| $50,000 to $74,999 | 141 | 15.1% |
| $75,000 to $99,999 | 179 | 19.1% |
| $100,000 to $149,999 | 201 | 21.5% |
| $150,000 to $199,999 | 63 | 6.7% |
| $200,000+ | 74 | 7.9% |
Family Income by Famaliy Size in Milton
4-person families (125 | 13.4%) account for the highest median family income in Milton with $118,789 per family, while 2-person families (478 | 51.1%) have the highest median income of $46,250 per family member.
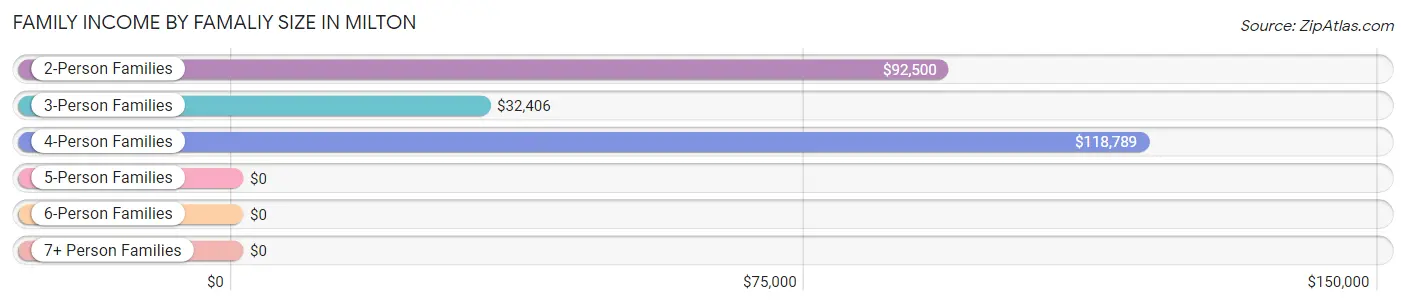
| Income Bracket | # Families | Median Income |
| 2-Person Families | 478 (51.1%) | $92,500 |
| 3-Person Families | 253 (27.1%) | $32,406 |
| 4-Person Families | 125 (13.4%) | $118,789 |
| 5-Person Families | 79 (8.5%) | $0 |
| 6-Person Families | 0 (0.0%) | $0 |
| 7+ Person Families | 0 (0.0%) | $0 |
| Total | 935 (100.0%) | $79,893 |
Family Income by Number of Earners in Milton
The median family income in Milton is $79,893, with families comprising 3+ earners (77) having the highest median family income of $209,063, while families with 1 earner (395) have the lowest median family income of $43,177, accounting for 8.2% and 42.2% of families, respectively.
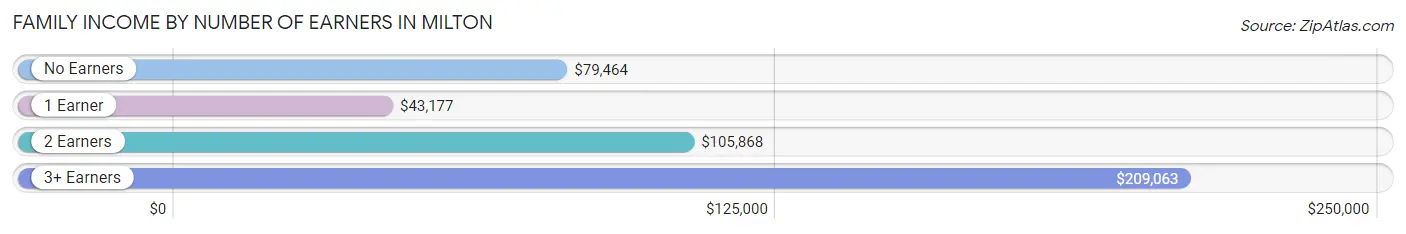
| Number of Earners | # Families | Median Income |
| No Earners | 228 (24.4%) | $79,464 |
| 1 Earner | 395 (42.2%) | $43,177 |
| 2 Earners | 235 (25.1%) | $105,868 |
| 3+ Earners | 77 (8.2%) | $209,063 |
| Total | 935 (100.0%) | $79,893 |
Household Income in Milton
Household Income Brackets in Milton
With 231 households falling in the category, the $50,000 to $74,999 income range is the most frequent in Milton, accounting for 16.2% of all households. In contrast, only 48 households (3.4%) fall into the $15,000 to $24,999 income bracket, making it the least populous group.
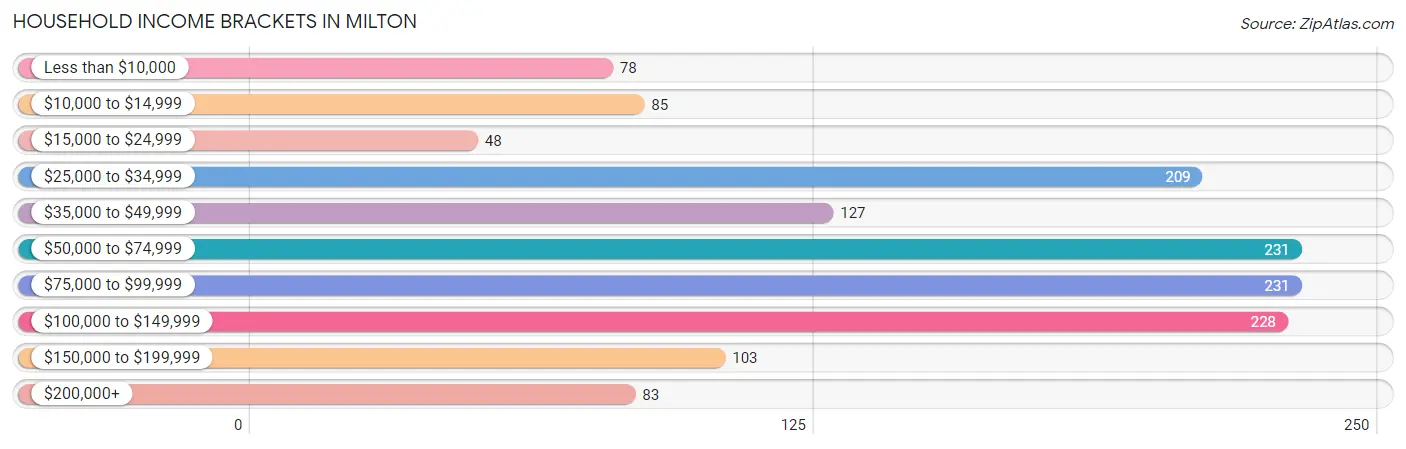
| Income Bracket | # Households | % Households |
| Less than $10,000 | 78 | 5.5% |
| $10,000 to $14,999 | 85 | 6.0% |
| $15,000 to $24,999 | 48 | 3.4% |
| $25,000 to $34,999 | 209 | 14.7% |
| $35,000 to $49,999 | 127 | 8.9% |
| $50,000 to $74,999 | 231 | 16.2% |
| $75,000 to $99,999 | 231 | 16.2% |
| $100,000 to $149,999 | 228 | 16.0% |
| $150,000 to $199,999 | 103 | 7.2% |
| $200,000+ | 83 | 5.8% |
Household Income by Householder Age in Milton
The median household income in Milton is $67,763, with the highest median household income of $79,167 found in the 45 to 64 years age bracket for the primary householder. A total of 368 households (25.8%) fall into this category.
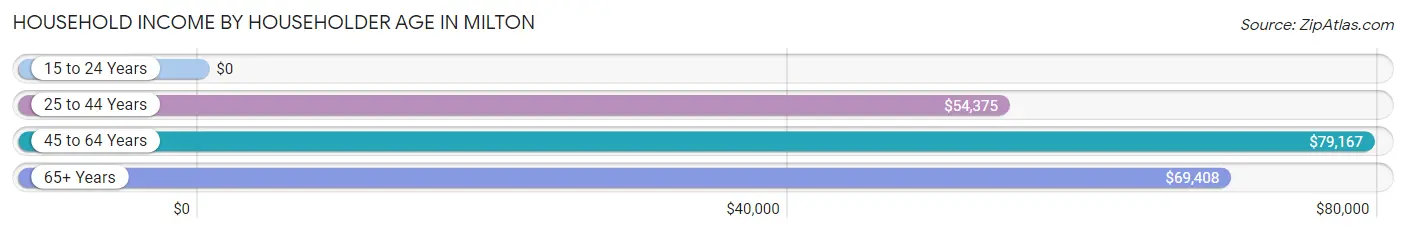
| Income Bracket | # Households | Median Income |
| 15 to 24 Years | 0 (0.0%) | $0 |
| 25 to 44 Years | 331 (23.2%) | $54,375 |
| 45 to 64 Years | 368 (25.8%) | $79,167 |
| 65+ Years | 725 (50.9%) | $69,408 |
| Total | 1,424 (100.0%) | $67,763 |
Poverty in Milton
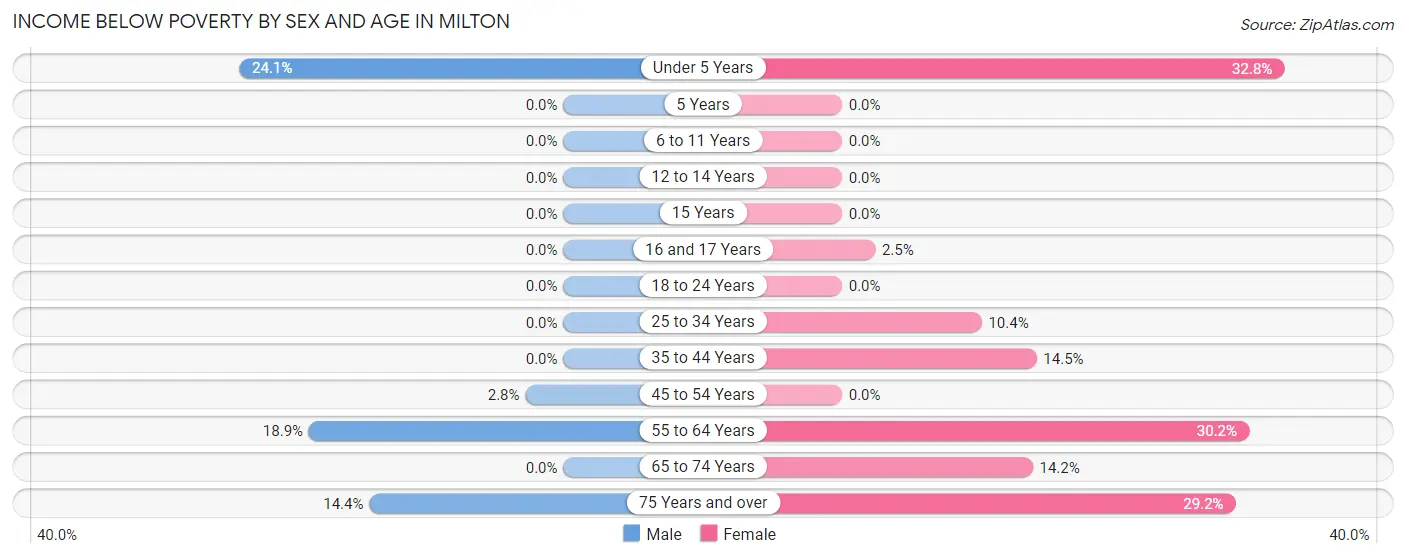
Income Below Poverty by Sex and Age in Milton
With 5.5% poverty level for males and 15.8% for females among the residents of Milton, under 5 year old males and under 5 year old females are the most vulnerable to poverty, with 39 males (24.1%) and 44 females (32.8%) in their respective age groups living below the poverty level.
| Age Bracket | Male | Female |
| Under 5 Years | 39 (24.1%) | 44 (32.8%) |
| 5 Years | 0 (0.0%) | 0 (0.0%) |
| 6 to 11 Years | 0 (0.0%) | 0 (0.0%) |
| 12 to 14 Years | 0 (0.0%) | 0 (0.0%) |
| 15 Years | 0 (0.0%) | 0 (0.0%) |
| 16 and 17 Years | 0 (0.0%) | 3 (2.5%) |
| 18 to 24 Years | 0 (0.0%) | 0 (0.0%) |
| 25 to 34 Years | 0 (0.0%) | 17 (10.4%) |
| 35 to 44 Years | 0 (0.0%) | 25 (14.4%) |
| 45 to 54 Years | 5 (2.8%) | 0 (0.0%) |
| 55 to 64 Years | 17 (18.9%) | 84 (30.2%) |
| 65 to 74 Years | 0 (0.0%) | 62 (14.2%) |
| 75 Years and over | 16 (14.4%) | 71 (29.2%) |
| Total | 77 (5.5%) | 306 (15.8%) |
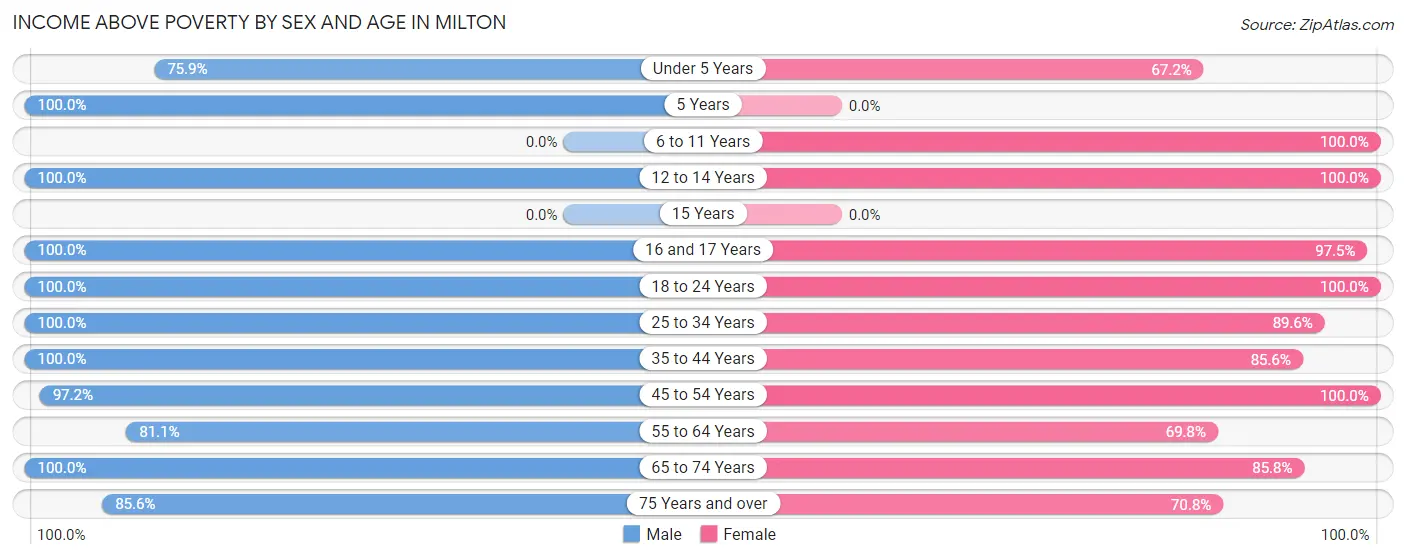
Income Above Poverty by Sex and Age in Milton
According to the poverty statistics in Milton, males aged 5 years and females aged 6 to 11 years are the age groups that are most secure financially, with 100.0% of males and 100.0% of females in these age groups living above the poverty line.
| Age Bracket | Male | Female |
| Under 5 Years | 123 (75.9%) | 90 (67.2%) |
| 5 Years | 41 (100.0%) | 0 (0.0%) |
| 6 to 11 Years | 0 (0.0%) | 139 (100.0%) |
| 12 to 14 Years | 56 (100.0%) | 142 (100.0%) |
| 15 Years | 0 (0.0%) | 0 (0.0%) |
| 16 and 17 Years | 30 (100.0%) | 119 (97.5%) |
| 18 to 24 Years | 78 (100.0%) | 4 (100.0%) |
| 25 to 34 Years | 171 (100.0%) | 147 (89.6%) |
| 35 to 44 Years | 91 (100.0%) | 148 (85.6%) |
| 45 to 54 Years | 172 (97.2%) | 103 (100.0%) |
| 55 to 64 Years | 73 (81.1%) | 194 (69.8%) |
| 65 to 74 Years | 402 (100.0%) | 376 (85.8%) |
| 75 Years and over | 95 (85.6%) | 172 (70.8%) |
| Total | 1,332 (94.5%) | 1,634 (84.2%) |
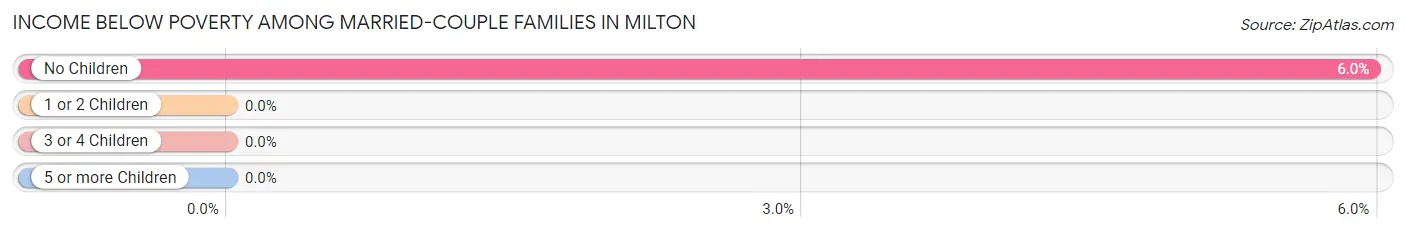
Income Below Poverty Among Married-Couple Families in Milton
The poverty statistics for married-couple families in Milton show that 4.3% or 28 of the total 643 families live below the poverty line. Families with no children have the highest poverty rate of 6.0%, comprising of 28 families. On the other hand, families with 1 or 2 children have the lowest poverty rate of 0.0%, which includes 0 families.
| Children | Above Poverty | Below Poverty |
| No Children | 441 (94.0%) | 28 (6.0%) |
| 1 or 2 Children | 95 (100.0%) | 0 (0.0%) |
| 3 or 4 Children | 79 (100.0%) | 0 (0.0%) |
| 5 or more Children | 0 (0.0%) | 0 (0.0%) |
| Total | 615 (95.7%) | 28 (4.3%) |
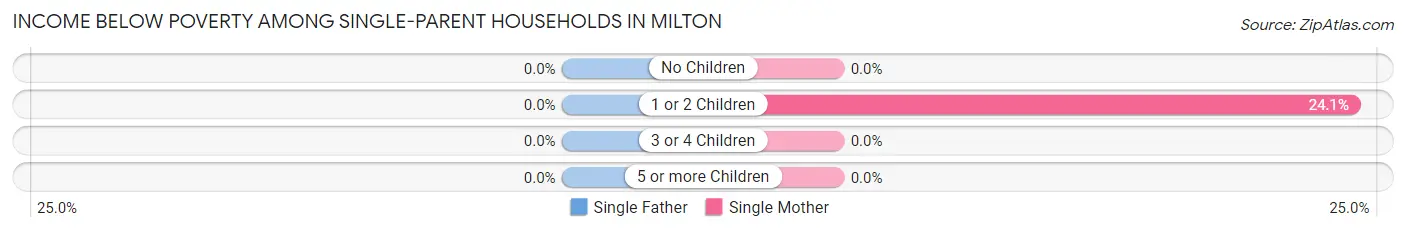
Income Below Poverty Among Single-Parent Households in Milton
| Children | Single Father | Single Mother |
| No Children | 0 (0.0%) | 0 (0.0%) |
| 1 or 2 Children | 0 (0.0%) | 46 (24.1%) |
| 3 or 4 Children | 0 (0.0%) | 0 (0.0%) |
| 5 or more Children | 0 (0.0%) | 0 (0.0%) |
| Total | 0 (0.0%) | 46 (19.8%) |
Income Below Poverty Among Married-Couple vs Single-Parent Households in Milton
The poverty data for Milton shows that 28 of the married-couple family households (4.3%) and 46 of the single-parent households (15.8%) are living below the poverty level. Within the married-couple family households, those with no children have the highest poverty rate, with 28 households (6.0%) falling below the poverty line. Among the single-parent households, those with 1 or 2 children have the highest poverty rate, with 46 household (21.0%) living below poverty.
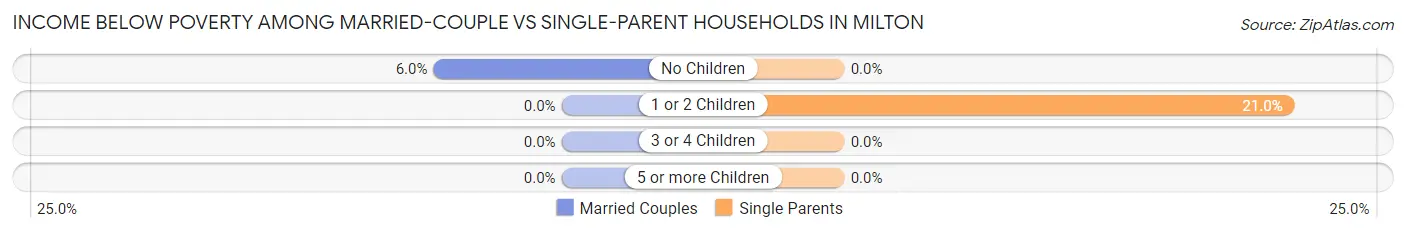
| Children | Married-Couple Families | Single-Parent Households |
| No Children | 28 (6.0%) | 0 (0.0%) |
| 1 or 2 Children | 0 (0.0%) | 46 (21.0%) |
| 3 or 4 Children | 0 (0.0%) | 0 (0.0%) |
| 5 or more Children | 0 (0.0%) | 0 (0.0%) |
| Total | 28 (4.3%) | 46 (15.8%) |
Employment Characteristics in Milton
Employment by Class of Employer in Milton
Among the 1,089 employed individuals in Milton, private company employees (714 | 65.6%), state government employees (196 | 18.0%), and self-employed (not incorporated) (60 | 5.5%) make up the most common classes of employment.
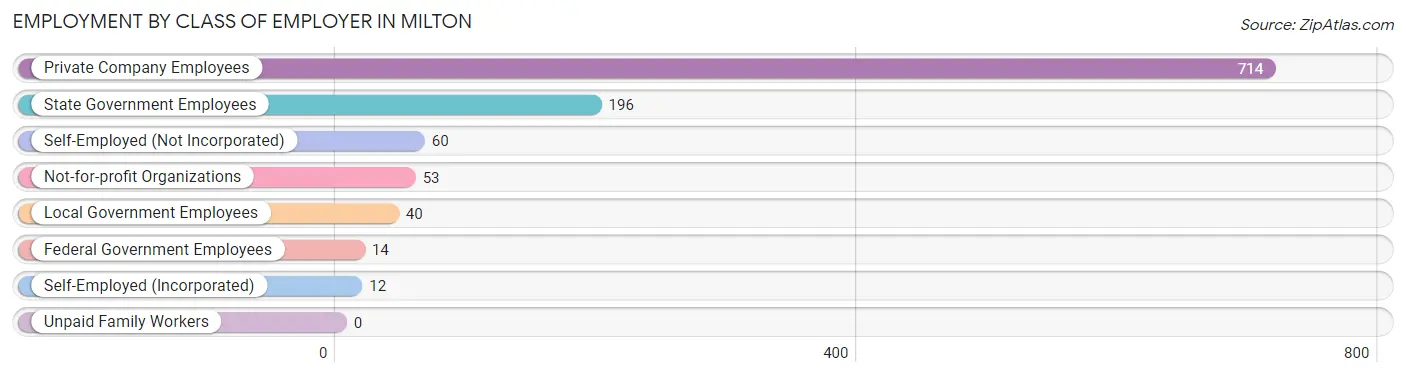
| Employer Class | # Employees | % Employees |
| Private Company Employees | 714 | 65.6% |
| Self-Employed (Incorporated) | 12 | 1.1% |
| Self-Employed (Not Incorporated) | 60 | 5.5% |
| Not-for-profit Organizations | 53 | 4.9% |
| Local Government Employees | 40 | 3.7% |
| State Government Employees | 196 | 18.0% |
| Federal Government Employees | 14 | 1.3% |
| Unpaid Family Workers | 0 | 0.0% |
| Total | 1,089 | 100.0% |
Employment Status by Age in Milton
According to the labor force statistics for Milton, out of the total population over 16 years of age (2,675), 44.3% or 1,185 individuals are in the labor force, with 7.4% or 88 of them unemployed. The age group with the highest labor force participation rate is 20 to 24 years, with 100.0% or 75 individuals in the labor force. Within the labor force, the 35 to 44 years age range has the highest percentage of unemployed individuals, with 21.8% or 53 of them being unemployed.
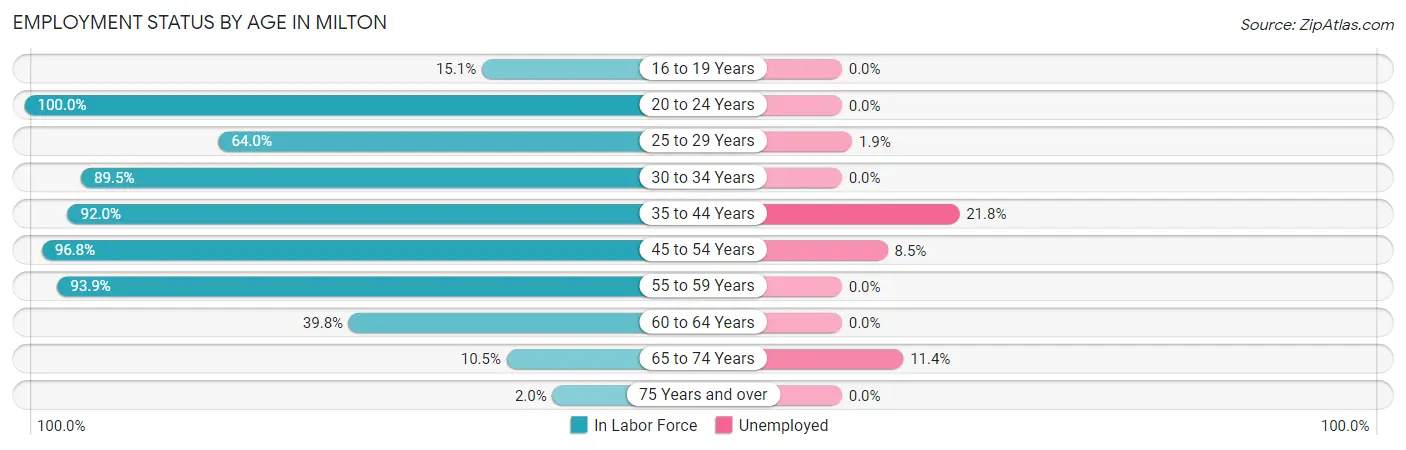
| Age Bracket | In Labor Force | Unemployed |
| 16 to 19 Years | 24 (15.1%) | 0 (0.0%) |
| 20 to 24 Years | 75 (100.0%) | 0 (0.0%) |
| 25 to 29 Years | 105 (64.0%) | 2 (1.9%) |
| 30 to 34 Years | 153 (89.5%) | 0 (0.0%) |
| 35 to 44 Years | 243 (92.0%) | 53 (21.8%) |
| 45 to 54 Years | 271 (96.8%) | 23 (8.5%) |
| 55 to 59 Years | 124 (93.9%) | 0 (0.0%) |
| 60 to 64 Years | 94 (39.8%) | 0 (0.0%) |
| 65 to 74 Years | 88 (10.5%) | 10 (11.4%) |
| 75 Years and over | 7 (2.0%) | 0 (0.0%) |
| Total | 1,185 (44.3%) | 88 (7.4%) |
Employment Status by Educational Attainment in Milton
According to labor force statistics for Milton, 79.4% of individuals (990) out of the total population between 25 and 64 years of age (1,247) are in the labor force, with 7.9% or 78 of them being unemployed. The group with the highest labor force participation rate are those with the educational attainment of college / associate degree, with 89.6% or 301 individuals in the labor force. Within the labor force, individuals with high school diploma education have the highest percentage of unemployment, with 17.5% or 25 of them being unemployed.
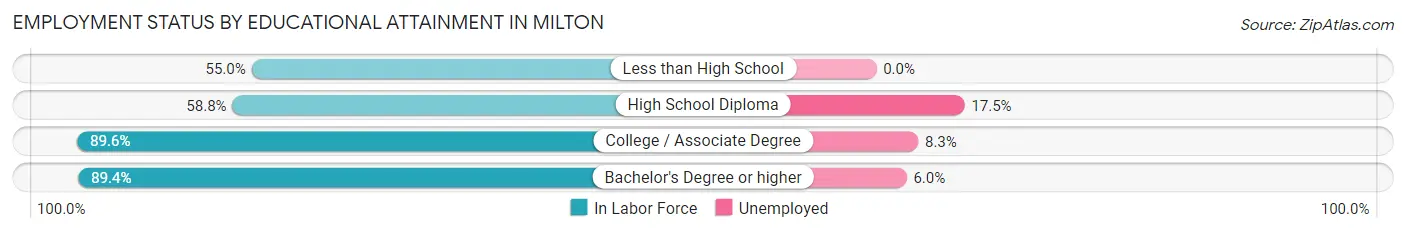
| Educational Attainment | In Labor Force | Unemployed |
| Less than High School | 82 (55.0%) | 0 (0.0%) |
| High School Diploma | 143 (58.8%) | 43 (17.5%) |
| College / Associate Degree | 301 (89.6%) | 28 (8.3%) |
| Bachelor's Degree or higher | 464 (89.4%) | 31 (6.0%) |
| Total | 990 (79.4%) | 99 (7.9%) |
Employment Occupations by Sex in Milton
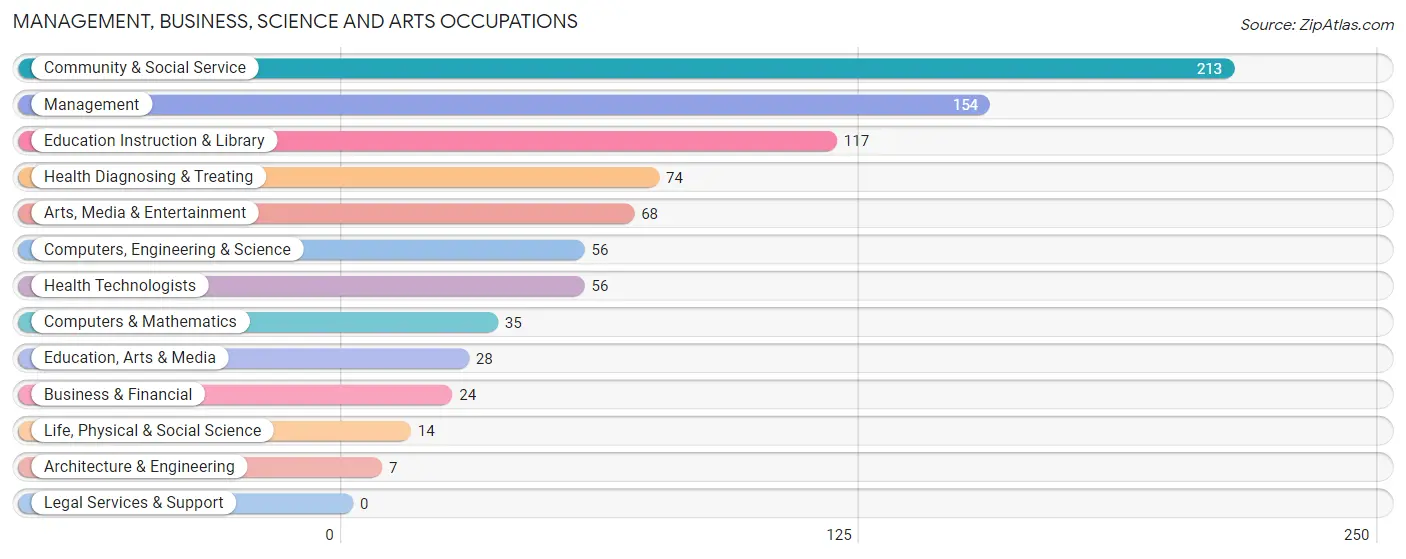
Management, Business, Science and Arts Occupations
The most common Management, Business, Science and Arts occupations in Milton are Community & Social Service (213 | 19.4%), Management (154 | 14.1%), Education Instruction & Library (117 | 10.7%), Health Diagnosing & Treating (74 | 6.8%), and Arts, Media & Entertainment (68 | 6.2%).
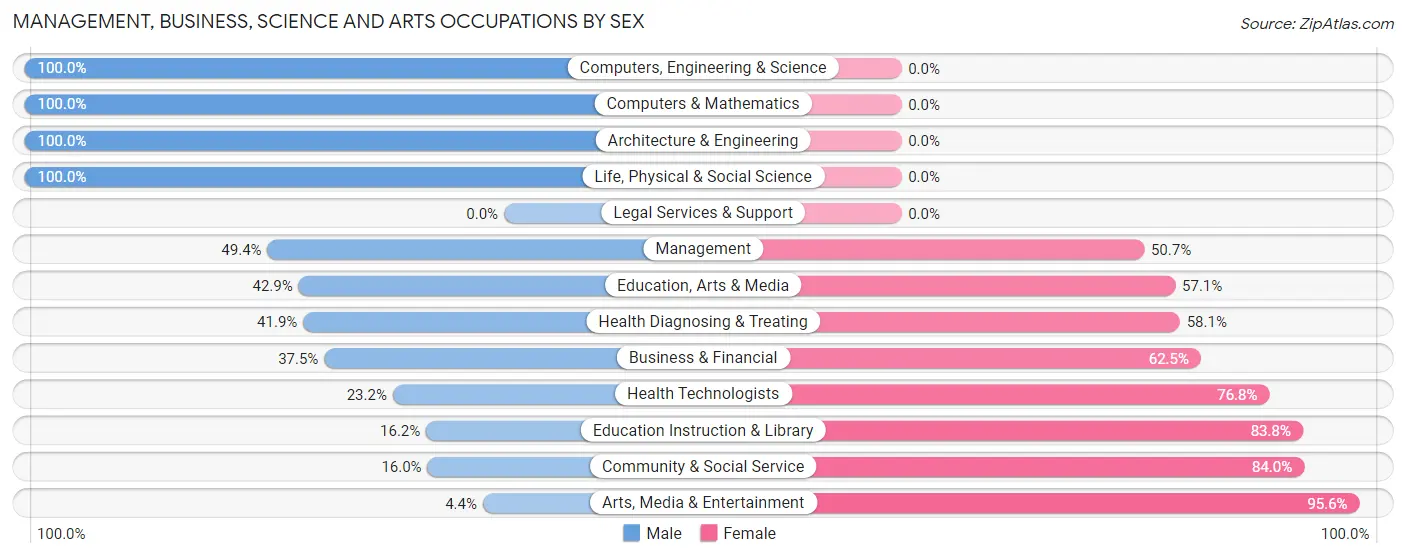
Management, Business, Science and Arts Occupations by Sex
Within the Management, Business, Science and Arts occupations in Milton, the most male-oriented occupations are Computers, Engineering & Science (100.0%), Computers & Mathematics (100.0%), and Architecture & Engineering (100.0%), while the most female-oriented occupations are Arts, Media & Entertainment (95.6%), Community & Social Service (84.0%), and Education Instruction & Library (83.8%).
| Occupation | Male | Female |
| Management | 76 (49.3%) | 78 (50.6%) |
| Business & Financial | 9 (37.5%) | 15 (62.5%) |
| Computers, Engineering & Science | 56 (100.0%) | 0 (0.0%) |
| Computers & Mathematics | 35 (100.0%) | 0 (0.0%) |
| Architecture & Engineering | 7 (100.0%) | 0 (0.0%) |
| Life, Physical & Social Science | 14 (100.0%) | 0 (0.0%) |
| Community & Social Service | 34 (16.0%) | 179 (84.0%) |
| Education, Arts & Media | 12 (42.9%) | 16 (57.1%) |
| Legal Services & Support | 0 (0.0%) | 0 (0.0%) |
| Education Instruction & Library | 19 (16.2%) | 98 (83.8%) |
| Arts, Media & Entertainment | 3 (4.4%) | 65 (95.6%) |
| Health Diagnosing & Treating | 31 (41.9%) | 43 (58.1%) |
| Health Technologists | 13 (23.2%) | 43 (76.8%) |
| Total (Category) | 206 (39.5%) | 315 (60.5%) |
| Total (Overall) | 525 (47.9%) | 571 (52.1%) |
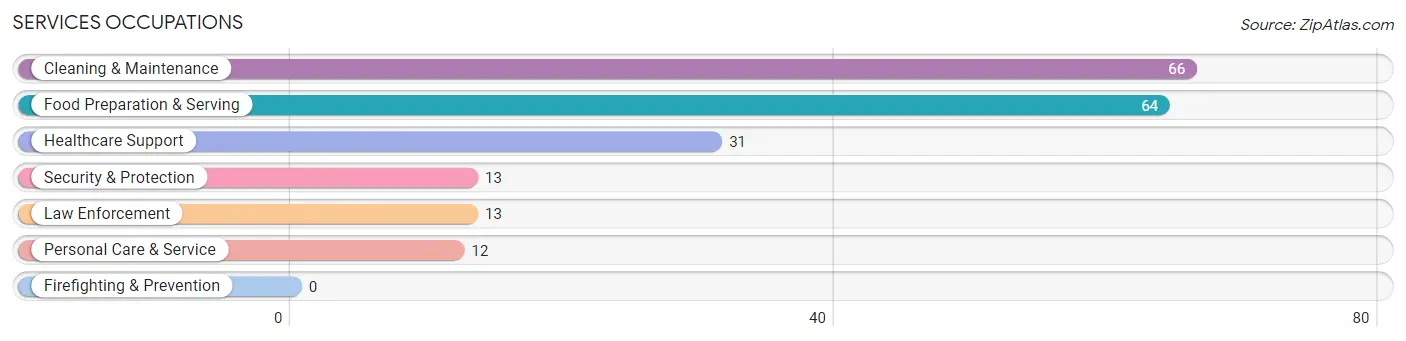
Services Occupations
The most common Services occupations in Milton are Cleaning & Maintenance (66 | 6.0%), Food Preparation & Serving (64 | 5.8%), Healthcare Support (31 | 2.8%), Security & Protection (13 | 1.2%), and Law Enforcement (13 | 1.2%).
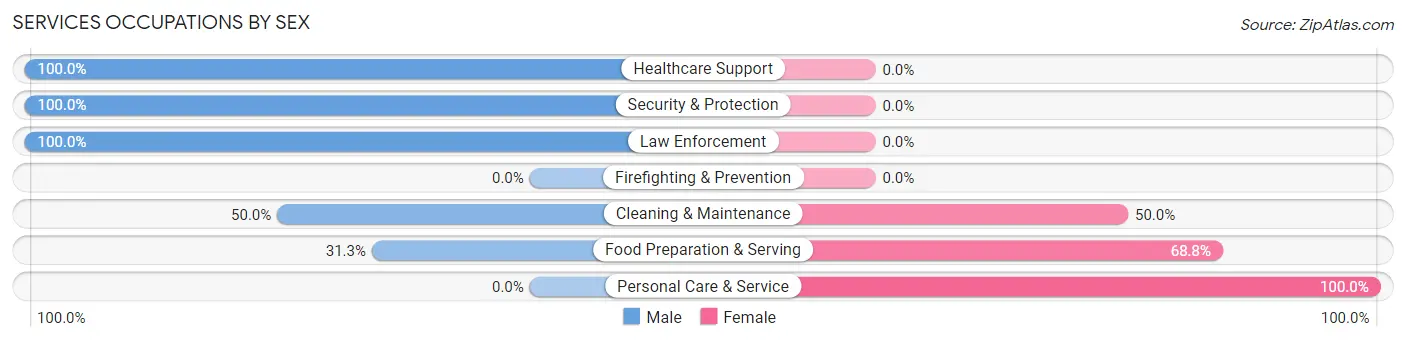
Services Occupations by Sex
Within the Services occupations in Milton, the most male-oriented occupations are Healthcare Support (100.0%), Security & Protection (100.0%), and Law Enforcement (100.0%), while the most female-oriented occupations are Personal Care & Service (100.0%), Food Preparation & Serving (68.8%), and Cleaning & Maintenance (50.0%).
| Occupation | Male | Female |
| Healthcare Support | 31 (100.0%) | 0 (0.0%) |
| Security & Protection | 13 (100.0%) | 0 (0.0%) |
| Firefighting & Prevention | 0 (0.0%) | 0 (0.0%) |
| Law Enforcement | 13 (100.0%) | 0 (0.0%) |
| Food Preparation & Serving | 20 (31.2%) | 44 (68.8%) |
| Cleaning & Maintenance | 33 (50.0%) | 33 (50.0%) |
| Personal Care & Service | 0 (0.0%) | 12 (100.0%) |
| Total (Category) | 97 (52.1%) | 89 (47.8%) |
| Total (Overall) | 525 (47.9%) | 571 (52.1%) |
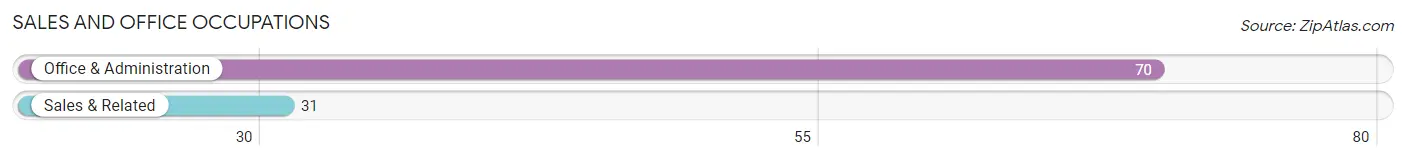
Sales and Office Occupations
The most common Sales and Office occupations in Milton are Office & Administration (70 | 6.4%), and Sales & Related (31 | 2.8%).
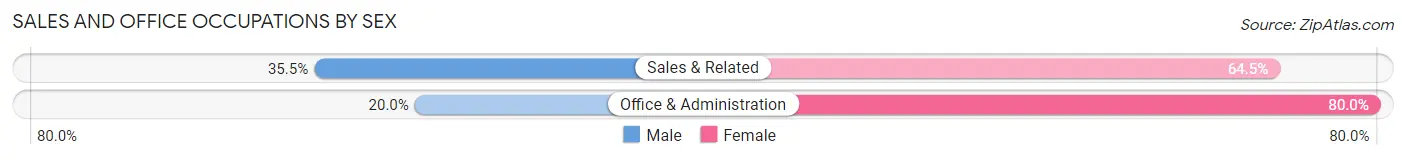
Sales and Office Occupations by Sex
| Occupation | Male | Female |
| Sales & Related | 11 (35.5%) | 20 (64.5%) |
| Office & Administration | 14 (20.0%) | 56 (80.0%) |
| Total (Category) | 25 (24.7%) | 76 (75.2%) |
| Total (Overall) | 525 (47.9%) | 571 (52.1%) |
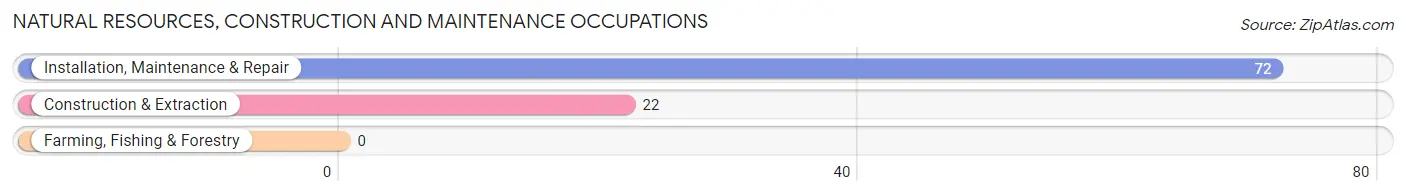
Natural Resources, Construction and Maintenance Occupations
The most common Natural Resources, Construction and Maintenance occupations in Milton are Installation, Maintenance & Repair (72 | 6.6%), and Construction & Extraction (22 | 2.0%).
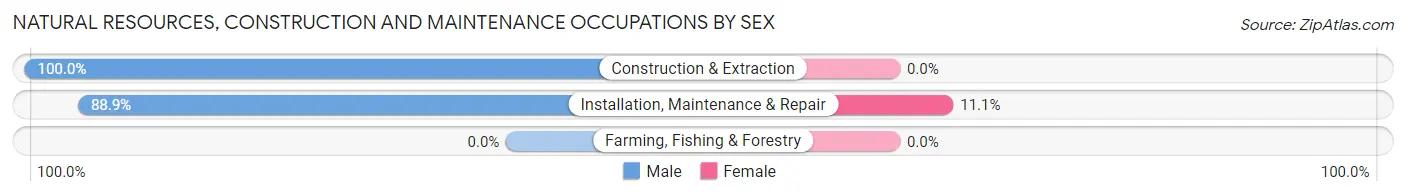
Natural Resources, Construction and Maintenance Occupations by Sex
| Occupation | Male | Female |
| Farming, Fishing & Forestry | 0 (0.0%) | 0 (0.0%) |
| Construction & Extraction | 22 (100.0%) | 0 (0.0%) |
| Installation, Maintenance & Repair | 64 (88.9%) | 8 (11.1%) |
| Total (Category) | 86 (91.5%) | 8 (8.5%) |
| Total (Overall) | 525 (47.9%) | 571 (52.1%) |
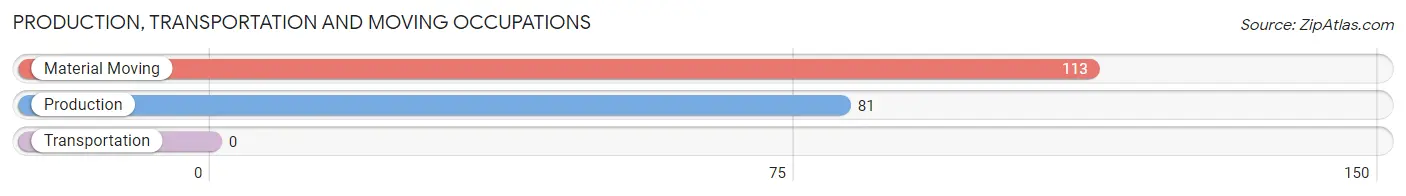
Production, Transportation and Moving Occupations
The most common Production, Transportation and Moving occupations in Milton are Material Moving (113 | 10.3%), and Production (81 | 7.4%).
Production, Transportation and Moving Occupations by Sex
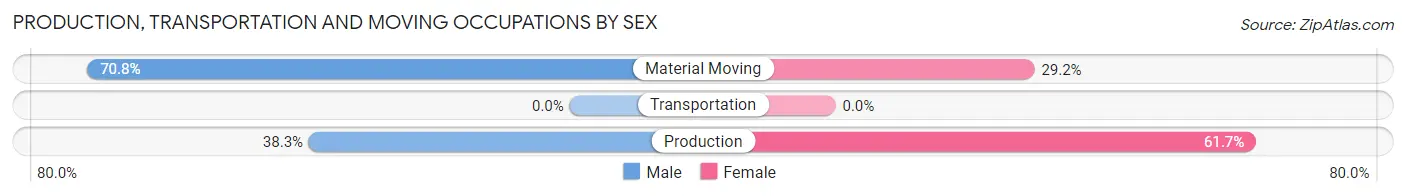
| Occupation | Male | Female |
| Production | 31 (38.3%) | 50 (61.7%) |
| Transportation | 0 (0.0%) | 0 (0.0%) |
| Material Moving | 80 (70.8%) | 33 (29.2%) |
| Total (Category) | 111 (57.2%) | 83 (42.8%) |
| Total (Overall) | 525 (47.9%) | 571 (52.1%) |
Employment Industries by Sex in Milton
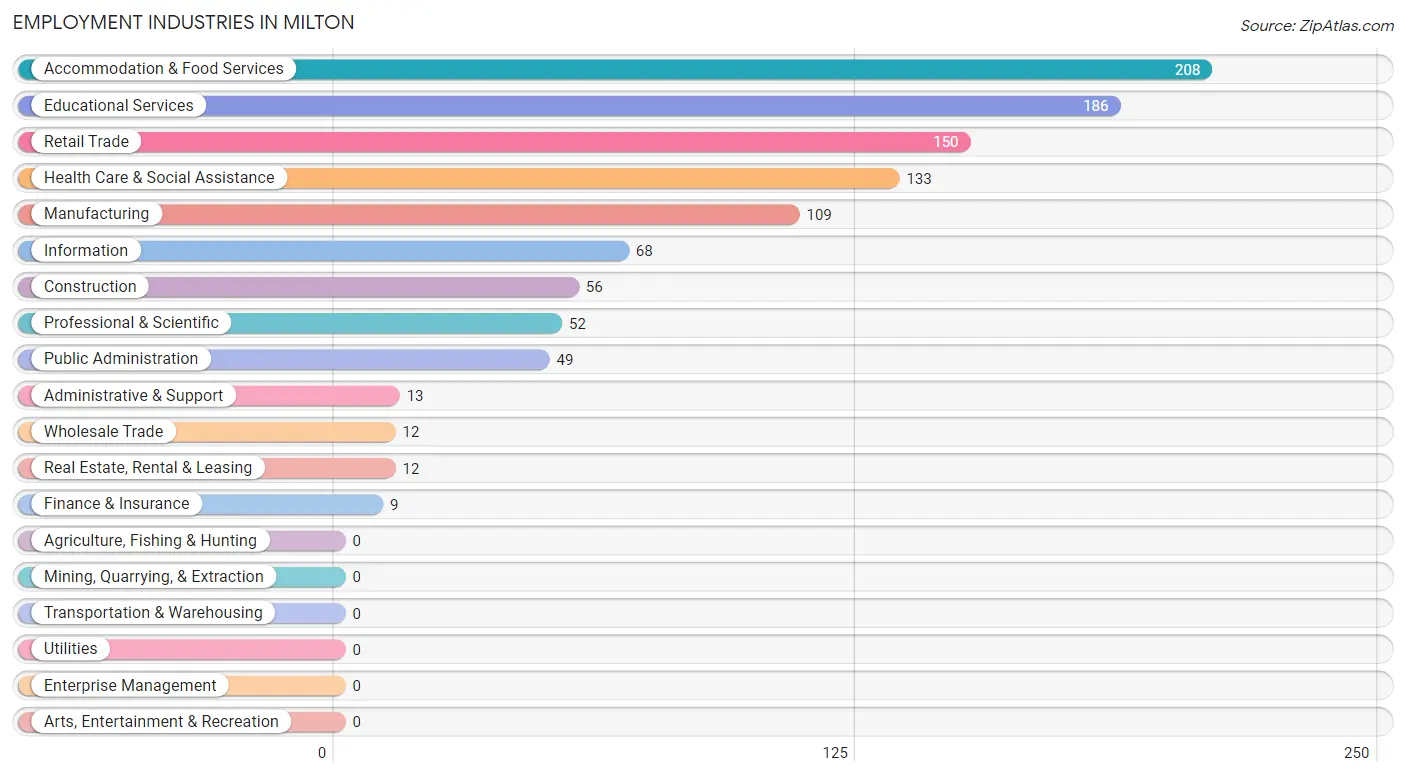
Employment Industries in Milton
The major employment industries in Milton include Accommodation & Food Services (208 | 19.0%), Educational Services (186 | 17.0%), Retail Trade (150 | 13.7%), Health Care & Social Assistance (133 | 12.1%), and Manufacturing (109 | 10.0%).
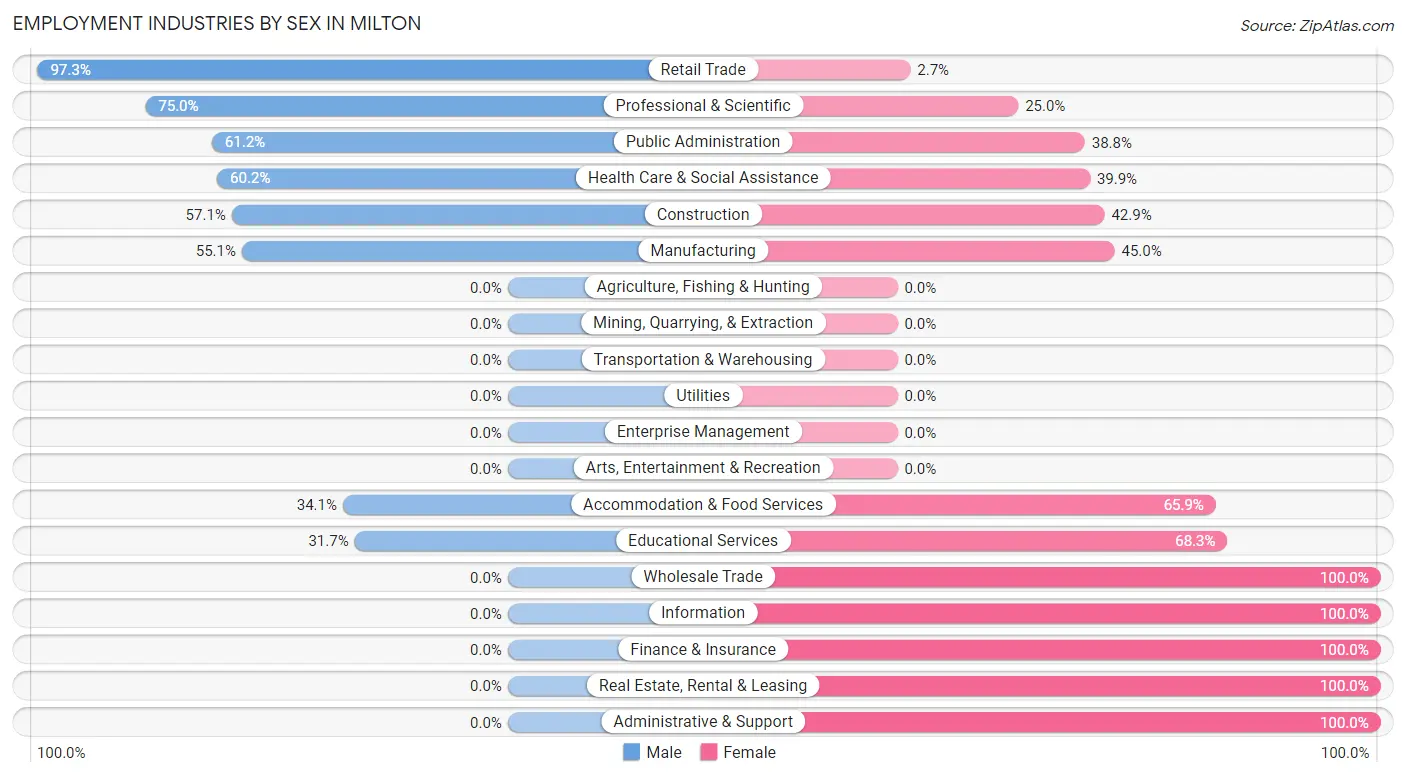
Employment Industries by Sex in Milton
The Milton industries that see more men than women are Retail Trade (97.3%), Professional & Scientific (75.0%), and Public Administration (61.2%), whereas the industries that tend to have a higher number of women are Wholesale Trade (100.0%), Information (100.0%), and Finance & Insurance (100.0%).
| Industry | Male | Female |
| Agriculture, Fishing & Hunting | 0 (0.0%) | 0 (0.0%) |
| Mining, Quarrying, & Extraction | 0 (0.0%) | 0 (0.0%) |
| Construction | 32 (57.1%) | 24 (42.9%) |
| Manufacturing | 60 (55.0%) | 49 (45.0%) |
| Wholesale Trade | 0 (0.0%) | 12 (100.0%) |
| Retail Trade | 146 (97.3%) | 4 (2.7%) |
| Transportation & Warehousing | 0 (0.0%) | 0 (0.0%) |
| Utilities | 0 (0.0%) | 0 (0.0%) |
| Information | 0 (0.0%) | 68 (100.0%) |
| Finance & Insurance | 0 (0.0%) | 9 (100.0%) |
| Real Estate, Rental & Leasing | 0 (0.0%) | 12 (100.0%) |
| Professional & Scientific | 39 (75.0%) | 13 (25.0%) |
| Enterprise Management | 0 (0.0%) | 0 (0.0%) |
| Administrative & Support | 0 (0.0%) | 13 (100.0%) |
| Educational Services | 59 (31.7%) | 127 (68.3%) |
| Health Care & Social Assistance | 80 (60.2%) | 53 (39.9%) |
| Arts, Entertainment & Recreation | 0 (0.0%) | 0 (0.0%) |
| Accommodation & Food Services | 71 (34.1%) | 137 (65.9%) |
| Public Administration | 30 (61.2%) | 19 (38.8%) |
| Total | 525 (47.9%) | 571 (52.1%) |
Education in Milton
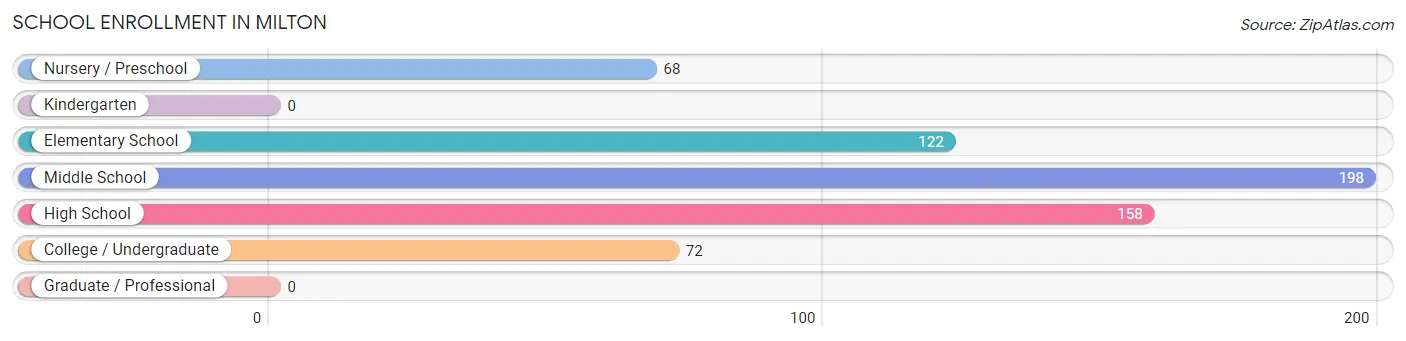
School Enrollment in Milton
The most common levels of schooling among the 618 students in Milton are middle school (198 | 32.0%), high school (158 | 25.6%), and elementary school (122 | 19.7%).
| School Level | # Students | % Students |
| Nursery / Preschool | 68 | 11.0% |
| Kindergarten | 0 | 0.0% |
| Elementary School | 122 | 19.7% |
| Middle School | 198 | 32.0% |
| High School | 158 | 25.6% |
| College / Undergraduate | 72 | 11.7% |
| Graduate / Professional | 0 | 0.0% |
| Total | 618 | 100.0% |
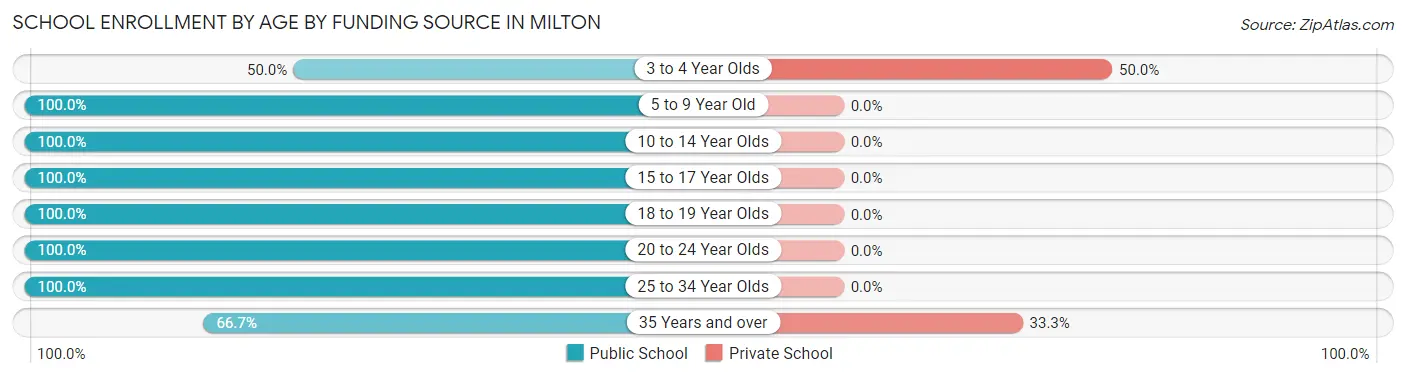
School Enrollment by Age by Funding Source in Milton
Out of a total of 618 students who are enrolled in schools in Milton, 42 (6.8%) attend a private institution, while the remaining 576 (93.2%) are enrolled in public schools. The age group of 3 to 4 year olds has the highest likelihood of being enrolled in private schools, with 34 (50.0% in the age bracket) enrolled. Conversely, the age group of 5 to 9 year old has the lowest likelihood of being enrolled in a private school, with 71 (100.0% in the age bracket) attending a public institution.
| Age Bracket | Public School | Private School |
| 3 to 4 Year Olds | 34 (50.0%) | 34 (50.0%) |
| 5 to 9 Year Old | 71 (100.0%) | 0 (0.0%) |
| 10 to 14 Year Olds | 249 (100.0%) | 0 (0.0%) |
| 15 to 17 Year Olds | 152 (100.0%) | 0 (0.0%) |
| 18 to 19 Year Olds | 6 (100.0%) | 0 (0.0%) |
| 20 to 24 Year Olds | 46 (100.0%) | 0 (0.0%) |
| 25 to 34 Year Olds | 2 (100.0%) | 0 (0.0%) |
| 35 Years and over | 16 (66.7%) | 8 (33.3%) |
| Total | 576 (93.2%) | 42 (6.8%) |
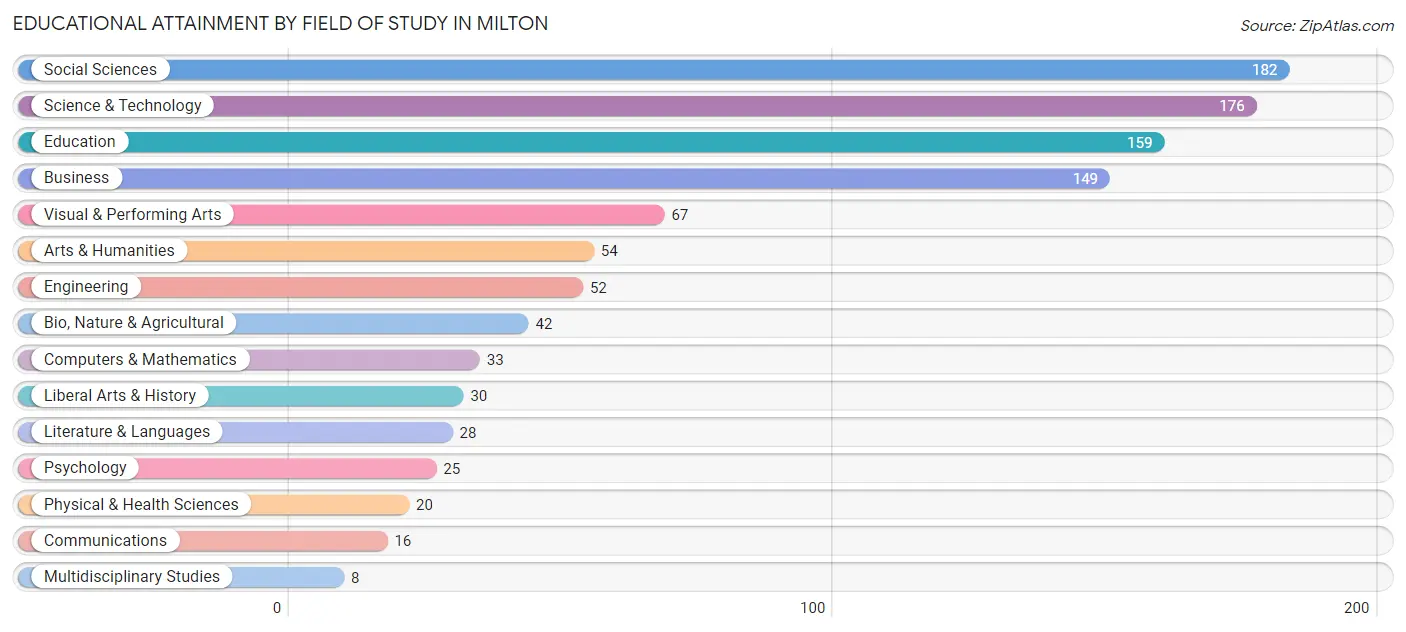
Educational Attainment by Field of Study in Milton
Social sciences (182 | 17.5%), science & technology (176 | 16.9%), education (159 | 15.3%), business (149 | 14.3%), and visual & performing arts (67 | 6.4%) are the most common fields of study among 1,041 individuals in Milton who have obtained a bachelor's degree or higher.
| Field of Study | # Graduates | % Graduates |
| Computers & Mathematics | 33 | 3.2% |
| Bio, Nature & Agricultural | 42 | 4.0% |
| Physical & Health Sciences | 20 | 1.9% |
| Psychology | 25 | 2.4% |
| Social Sciences | 182 | 17.5% |
| Engineering | 52 | 5.0% |
| Multidisciplinary Studies | 8 | 0.8% |
| Science & Technology | 176 | 16.9% |
| Business | 149 | 14.3% |
| Education | 159 | 15.3% |
| Literature & Languages | 28 | 2.7% |
| Liberal Arts & History | 30 | 2.9% |
| Visual & Performing Arts | 67 | 6.4% |
| Communications | 16 | 1.5% |
| Arts & Humanities | 54 | 5.2% |
| Total | 1,041 | 100.0% |
Transportation & Commute in Milton
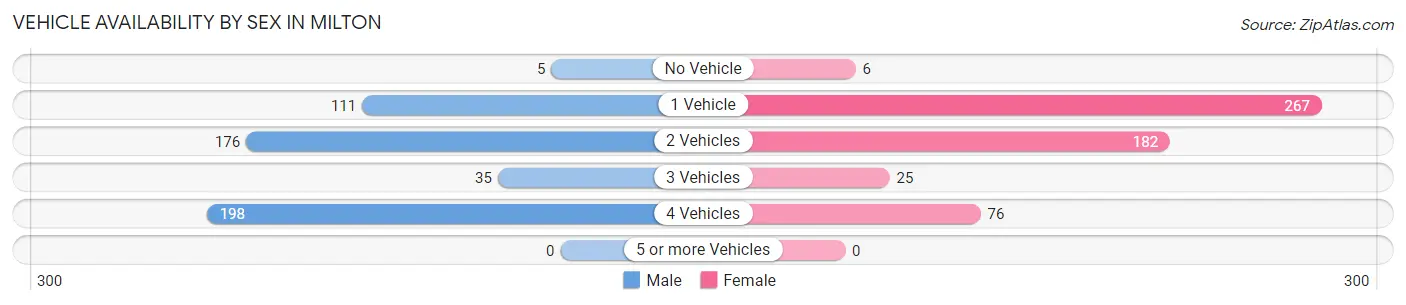
Vehicle Availability by Sex in Milton
The most prevalent vehicle ownership categories in Milton are males with 4 vehicles (198, accounting for 37.7%) and females with 4 vehicles (76, making up 35.6%).
| Vehicles Available | Male | Female |
| No Vehicle | 5 (0.9%) | 6 (1.1%) |
| 1 Vehicle | 111 (21.1%) | 267 (48.0%) |
| 2 Vehicles | 176 (33.5%) | 182 (32.7%) |
| 3 Vehicles | 35 (6.7%) | 25 (4.5%) |
| 4 Vehicles | 198 (37.7%) | 76 (13.7%) |
| 5 or more Vehicles | 0 (0.0%) | 0 (0.0%) |
| Total | 525 (100.0%) | 556 (100.0%) |
Commute Time in Milton
The most frequently occuring commute durations in Milton are 20 to 24 minutes (179 commuters, 19.1%), 30 to 34 minutes (168 commuters, 17.9%), and 15 to 19 minutes (131 commuters, 14.0%).
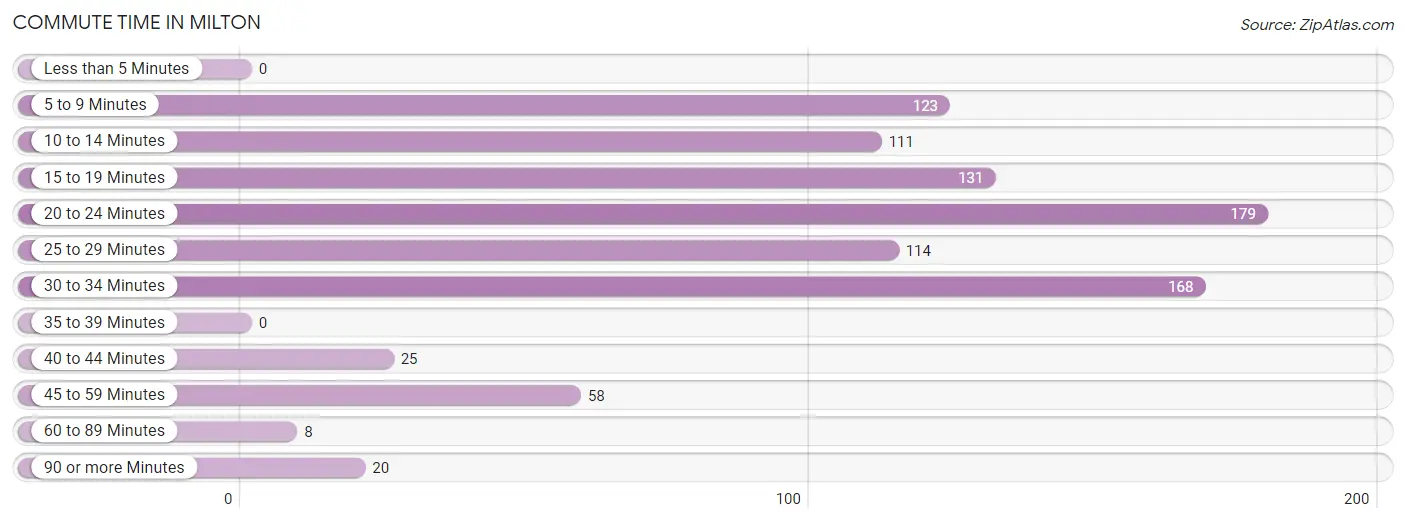
| Commute Time | # Commuters | % Commuters |
| Less than 5 Minutes | 0 | 0.0% |
| 5 to 9 Minutes | 123 | 13.1% |
| 10 to 14 Minutes | 111 | 11.8% |
| 15 to 19 Minutes | 131 | 14.0% |
| 20 to 24 Minutes | 179 | 19.1% |
| 25 to 29 Minutes | 114 | 12.2% |
| 30 to 34 Minutes | 168 | 17.9% |
| 35 to 39 Minutes | 0 | 0.0% |
| 40 to 44 Minutes | 25 | 2.7% |
| 45 to 59 Minutes | 58 | 6.2% |
| 60 to 89 Minutes | 8 | 0.9% |
| 90 or more Minutes | 20 | 2.1% |
Commute Time by Sex in Milton
The most common commute times in Milton are 10 to 14 minutes (111 commuters, 25.9%) for males and 20 to 24 minutes (132 commuters, 26.0%) for females.
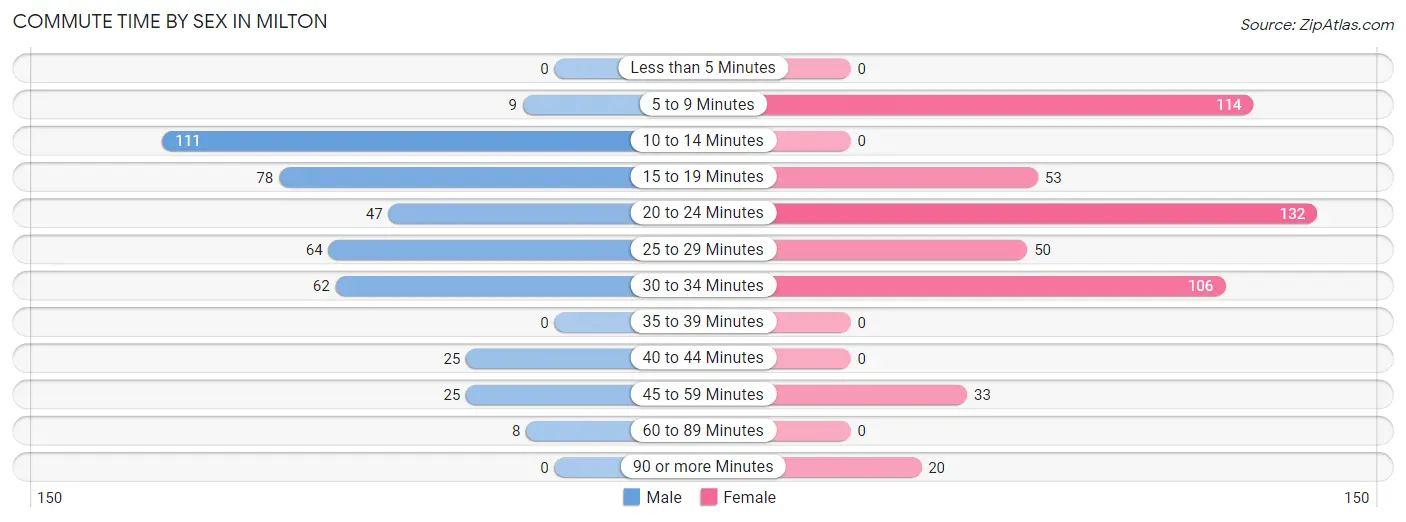
| Commute Time | Male | Female |
| Less than 5 Minutes | 0 (0.0%) | 0 (0.0%) |
| 5 to 9 Minutes | 9 (2.1%) | 114 (22.4%) |
| 10 to 14 Minutes | 111 (25.9%) | 0 (0.0%) |
| 15 to 19 Minutes | 78 (18.2%) | 53 (10.4%) |
| 20 to 24 Minutes | 47 (11.0%) | 132 (26.0%) |
| 25 to 29 Minutes | 64 (14.9%) | 50 (9.8%) |
| 30 to 34 Minutes | 62 (14.4%) | 106 (20.9%) |
| 35 to 39 Minutes | 0 (0.0%) | 0 (0.0%) |
| 40 to 44 Minutes | 25 (5.8%) | 0 (0.0%) |
| 45 to 59 Minutes | 25 (5.8%) | 33 (6.5%) |
| 60 to 89 Minutes | 8 (1.9%) | 0 (0.0%) |
| 90 or more Minutes | 0 (0.0%) | 20 (3.9%) |
Time of Departure to Work by Sex in Milton
The most frequent times of departure to work in Milton are 9:00 AM to 9:59 AM (118, 27.5%) for males and 4:00 PM to 11:59 PM (77, 15.2%) for females.
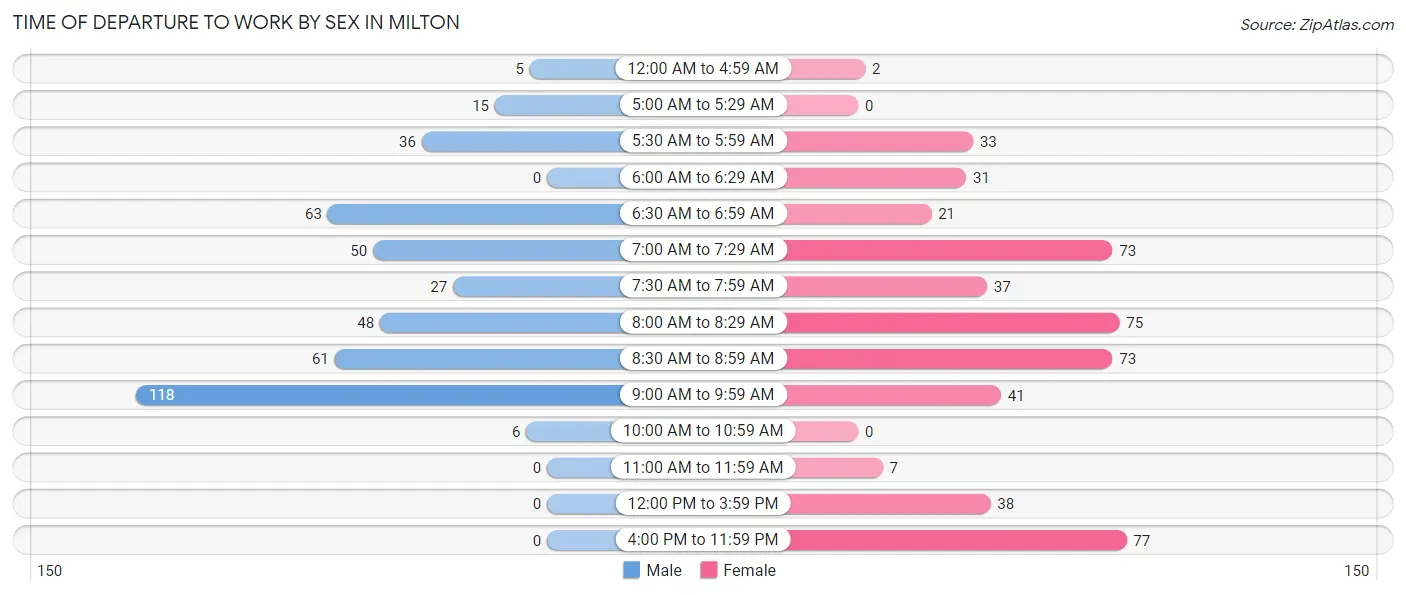
| Time of Departure | Male | Female |
| 12:00 AM to 4:59 AM | 5 (1.2%) | 2 (0.4%) |
| 5:00 AM to 5:29 AM | 15 (3.5%) | 0 (0.0%) |
| 5:30 AM to 5:59 AM | 36 (8.4%) | 33 (6.5%) |
| 6:00 AM to 6:29 AM | 0 (0.0%) | 31 (6.1%) |
| 6:30 AM to 6:59 AM | 63 (14.7%) | 21 (4.1%) |
| 7:00 AM to 7:29 AM | 50 (11.7%) | 73 (14.4%) |
| 7:30 AM to 7:59 AM | 27 (6.3%) | 37 (7.3%) |
| 8:00 AM to 8:29 AM | 48 (11.2%) | 75 (14.8%) |
| 8:30 AM to 8:59 AM | 61 (14.2%) | 73 (14.4%) |
| 9:00 AM to 9:59 AM | 118 (27.5%) | 41 (8.1%) |
| 10:00 AM to 10:59 AM | 6 (1.4%) | 0 (0.0%) |
| 11:00 AM to 11:59 AM | 0 (0.0%) | 7 (1.4%) |
| 12:00 PM to 3:59 PM | 0 (0.0%) | 38 (7.5%) |
| 4:00 PM to 11:59 PM | 0 (0.0%) | 77 (15.2%) |
| Total | 429 (100.0%) | 508 (100.0%) |
Housing Occupancy in Milton
Occupancy by Ownership in Milton
Of the total 1,424 dwellings in Milton, owner-occupied units account for 1,065 (74.8%), while renter-occupied units make up 359 (25.2%).
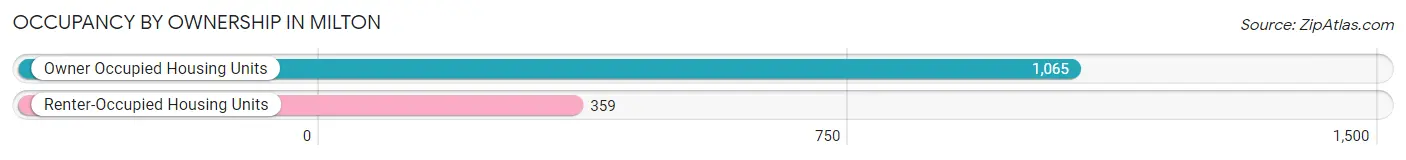
| Occupancy | # Housing Units | % Housing Units |
| Owner Occupied Housing Units | 1,065 | 74.8% |
| Renter-Occupied Housing Units | 359 | 25.2% |
| Total Occupied Housing Units | 1,424 | 100.0% |
Occupancy by Household Size in Milton
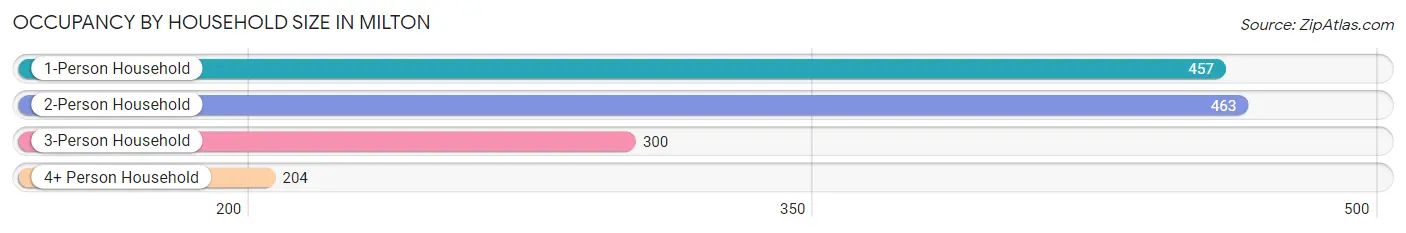
| Household Size | # Housing Units | % Housing Units |
| 1-Person Household | 457 | 32.1% |
| 2-Person Household | 463 | 32.5% |
| 3-Person Household | 300 | 21.1% |
| 4+ Person Household | 204 | 14.3% |
| Total Housing Units | 1,424 | 100.0% |
Occupancy by Ownership by Household Size in Milton
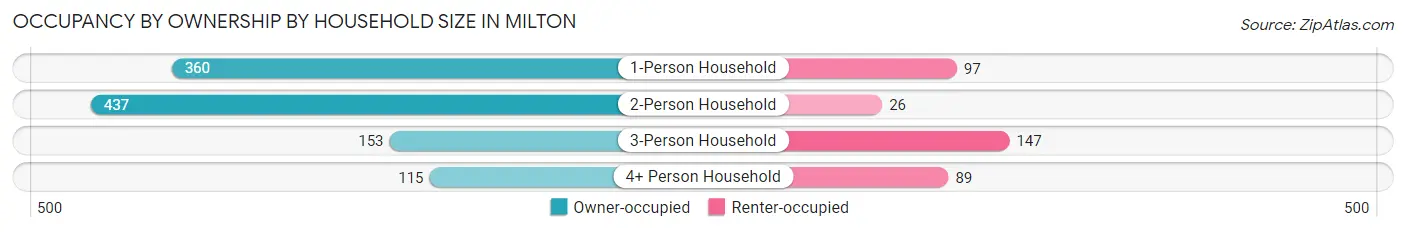
| Household Size | Owner-occupied | Renter-occupied |
| 1-Person Household | 360 (78.8%) | 97 (21.2%) |
| 2-Person Household | 437 (94.4%) | 26 (5.6%) |
| 3-Person Household | 153 (51.0%) | 147 (49.0%) |
| 4+ Person Household | 115 (56.4%) | 89 (43.6%) |
| Total Housing Units | 1,065 (74.8%) | 359 (25.2%) |
Occupancy by Educational Attainment in Milton
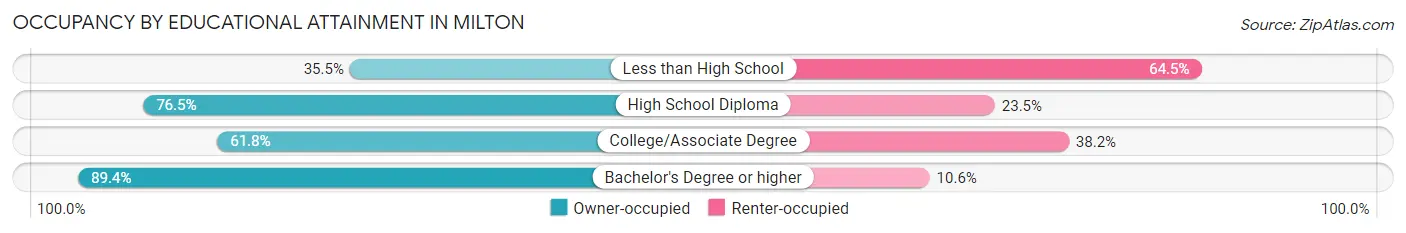
| Household Size | Owner-occupied | Renter-occupied |
| Less than High School | 43 (35.5%) | 78 (64.5%) |
| High School Diploma | 208 (76.5%) | 64 (23.5%) |
| College/Associate Degree | 241 (61.8%) | 149 (38.2%) |
| Bachelor's Degree or higher | 573 (89.4%) | 68 (10.6%) |
Occupancy by Age of Householder in Milton
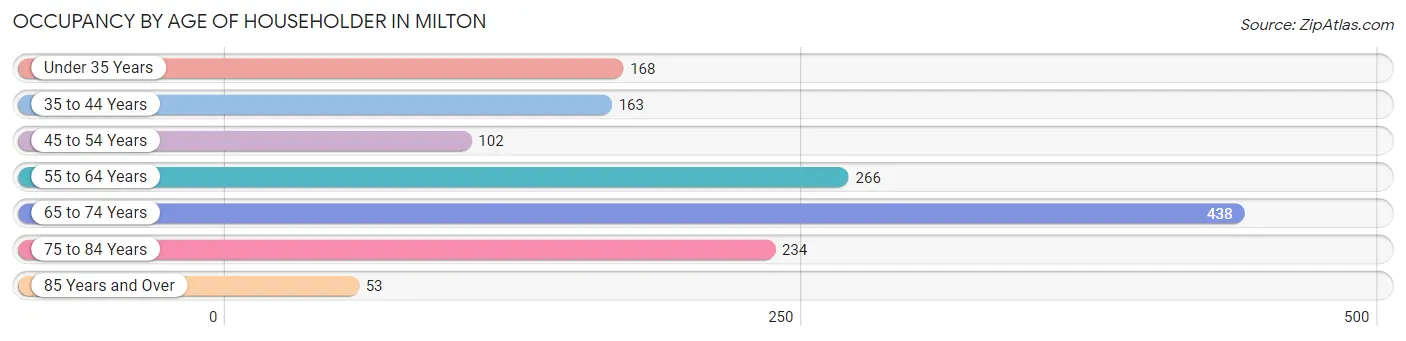
| Age Bracket | # Households | % Households |
| Under 35 Years | 168 | 11.8% |
| 35 to 44 Years | 163 | 11.5% |
| 45 to 54 Years | 102 | 7.2% |
| 55 to 64 Years | 266 | 18.7% |
| 65 to 74 Years | 438 | 30.8% |
| 75 to 84 Years | 234 | 16.4% |
| 85 Years and Over | 53 | 3.7% |
| Total | 1,424 | 100.0% |
Housing Finances in Milton
Median Income by Occupancy in Milton
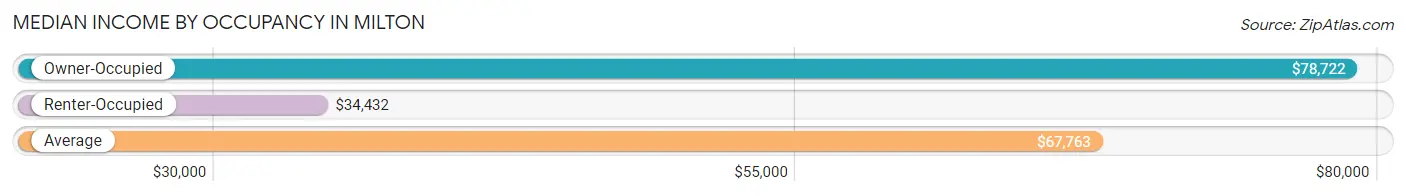
| Occupancy Type | # Households | Median Income |
| Owner-Occupied | 1,065 (74.8%) | $78,722 |
| Renter-Occupied | 359 (25.2%) | $34,432 |
| Average | 1,424 (100.0%) | $67,763 |
Occupancy by Householder Income Bracket in Milton
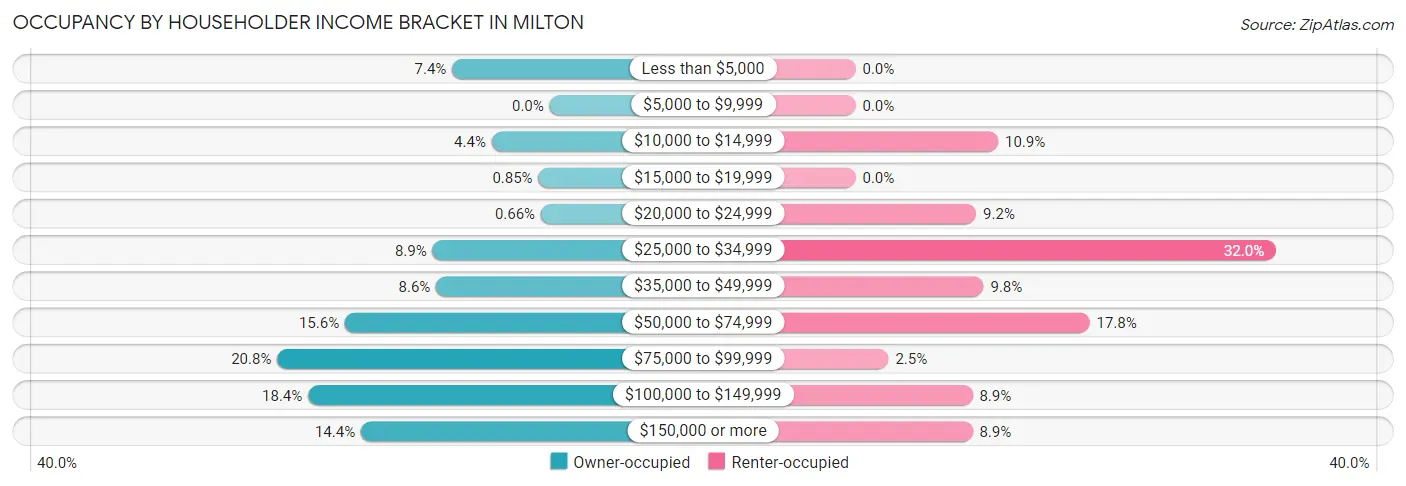
| Income Bracket | Owner-occupied | Renter-occupied |
| Less than $5,000 | 79 (7.4%) | 0 (0.0%) |
| $5,000 to $9,999 | 0 (0.0%) | 0 (0.0%) |
| $10,000 to $14,999 | 47 (4.4%) | 39 (10.9%) |
| $15,000 to $19,999 | 9 (0.9%) | 0 (0.0%) |
| $20,000 to $24,999 | 7 (0.7%) | 33 (9.2%) |
| $25,000 to $34,999 | 95 (8.9%) | 115 (32.0%) |
| $35,000 to $49,999 | 92 (8.6%) | 35 (9.8%) |
| $50,000 to $74,999 | 166 (15.6%) | 64 (17.8%) |
| $75,000 to $99,999 | 221 (20.7%) | 9 (2.5%) |
| $100,000 to $149,999 | 196 (18.4%) | 32 (8.9%) |
| $150,000 or more | 153 (14.4%) | 32 (8.9%) |
| Total | 1,065 (100.0%) | 359 (100.0%) |
Monthly Housing Cost Tiers in Milton
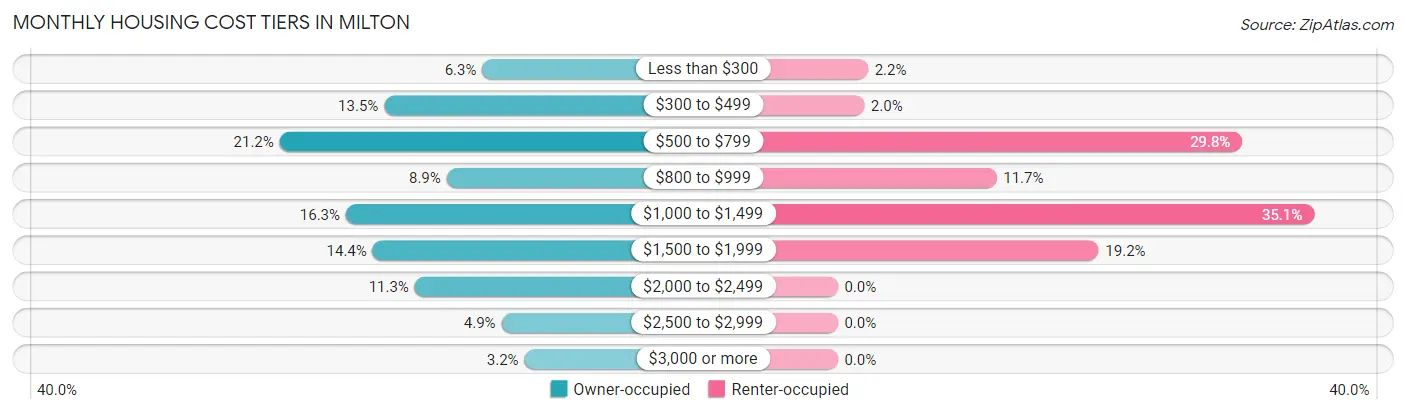
| Monthly Cost | Owner-occupied | Renter-occupied |
| Less than $300 | 67 (6.3%) | 8 (2.2%) |
| $300 to $499 | 144 (13.5%) | 7 (1.9%) |
| $500 to $799 | 226 (21.2%) | 107 (29.8%) |
| $800 to $999 | 95 (8.9%) | 42 (11.7%) |
| $1,000 to $1,499 | 174 (16.3%) | 126 (35.1%) |
| $1,500 to $1,999 | 153 (14.4%) | 69 (19.2%) |
| $2,000 to $2,499 | 120 (11.3%) | 0 (0.0%) |
| $2,500 to $2,999 | 52 (4.9%) | 0 (0.0%) |
| $3,000 or more | 34 (3.2%) | 0 (0.0%) |
| Total | 1,065 (100.0%) | 359 (100.0%) |
Physical Housing Characteristics in Milton
Housing Structures in Milton
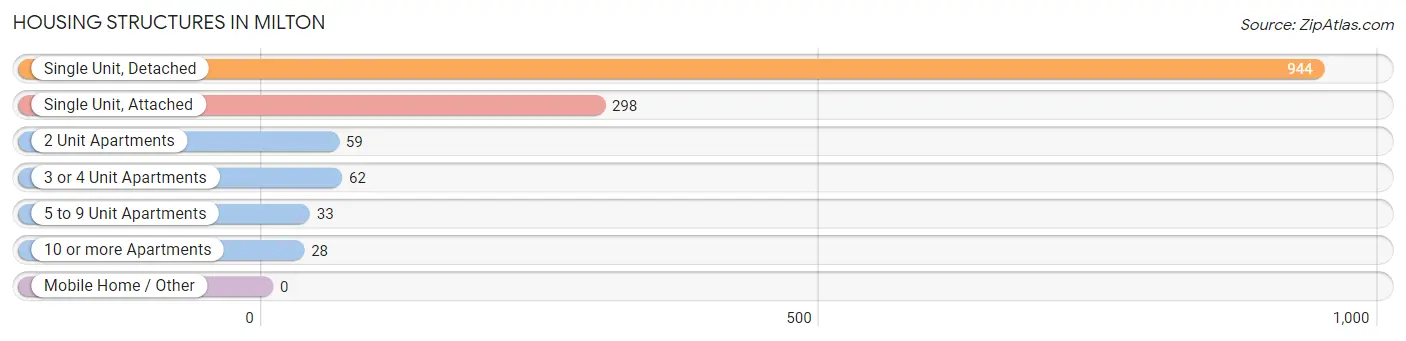
| Structure Type | # Housing Units | % Housing Units |
| Single Unit, Detached | 944 | 66.3% |
| Single Unit, Attached | 298 | 20.9% |
| 2 Unit Apartments | 59 | 4.1% |
| 3 or 4 Unit Apartments | 62 | 4.3% |
| 5 to 9 Unit Apartments | 33 | 2.3% |
| 10 or more Apartments | 28 | 2.0% |
| Mobile Home / Other | 0 | 0.0% |
| Total | 1,424 | 100.0% |
Housing Structures by Occupancy in Milton
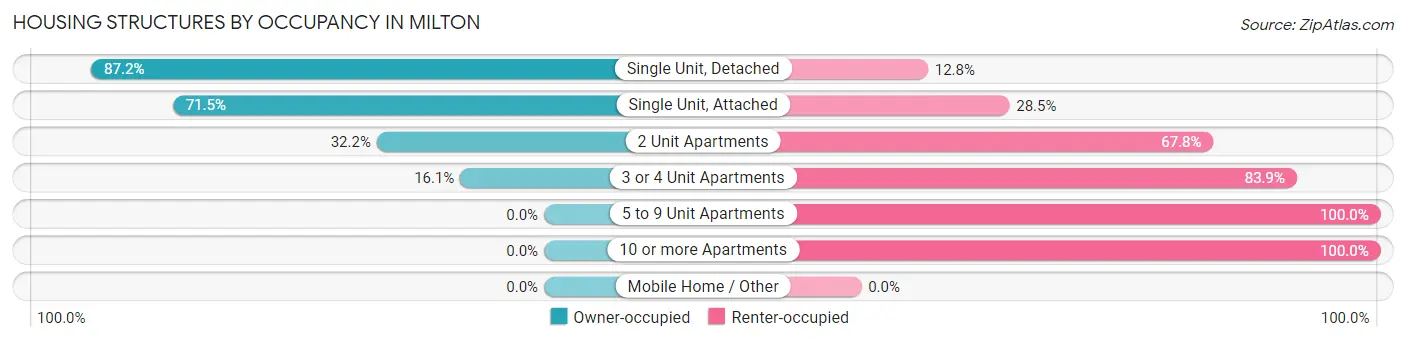
| Structure Type | Owner-occupied | Renter-occupied |
| Single Unit, Detached | 823 (87.2%) | 121 (12.8%) |
| Single Unit, Attached | 213 (71.5%) | 85 (28.5%) |
| 2 Unit Apartments | 19 (32.2%) | 40 (67.8%) |
| 3 or 4 Unit Apartments | 10 (16.1%) | 52 (83.9%) |
| 5 to 9 Unit Apartments | 0 (0.0%) | 33 (100.0%) |
| 10 or more Apartments | 0 (0.0%) | 28 (100.0%) |
| Mobile Home / Other | 0 (0.0%) | 0 (0.0%) |
| Total | 1,065 (74.8%) | 359 (25.2%) |
Housing Structures by Number of Rooms in Milton
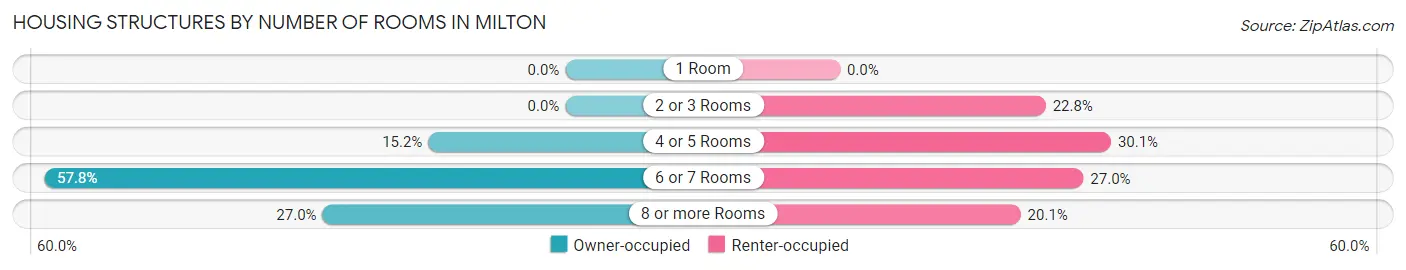
| Number of Rooms | Owner-occupied | Renter-occupied |
| 1 Room | 0 (0.0%) | 0 (0.0%) |
| 2 or 3 Rooms | 0 (0.0%) | 82 (22.8%) |
| 4 or 5 Rooms | 162 (15.2%) | 108 (30.1%) |
| 6 or 7 Rooms | 616 (57.8%) | 97 (27.0%) |
| 8 or more Rooms | 287 (27.0%) | 72 (20.1%) |
| Total | 1,065 (100.0%) | 359 (100.0%) |
Housing Structure by Heating Type in Milton
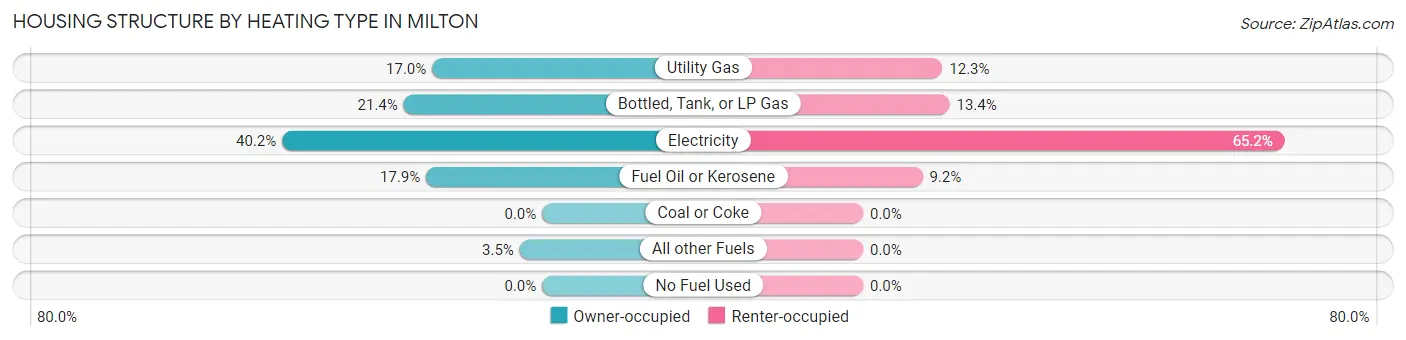
| Heating Type | Owner-occupied | Renter-occupied |
| Utility Gas | 181 (17.0%) | 44 (12.3%) |
| Bottled, Tank, or LP Gas | 228 (21.4%) | 48 (13.4%) |
| Electricity | 428 (40.2%) | 234 (65.2%) |
| Fuel Oil or Kerosene | 191 (17.9%) | 33 (9.2%) |
| Coal or Coke | 0 (0.0%) | 0 (0.0%) |
| All other Fuels | 37 (3.5%) | 0 (0.0%) |
| No Fuel Used | 0 (0.0%) | 0 (0.0%) |
| Total | 1,065 (100.0%) | 359 (100.0%) |
Household Vehicle Usage in Milton
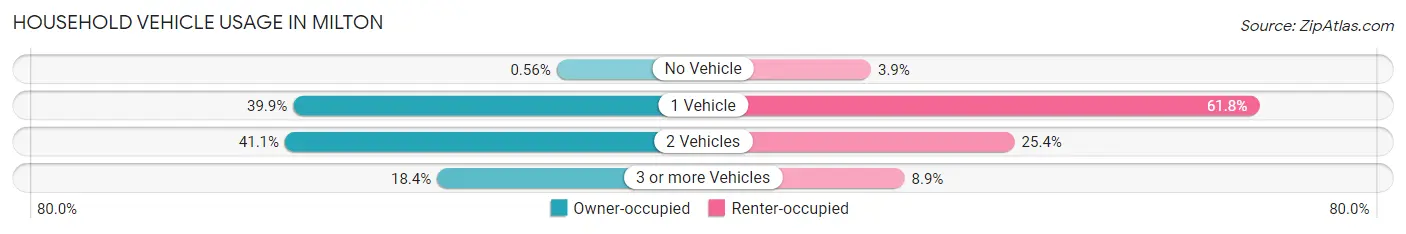
| Vehicles per Household | Owner-occupied | Renter-occupied |
| No Vehicle | 6 (0.6%) | 14 (3.9%) |
| 1 Vehicle | 425 (39.9%) | 222 (61.8%) |
| 2 Vehicles | 438 (41.1%) | 91 (25.4%) |
| 3 or more Vehicles | 196 (18.4%) | 32 (8.9%) |
| Total | 1,065 (100.0%) | 359 (100.0%) |
Real Estate & Mortgages in Milton
Real Estate and Mortgage Overview in Milton
| Characteristic | Without Mortgage | With Mortgage |
| Housing Units | 469 | 596 |
| Median Property Value | $342,900 | $407,200 |
| Median Household Income | $46,719 | $111 |
| Monthly Housing Costs | $519 | $34 |
| Real Estate Taxes | $1,233 | $43 |
Property Value by Mortgage Status in Milton
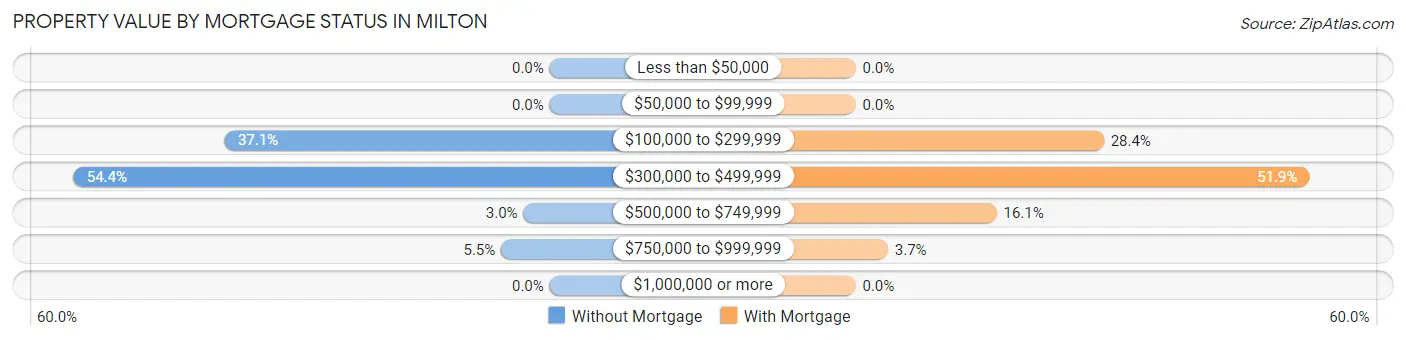
| Property Value | Without Mortgage | With Mortgage |
| Less than $50,000 | 0 (0.0%) | 0 (0.0%) |
| $50,000 to $99,999 | 0 (0.0%) | 0 (0.0%) |
| $100,000 to $299,999 | 174 (37.1%) | 169 (28.4%) |
| $300,000 to $499,999 | 255 (54.4%) | 309 (51.8%) |
| $500,000 to $749,999 | 14 (3.0%) | 96 (16.1%) |
| $750,000 to $999,999 | 26 (5.5%) | 22 (3.7%) |
| $1,000,000 or more | 0 (0.0%) | 0 (0.0%) |
| Total | 469 (100.0%) | 596 (100.0%) |
Household Income by Mortgage Status in Milton
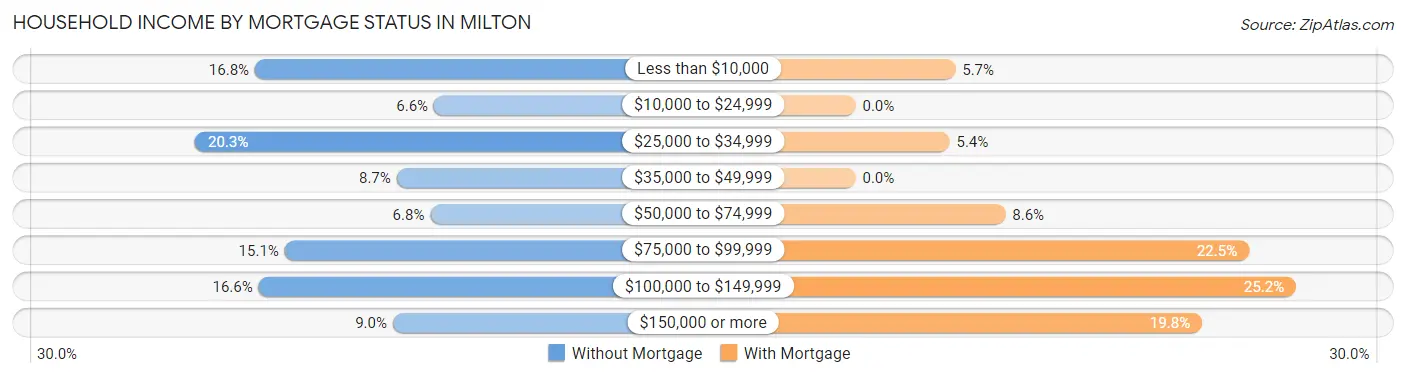
| Household Income | Without Mortgage | With Mortgage |
| Less than $10,000 | 79 (16.8%) | 34 (5.7%) |
| $10,000 to $24,999 | 31 (6.6%) | 0 (0.0%) |
| $25,000 to $34,999 | 95 (20.3%) | 32 (5.4%) |
| $35,000 to $49,999 | 41 (8.7%) | 0 (0.0%) |
| $50,000 to $74,999 | 32 (6.8%) | 51 (8.6%) |
| $75,000 to $99,999 | 71 (15.1%) | 134 (22.5%) |
| $100,000 to $149,999 | 78 (16.6%) | 150 (25.2%) |
| $150,000 or more | 42 (9.0%) | 118 (19.8%) |
| Total | 469 (100.0%) | 596 (100.0%) |
Property Value to Household Income Ratio in Milton
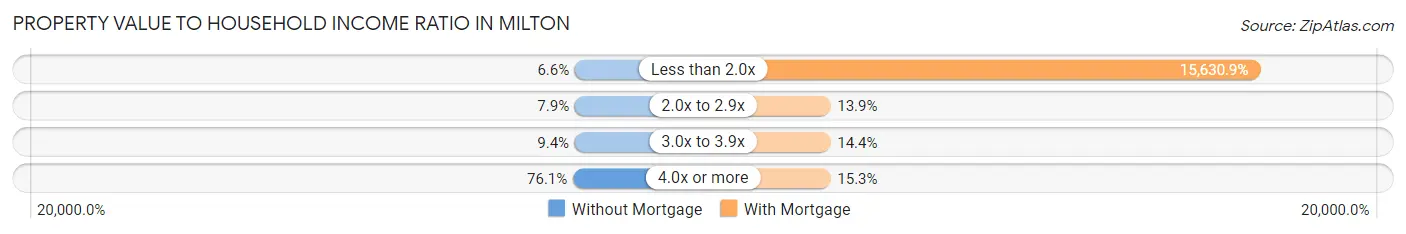
| Value-to-Income Ratio | Without Mortgage | With Mortgage |
| Less than 2.0x | 31 (6.6%) | 93,160 (15,630.9%) |
| 2.0x to 2.9x | 37 (7.9%) | 83 (13.9%) |
| 3.0x to 3.9x | 44 (9.4%) | 86 (14.4%) |
| 4.0x or more | 357 (76.1%) | 91 (15.3%) |
| Total | 469 (100.0%) | 596 (100.0%) |
Real Estate Taxes by Mortgage Status in Milton
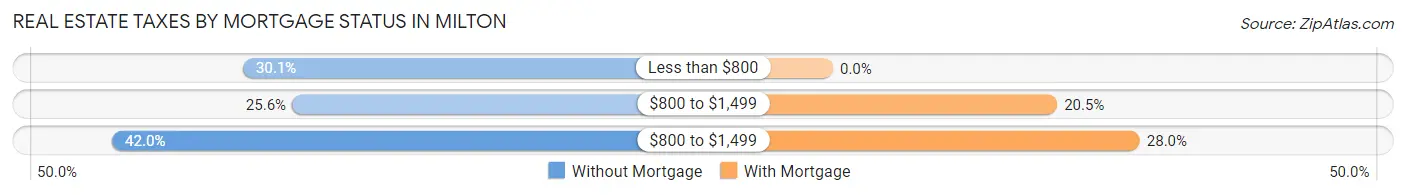
| Property Taxes | Without Mortgage | With Mortgage |
| Less than $800 | 141 (30.1%) | 0 (0.0%) |
| $800 to $1,499 | 120 (25.6%) | 122 (20.5%) |
| $800 to $1,499 | 197 (42.0%) | 167 (28.0%) |
| Total | 469 (100.0%) | 596 (100.0%) |
Health & Disability in Milton
Health Insurance Coverage by Age in Milton
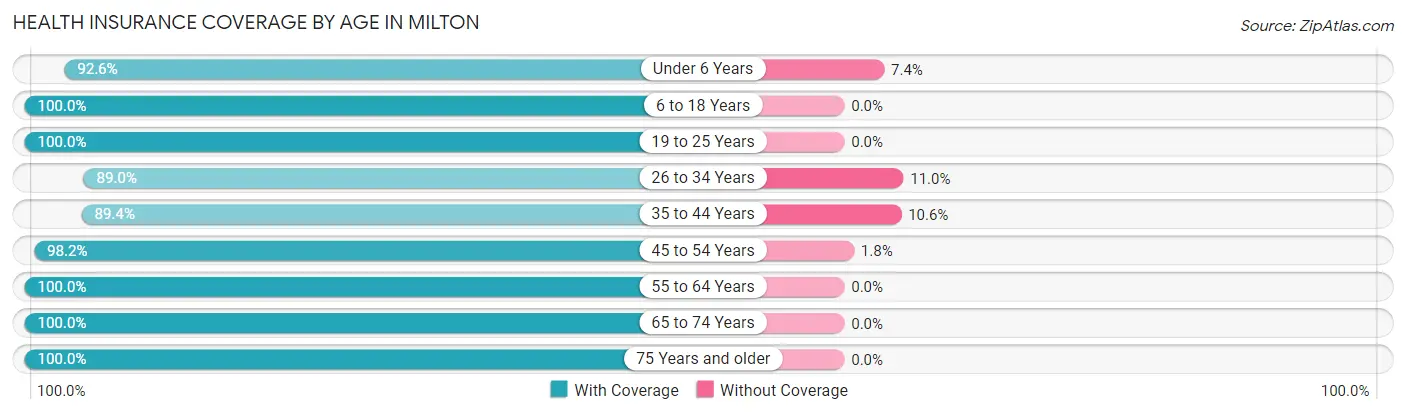
| Age Bracket | With Coverage | Without Coverage |
| Under 6 Years | 312 (92.6%) | 25 (7.4%) |
| 6 to 18 Years | 495 (100.0%) | 0 (0.0%) |
| 19 to 25 Years | 102 (100.0%) | 0 (0.0%) |
| 26 to 34 Years | 275 (89.0%) | 34 (11.0%) |
| 35 to 44 Years | 236 (89.4%) | 28 (10.6%) |
| 45 to 54 Years | 275 (98.2%) | 5 (1.8%) |
| 55 to 64 Years | 368 (100.0%) | 0 (0.0%) |
| 65 to 74 Years | 840 (100.0%) | 0 (0.0%) |
| 75 Years and older | 354 (100.0%) | 0 (0.0%) |
| Total | 3,257 (97.3%) | 92 (2.8%) |
Health Insurance Coverage by Citizenship Status in Milton
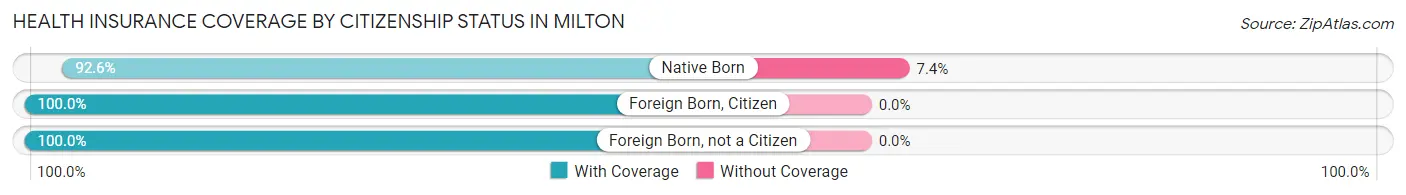
| Citizenship Status | With Coverage | Without Coverage |
| Native Born | 312 (92.6%) | 25 (7.4%) |
| Foreign Born, Citizen | 495 (100.0%) | 0 (0.0%) |
| Foreign Born, not a Citizen | 102 (100.0%) | 0 (0.0%) |
Health Insurance Coverage by Household Income in Milton
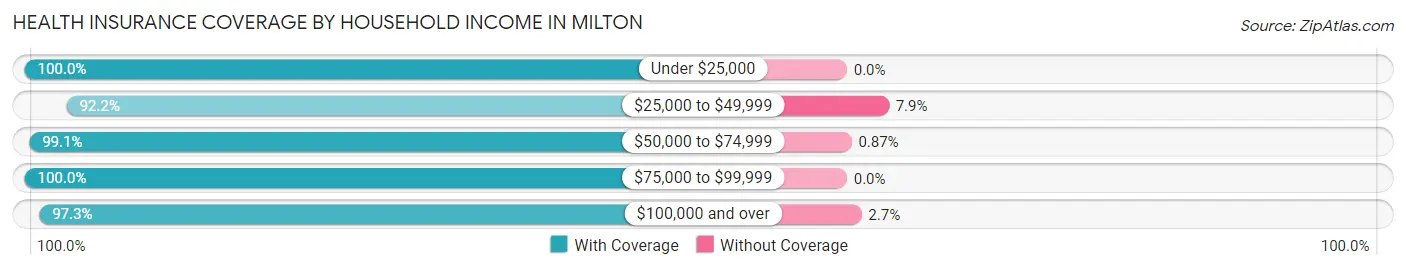
| Household Income | With Coverage | Without Coverage |
| Under $25,000 | 337 (100.0%) | 0 (0.0%) |
| $25,000 to $49,999 | 622 (92.1%) | 53 (7.9%) |
| $50,000 to $74,999 | 570 (99.1%) | 5 (0.9%) |
| $75,000 to $99,999 | 583 (100.0%) | 0 (0.0%) |
| $100,000 and over | 1,137 (97.3%) | 32 (2.7%) |
Public vs Private Health Insurance Coverage by Age in Milton
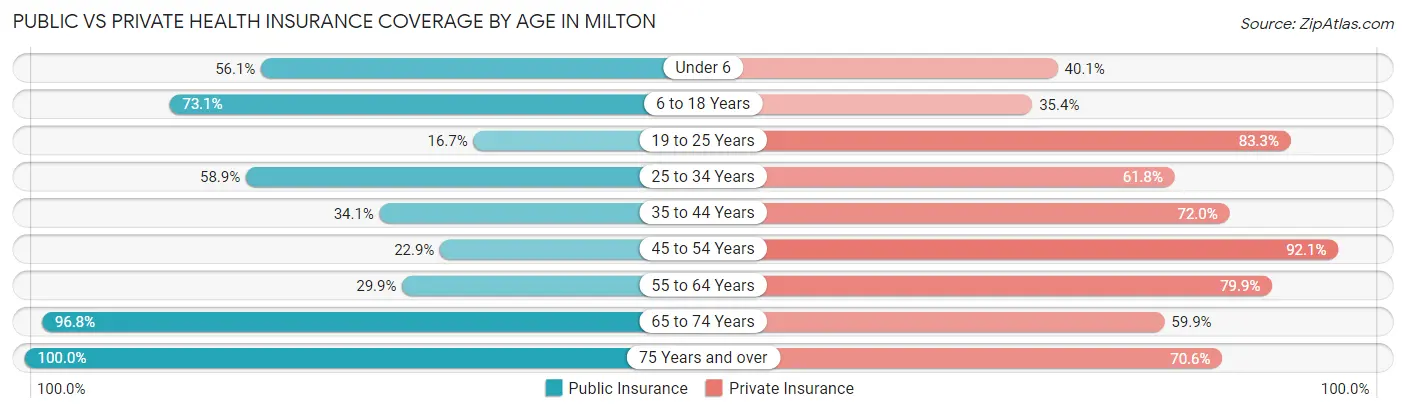
| Age Bracket | Public Insurance | Private Insurance |
| Under 6 | 189 (56.1%) | 135 (40.1%) |
| 6 to 18 Years | 362 (73.1%) | 175 (35.3%) |
| 19 to 25 Years | 17 (16.7%) | 85 (83.3%) |
| 25 to 34 Years | 182 (58.9%) | 191 (61.8%) |
| 35 to 44 Years | 90 (34.1%) | 190 (72.0%) |
| 45 to 54 Years | 64 (22.9%) | 258 (92.1%) |
| 55 to 64 Years | 110 (29.9%) | 294 (79.9%) |
| 65 to 74 Years | 813 (96.8%) | 503 (59.9%) |
| 75 Years and over | 354 (100.0%) | 250 (70.6%) |
| Total | 2,181 (65.1%) | 2,081 (62.1%) |
Disability Status by Sex by Age in Milton
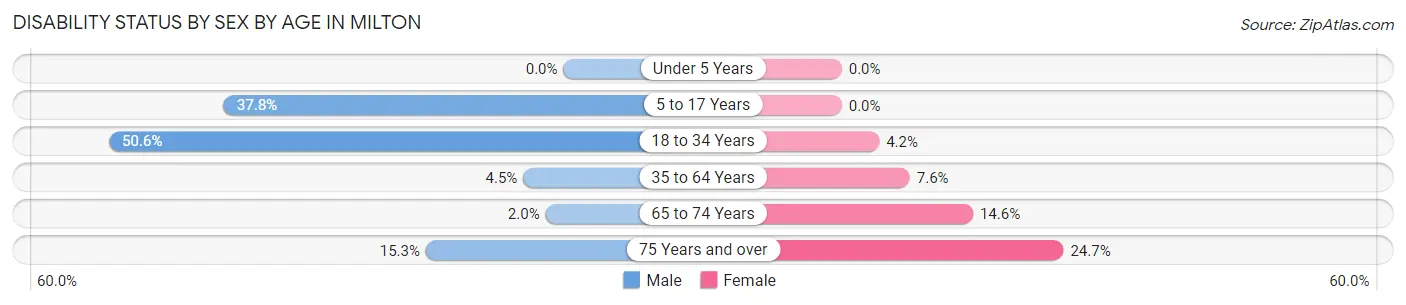
| Age Bracket | Male | Female |
| Under 5 Years | 0 (0.0%) | 0 (0.0%) |
| 5 to 17 Years | 48 (37.8%) | 0 (0.0%) |
| 18 to 34 Years | 126 (50.6%) | 7 (4.2%) |
| 35 to 64 Years | 16 (4.5%) | 42 (7.6%) |
| 65 to 74 Years | 8 (2.0%) | 64 (14.6%) |
| 75 Years and over | 17 (15.3%) | 60 (24.7%) |
Disability Class by Sex by Age in Milton
Disability Class: Hearing Difficulty
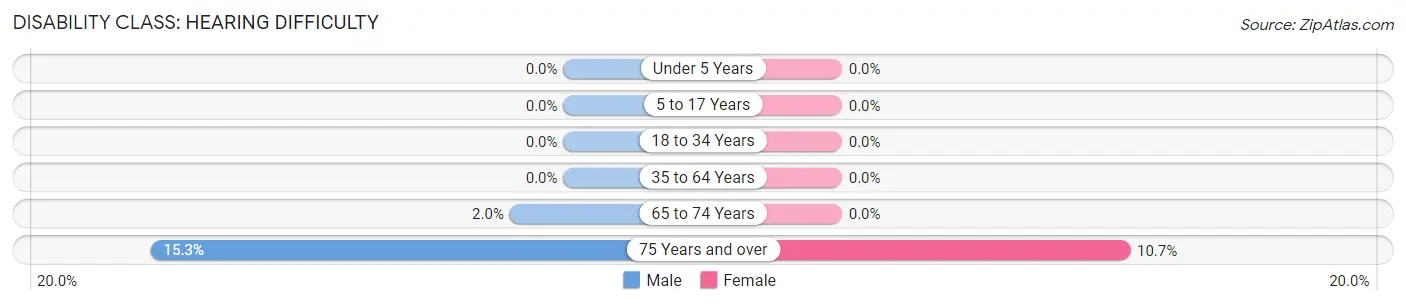
| Age Bracket | Male | Female |
| Under 5 Years | 0 (0.0%) | 0 (0.0%) |
| 5 to 17 Years | 0 (0.0%) | 0 (0.0%) |
| 18 to 34 Years | 0 (0.0%) | 0 (0.0%) |
| 35 to 64 Years | 0 (0.0%) | 0 (0.0%) |
| 65 to 74 Years | 8 (2.0%) | 0 (0.0%) |
| 75 Years and over | 17 (15.3%) | 26 (10.7%) |
Disability Class: Vision Difficulty
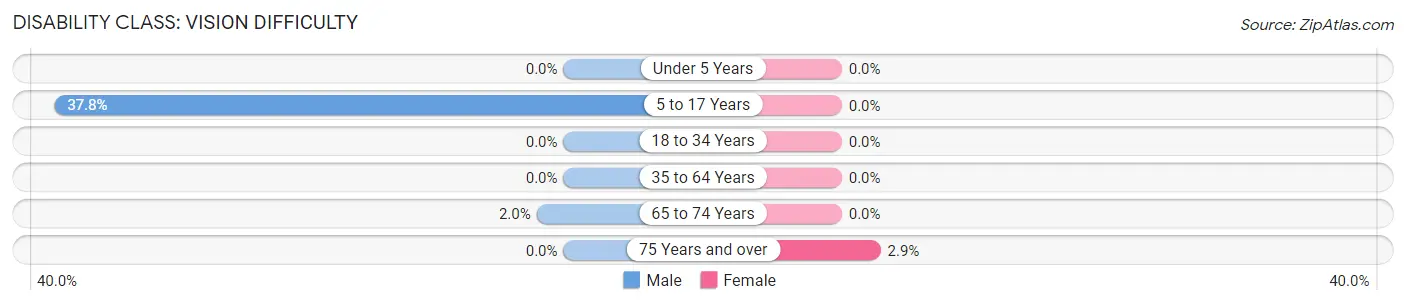
| Age Bracket | Male | Female |
| Under 5 Years | 0 (0.0%) | 0 (0.0%) |
| 5 to 17 Years | 48 (37.8%) | 0 (0.0%) |
| 18 to 34 Years | 0 (0.0%) | 0 (0.0%) |
| 35 to 64 Years | 0 (0.0%) | 0 (0.0%) |
| 65 to 74 Years | 8 (2.0%) | 0 (0.0%) |
| 75 Years and over | 0 (0.0%) | 7 (2.9%) |
Disability Class: Cognitive Difficulty
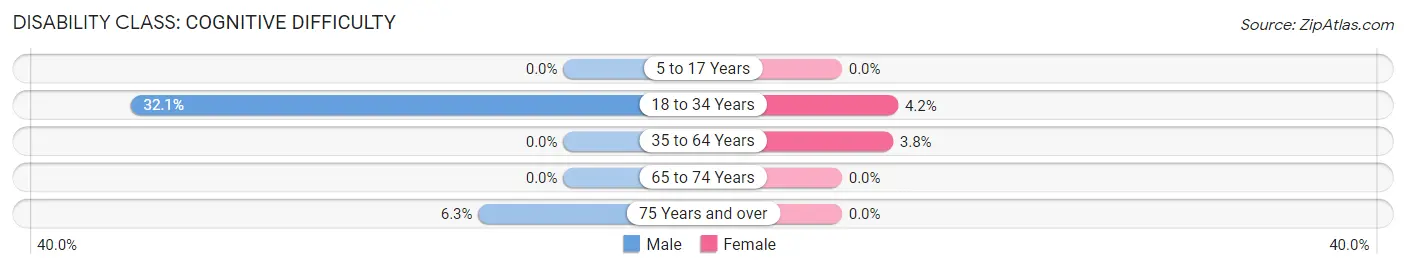
| Age Bracket | Male | Female |
| 5 to 17 Years | 0 (0.0%) | 0 (0.0%) |
| 18 to 34 Years | 80 (32.1%) | 7 (4.2%) |
| 35 to 64 Years | 0 (0.0%) | 21 (3.8%) |
| 65 to 74 Years | 0 (0.0%) | 0 (0.0%) |
| 75 Years and over | 7 (6.3%) | 0 (0.0%) |
Disability Class: Ambulatory Difficulty
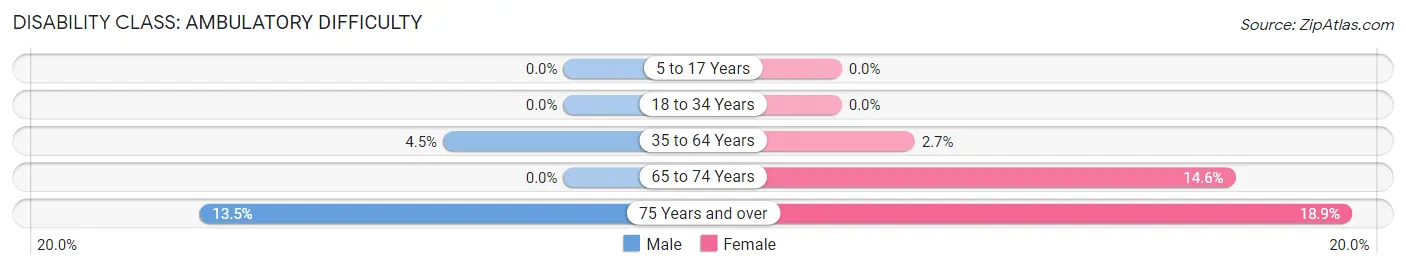
| Age Bracket | Male | Female |
| 5 to 17 Years | 0 (0.0%) | 0 (0.0%) |
| 18 to 34 Years | 0 (0.0%) | 0 (0.0%) |
| 35 to 64 Years | 16 (4.5%) | 15 (2.7%) |
| 65 to 74 Years | 0 (0.0%) | 64 (14.6%) |
| 75 Years and over | 15 (13.5%) | 46 (18.9%) |
Disability Class: Self-Care Difficulty
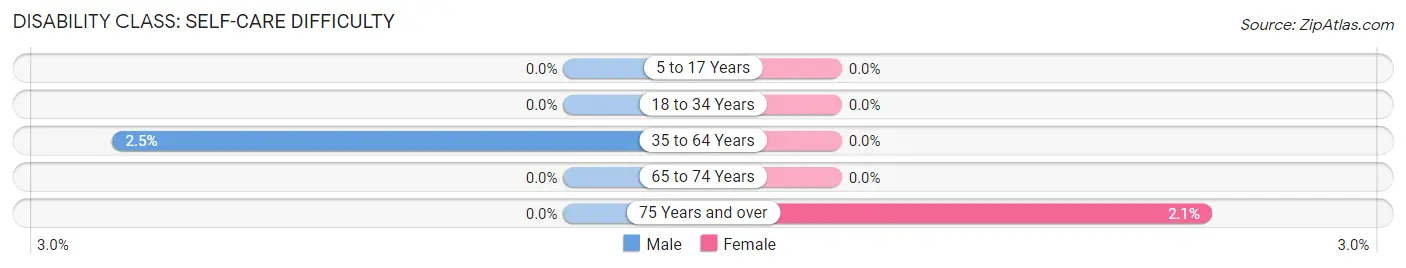
| Age Bracket | Male | Female |
| 5 to 17 Years | 0 (0.0%) | 0 (0.0%) |
| 18 to 34 Years | 0 (0.0%) | 0 (0.0%) |
| 35 to 64 Years | 9 (2.5%) | 0 (0.0%) |
| 65 to 74 Years | 0 (0.0%) | 0 (0.0%) |
| 75 Years and over | 0 (0.0%) | 5 (2.1%) |
Technology Access in Milton
Computing Device Access in Milton
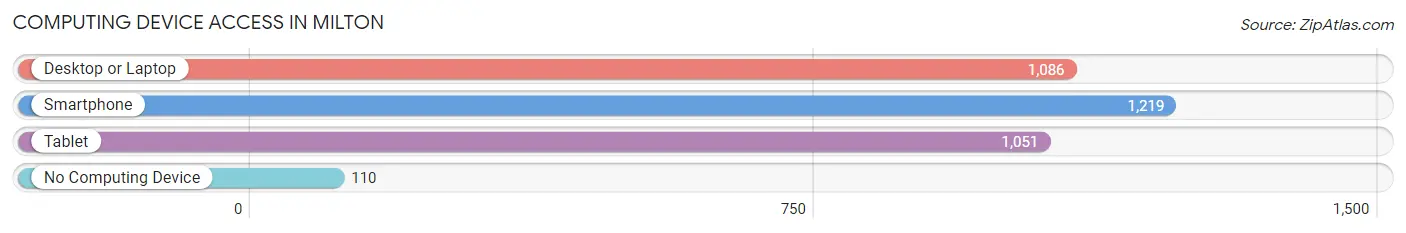
| Device Type | # Households | % Households |
| Desktop or Laptop | 1,086 | 76.3% |
| Smartphone | 1,219 | 85.6% |
| Tablet | 1,051 | 73.8% |
| No Computing Device | 110 | 7.7% |
| Total | 1,424 | 100.0% |
Internet Access in Milton
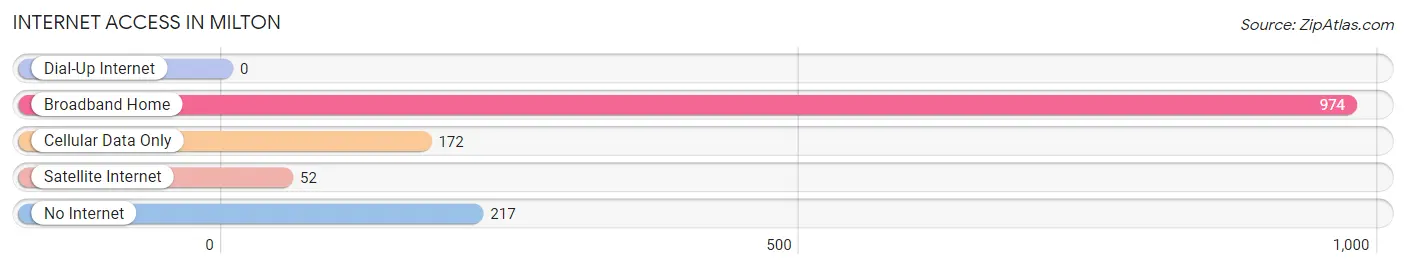
| Internet Type | # Households | % Households |
| Dial-Up Internet | 0 | 0.0% |
| Broadband Home | 974 | 68.4% |
| Cellular Data Only | 172 | 12.1% |
| Satellite Internet | 52 | 3.6% |
| No Internet | 217 | 15.2% |
| Total | 1,424 | 100.0% |
Milton Summary
Milton, Delaware is a small town located in Sussex County, Delaware. It is situated on the Broadkill River, and is part of the Cape Region of Delaware. The town has a population of approximately 2,000 people, and is located about 10 miles south of the state capital, Dover.
History
Milton was first settled in 1672 by English settlers, and was originally known as Head of the Broadkill. The town was officially incorporated in 1807, and was named after the English poet John Milton. The town was an important port for the shipping of goods and services, and was a major center for the production of lumber and other goods.
In the late 19th century, Milton was a popular tourist destination, and was known for its many resorts and hotels. The town was also home to a number of factories, including a paper mill, a canning factory, and a brickyard.
Geography
Milton is located in the Cape Region of Delaware, and is situated on the Broadkill River. The town is located about 10 miles south of the state capital, Dover. The town is bordered by the towns of Lewes, Rehoboth Beach, and Georgetown. The town is located in a rural area, and is surrounded by farmland and woodlands.
The climate in Milton is humid subtropical, with hot, humid summers and mild winters. The average annual temperature is around 60 degrees Fahrenheit, and the average annual precipitation is around 45 inches.
Economy
Milton’s economy is largely based on agriculture and tourism. The town is home to a number of farms, and is a popular destination for tourists. The town is also home to a number of small businesses, including restaurants, shops, and other services.
Demographics
As of the 2010 census, Milton had a population of 2,026 people. The racial makeup of the town was 94.3% White, 2.3% African American, 0.4% Native American, 0.7% Asian, 0.1% Pacific Islander, 0.7% from other races, and 1.5% from two or more races. Hispanic or Latino of any race were 2.3% of the population.
The median income for a household in Milton was $50,972, and the median income for a family was $60,972. The per capita income for the town was $25,972. About 8.3% of families and 10.3% of the population were below the poverty line, including 14.3% of those under age 18 and 8.3% of those age 65 or over.
Common Questions
What is the Total Population of Milton?
Total Population of Milton is 3,349.
What is the Total Male Population of Milton?
Total Male Population of Milton is 1,409.
What is the Total Female Population of Milton?
Total Female Population of Milton is 1,940.
What is the Ratio of Males per 100 Females in Milton?
There are 72.63 Males per 100 Females in Milton.
What is the Ratio of Females per 100 Males in Milton?
There are 137.69 Females per 100 Males in Milton.
What is the Median Population Age in Milton?
Median Population Age in Milton is 48.2 Years.
What is the Average Family Size in Milton
Average Family Size in Milton is 2.9 People.
What is the Average Household Size in Milton
Average Household Size in Milton is 2.3 People.
What is Per Capita Income in Milton?
Per Capita income in Milton is $35,412.
What is the Median Family Income in Milton?
Median Family Income in Milton is $79,893.
What is the Median Household income in Milton?
Median Household Income in Milton is $67,763.
What is Income or Wage Gap in Milton?
Income or Wage Gap in Milton is 10.3%.
Women in Milton earn 89.7 cents for every dollar earned by a man.
What is Inequality or Gini Index in Milton?
Inequality or Gini Index in Milton is 0.45.
How Large is the Labor Force in Milton?
There are 1,185 People in the Labor Forcein in Milton.
What is the Percentage of People in the Labor Force in Milton?
44.3% of People are in the Labor Force in Milton.
What is the Unemployment Rate in Milton?
Unemployment Rate in Milton is 7.4%.