Frederica, DE
Frederica Map
Frederica Overview
1,001
TOTAL POPULATION
418
MALE POPULATION
583
FEMALE POPULATION
71.70
MALES / 100 FEMALES
139.47
FEMALES / 100 MALES
31.6
MEDIAN AGE
3.6
AVG FAMILY SIZE
2.9
AVG HOUSEHOLD SIZE
$24,666
PER CAPITA INCOME
$55,703
AVG FAMILY INCOME
$63,200
AVG HOUSEHOLD INCOME
0.31
INEQUALITY / GINI INDEX
528
LABOR FORCE [ PEOPLE ]
65.4%
PERCENT IN LABOR FORCE
5.1%
UNEMPLOYMENT RATE
Frederica Zip Codes
Frederica Area Codes
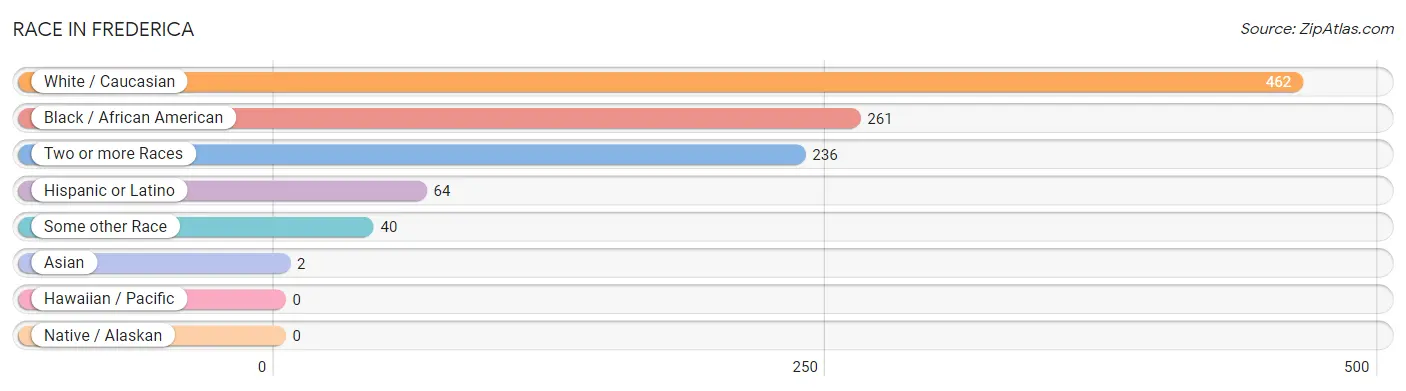
Race in Frederica
The most populous races in Frederica are White / Caucasian (462 | 46.2%), Black / African American (261 | 26.1%), and Two or more Races (236 | 23.6%).
| Race | # Population | % Population |
| Asian | 2 | 0.2% |
| Black / African American | 261 | 26.1% |
| Hawaiian / Pacific | 0 | 0.0% |
| Hispanic or Latino | 64 | 6.4% |
| Native / Alaskan | 0 | 0.0% |
| White / Caucasian | 462 | 46.2% |
| Two or more Races | 236 | 23.6% |
| Some other Race | 40 | 4.0% |
| Total | 1,001 | 100.0% |
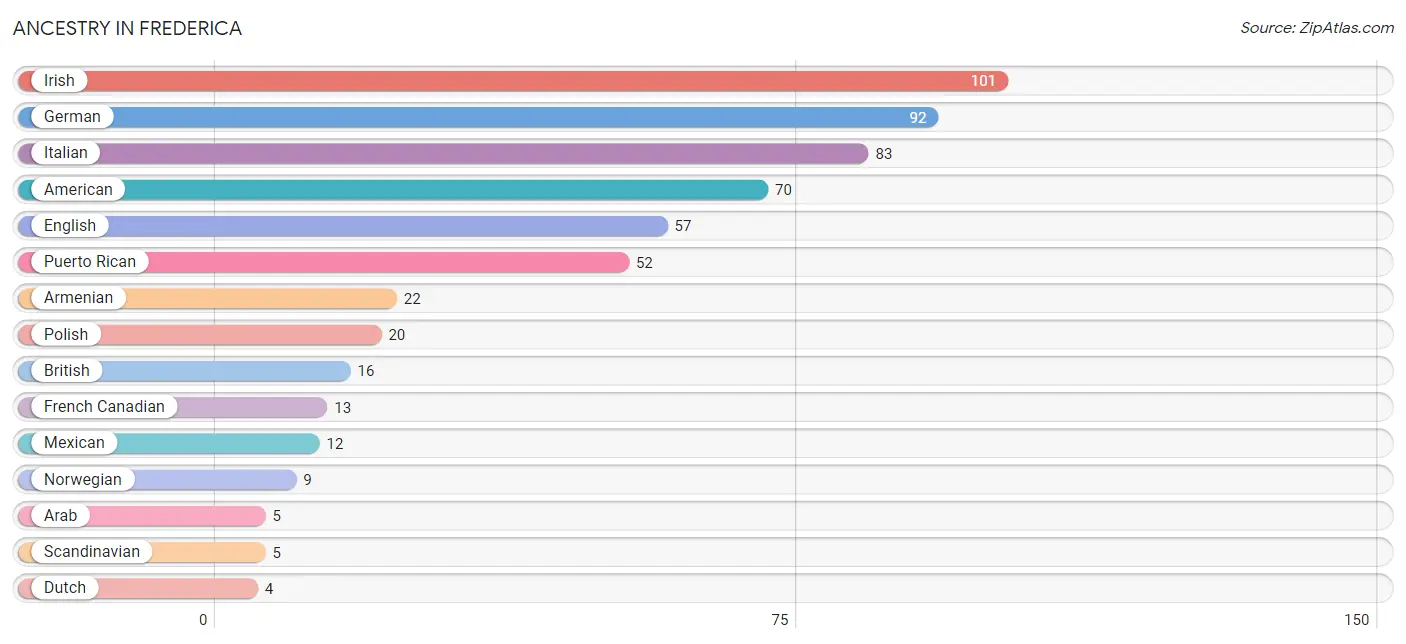
Ancestry in Frederica
The most populous ancestries reported in Frederica are Irish (101 | 10.1%), German (92 | 9.2%), Italian (83 | 8.3%), American (70 | 7.0%), and English (57 | 5.7%), together accounting for 40.3% of all Frederica residents.
| Ancestry | # Population | % Population |
| Aleut | 3 | 0.3% |
| American | 70 | 7.0% |
| Arab | 5 | 0.5% |
| Armenian | 22 | 2.2% |
| British | 16 | 1.6% |
| Cherokee | 1 | 0.1% |
| Danish | 1 | 0.1% |
| Dutch | 4 | 0.4% |
| English | 57 | 5.7% |
| European | 2 | 0.2% |
| French | 2 | 0.2% |
| French Canadian | 13 | 1.3% |
| German | 92 | 9.2% |
| Haitian | 3 | 0.3% |
| Hungarian | 2 | 0.2% |
| Indian (Asian) | 2 | 0.2% |
| Irish | 101 | 10.1% |
| Italian | 83 | 8.3% |
| Lebanese | 3 | 0.3% |
| Mexican | 12 | 1.2% |
| Native Hawaiian | 1 | 0.1% |
| Norwegian | 9 | 0.9% |
| Polish | 20 | 2.0% |
| Puerto Rican | 52 | 5.2% |
| Scandinavian | 5 | 0.5% |
| Scottish | 3 | 0.3% |
| Slovak | 2 | 0.2% |
| Swedish | 4 | 0.4% | View All 28 Rows |
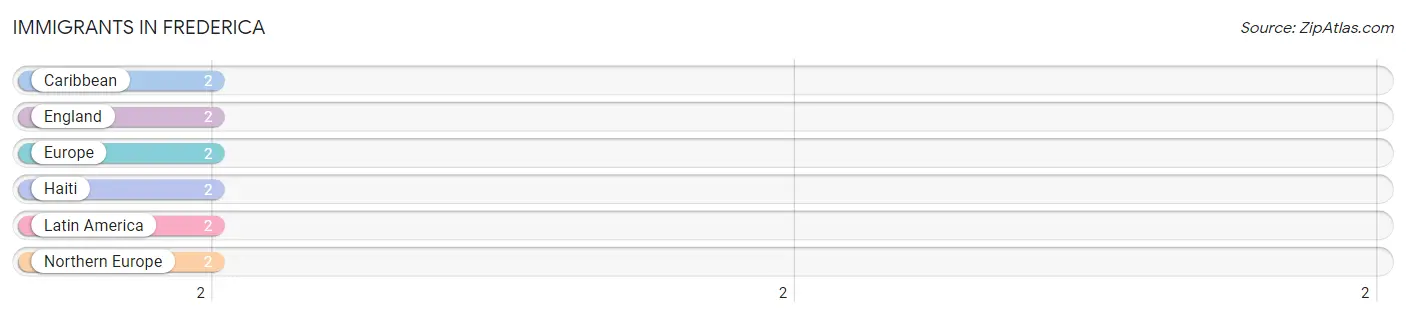
Immigrants in Frederica
The most numerous immigrant groups reported in Frederica came from Caribbean (2 | 0.2%), England (2 | 0.2%), Europe (2 | 0.2%), Haiti (2 | 0.2%), and Latin America (2 | 0.2%), together accounting for 1.0% of all Frederica residents.
| Immigration Origin | # Population | % Population |
| Caribbean | 2 | 0.2% |
| England | 2 | 0.2% |
| Europe | 2 | 0.2% |
| Haiti | 2 | 0.2% |
| Latin America | 2 | 0.2% |
| Northern Europe | 2 | 0.2% | View All 6 Rows |
Sex and Age in Frederica
Sex and Age in Frederica
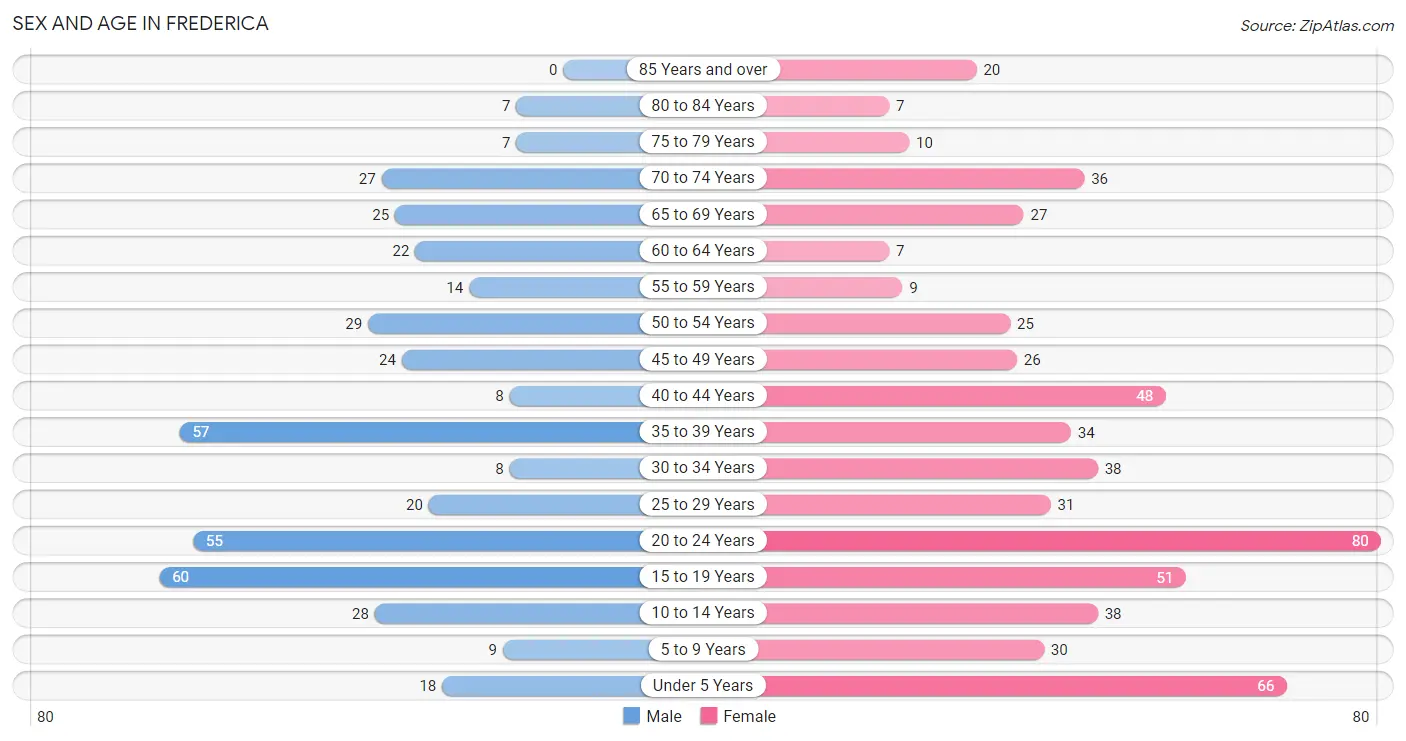
The most populous age groups in Frederica are 15 to 19 Years (60 | 14.3%) for men and 20 to 24 Years (80 | 13.7%) for women.
| Age Bracket | Male | Female |
| Under 5 Years | 18 (4.3%) | 66 (11.3%) |
| 5 to 9 Years | 9 (2.1%) | 30 (5.1%) |
| 10 to 14 Years | 28 (6.7%) | 38 (6.5%) |
| 15 to 19 Years | 60 (14.3%) | 51 (8.7%) |
| 20 to 24 Years | 55 (13.2%) | 80 (13.7%) |
| 25 to 29 Years | 20 (4.8%) | 31 (5.3%) |
| 30 to 34 Years | 8 (1.9%) | 38 (6.5%) |
| 35 to 39 Years | 57 (13.6%) | 34 (5.8%) |
| 40 to 44 Years | 8 (1.9%) | 48 (8.2%) |
| 45 to 49 Years | 24 (5.7%) | 26 (4.5%) |
| 50 to 54 Years | 29 (6.9%) | 25 (4.3%) |
| 55 to 59 Years | 14 (3.4%) | 9 (1.5%) |
| 60 to 64 Years | 22 (5.3%) | 7 (1.2%) |
| 65 to 69 Years | 25 (6.0%) | 27 (4.6%) |
| 70 to 74 Years | 27 (6.5%) | 36 (6.2%) |
| 75 to 79 Years | 7 (1.7%) | 10 (1.7%) |
| 80 to 84 Years | 7 (1.7%) | 7 (1.2%) |
| 85 Years and over | 0 (0.0%) | 20 (3.4%) |
| Total | 418 (100.0%) | 583 (100.0%) |
Families and Households in Frederica
Median Family Size in Frederica
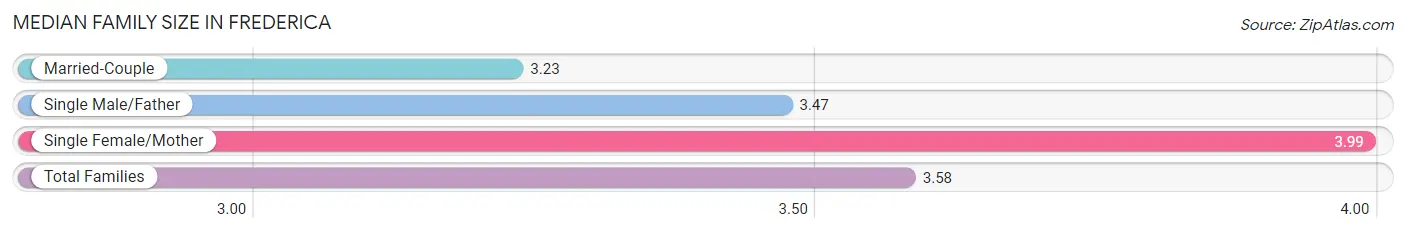
The median family size in Frederica is 3.58 persons per family, with single female/mother families (103 | 44.2%) accounting for the largest median family size of 3.99 persons per family. On the other hand, married-couple families (113 | 48.5%) represent the smallest median family size with 3.23 persons per family.
| Family Type | # Families | Family Size |
| Married-Couple | 113 (48.5%) | 3.23 |
| Single Male/Father | 17 (7.3%) | 3.47 |
| Single Female/Mother | 103 (44.2%) | 3.99 |
| Total Families | 233 (100.0%) | 3.58 |
Median Household Size in Frederica
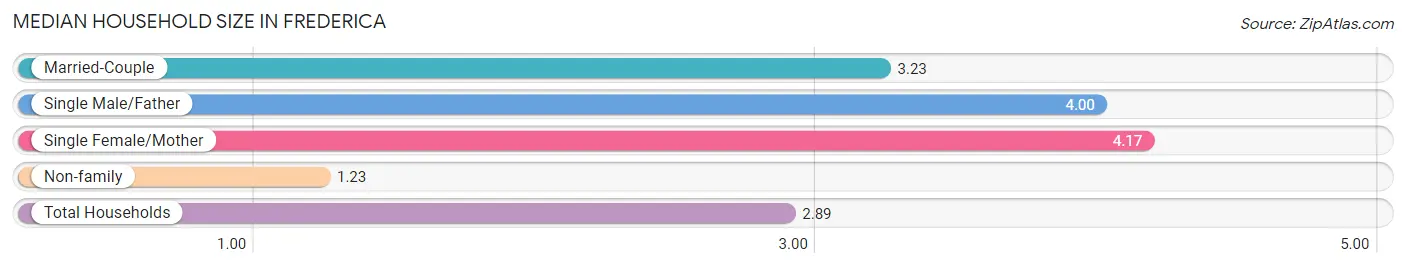
The median household size in Frederica is 2.89 persons per household, with single female/mother households (103 | 29.8%) accounting for the largest median household size of 4.17 persons per household. non-family households (113 | 32.7%) represent the smallest median household size with 1.23 persons per household.
| Household Type | # Households | Household Size |
| Married-Couple | 113 (32.7%) | 3.23 |
| Single Male/Father | 17 (4.9%) | 4.00 |
| Single Female/Mother | 103 (29.8%) | 4.17 |
| Non-family | 113 (32.7%) | 1.23 |
| Total Households | 346 (100.0%) | 2.89 |
Household Size by Marriage Status in Frederica
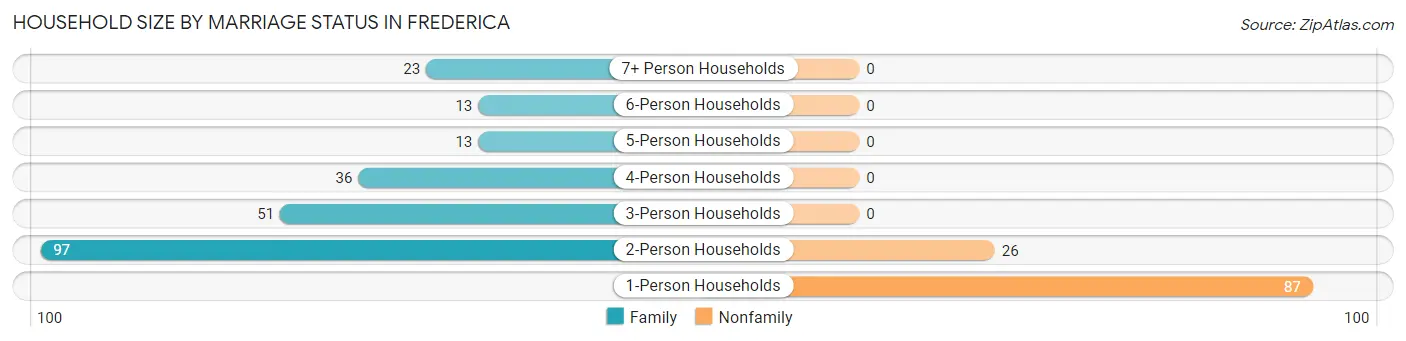
Out of a total of 346 households in Frederica, 233 (67.3%) are family households, while 113 (32.7%) are nonfamily households. The most numerous type of family households are 2-person households, comprising 97, and the most common type of nonfamily households are 1-person households, comprising 87.
| Household Size | Family Households | Nonfamily Households |
| 1-Person Households | - | 87 (25.1%) |
| 2-Person Households | 97 (28.0%) | 26 (7.5%) |
| 3-Person Households | 51 (14.7%) | 0 (0.0%) |
| 4-Person Households | 36 (10.4%) | 0 (0.0%) |
| 5-Person Households | 13 (3.8%) | 0 (0.0%) |
| 6-Person Households | 13 (3.8%) | 0 (0.0%) |
| 7+ Person Households | 23 (6.7%) | 0 (0.0%) |
| Total | 233 (67.3%) | 113 (32.7%) |
Female Fertility in Frederica
Fertility by Age in Frederica
Average fertility rate in Frederica is 6.0 births per 1,000 women. Women in the age bracket of 20 to 34 years have the highest fertility rate with 13.0 births per 1,000 women. Women in the age bracket of 20 to 34 years acount for 100.0% of all women with births.
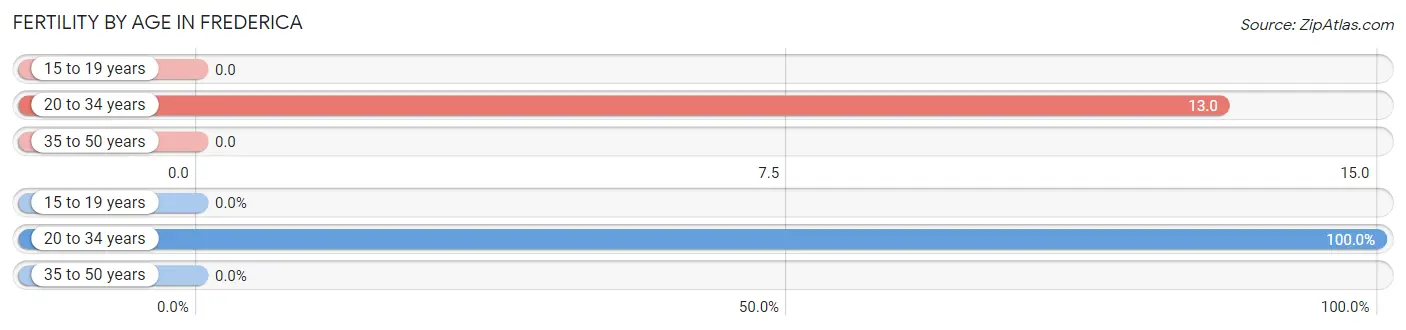
| Age Bracket | Women with Births | Births / 1,000 Women |
| 15 to 19 years | 0 (0.0%) | 0.0 |
| 20 to 34 years | 2 (100.0%) | 13.0 |
| 35 to 50 years | 0 (0.0%) | 0.0 |
| Total | 2 (100.0%) | 6.0 |
Fertility by Age by Marriage Status in Frederica
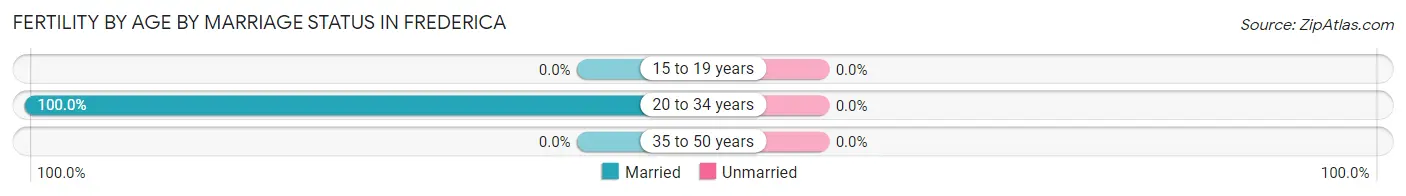
| Age Bracket | Married | Unmarried |
| 15 to 19 years | 0 (0.0%) | 0 (0.0%) |
| 20 to 34 years | 2 (100.0%) | 0 (0.0%) |
| 35 to 50 years | 0 (0.0%) | 0 (0.0%) |
| Total | 2 (100.0%) | 0 (0.0%) |
Fertility by Education in Frederica
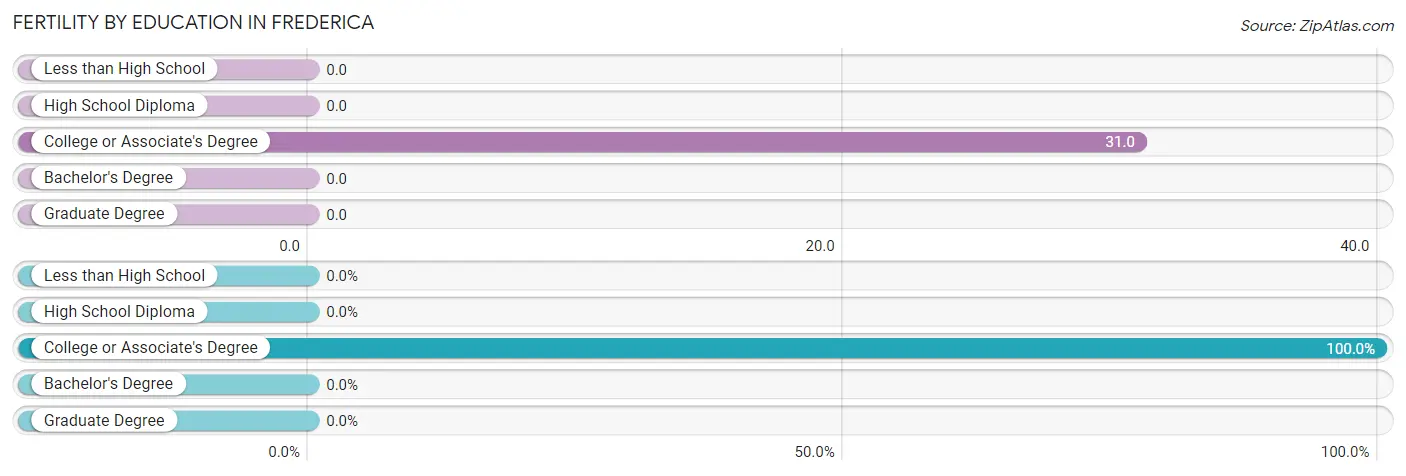
| Educational Attainment | Women with Births | Births / 1,000 Women |
| Less than High School | 0 (0.0%) | 0.0 |
| High School Diploma | 0 (0.0%) | 0.0 |
| College or Associate's Degree | 2 (100.0%) | 31.0 |
| Bachelor's Degree | 0 (0.0%) | 0.0 |
| Graduate Degree | 0 (0.0%) | 0.0 |
| Total | 2 (100.0%) | 6.0 |
Fertility by Education by Marriage Status in Frederica
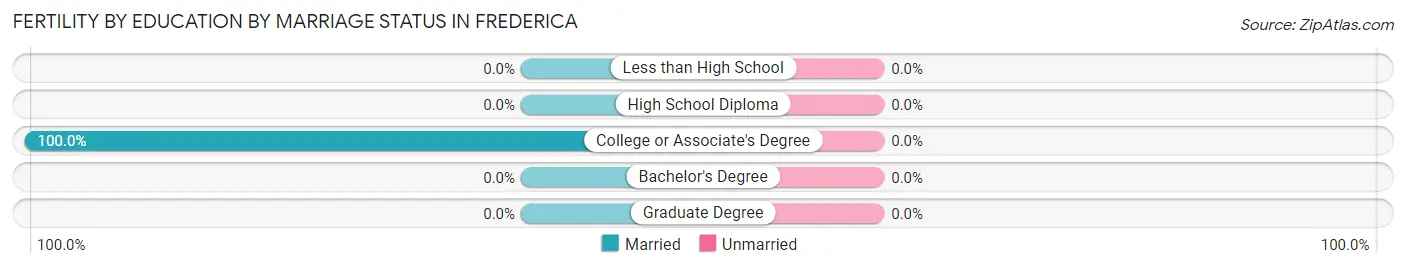
| Educational Attainment | Married | Unmarried |
| Less than High School | 0 (0.0%) | 0 (0.0%) |
| High School Diploma | 0 (0.0%) | 0 (0.0%) |
| College or Associate's Degree | 2 (100.0%) | 0 (0.0%) |
| Bachelor's Degree | 0 (0.0%) | 0 (0.0%) |
| Graduate Degree | 0 (0.0%) | 0 (0.0%) |
| Total | 2 (100.0%) | 0 (0.0%) |
Income in Frederica
Income Overview in Frederica
Per Capita Income in Frederica is $24,666, while median incomes of families and households are $55,703 and $63,200 respectively.
| Characteristic | Number | Measure |
| Per Capita Income | 1,001 | $24,666 |
| Median Family Income | 233 | $55,703 |
| Mean Family Income | 233 | $64,975 |
| Median Household Income | 346 | $63,200 |
| Mean Household Income | 346 | $67,484 |
| Income Deficit | 233 | $0 |
| Wage / Income Gap (%) | 1,001 | 0.00% |
| Wage / Income Gap ($) | 1,001 | 100.00¢ per $1 |
| Gini / Inequality Index | 1,001 | 0.31 |
Earnings by Sex in Frederica
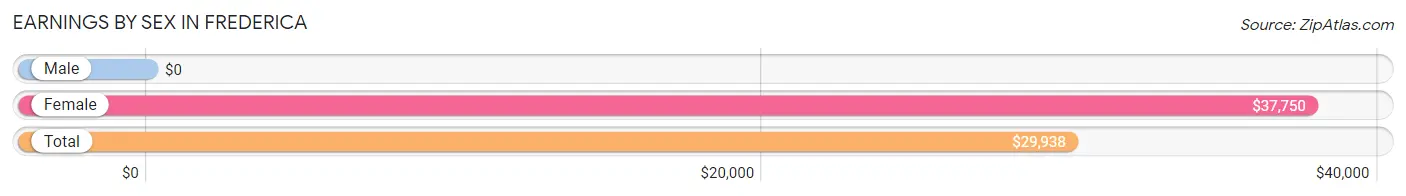
| Sex | Number | Average Earnings |
| Male | 255 (46.6%) | $0 |
| Female | 292 (53.4%) | $37,750 |
| Total | 547 (100.0%) | $29,938 |
Earnings by Sex by Income Bracket in Frederica
The most common earnings brackets in Frederica are $2,499 or less for men (71 | 27.8%) and $5,000 to $7,499 for women (61 | 20.9%).
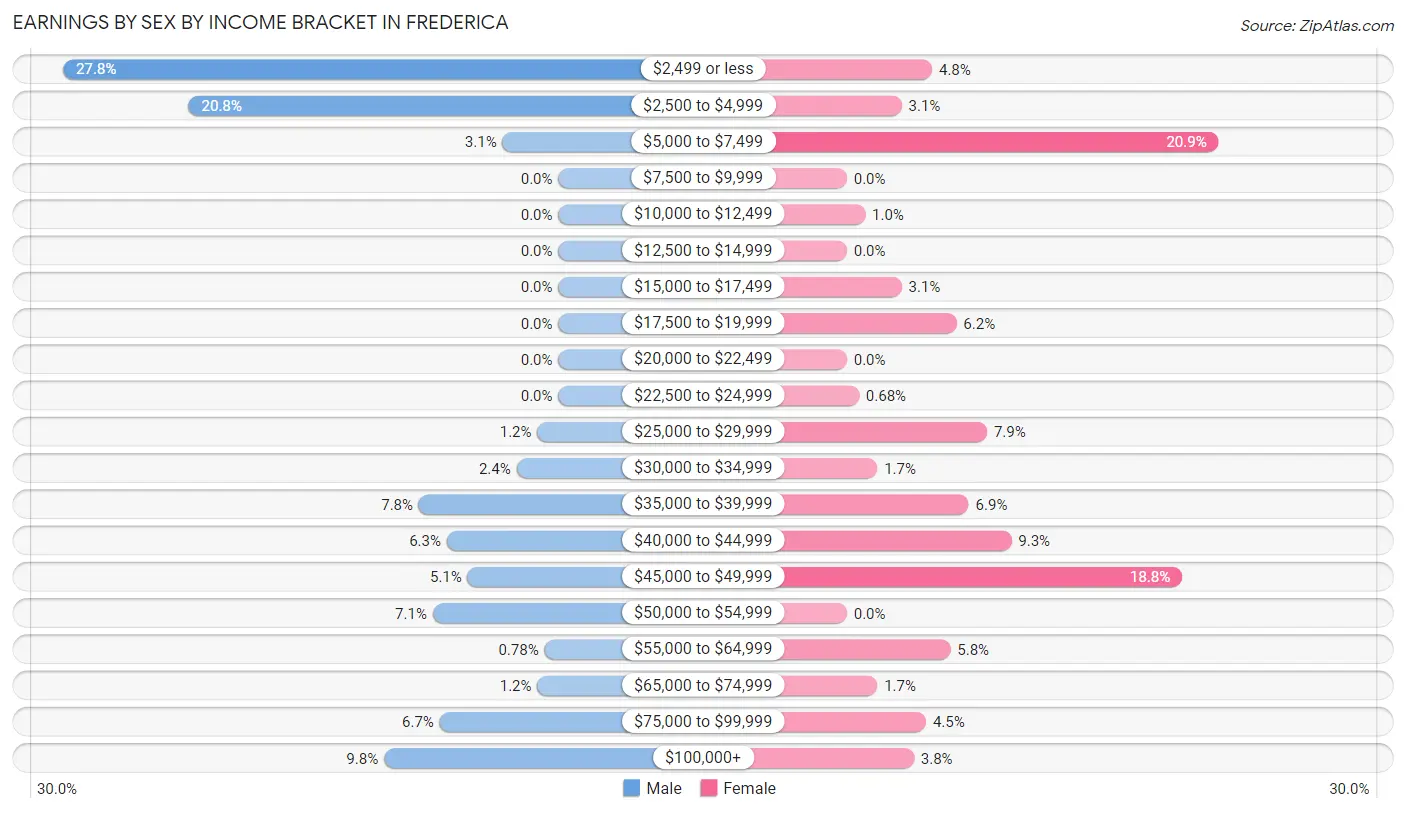
| Income | Male | Female |
| $2,499 or less | 71 (27.8%) | 14 (4.8%) |
| $2,500 to $4,999 | 53 (20.8%) | 9 (3.1%) |
| $5,000 to $7,499 | 8 (3.1%) | 61 (20.9%) |
| $7,500 to $9,999 | 0 (0.0%) | 0 (0.0%) |
| $10,000 to $12,499 | 0 (0.0%) | 3 (1.0%) |
| $12,500 to $14,999 | 0 (0.0%) | 0 (0.0%) |
| $15,000 to $17,499 | 0 (0.0%) | 9 (3.1%) |
| $17,500 to $19,999 | 0 (0.0%) | 18 (6.2%) |
| $20,000 to $22,499 | 0 (0.0%) | 0 (0.0%) |
| $22,500 to $24,999 | 0 (0.0%) | 2 (0.7%) |
| $25,000 to $29,999 | 3 (1.2%) | 23 (7.9%) |
| $30,000 to $34,999 | 6 (2.4%) | 5 (1.7%) |
| $35,000 to $39,999 | 20 (7.8%) | 20 (6.9%) |
| $40,000 to $44,999 | 16 (6.3%) | 27 (9.2%) |
| $45,000 to $49,999 | 13 (5.1%) | 55 (18.8%) |
| $50,000 to $54,999 | 18 (7.1%) | 0 (0.0%) |
| $55,000 to $64,999 | 2 (0.8%) | 17 (5.8%) |
| $65,000 to $74,999 | 3 (1.2%) | 5 (1.7%) |
| $75,000 to $99,999 | 17 (6.7%) | 13 (4.4%) |
| $100,000+ | 25 (9.8%) | 11 (3.8%) |
| Total | 255 (100.0%) | 292 (100.0%) |
Earnings by Sex by Educational Attainment in Frederica
Average earnings in Frederica are $44,545 for men and $45,625 for women, a difference of 2.4%. Men with an educational attainment of bachelor's degree enjoy the highest average annual earnings of $78,571, while those with graduate degree education earn the least with $30,625. Women with an educational attainment of bachelor's degree earn the most with the average annual earnings of $49,076, while those with high school diploma education have the smallest earnings of $41,442.
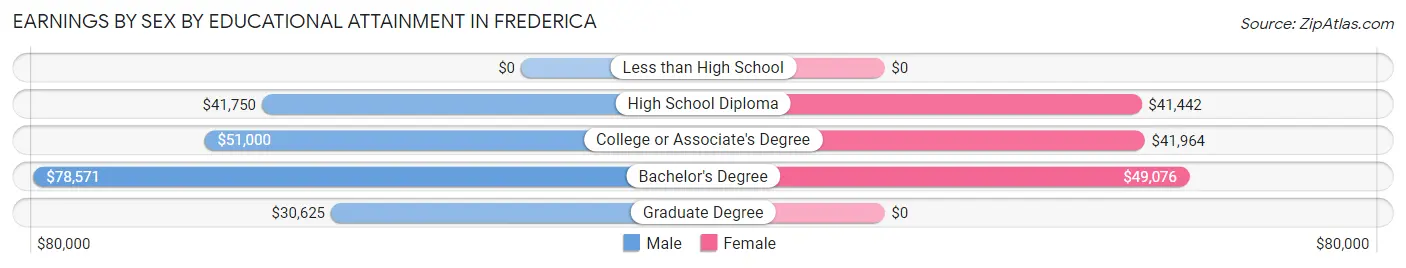
| Educational Attainment | Male Income | Female Income |
| Less than High School | - | - |
| High School Diploma | $41,750 | $41,442 |
| College or Associate's Degree | $51,000 | $41,964 |
| Bachelor's Degree | $78,571 | $49,076 |
| Graduate Degree | $30,625 | $0 |
| Total | $44,545 | $45,625 |
Family Income in Frederica
Family Income Brackets in Frederica
According to the Frederica family income data, there are 62 families falling into the $50,000 to $74,999 income range, which is the most common income bracket and makes up 26.6% of all families. Conversely, the less than $10,000 income bracket is the least frequent group with only 1 families (0.4%) belonging to this category.
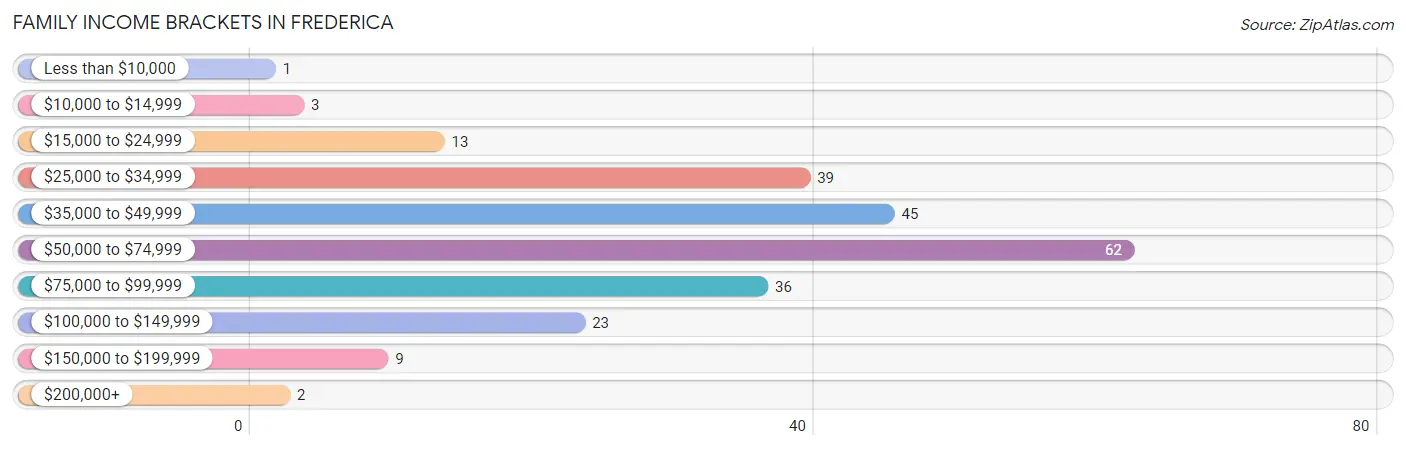
| Income Bracket | # Families | % Families |
| Less than $10,000 | 1 | 0.4% |
| $10,000 to $14,999 | 3 | 1.3% |
| $15,000 to $24,999 | 13 | 5.6% |
| $25,000 to $34,999 | 39 | 16.7% |
| $35,000 to $49,999 | 45 | 19.3% |
| $50,000 to $74,999 | 62 | 26.6% |
| $75,000 to $99,999 | 36 | 15.5% |
| $100,000 to $149,999 | 23 | 9.9% |
| $150,000 to $199,999 | 9 | 3.9% |
| $200,000+ | 2 | 0.9% |
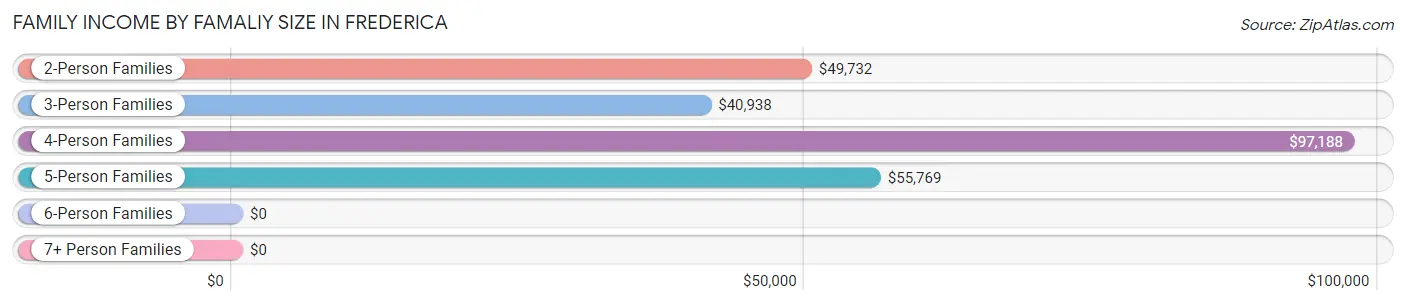
Family Income by Famaliy Size in Frederica
4-person families (22 | 9.4%) account for the highest median family income in Frederica with $97,188 per family, while 2-person families (97 | 41.6%) have the highest median income of $24,866 per family member.
| Income Bracket | # Families | Median Income |
| 2-Person Families | 97 (41.6%) | $49,732 |
| 3-Person Families | 65 (27.9%) | $40,938 |
| 4-Person Families | 22 (9.4%) | $97,188 |
| 5-Person Families | 26 (11.2%) | $55,769 |
| 6-Person Families | 0 (0.0%) | $0 |
| 7+ Person Families | 23 (9.9%) | $0 |
| Total | 233 (100.0%) | $55,703 |
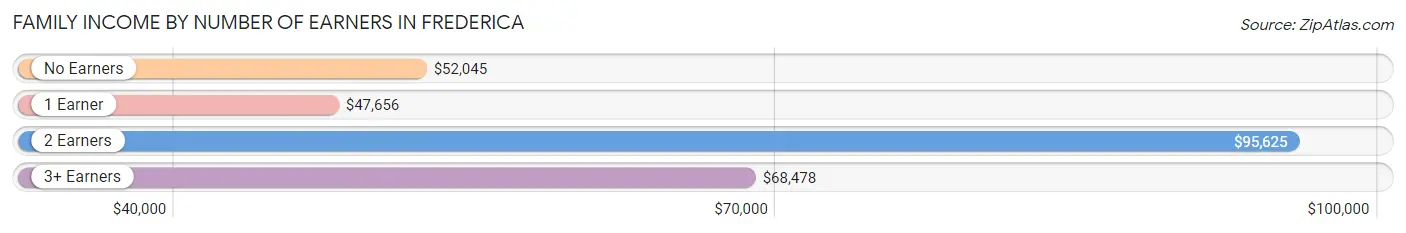
Family Income by Number of Earners in Frederica
The median family income in Frederica is $55,703, with families comprising 2 earners (57) having the highest median family income of $95,625, while families with 1 earner (84) have the lowest median family income of $47,656, accounting for 24.5% and 36.0% of families, respectively.
| Number of Earners | # Families | Median Income |
| No Earners | 56 (24.0%) | $52,045 |
| 1 Earner | 84 (36.0%) | $47,656 |
| 2 Earners | 57 (24.5%) | $95,625 |
| 3+ Earners | 36 (15.4%) | $68,478 |
| Total | 233 (100.0%) | $55,703 |
Household Income in Frederica
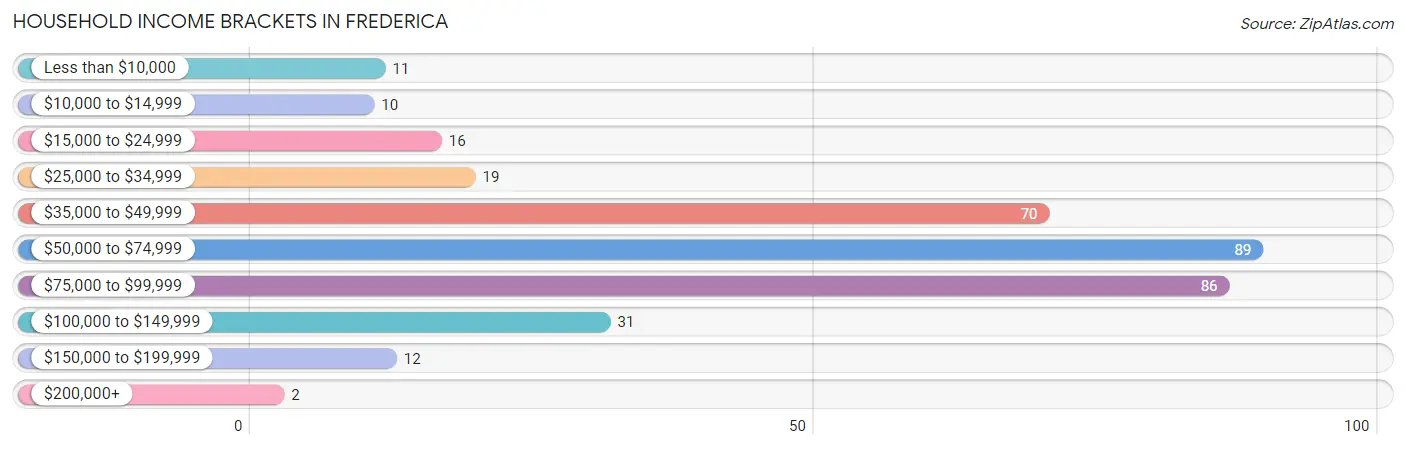
Household Income Brackets in Frederica
With 89 households falling in the category, the $50,000 to $74,999 income range is the most frequent in Frederica, accounting for 25.7% of all households. In contrast, only 2 households (0.6%) fall into the $200,000+ income bracket, making it the least populous group.
| Income Bracket | # Households | % Households |
| Less than $10,000 | 11 | 3.2% |
| $10,000 to $14,999 | 10 | 2.9% |
| $15,000 to $24,999 | 16 | 4.6% |
| $25,000 to $34,999 | 19 | 5.5% |
| $35,000 to $49,999 | 70 | 20.2% |
| $50,000 to $74,999 | 89 | 25.7% |
| $75,000 to $99,999 | 86 | 24.9% |
| $100,000 to $149,999 | 31 | 9.0% |
| $150,000 to $199,999 | 12 | 3.5% |
| $200,000+ | 2 | 0.6% |
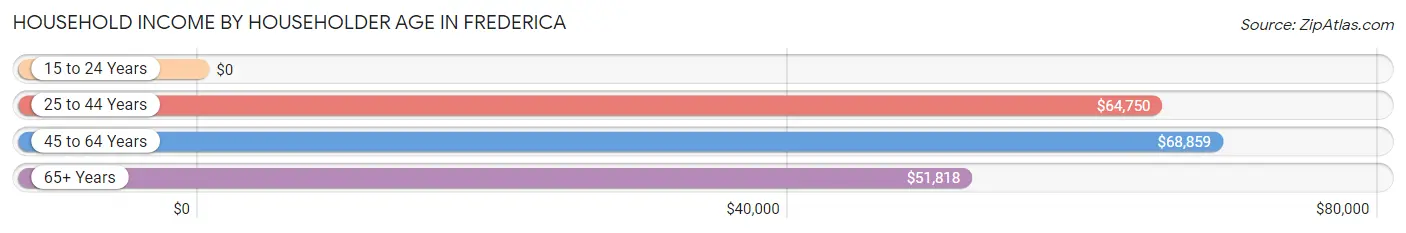
Household Income by Householder Age in Frederica
The median household income in Frederica is $63,200, with the highest median household income of $68,859 found in the 45 to 64 years age bracket for the primary householder. A total of 89 households (25.7%) fall into this category. Meanwhile, the 15 to 24 years age bracket for the primary householder has the lowest median household income of $0, with 16 households (4.6%) in this group.
| Income Bracket | # Households | Median Income |
| 15 to 24 Years | 16 (4.6%) | $0 |
| 25 to 44 Years | 143 (41.3%) | $64,750 |
| 45 to 64 Years | 89 (25.7%) | $68,859 |
| 65+ Years | 98 (28.3%) | $51,818 |
| Total | 346 (100.0%) | $63,200 |
Poverty in Frederica
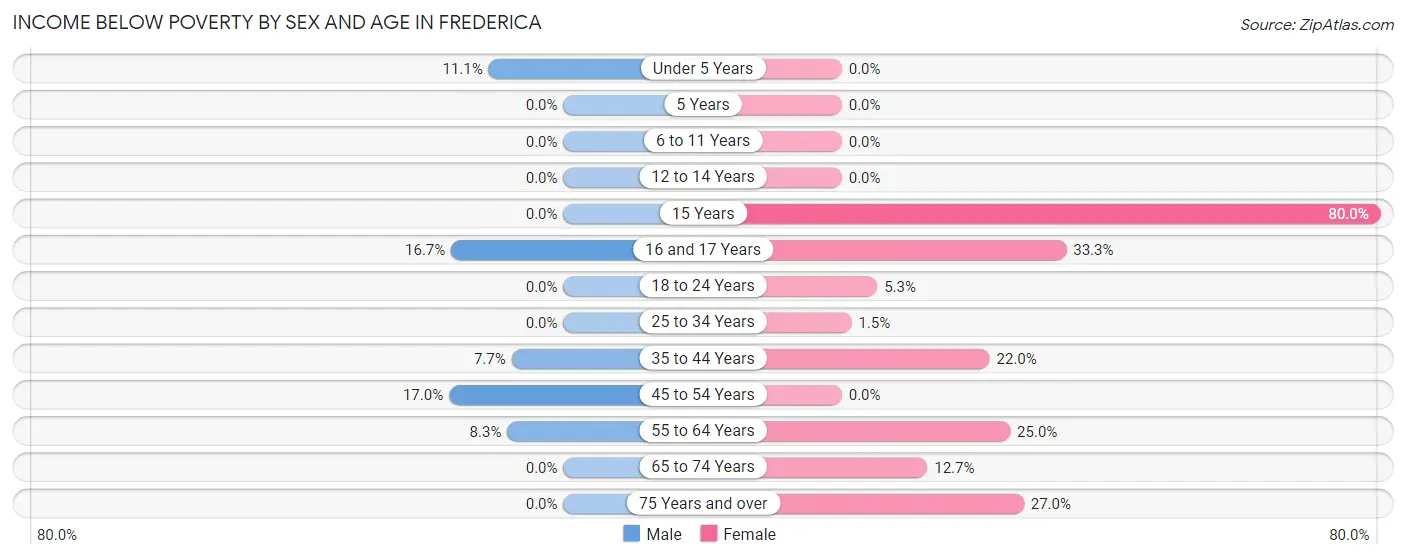
Income Below Poverty by Sex and Age in Frederica
With 6.9% poverty level for males and 9.4% for females among the residents of Frederica, 45 to 54 year old males and 15 year old females are the most vulnerable to poverty, with 9 males (17.0%) and 4 females (80.0%) in their respective age groups living below the poverty level.
| Age Bracket | Male | Female |
| Under 5 Years | 2 (11.1%) | 0 (0.0%) |
| 5 Years | 0 (0.0%) | 0 (0.0%) |
| 6 to 11 Years | 0 (0.0%) | 0 (0.0%) |
| 12 to 14 Years | 0 (0.0%) | 0 (0.0%) |
| 15 Years | 0 (0.0%) | 4 (80.0%) |
| 16 and 17 Years | 10 (16.7%) | 4 (33.3%) |
| 18 to 24 Years | 0 (0.0%) | 6 (5.3%) |
| 25 to 34 Years | 0 (0.0%) | 1 (1.5%) |
| 35 to 44 Years | 5 (7.7%) | 18 (22.0%) |
| 45 to 54 Years | 9 (17.0%) | 0 (0.0%) |
| 55 to 64 Years | 3 (8.3%) | 4 (25.0%) |
| 65 to 74 Years | 0 (0.0%) | 8 (12.7%) |
| 75 Years and over | 0 (0.0%) | 10 (27.0%) |
| Total | 29 (6.9%) | 55 (9.4%) |
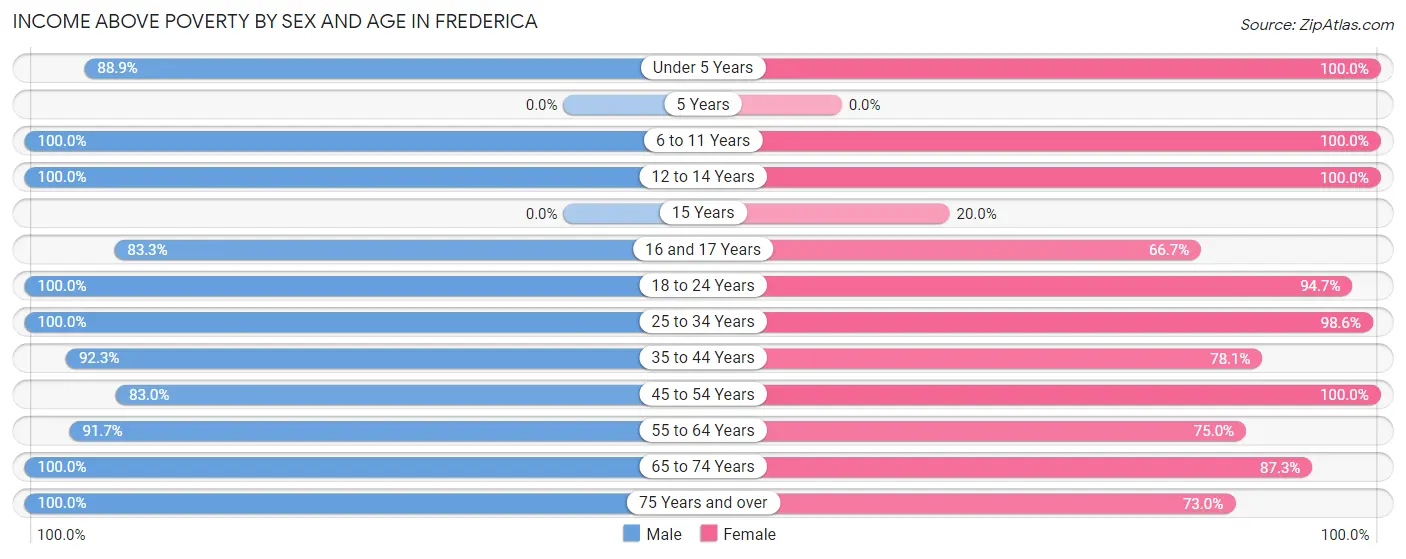
Income Above Poverty by Sex and Age in Frederica
According to the poverty statistics in Frederica, males aged 6 to 11 years and females aged under 5 years are the age groups that are most secure financially, with 100.0% of males and 100.0% of females in these age groups living above the poverty line.
| Age Bracket | Male | Female |
| Under 5 Years | 16 (88.9%) | 66 (100.0%) |
| 5 Years | 0 (0.0%) | 0 (0.0%) |
| 6 to 11 Years | 10 (100.0%) | 34 (100.0%) |
| 12 to 14 Years | 27 (100.0%) | 34 (100.0%) |
| 15 Years | 0 (0.0%) | 1 (20.0%) |
| 16 and 17 Years | 50 (83.3%) | 8 (66.7%) |
| 18 to 24 Years | 55 (100.0%) | 108 (94.7%) |
| 25 to 34 Years | 28 (100.0%) | 68 (98.6%) |
| 35 to 44 Years | 60 (92.3%) | 64 (78.0%) |
| 45 to 54 Years | 44 (83.0%) | 51 (100.0%) |
| 55 to 64 Years | 33 (91.7%) | 12 (75.0%) |
| 65 to 74 Years | 52 (100.0%) | 55 (87.3%) |
| 75 Years and over | 14 (100.0%) | 27 (73.0%) |
| Total | 389 (93.1%) | 528 (90.6%) |
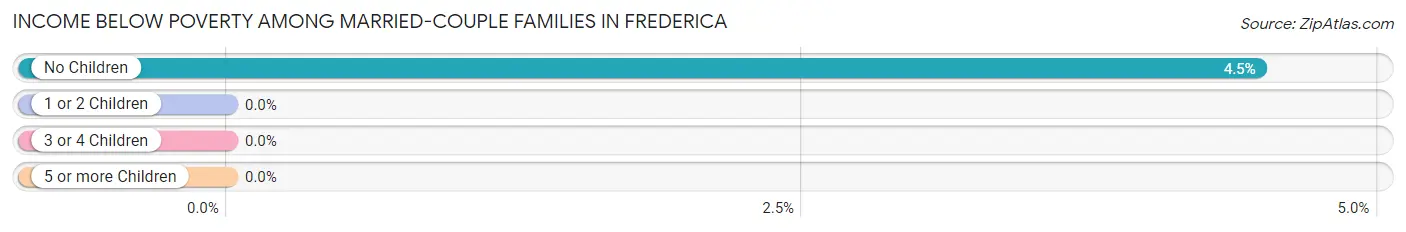
Income Below Poverty Among Married-Couple Families in Frederica
The poverty statistics for married-couple families in Frederica show that 2.6% or 3 of the total 113 families live below the poverty line. Families with no children have the highest poverty rate of 4.5%, comprising of 3 families. On the other hand, families with 1 or 2 children have the lowest poverty rate of 0.0%, which includes 0 families.
| Children | Above Poverty | Below Poverty |
| No Children | 64 (95.5%) | 3 (4.5%) |
| 1 or 2 Children | 46 (100.0%) | 0 (0.0%) |
| 3 or 4 Children | 0 (0.0%) | 0 (0.0%) |
| 5 or more Children | 0 (0.0%) | 0 (0.0%) |
| Total | 110 (97.4%) | 3 (2.6%) |
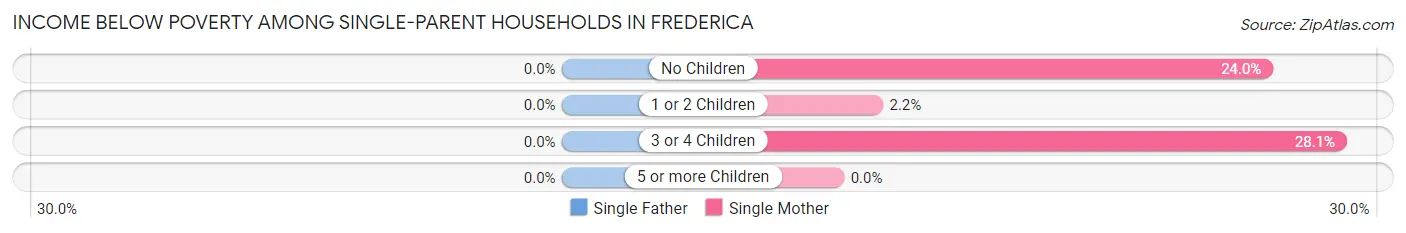
Income Below Poverty Among Single-Parent Households in Frederica
| Children | Single Father | Single Mother |
| No Children | 0 (0.0%) | 6 (24.0%) |
| 1 or 2 Children | 0 (0.0%) | 1 (2.2%) |
| 3 or 4 Children | 0 (0.0%) | 9 (28.1%) |
| 5 or more Children | 0 (0.0%) | 0 (0.0%) |
| Total | 0 (0.0%) | 16 (15.5%) |
Income Below Poverty Among Married-Couple vs Single-Parent Households in Frederica
The poverty data for Frederica shows that 3 of the married-couple family households (2.6%) and 16 of the single-parent households (13.3%) are living below the poverty level. Within the married-couple family households, those with no children have the highest poverty rate, with 3 households (4.5%) falling below the poverty line. Among the single-parent households, those with 3 or 4 children have the highest poverty rate, with 9 household (25.0%) living below poverty.
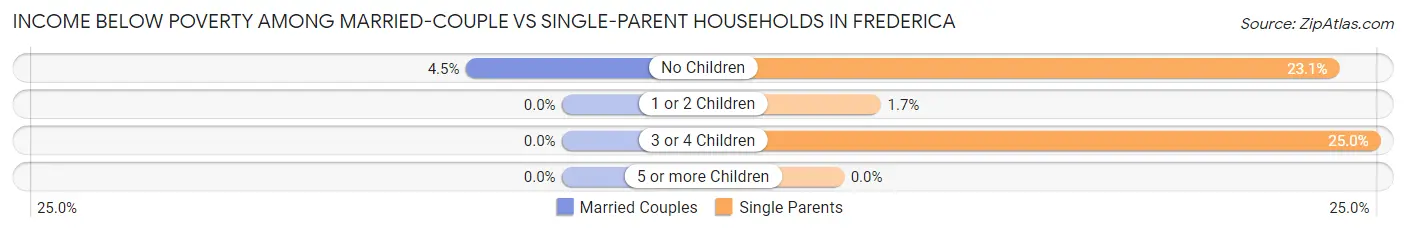
| Children | Married-Couple Families | Single-Parent Households |
| No Children | 3 (4.5%) | 6 (23.1%) |
| 1 or 2 Children | 0 (0.0%) | 1 (1.7%) |
| 3 or 4 Children | 0 (0.0%) | 9 (25.0%) |
| 5 or more Children | 0 (0.0%) | 0 (0.0%) |
| Total | 3 (2.6%) | 16 (13.3%) |
Employment Characteristics in Frederica
Employment by Class of Employer in Frederica
Among the 486 employed individuals in Frederica, private company employees (262 | 53.9%), local government employees (81 | 16.7%), and not-for-profit organizations (58 | 11.9%) make up the most common classes of employment.
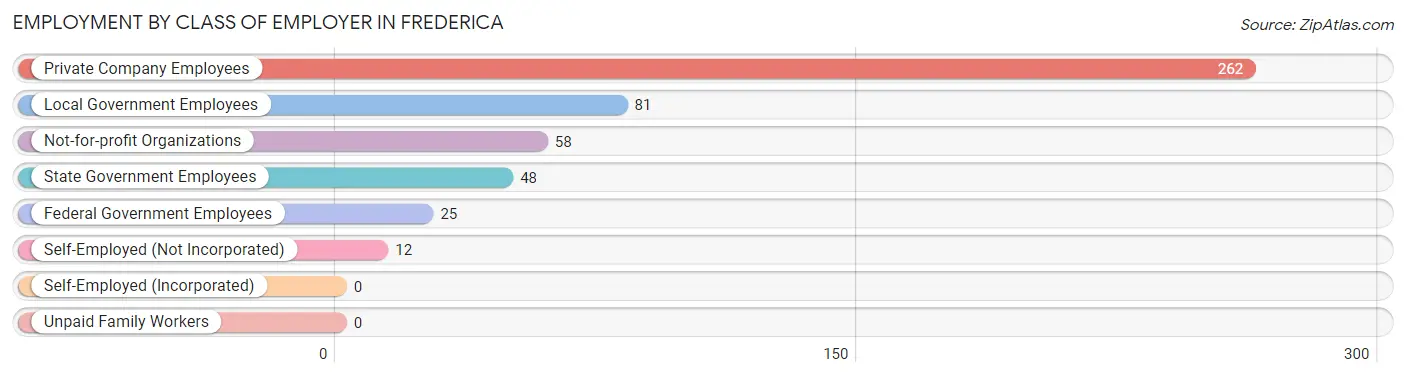
| Employer Class | # Employees | % Employees |
| Private Company Employees | 262 | 53.9% |
| Self-Employed (Incorporated) | 0 | 0.0% |
| Self-Employed (Not Incorporated) | 12 | 2.5% |
| Not-for-profit Organizations | 58 | 11.9% |
| Local Government Employees | 81 | 16.7% |
| State Government Employees | 48 | 9.9% |
| Federal Government Employees | 25 | 5.1% |
| Unpaid Family Workers | 0 | 0.0% |
| Total | 486 | 100.0% |
Employment Status by Age in Frederica
According to the labor force statistics for Frederica, out of the total population over 16 years of age (807), 65.4% or 528 individuals are in the labor force, with 5.1% or 27 of them unemployed. The age group with the highest labor force participation rate is 25 to 29 years, with 96.1% or 49 individuals in the labor force. Within the labor force, the 65 to 74 years age range has the highest percentage of unemployed individuals, with 38.5% or 5 of them being unemployed.
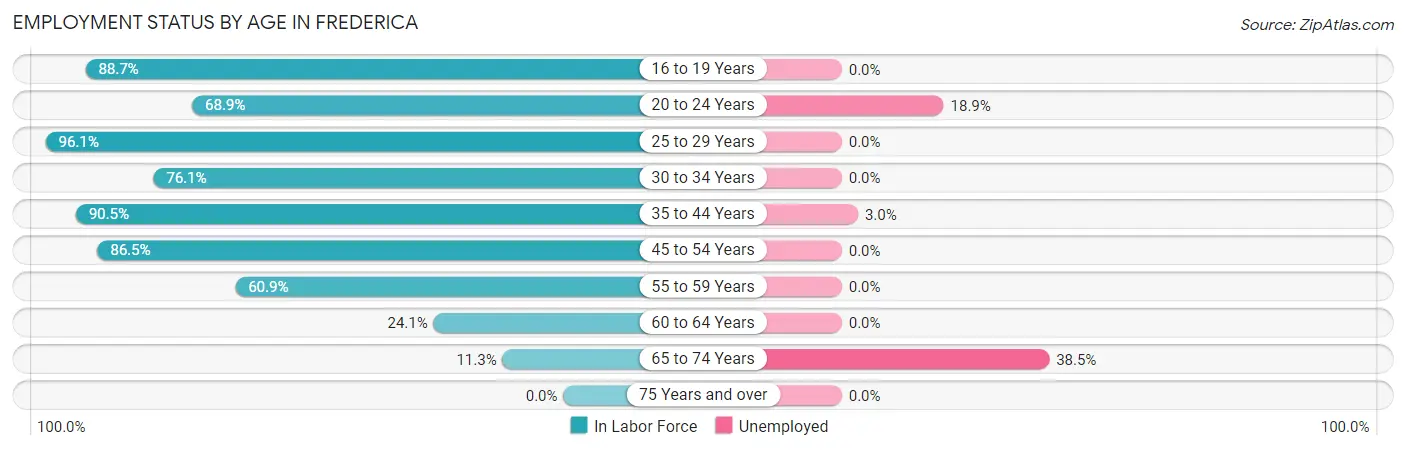
| Age Bracket | In Labor Force | Unemployed |
| 16 to 19 Years | 94 (88.7%) | 0 (0.0%) |
| 20 to 24 Years | 93 (68.9%) | 18 (18.9%) |
| 25 to 29 Years | 49 (96.1%) | 0 (0.0%) |
| 30 to 34 Years | 35 (76.1%) | 0 (0.0%) |
| 35 to 44 Years | 133 (90.5%) | 4 (3.0%) |
| 45 to 54 Years | 90 (86.5%) | 0 (0.0%) |
| 55 to 59 Years | 14 (60.9%) | 0 (0.0%) |
| 60 to 64 Years | 7 (24.1%) | 0 (0.0%) |
| 65 to 74 Years | 13 (11.3%) | 5 (38.5%) |
| 75 Years and over | 0 (0.0%) | 0 (0.0%) |
| Total | 528 (65.4%) | 27 (5.1%) |
Employment Status by Educational Attainment in Frederica
According to labor force statistics for Frederica, 82.0% of individuals (328) out of the total population between 25 and 64 years of age (400) are in the labor force, with 1.3% or 4 of them being unemployed. The group with the highest labor force participation rate are those with the educational attainment of high school diploma, with 94.0% or 110 individuals in the labor force. Within the labor force, individuals with less than high school education have the highest percentage of unemployment, with 6.0% or 3 of them being unemployed.
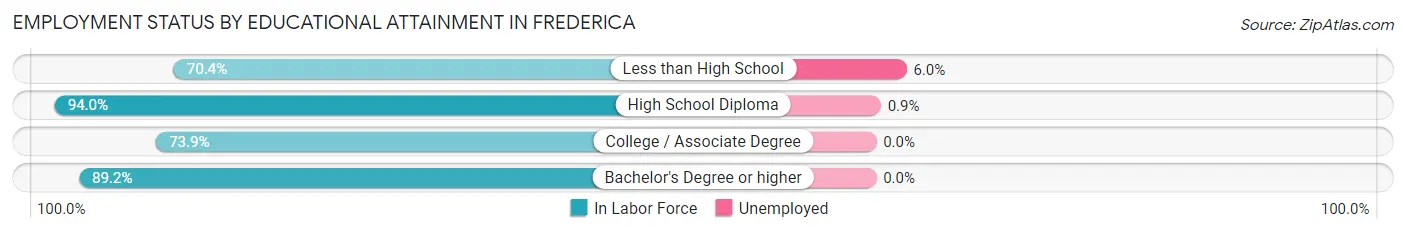
| Educational Attainment | In Labor Force | Unemployed |
| Less than High School | 50 (70.4%) | 4 (6.0%) |
| High School Diploma | 110 (94.0%) | 1 (0.9%) |
| College / Associate Degree | 102 (73.9%) | 0 (0.0%) |
| Bachelor's Degree or higher | 66 (89.2%) | 0 (0.0%) |
| Total | 328 (82.0%) | 5 (1.3%) |
Employment Occupations by Sex in Frederica
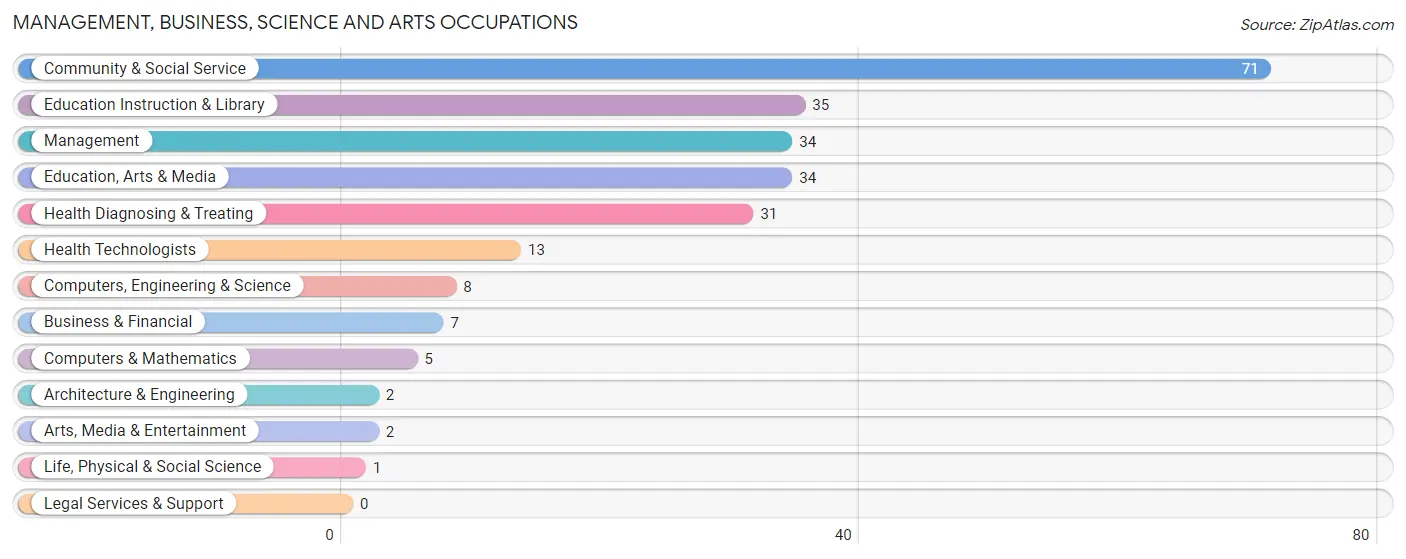
Management, Business, Science and Arts Occupations
The most common Management, Business, Science and Arts occupations in Frederica are Community & Social Service (71 | 14.7%), Education Instruction & Library (35 | 7.2%), Management (34 | 7.0%), Education, Arts & Media (34 | 7.0%), and Health Diagnosing & Treating (31 | 6.4%).
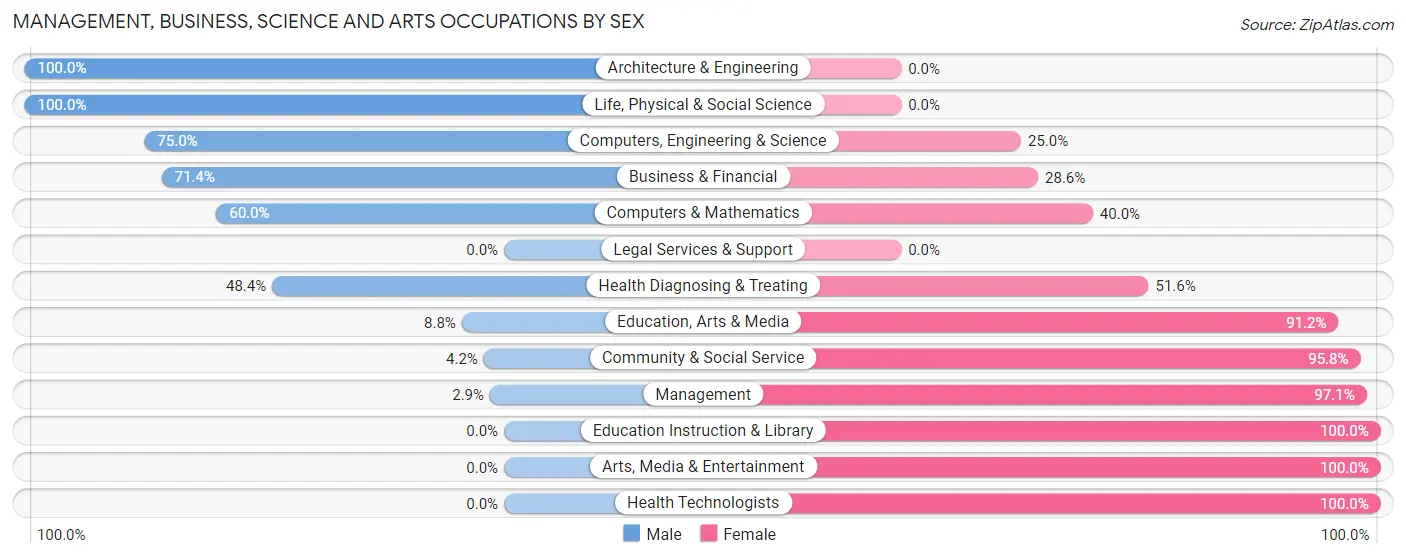
Management, Business, Science and Arts Occupations by Sex
Within the Management, Business, Science and Arts occupations in Frederica, the most male-oriented occupations are Architecture & Engineering (100.0%), Life, Physical & Social Science (100.0%), and Computers, Engineering & Science (75.0%), while the most female-oriented occupations are Education Instruction & Library (100.0%), Arts, Media & Entertainment (100.0%), and Health Technologists (100.0%).
| Occupation | Male | Female |
| Management | 1 (2.9%) | 33 (97.1%) |
| Business & Financial | 5 (71.4%) | 2 (28.6%) |
| Computers, Engineering & Science | 6 (75.0%) | 2 (25.0%) |
| Computers & Mathematics | 3 (60.0%) | 2 (40.0%) |
| Architecture & Engineering | 2 (100.0%) | 0 (0.0%) |
| Life, Physical & Social Science | 1 (100.0%) | 0 (0.0%) |
| Community & Social Service | 3 (4.2%) | 68 (95.8%) |
| Education, Arts & Media | 3 (8.8%) | 31 (91.2%) |
| Legal Services & Support | 0 (0.0%) | 0 (0.0%) |
| Education Instruction & Library | 0 (0.0%) | 35 (100.0%) |
| Arts, Media & Entertainment | 0 (0.0%) | 2 (100.0%) |
| Health Diagnosing & Treating | 15 (48.4%) | 16 (51.6%) |
| Health Technologists | 0 (0.0%) | 13 (100.0%) |
| Total (Category) | 30 (19.9%) | 121 (80.1%) |
| Total (Overall) | 245 (50.6%) | 239 (49.4%) |
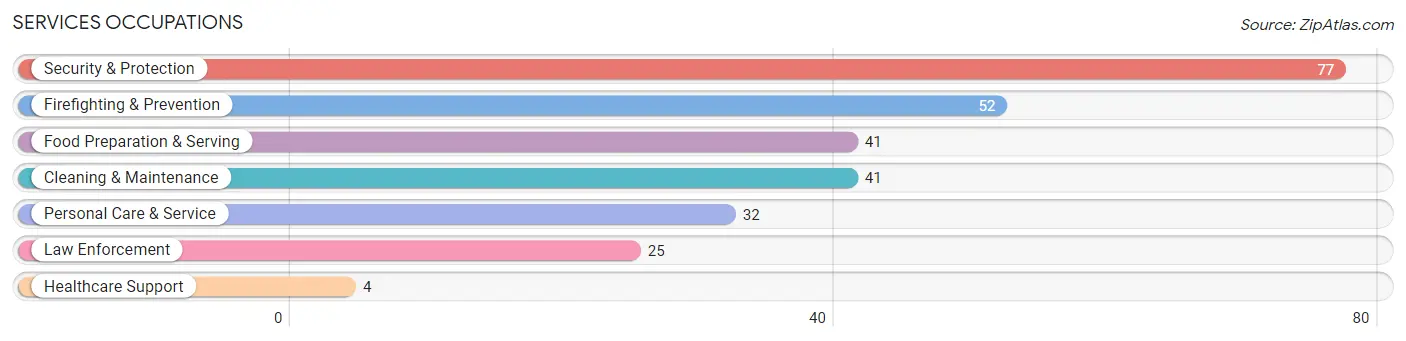
Services Occupations
The most common Services occupations in Frederica are Security & Protection (77 | 15.9%), Firefighting & Prevention (52 | 10.7%), Food Preparation & Serving (41 | 8.5%), Cleaning & Maintenance (41 | 8.5%), and Personal Care & Service (32 | 6.6%).
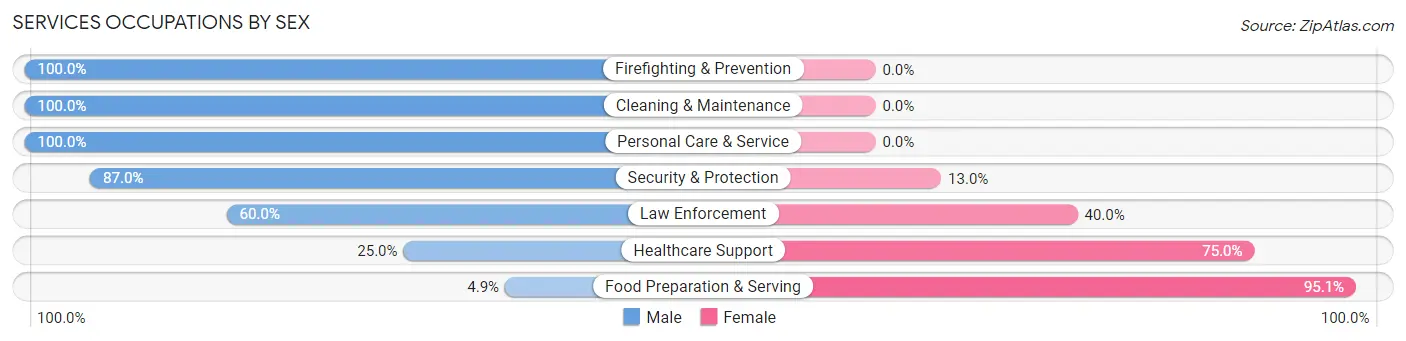
Services Occupations by Sex
Within the Services occupations in Frederica, the most male-oriented occupations are Firefighting & Prevention (100.0%), Cleaning & Maintenance (100.0%), and Personal Care & Service (100.0%), while the most female-oriented occupations are Food Preparation & Serving (95.1%), Healthcare Support (75.0%), and Law Enforcement (40.0%).
| Occupation | Male | Female |
| Healthcare Support | 1 (25.0%) | 3 (75.0%) |
| Security & Protection | 67 (87.0%) | 10 (13.0%) |
| Firefighting & Prevention | 52 (100.0%) | 0 (0.0%) |
| Law Enforcement | 15 (60.0%) | 10 (40.0%) |
| Food Preparation & Serving | 2 (4.9%) | 39 (95.1%) |
| Cleaning & Maintenance | 41 (100.0%) | 0 (0.0%) |
| Personal Care & Service | 32 (100.0%) | 0 (0.0%) |
| Total (Category) | 143 (73.3%) | 52 (26.7%) |
| Total (Overall) | 245 (50.6%) | 239 (49.4%) |
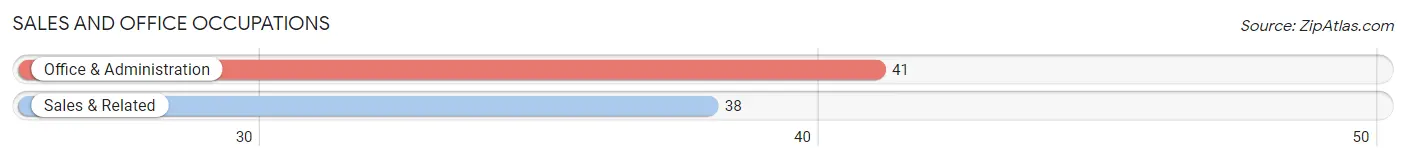
Sales and Office Occupations
The most common Sales and Office occupations in Frederica are Office & Administration (41 | 8.5%), and Sales & Related (38 | 7.9%).
Sales and Office Occupations by Sex
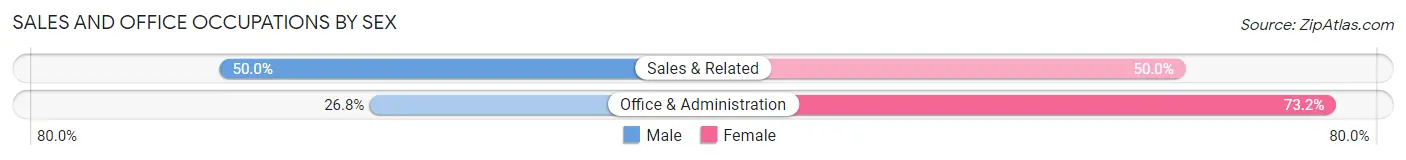
| Occupation | Male | Female |
| Sales & Related | 19 (50.0%) | 19 (50.0%) |
| Office & Administration | 11 (26.8%) | 30 (73.2%) |
| Total (Category) | 30 (38.0%) | 49 (62.0%) |
| Total (Overall) | 245 (50.6%) | 239 (49.4%) |
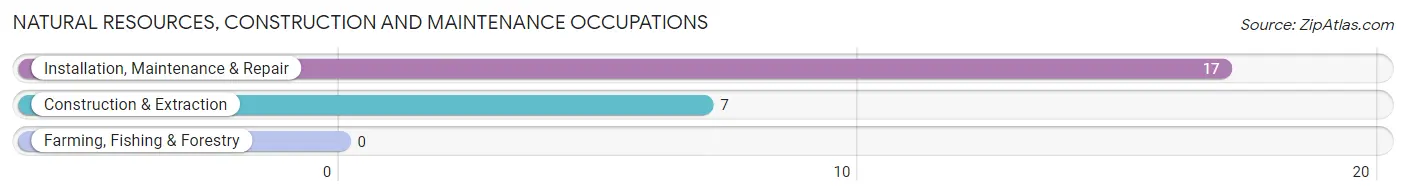
Natural Resources, Construction and Maintenance Occupations
The most common Natural Resources, Construction and Maintenance occupations in Frederica are Installation, Maintenance & Repair (17 | 3.5%), and Construction & Extraction (7 | 1.5%).
Natural Resources, Construction and Maintenance Occupations by Sex
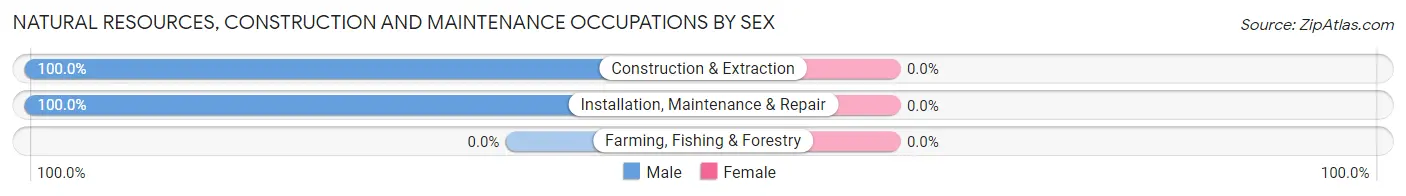
| Occupation | Male | Female |
| Farming, Fishing & Forestry | 0 (0.0%) | 0 (0.0%) |
| Construction & Extraction | 7 (100.0%) | 0 (0.0%) |
| Installation, Maintenance & Repair | 17 (100.0%) | 0 (0.0%) |
| Total (Category) | 24 (100.0%) | 0 (0.0%) |
| Total (Overall) | 245 (50.6%) | 239 (49.4%) |
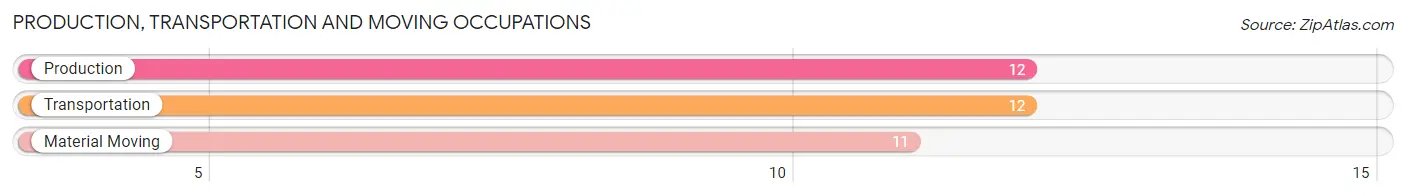
Production, Transportation and Moving Occupations
The most common Production, Transportation and Moving occupations in Frederica are Production (12 | 2.5%), Transportation (12 | 2.5%), and Material Moving (11 | 2.3%).
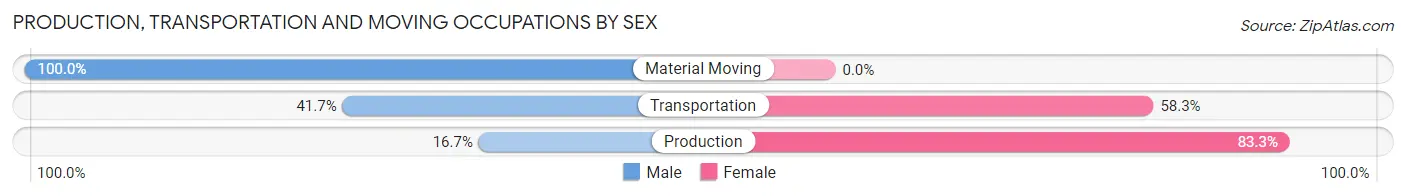
Production, Transportation and Moving Occupations by Sex
| Occupation | Male | Female |
| Production | 2 (16.7%) | 10 (83.3%) |
| Transportation | 5 (41.7%) | 7 (58.3%) |
| Material Moving | 11 (100.0%) | 0 (0.0%) |
| Total (Category) | 18 (51.4%) | 17 (48.6%) |
| Total (Overall) | 245 (50.6%) | 239 (49.4%) |
Employment Industries by Sex in Frederica
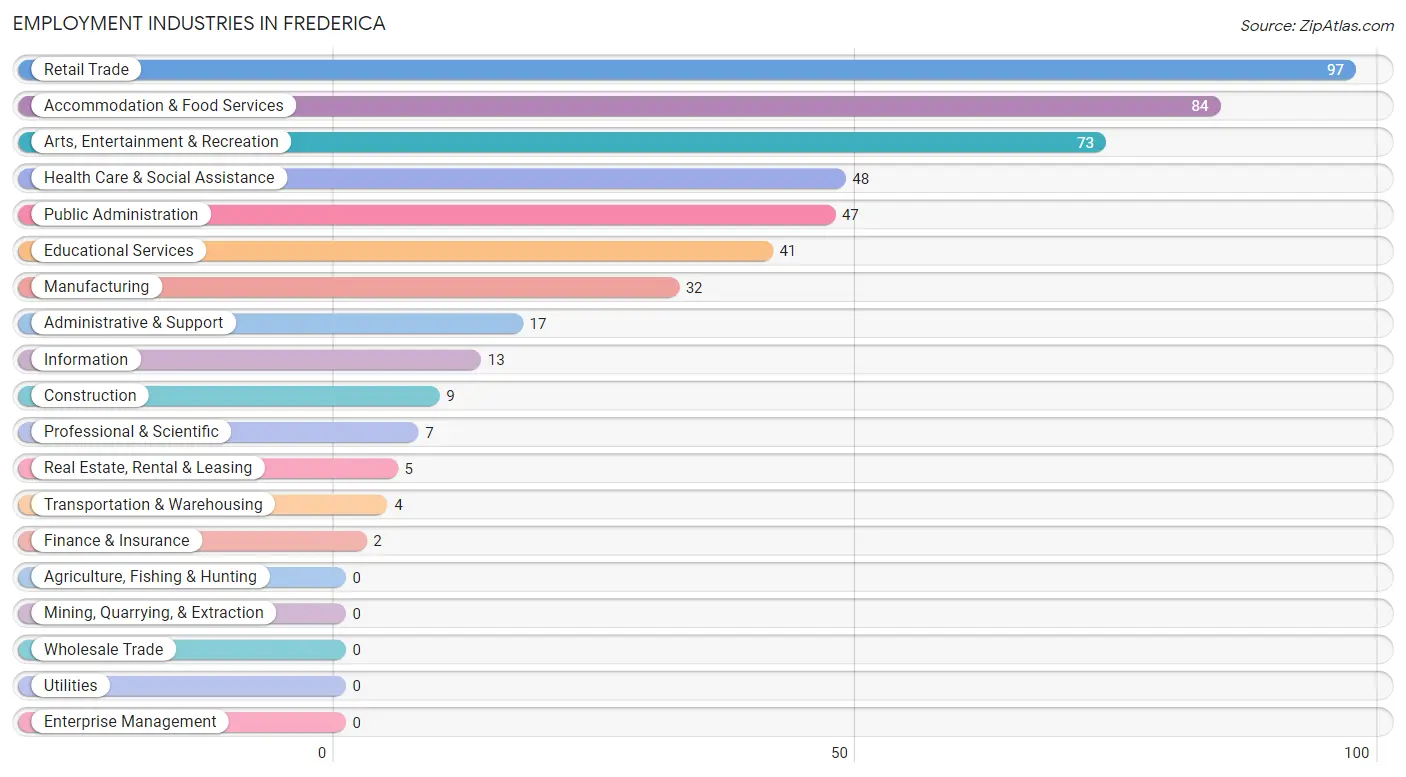
Employment Industries in Frederica
The major employment industries in Frederica include Retail Trade (97 | 20.0%), Accommodation & Food Services (84 | 17.4%), Arts, Entertainment & Recreation (73 | 15.1%), Health Care & Social Assistance (48 | 9.9%), and Public Administration (47 | 9.7%).
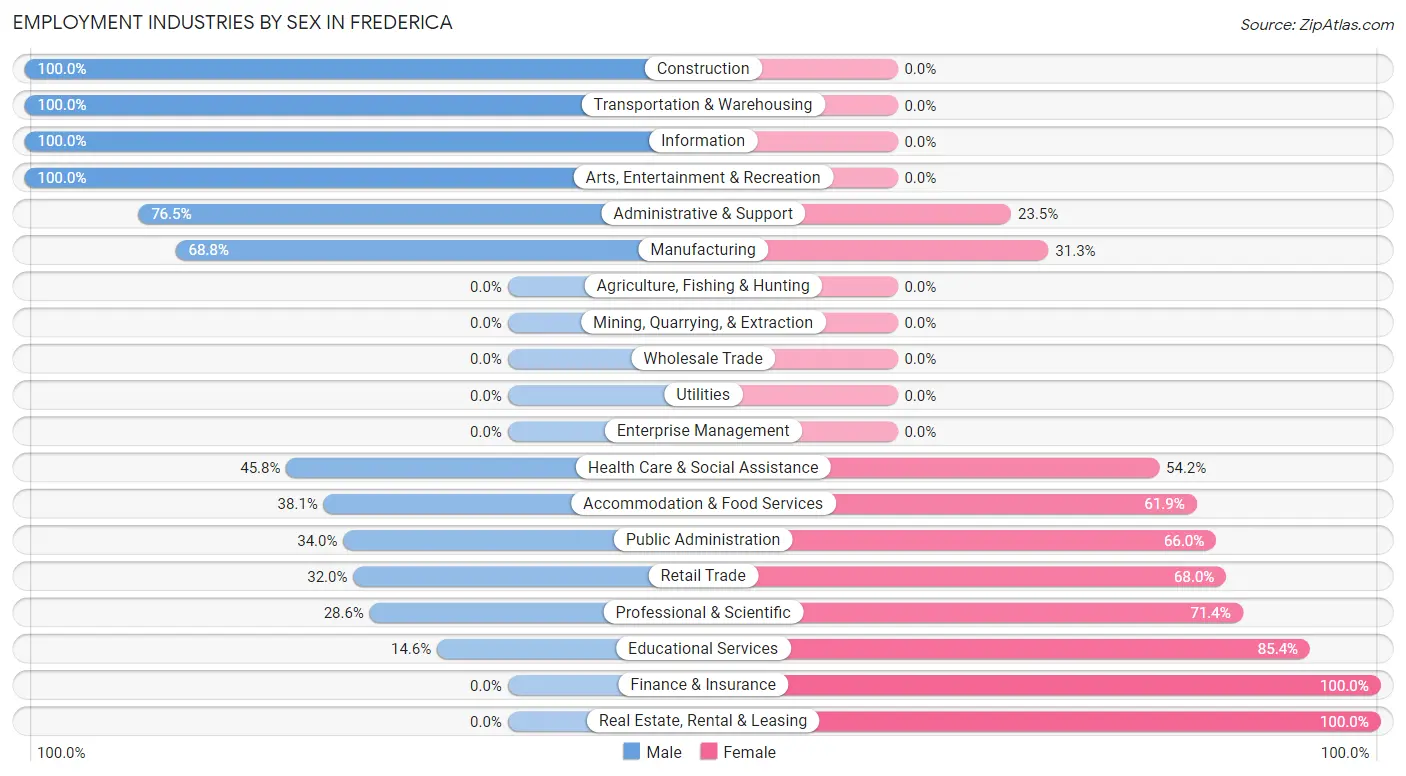
Employment Industries by Sex in Frederica
The Frederica industries that see more men than women are Construction (100.0%), Transportation & Warehousing (100.0%), and Information (100.0%), whereas the industries that tend to have a higher number of women are Finance & Insurance (100.0%), Real Estate, Rental & Leasing (100.0%), and Educational Services (85.4%).
| Industry | Male | Female |
| Agriculture, Fishing & Hunting | 0 (0.0%) | 0 (0.0%) |
| Mining, Quarrying, & Extraction | 0 (0.0%) | 0 (0.0%) |
| Construction | 9 (100.0%) | 0 (0.0%) |
| Manufacturing | 22 (68.8%) | 10 (31.2%) |
| Wholesale Trade | 0 (0.0%) | 0 (0.0%) |
| Retail Trade | 31 (32.0%) | 66 (68.0%) |
| Transportation & Warehousing | 4 (100.0%) | 0 (0.0%) |
| Utilities | 0 (0.0%) | 0 (0.0%) |
| Information | 13 (100.0%) | 0 (0.0%) |
| Finance & Insurance | 0 (0.0%) | 2 (100.0%) |
| Real Estate, Rental & Leasing | 0 (0.0%) | 5 (100.0%) |
| Professional & Scientific | 2 (28.6%) | 5 (71.4%) |
| Enterprise Management | 0 (0.0%) | 0 (0.0%) |
| Administrative & Support | 13 (76.5%) | 4 (23.5%) |
| Educational Services | 6 (14.6%) | 35 (85.4%) |
| Health Care & Social Assistance | 22 (45.8%) | 26 (54.2%) |
| Arts, Entertainment & Recreation | 73 (100.0%) | 0 (0.0%) |
| Accommodation & Food Services | 32 (38.1%) | 52 (61.9%) |
| Public Administration | 16 (34.0%) | 31 (66.0%) |
| Total | 245 (50.6%) | 239 (49.4%) |
Education in Frederica
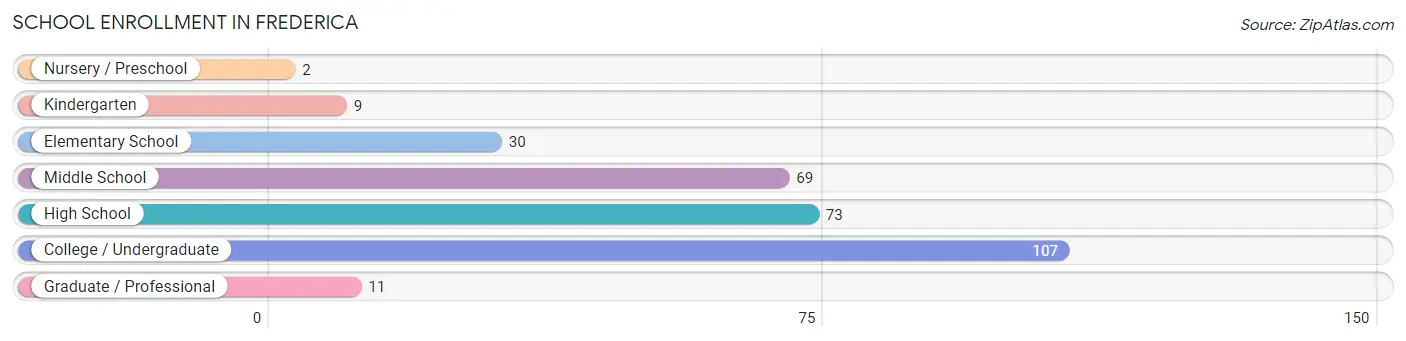
School Enrollment in Frederica
The most common levels of schooling among the 301 students in Frederica are college / undergraduate (107 | 35.5%), high school (73 | 24.2%), and middle school (69 | 22.9%).
| School Level | # Students | % Students |
| Nursery / Preschool | 2 | 0.7% |
| Kindergarten | 9 | 3.0% |
| Elementary School | 30 | 10.0% |
| Middle School | 69 | 22.9% |
| High School | 73 | 24.2% |
| College / Undergraduate | 107 | 35.5% |
| Graduate / Professional | 11 | 3.6% |
| Total | 301 | 100.0% |
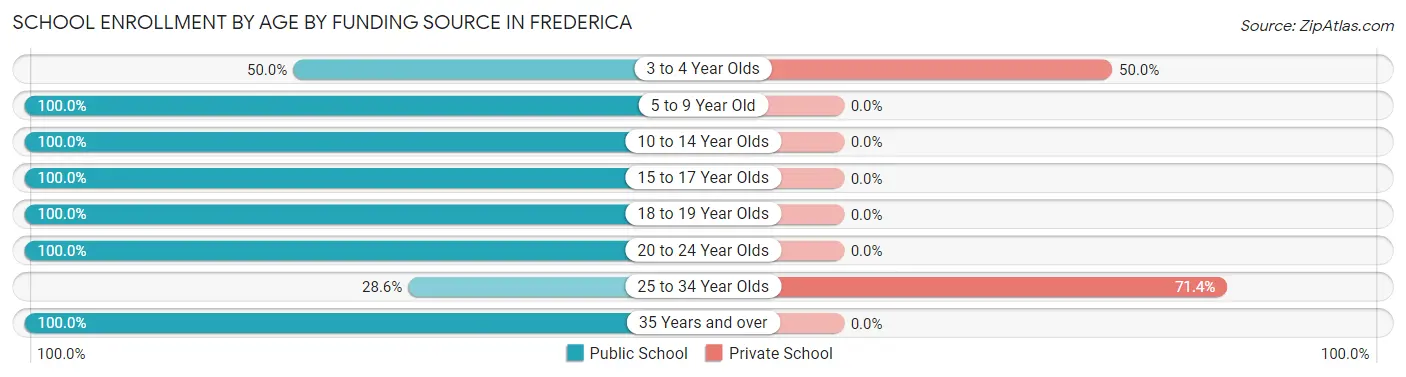
School Enrollment by Age by Funding Source in Frederica
Out of a total of 301 students who are enrolled in schools in Frederica, 6 (2.0%) attend a private institution, while the remaining 295 (98.0%) are enrolled in public schools. The age group of 25 to 34 year olds has the highest likelihood of being enrolled in private schools, with 5 (71.4% in the age bracket) enrolled. Conversely, the age group of 5 to 9 year old has the lowest likelihood of being enrolled in a private school, with 39 (100.0% in the age bracket) attending a public institution.
| Age Bracket | Public School | Private School |
| 3 to 4 Year Olds | 1 (50.0%) | 1 (50.0%) |
| 5 to 9 Year Old | 39 (100.0%) | 0 (0.0%) |
| 10 to 14 Year Olds | 65 (100.0%) | 0 (0.0%) |
| 15 to 17 Year Olds | 77 (100.0%) | 0 (0.0%) |
| 18 to 19 Year Olds | 34 (100.0%) | 0 (0.0%) |
| 20 to 24 Year Olds | 73 (100.0%) | 0 (0.0%) |
| 25 to 34 Year Olds | 2 (28.6%) | 5 (71.4%) |
| 35 Years and over | 4 (100.0%) | 0 (0.0%) |
| Total | 295 (98.0%) | 6 (2.0%) |
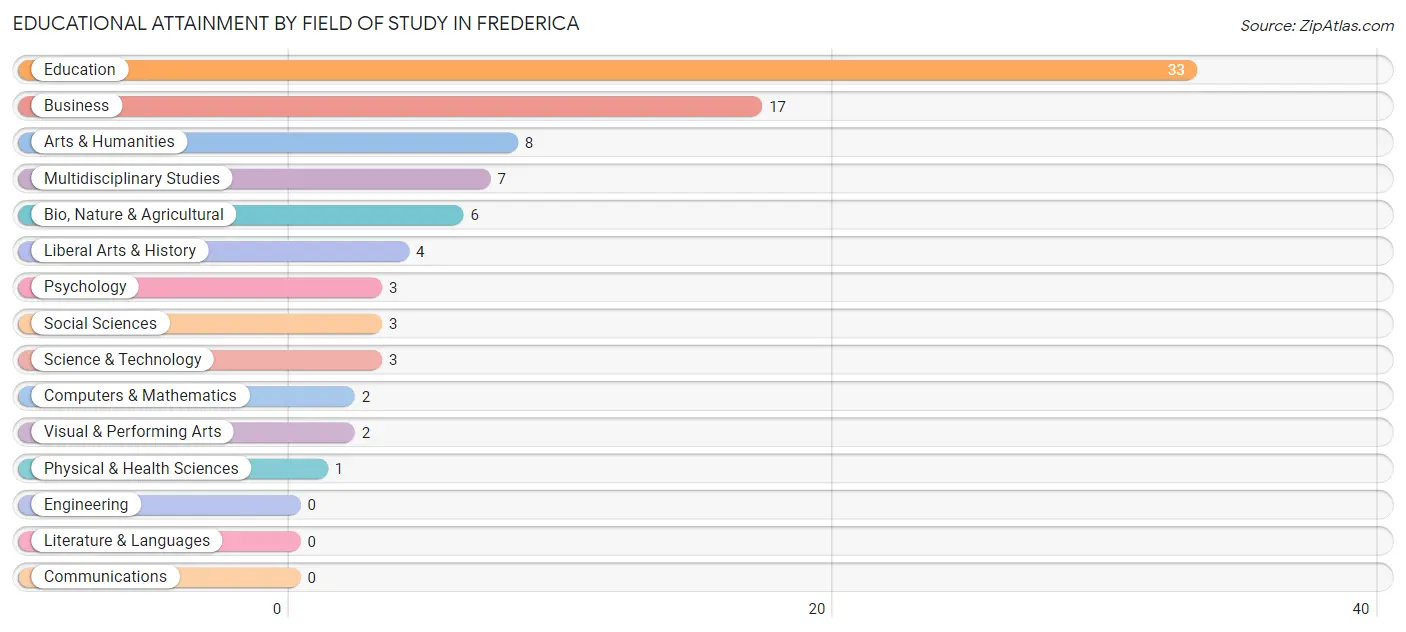
Educational Attainment by Field of Study in Frederica
Education (33 | 37.1%), business (17 | 19.1%), arts & humanities (8 | 9.0%), multidisciplinary studies (7 | 7.9%), and bio, nature & agricultural (6 | 6.7%) are the most common fields of study among 89 individuals in Frederica who have obtained a bachelor's degree or higher.
| Field of Study | # Graduates | % Graduates |
| Computers & Mathematics | 2 | 2.2% |
| Bio, Nature & Agricultural | 6 | 6.7% |
| Physical & Health Sciences | 1 | 1.1% |
| Psychology | 3 | 3.4% |
| Social Sciences | 3 | 3.4% |
| Engineering | 0 | 0.0% |
| Multidisciplinary Studies | 7 | 7.9% |
| Science & Technology | 3 | 3.4% |
| Business | 17 | 19.1% |
| Education | 33 | 37.1% |
| Literature & Languages | 0 | 0.0% |
| Liberal Arts & History | 4 | 4.5% |
| Visual & Performing Arts | 2 | 2.2% |
| Communications | 0 | 0.0% |
| Arts & Humanities | 8 | 9.0% |
| Total | 89 | 100.0% |
Transportation & Commute in Frederica
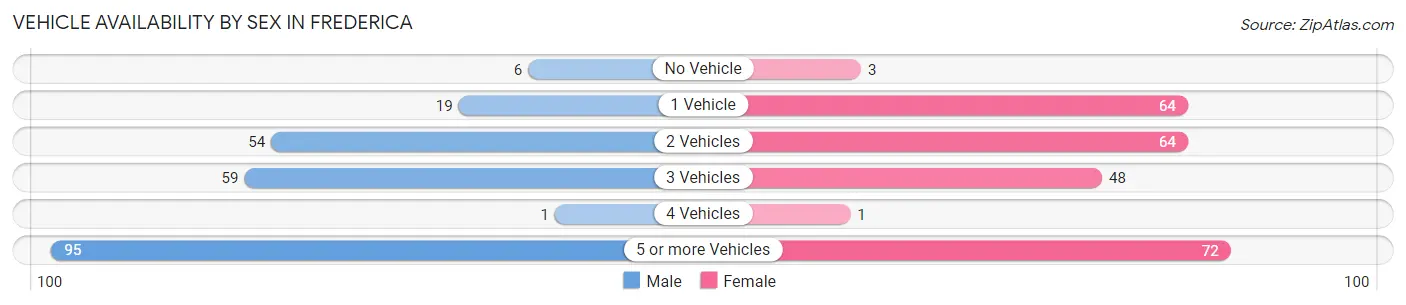
Vehicle Availability by Sex in Frederica
The most prevalent vehicle ownership categories in Frederica are males with 5 or more vehicles (95, accounting for 40.6%) and females with 5 or more vehicles (72, making up 37.7%).
| Vehicles Available | Male | Female |
| No Vehicle | 6 (2.6%) | 3 (1.2%) |
| 1 Vehicle | 19 (8.1%) | 64 (25.4%) |
| 2 Vehicles | 54 (23.1%) | 64 (25.4%) |
| 3 Vehicles | 59 (25.2%) | 48 (19.1%) |
| 4 Vehicles | 1 (0.4%) | 1 (0.4%) |
| 5 or more Vehicles | 95 (40.6%) | 72 (28.6%) |
| Total | 234 (100.0%) | 252 (100.0%) |
Commute Time in Frederica
The most frequently occuring commute durations in Frederica are 10 to 14 minutes (131 commuters, 27.1%), 15 to 19 minutes (90 commuters, 18.6%), and 20 to 24 minutes (87 commuters, 18.0%).
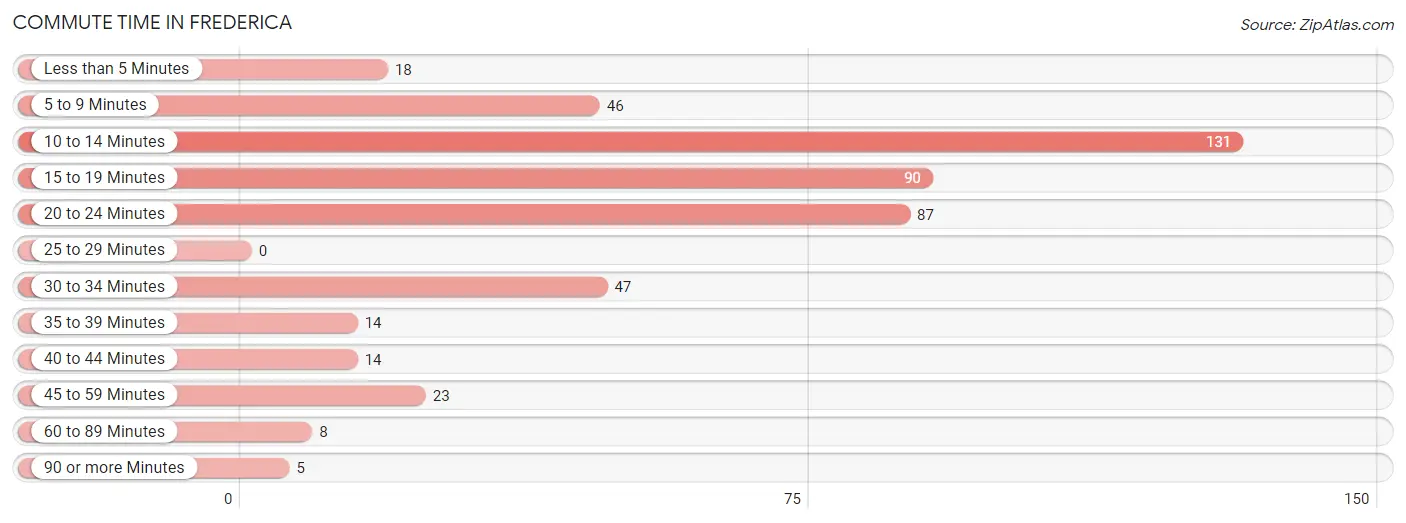
| Commute Time | # Commuters | % Commuters |
| Less than 5 Minutes | 18 | 3.7% |
| 5 to 9 Minutes | 46 | 9.5% |
| 10 to 14 Minutes | 131 | 27.1% |
| 15 to 19 Minutes | 90 | 18.6% |
| 20 to 24 Minutes | 87 | 18.0% |
| 25 to 29 Minutes | 0 | 0.0% |
| 30 to 34 Minutes | 47 | 9.7% |
| 35 to 39 Minutes | 14 | 2.9% |
| 40 to 44 Minutes | 14 | 2.9% |
| 45 to 59 Minutes | 23 | 4.8% |
| 60 to 89 Minutes | 8 | 1.7% |
| 90 or more Minutes | 5 | 1.0% |
Commute Time by Sex in Frederica
The most common commute times in Frederica are 10 to 14 minutes (64 commuters, 27.4%) for males and 10 to 14 minutes (67 commuters, 26.9%) for females.
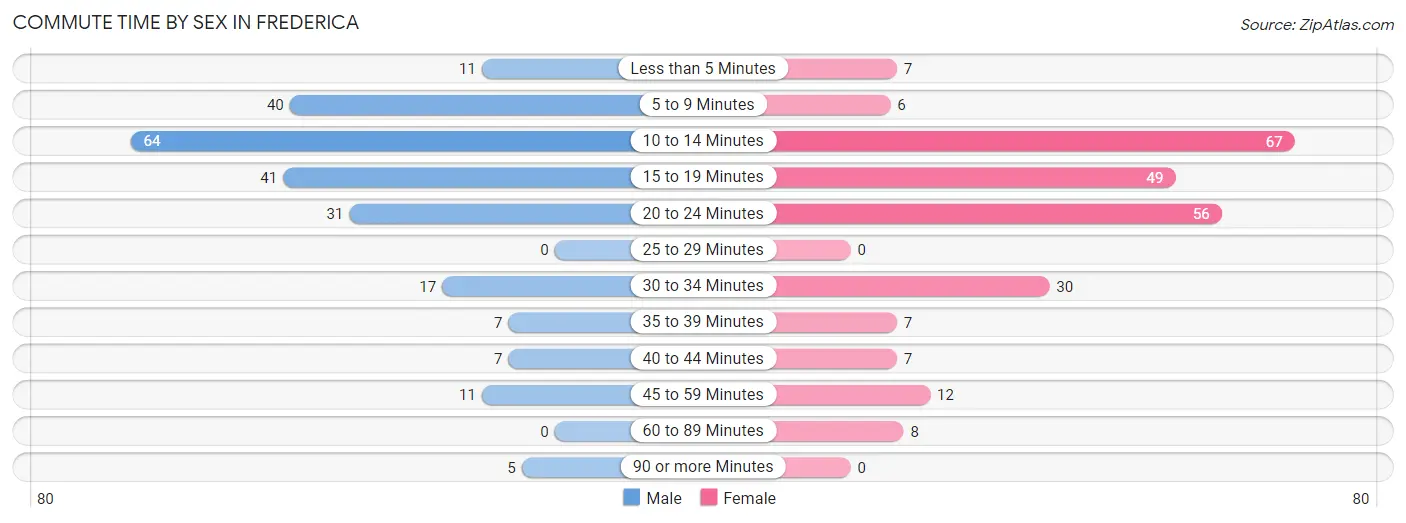
| Commute Time | Male | Female |
| Less than 5 Minutes | 11 (4.7%) | 7 (2.8%) |
| 5 to 9 Minutes | 40 (17.1%) | 6 (2.4%) |
| 10 to 14 Minutes | 64 (27.4%) | 67 (26.9%) |
| 15 to 19 Minutes | 41 (17.5%) | 49 (19.7%) |
| 20 to 24 Minutes | 31 (13.3%) | 56 (22.5%) |
| 25 to 29 Minutes | 0 (0.0%) | 0 (0.0%) |
| 30 to 34 Minutes | 17 (7.3%) | 30 (12.0%) |
| 35 to 39 Minutes | 7 (3.0%) | 7 (2.8%) |
| 40 to 44 Minutes | 7 (3.0%) | 7 (2.8%) |
| 45 to 59 Minutes | 11 (4.7%) | 12 (4.8%) |
| 60 to 89 Minutes | 0 (0.0%) | 8 (3.2%) |
| 90 or more Minutes | 5 (2.1%) | 0 (0.0%) |
Time of Departure to Work by Sex in Frederica
The most frequent times of departure to work in Frederica are 8:00 AM to 8:29 AM (88, 37.6%) for males and 7:30 AM to 7:59 AM (47, 18.9%) for females.
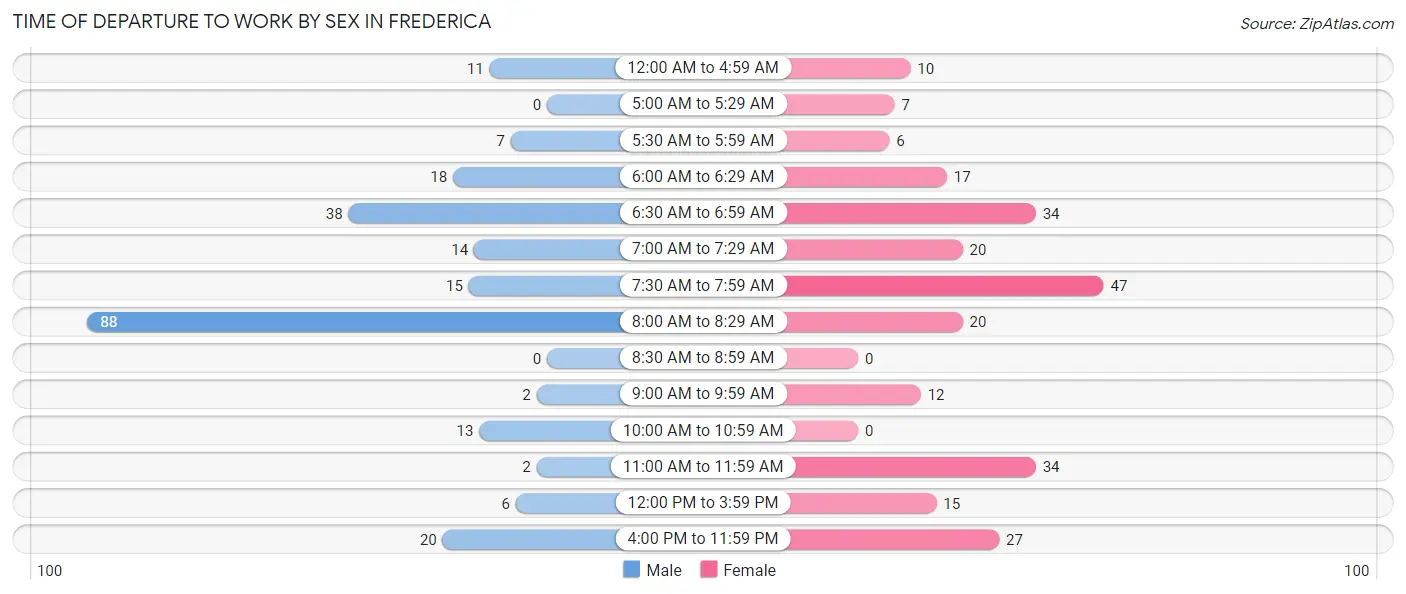
| Time of Departure | Male | Female |
| 12:00 AM to 4:59 AM | 11 (4.7%) | 10 (4.0%) |
| 5:00 AM to 5:29 AM | 0 (0.0%) | 7 (2.8%) |
| 5:30 AM to 5:59 AM | 7 (3.0%) | 6 (2.4%) |
| 6:00 AM to 6:29 AM | 18 (7.7%) | 17 (6.8%) |
| 6:30 AM to 6:59 AM | 38 (16.2%) | 34 (13.7%) |
| 7:00 AM to 7:29 AM | 14 (6.0%) | 20 (8.0%) |
| 7:30 AM to 7:59 AM | 15 (6.4%) | 47 (18.9%) |
| 8:00 AM to 8:29 AM | 88 (37.6%) | 20 (8.0%) |
| 8:30 AM to 8:59 AM | 0 (0.0%) | 0 (0.0%) |
| 9:00 AM to 9:59 AM | 2 (0.9%) | 12 (4.8%) |
| 10:00 AM to 10:59 AM | 13 (5.6%) | 0 (0.0%) |
| 11:00 AM to 11:59 AM | 2 (0.9%) | 34 (13.7%) |
| 12:00 PM to 3:59 PM | 6 (2.6%) | 15 (6.0%) |
| 4:00 PM to 11:59 PM | 20 (8.6%) | 27 (10.8%) |
| Total | 234 (100.0%) | 249 (100.0%) |
Housing Occupancy in Frederica
Occupancy by Ownership in Frederica
Of the total 346 dwellings in Frederica, owner-occupied units account for 271 (78.3%), while renter-occupied units make up 75 (21.7%).
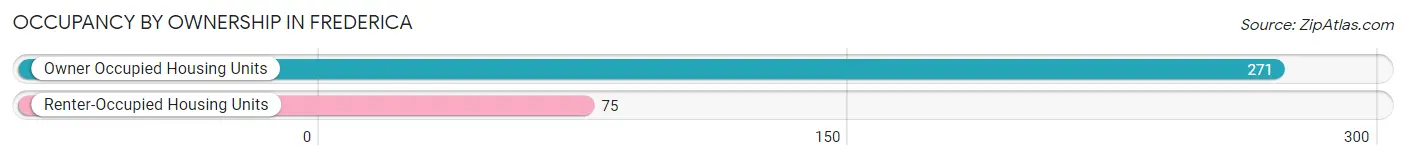
| Occupancy | # Housing Units | % Housing Units |
| Owner Occupied Housing Units | 271 | 78.3% |
| Renter-Occupied Housing Units | 75 | 21.7% |
| Total Occupied Housing Units | 346 | 100.0% |
Occupancy by Household Size in Frederica
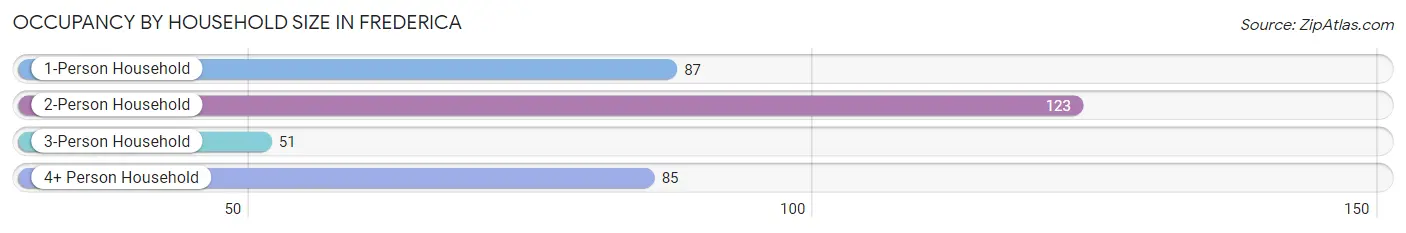
| Household Size | # Housing Units | % Housing Units |
| 1-Person Household | 87 | 25.1% |
| 2-Person Household | 123 | 35.5% |
| 3-Person Household | 51 | 14.7% |
| 4+ Person Household | 85 | 24.6% |
| Total Housing Units | 346 | 100.0% |
Occupancy by Ownership by Household Size in Frederica
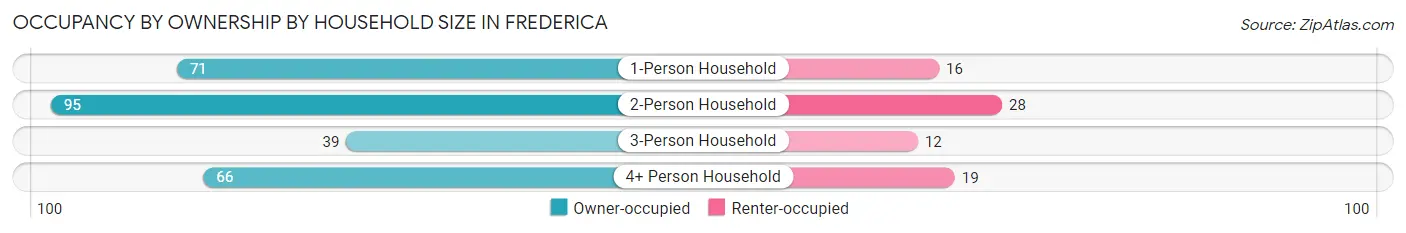
| Household Size | Owner-occupied | Renter-occupied |
| 1-Person Household | 71 (81.6%) | 16 (18.4%) |
| 2-Person Household | 95 (77.2%) | 28 (22.8%) |
| 3-Person Household | 39 (76.5%) | 12 (23.5%) |
| 4+ Person Household | 66 (77.6%) | 19 (22.4%) |
| Total Housing Units | 271 (78.3%) | 75 (21.7%) |
Occupancy by Educational Attainment in Frederica
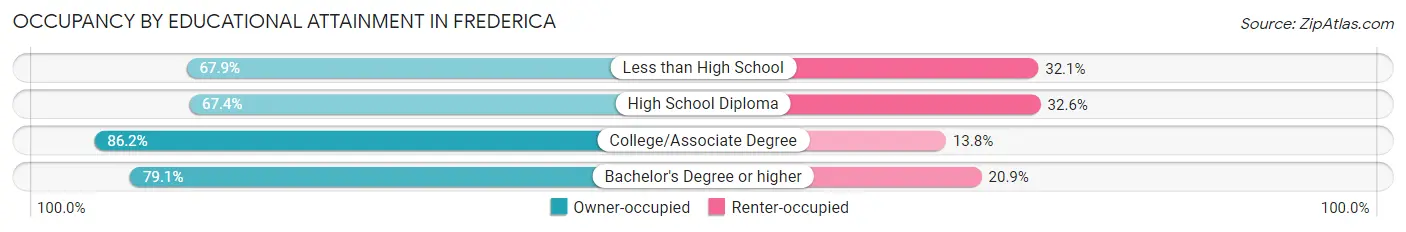
| Household Size | Owner-occupied | Renter-occupied |
| Less than High School | 19 (67.9%) | 9 (32.1%) |
| High School Diploma | 62 (67.4%) | 30 (32.6%) |
| College/Associate Degree | 137 (86.2%) | 22 (13.8%) |
| Bachelor's Degree or higher | 53 (79.1%) | 14 (20.9%) |
Occupancy by Age of Householder in Frederica
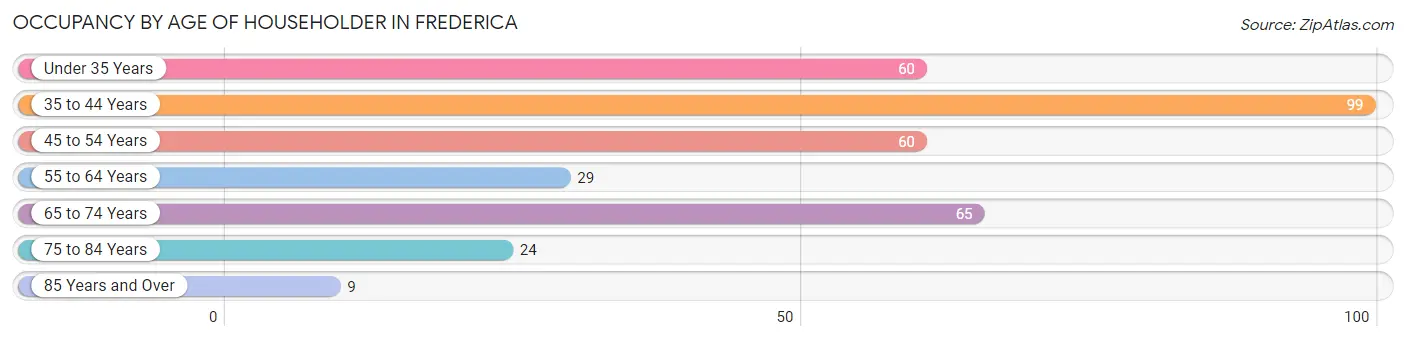
| Age Bracket | # Households | % Households |
| Under 35 Years | 60 | 17.3% |
| 35 to 44 Years | 99 | 28.6% |
| 45 to 54 Years | 60 | 17.3% |
| 55 to 64 Years | 29 | 8.4% |
| 65 to 74 Years | 65 | 18.8% |
| 75 to 84 Years | 24 | 6.9% |
| 85 Years and Over | 9 | 2.6% |
| Total | 346 | 100.0% |
Housing Finances in Frederica
Median Income by Occupancy in Frederica
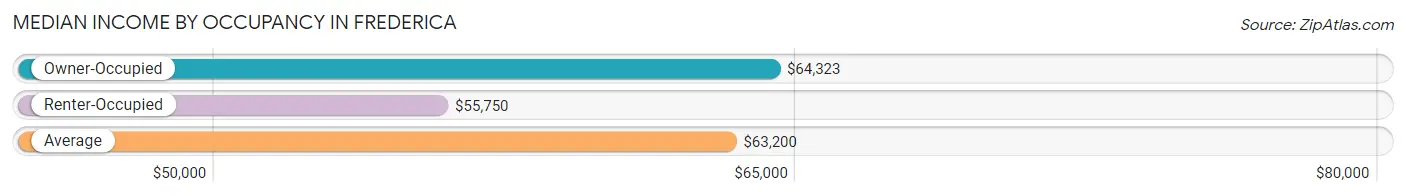
| Occupancy Type | # Households | Median Income |
| Owner-Occupied | 271 (78.3%) | $64,323 |
| Renter-Occupied | 75 (21.7%) | $55,750 |
| Average | 346 (100.0%) | $63,200 |
Occupancy by Householder Income Bracket in Frederica
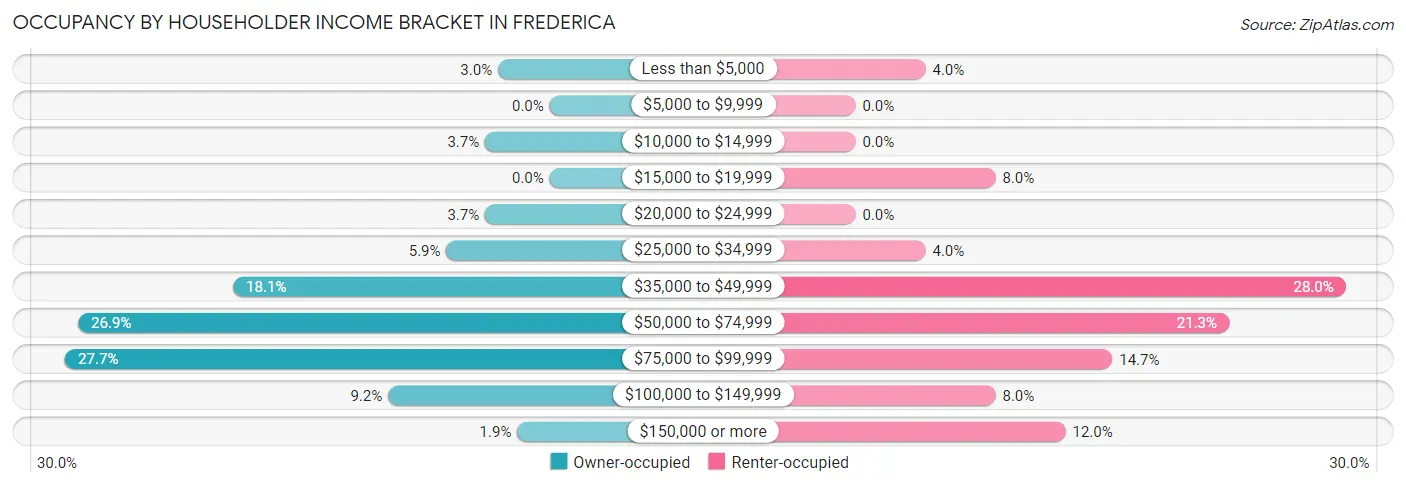
| Income Bracket | Owner-occupied | Renter-occupied |
| Less than $5,000 | 8 (2.9%) | 3 (4.0%) |
| $5,000 to $9,999 | 0 (0.0%) | 0 (0.0%) |
| $10,000 to $14,999 | 10 (3.7%) | 0 (0.0%) |
| $15,000 to $19,999 | 0 (0.0%) | 6 (8.0%) |
| $20,000 to $24,999 | 10 (3.7%) | 0 (0.0%) |
| $25,000 to $34,999 | 16 (5.9%) | 3 (4.0%) |
| $35,000 to $49,999 | 49 (18.1%) | 21 (28.0%) |
| $50,000 to $74,999 | 73 (26.9%) | 16 (21.3%) |
| $75,000 to $99,999 | 75 (27.7%) | 11 (14.7%) |
| $100,000 to $149,999 | 25 (9.2%) | 6 (8.0%) |
| $150,000 or more | 5 (1.8%) | 9 (12.0%) |
| Total | 271 (100.0%) | 75 (100.0%) |
Monthly Housing Cost Tiers in Frederica
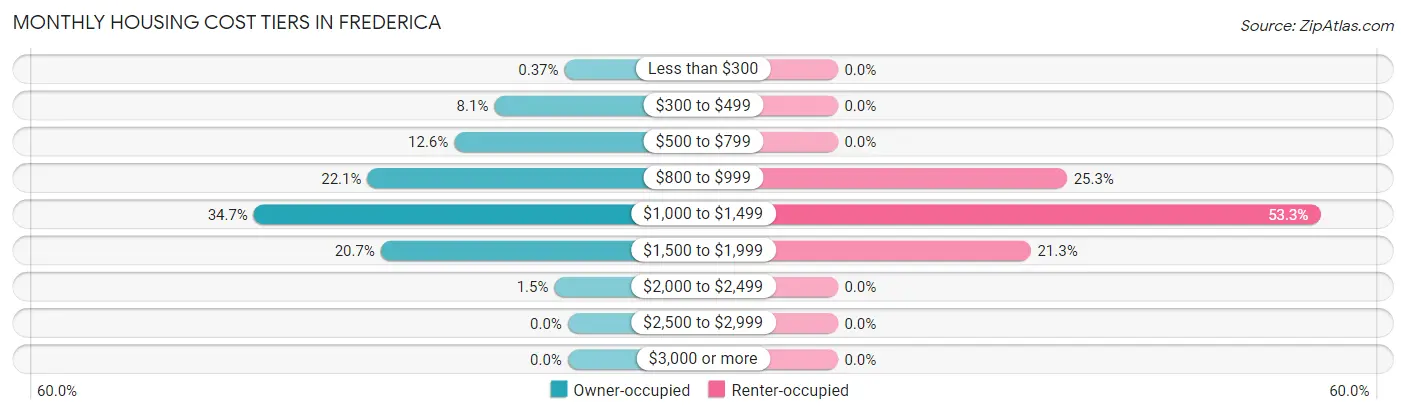
| Monthly Cost | Owner-occupied | Renter-occupied |
| Less than $300 | 1 (0.4%) | 0 (0.0%) |
| $300 to $499 | 22 (8.1%) | 0 (0.0%) |
| $500 to $799 | 34 (12.6%) | 0 (0.0%) |
| $800 to $999 | 60 (22.1%) | 19 (25.3%) |
| $1,000 to $1,499 | 94 (34.7%) | 40 (53.3%) |
| $1,500 to $1,999 | 56 (20.7%) | 16 (21.3%) |
| $2,000 to $2,499 | 4 (1.5%) | 0 (0.0%) |
| $2,500 to $2,999 | 0 (0.0%) | 0 (0.0%) |
| $3,000 or more | 0 (0.0%) | 0 (0.0%) |
| Total | 271 (100.0%) | 75 (100.0%) |
Physical Housing Characteristics in Frederica
Housing Structures in Frederica

| Structure Type | # Housing Units | % Housing Units |
| Single Unit, Detached | 292 | 84.4% |
| Single Unit, Attached | 9 | 2.6% |
| 2 Unit Apartments | 31 | 9.0% |
| 3 or 4 Unit Apartments | 6 | 1.7% |
| 5 to 9 Unit Apartments | 0 | 0.0% |
| 10 or more Apartments | 0 | 0.0% |
| Mobile Home / Other | 8 | 2.3% |
| Total | 346 | 100.0% |
Housing Structures by Occupancy in Frederica
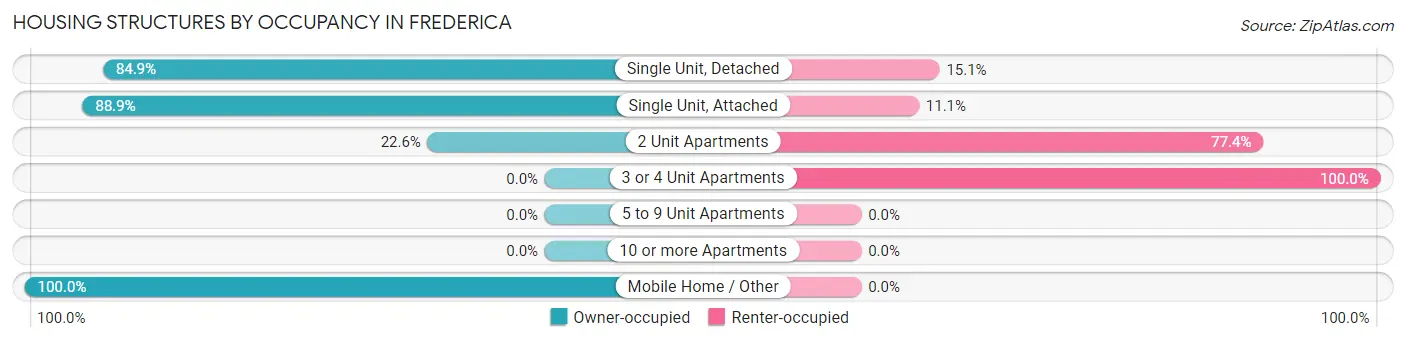
| Structure Type | Owner-occupied | Renter-occupied |
| Single Unit, Detached | 248 (84.9%) | 44 (15.1%) |
| Single Unit, Attached | 8 (88.9%) | 1 (11.1%) |
| 2 Unit Apartments | 7 (22.6%) | 24 (77.4%) |
| 3 or 4 Unit Apartments | 0 (0.0%) | 6 (100.0%) |
| 5 to 9 Unit Apartments | 0 (0.0%) | 0 (0.0%) |
| 10 or more Apartments | 0 (0.0%) | 0 (0.0%) |
| Mobile Home / Other | 8 (100.0%) | 0 (0.0%) |
| Total | 271 (78.3%) | 75 (21.7%) |
Housing Structures by Number of Rooms in Frederica
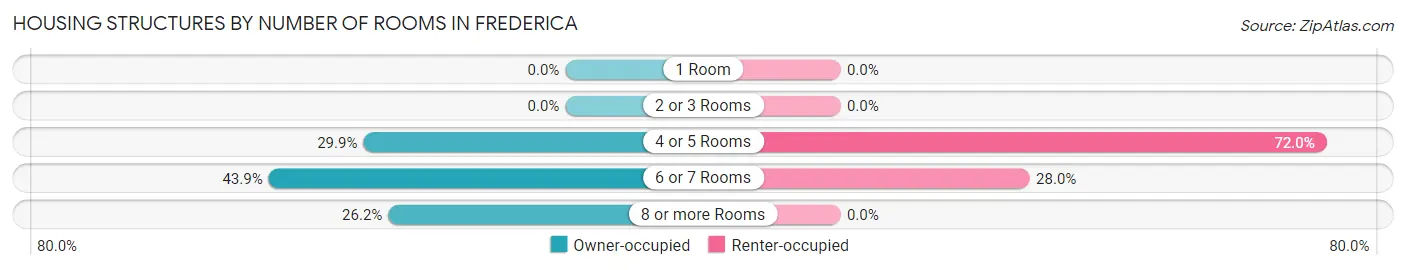
| Number of Rooms | Owner-occupied | Renter-occupied |
| 1 Room | 0 (0.0%) | 0 (0.0%) |
| 2 or 3 Rooms | 0 (0.0%) | 0 (0.0%) |
| 4 or 5 Rooms | 81 (29.9%) | 54 (72.0%) |
| 6 or 7 Rooms | 119 (43.9%) | 21 (28.0%) |
| 8 or more Rooms | 71 (26.2%) | 0 (0.0%) |
| Total | 271 (100.0%) | 75 (100.0%) |
Housing Structure by Heating Type in Frederica
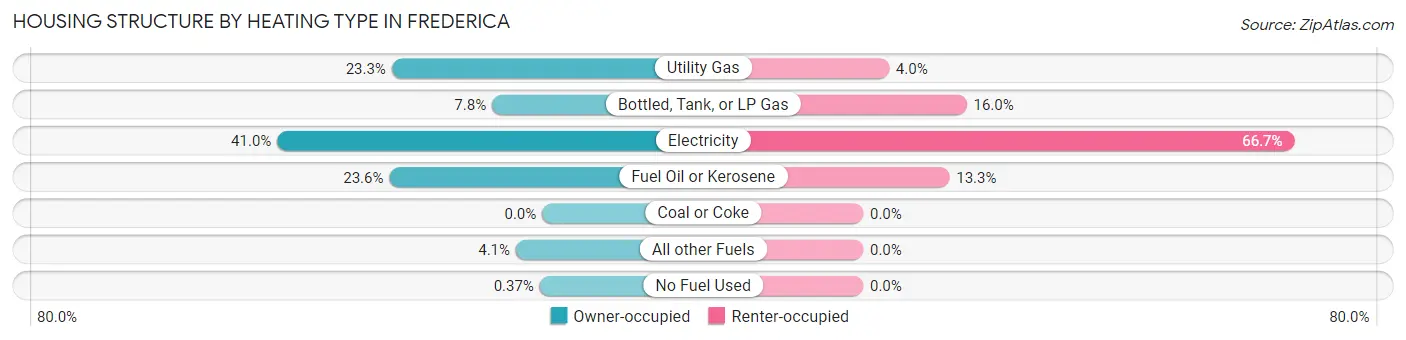
| Heating Type | Owner-occupied | Renter-occupied |
| Utility Gas | 63 (23.3%) | 3 (4.0%) |
| Bottled, Tank, or LP Gas | 21 (7.7%) | 12 (16.0%) |
| Electricity | 111 (41.0%) | 50 (66.7%) |
| Fuel Oil or Kerosene | 64 (23.6%) | 10 (13.3%) |
| Coal or Coke | 0 (0.0%) | 0 (0.0%) |
| All other Fuels | 11 (4.1%) | 0 (0.0%) |
| No Fuel Used | 1 (0.4%) | 0 (0.0%) |
| Total | 271 (100.0%) | 75 (100.0%) |
Household Vehicle Usage in Frederica
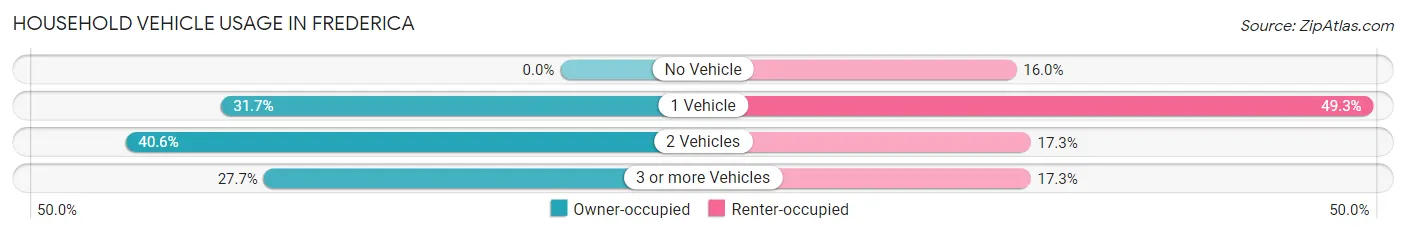
| Vehicles per Household | Owner-occupied | Renter-occupied |
| No Vehicle | 0 (0.0%) | 12 (16.0%) |
| 1 Vehicle | 86 (31.7%) | 37 (49.3%) |
| 2 Vehicles | 110 (40.6%) | 13 (17.3%) |
| 3 or more Vehicles | 75 (27.7%) | 13 (17.3%) |
| Total | 271 (100.0%) | 75 (100.0%) |
Real Estate & Mortgages in Frederica
Real Estate and Mortgage Overview in Frederica
| Characteristic | Without Mortgage | With Mortgage |
| Housing Units | 39 | 232 |
| Median Property Value | $232,100 | $190,800 |
| Median Household Income | $40,469 | $5 |
| Monthly Housing Costs | $483 | $0 |
| Real Estate Taxes | $622 | $5 |
Property Value by Mortgage Status in Frederica
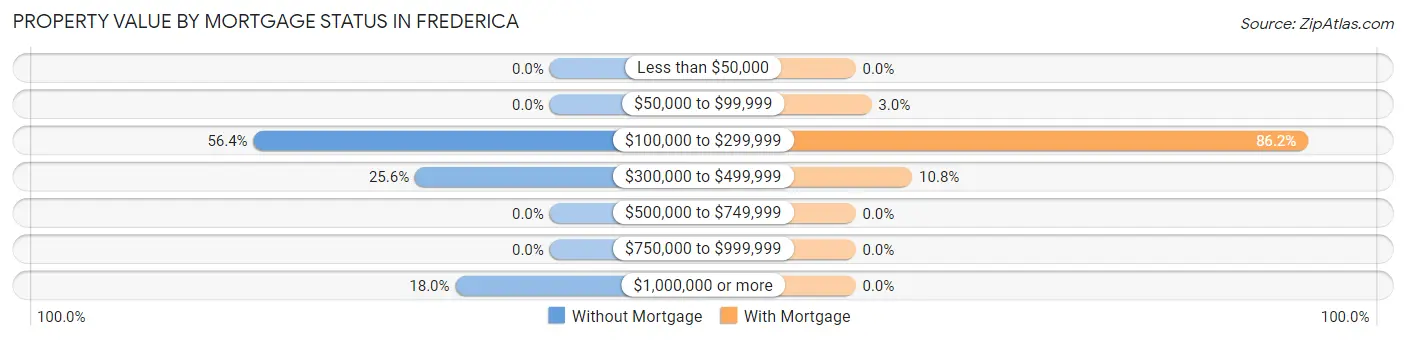
| Property Value | Without Mortgage | With Mortgage |
| Less than $50,000 | 0 (0.0%) | 0 (0.0%) |
| $50,000 to $99,999 | 0 (0.0%) | 7 (3.0%) |
| $100,000 to $299,999 | 22 (56.4%) | 200 (86.2%) |
| $300,000 to $499,999 | 10 (25.6%) | 25 (10.8%) |
| $500,000 to $749,999 | 0 (0.0%) | 0 (0.0%) |
| $750,000 to $999,999 | 0 (0.0%) | 0 (0.0%) |
| $1,000,000 or more | 7 (17.9%) | 0 (0.0%) |
| Total | 39 (100.0%) | 232 (100.0%) |
Household Income by Mortgage Status in Frederica
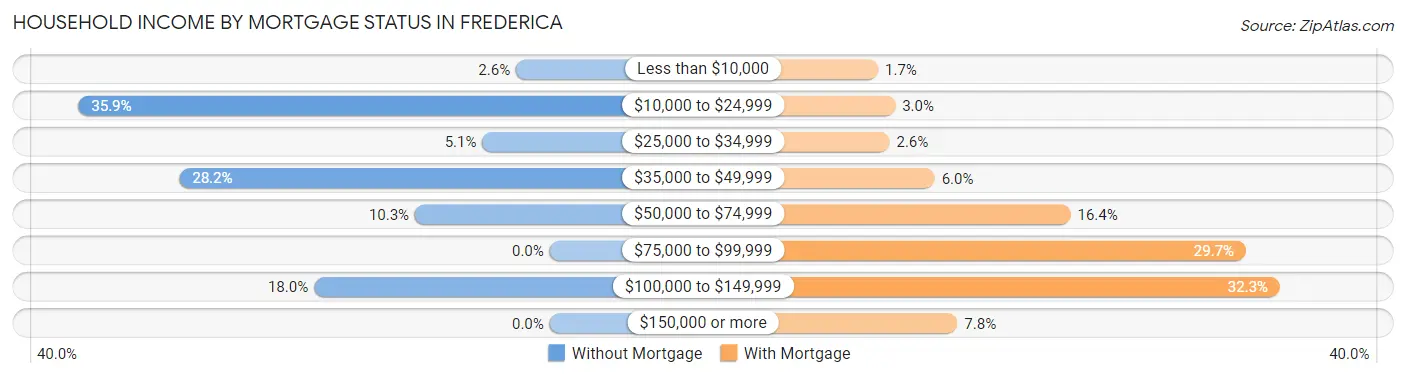
| Household Income | Without Mortgage | With Mortgage |
| Less than $10,000 | 1 (2.6%) | 4 (1.7%) |
| $10,000 to $24,999 | 14 (35.9%) | 7 (3.0%) |
| $25,000 to $34,999 | 2 (5.1%) | 6 (2.6%) |
| $35,000 to $49,999 | 11 (28.2%) | 14 (6.0%) |
| $50,000 to $74,999 | 4 (10.3%) | 38 (16.4%) |
| $75,000 to $99,999 | 0 (0.0%) | 69 (29.7%) |
| $100,000 to $149,999 | 7 (17.9%) | 75 (32.3%) |
| $150,000 or more | 0 (0.0%) | 18 (7.8%) |
| Total | 39 (100.0%) | 232 (100.0%) |
Property Value to Household Income Ratio in Frederica
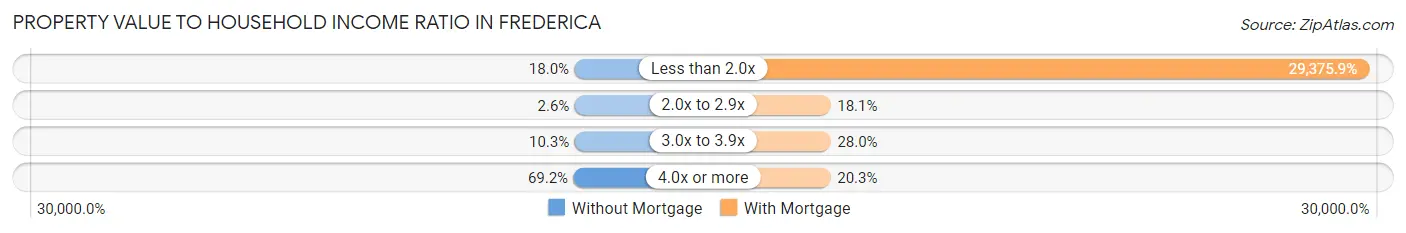
| Value-to-Income Ratio | Without Mortgage | With Mortgage |
| Less than 2.0x | 7 (17.9%) | 68,152 (29,375.9%) |
| 2.0x to 2.9x | 1 (2.6%) | 42 (18.1%) |
| 3.0x to 3.9x | 4 (10.3%) | 65 (28.0%) |
| 4.0x or more | 27 (69.2%) | 47 (20.3%) |
| Total | 39 (100.0%) | 232 (100.0%) |
Real Estate Taxes by Mortgage Status in Frederica
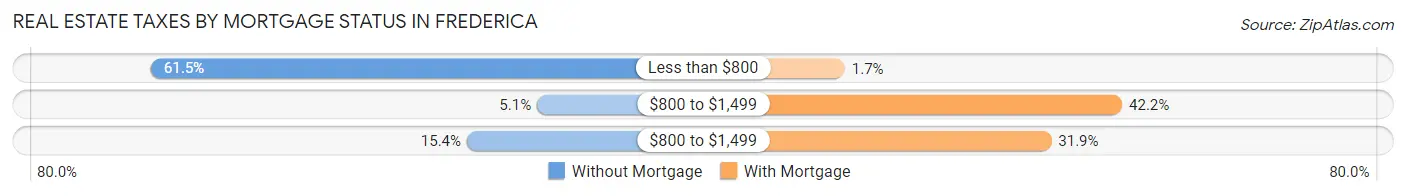
| Property Taxes | Without Mortgage | With Mortgage |
| Less than $800 | 24 (61.5%) | 4 (1.7%) |
| $800 to $1,499 | 2 (5.1%) | 98 (42.2%) |
| $800 to $1,499 | 6 (15.4%) | 74 (31.9%) |
| Total | 39 (100.0%) | 232 (100.0%) |
Health & Disability in Frederica
Health Insurance Coverage by Age in Frederica
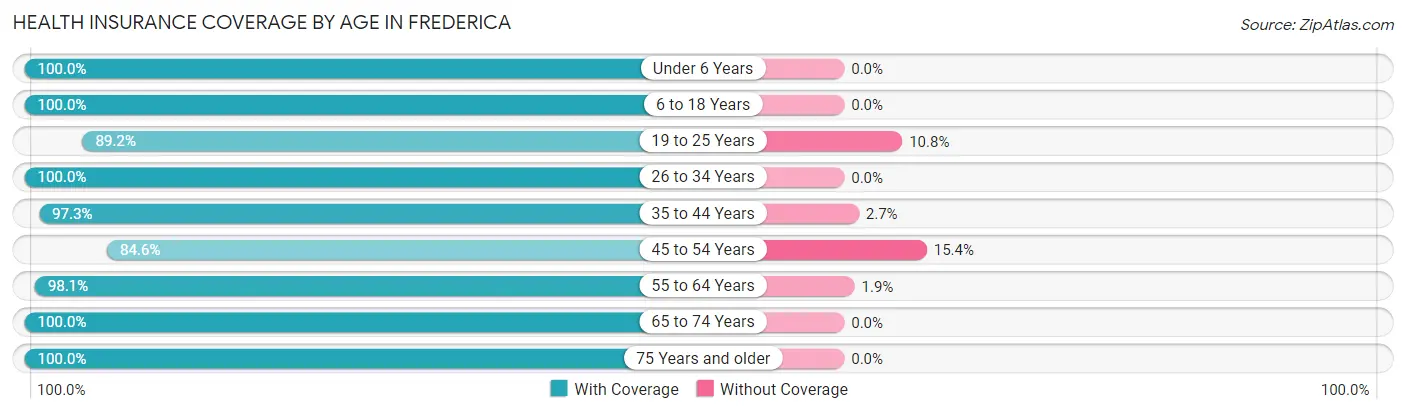
| Age Bracket | With Coverage | Without Coverage |
| Under 6 Years | 84 (100.0%) | 0 (0.0%) |
| 6 to 18 Years | 182 (100.0%) | 0 (0.0%) |
| 19 to 25 Years | 157 (89.2%) | 19 (10.8%) |
| 26 to 34 Years | 72 (100.0%) | 0 (0.0%) |
| 35 to 44 Years | 143 (97.3%) | 4 (2.7%) |
| 45 to 54 Years | 88 (84.6%) | 16 (15.4%) |
| 55 to 64 Years | 51 (98.1%) | 1 (1.9%) |
| 65 to 74 Years | 115 (100.0%) | 0 (0.0%) |
| 75 Years and older | 51 (100.0%) | 0 (0.0%) |
| Total | 943 (95.9%) | 40 (4.1%) |
Health Insurance Coverage by Citizenship Status in Frederica
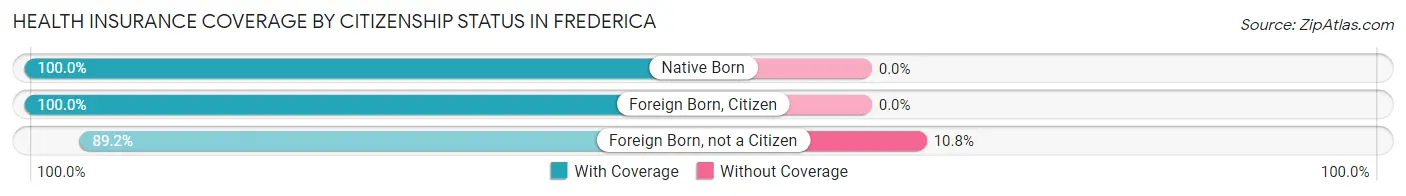
| Citizenship Status | With Coverage | Without Coverage |
| Native Born | 84 (100.0%) | 0 (0.0%) |
| Foreign Born, Citizen | 182 (100.0%) | 0 (0.0%) |
| Foreign Born, not a Citizen | 157 (89.2%) | 19 (10.8%) |
Health Insurance Coverage by Household Income in Frederica
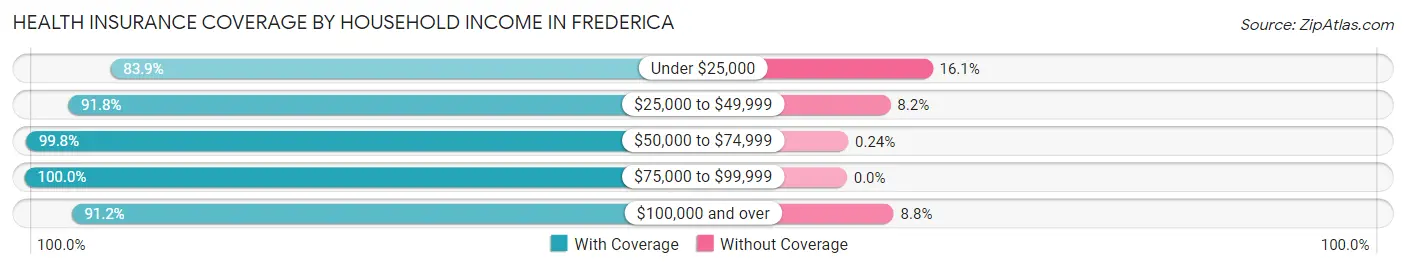
| Household Income | With Coverage | Without Coverage |
| Under $25,000 | 47 (83.9%) | 9 (16.1%) |
| $25,000 to $49,999 | 191 (91.8%) | 17 (8.2%) |
| $50,000 to $74,999 | 412 (99.8%) | 1 (0.2%) |
| $75,000 to $99,999 | 158 (100.0%) | 0 (0.0%) |
| $100,000 and over | 135 (91.2%) | 13 (8.8%) |
Public vs Private Health Insurance Coverage by Age in Frederica
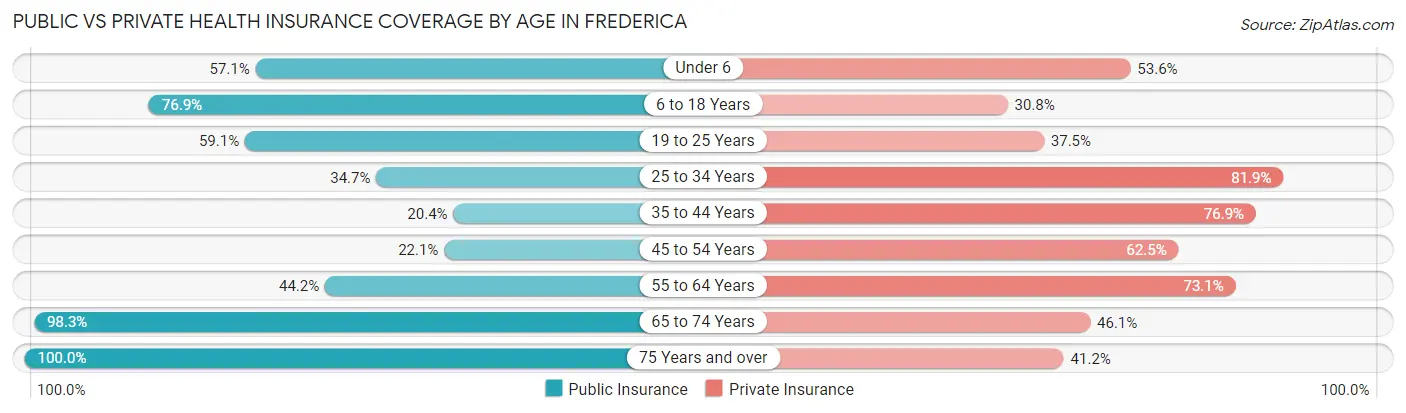
| Age Bracket | Public Insurance | Private Insurance |
| Under 6 | 48 (57.1%) | 45 (53.6%) |
| 6 to 18 Years | 140 (76.9%) | 56 (30.8%) |
| 19 to 25 Years | 104 (59.1%) | 66 (37.5%) |
| 25 to 34 Years | 25 (34.7%) | 59 (81.9%) |
| 35 to 44 Years | 30 (20.4%) | 113 (76.9%) |
| 45 to 54 Years | 23 (22.1%) | 65 (62.5%) |
| 55 to 64 Years | 23 (44.2%) | 38 (73.1%) |
| 65 to 74 Years | 113 (98.3%) | 53 (46.1%) |
| 75 Years and over | 51 (100.0%) | 21 (41.2%) |
| Total | 557 (56.7%) | 516 (52.5%) |
Disability Status by Sex by Age in Frederica
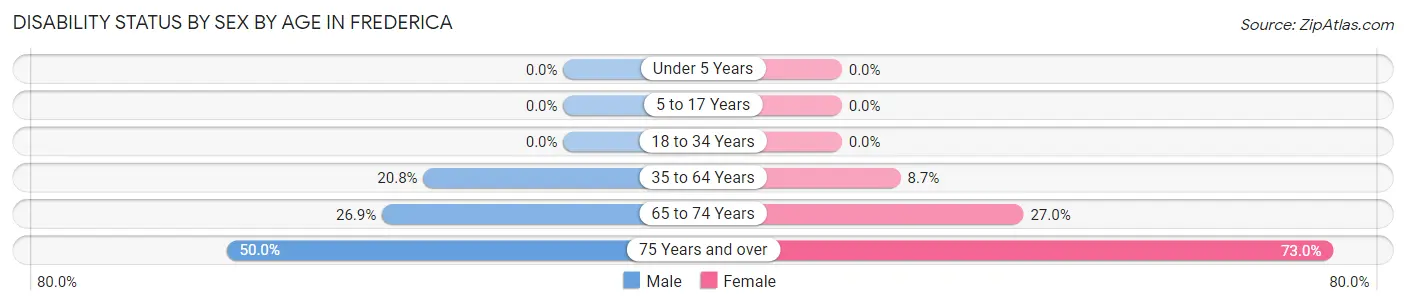
| Age Bracket | Male | Female |
| Under 5 Years | 0 (0.0%) | 0 (0.0%) |
| 5 to 17 Years | 0 (0.0%) | 0 (0.0%) |
| 18 to 34 Years | 0 (0.0%) | 0 (0.0%) |
| 35 to 64 Years | 32 (20.8%) | 13 (8.7%) |
| 65 to 74 Years | 14 (26.9%) | 17 (27.0%) |
| 75 Years and over | 7 (50.0%) | 27 (73.0%) |
Disability Class by Sex by Age in Frederica
Disability Class: Hearing Difficulty
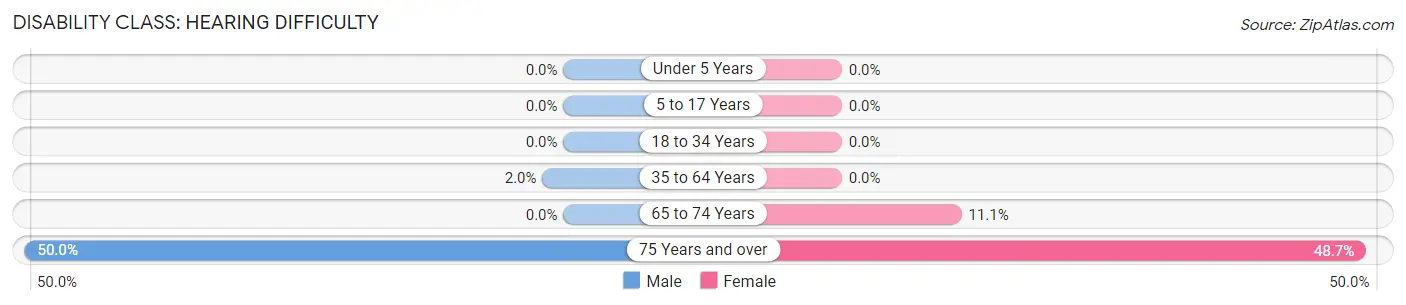
| Age Bracket | Male | Female |
| Under 5 Years | 0 (0.0%) | 0 (0.0%) |
| 5 to 17 Years | 0 (0.0%) | 0 (0.0%) |
| 18 to 34 Years | 0 (0.0%) | 0 (0.0%) |
| 35 to 64 Years | 3 (1.9%) | 0 (0.0%) |
| 65 to 74 Years | 0 (0.0%) | 7 (11.1%) |
| 75 Years and over | 7 (50.0%) | 18 (48.6%) |
Disability Class: Vision Difficulty
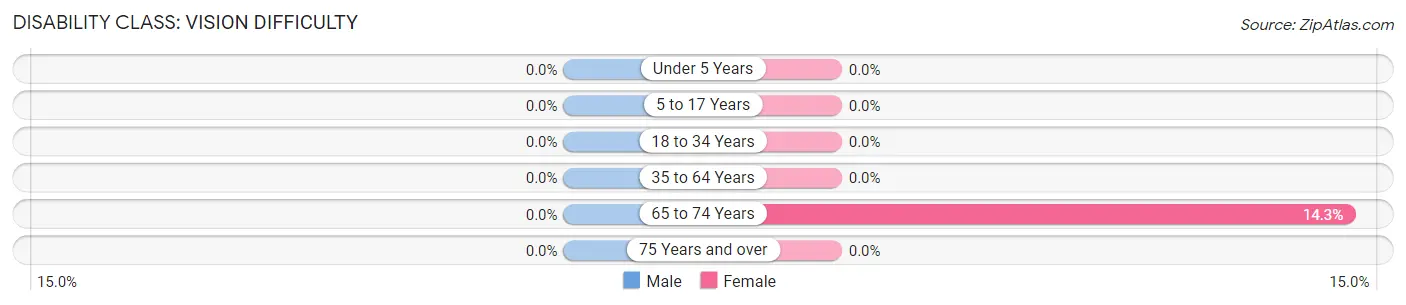
| Age Bracket | Male | Female |
| Under 5 Years | 0 (0.0%) | 0 (0.0%) |
| 5 to 17 Years | 0 (0.0%) | 0 (0.0%) |
| 18 to 34 Years | 0 (0.0%) | 0 (0.0%) |
| 35 to 64 Years | 0 (0.0%) | 0 (0.0%) |
| 65 to 74 Years | 0 (0.0%) | 9 (14.3%) |
| 75 Years and over | 0 (0.0%) | 0 (0.0%) |
Disability Class: Cognitive Difficulty
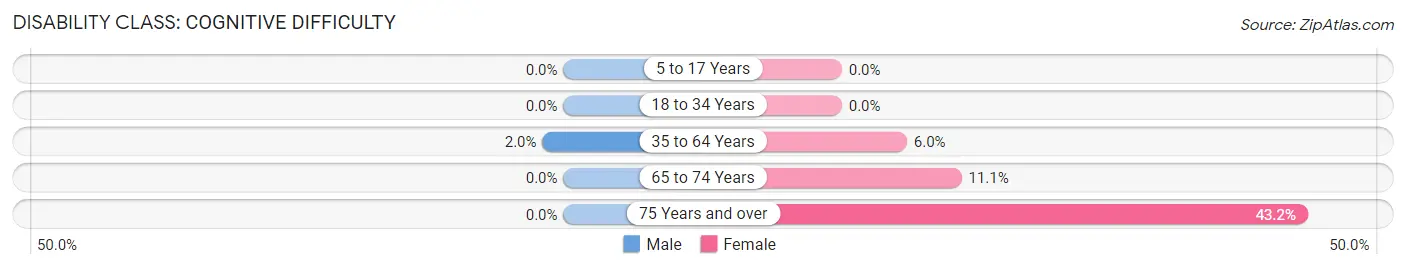
| Age Bracket | Male | Female |
| 5 to 17 Years | 0 (0.0%) | 0 (0.0%) |
| 18 to 34 Years | 0 (0.0%) | 0 (0.0%) |
| 35 to 64 Years | 3 (1.9%) | 9 (6.0%) |
| 65 to 74 Years | 0 (0.0%) | 7 (11.1%) |
| 75 Years and over | 0 (0.0%) | 16 (43.2%) |
Disability Class: Ambulatory Difficulty
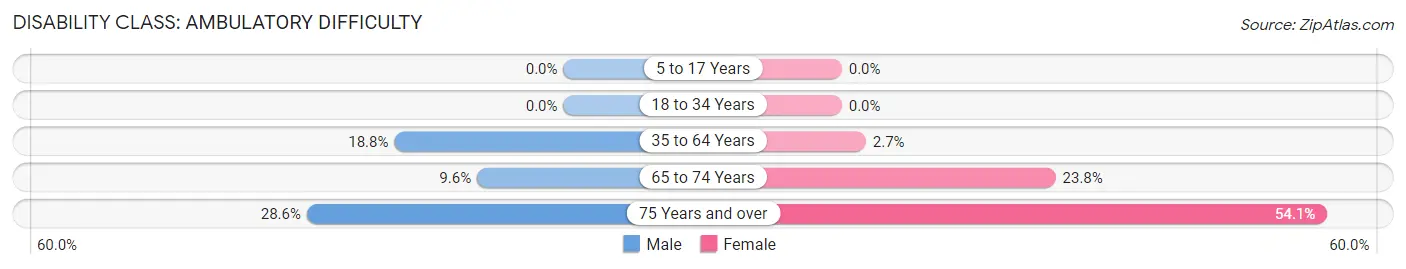
| Age Bracket | Male | Female |
| 5 to 17 Years | 0 (0.0%) | 0 (0.0%) |
| 18 to 34 Years | 0 (0.0%) | 0 (0.0%) |
| 35 to 64 Years | 29 (18.8%) | 4 (2.7%) |
| 65 to 74 Years | 5 (9.6%) | 15 (23.8%) |
| 75 Years and over | 4 (28.6%) | 20 (54.0%) |
Disability Class: Self-Care Difficulty
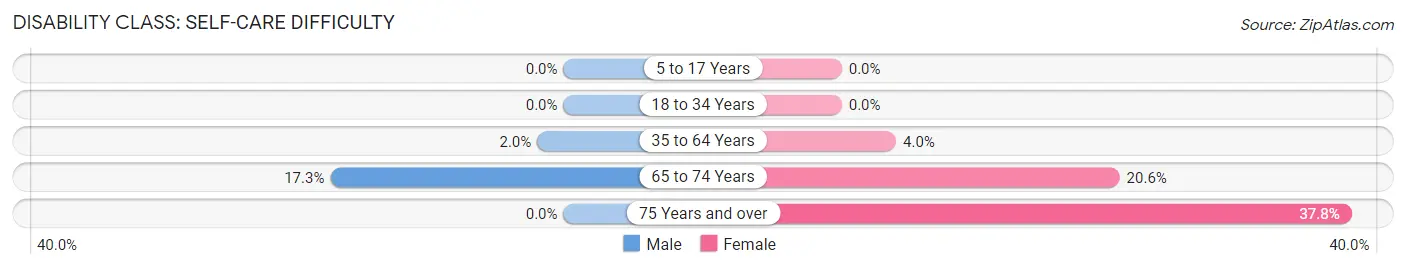
| Age Bracket | Male | Female |
| 5 to 17 Years | 0 (0.0%) | 0 (0.0%) |
| 18 to 34 Years | 0 (0.0%) | 0 (0.0%) |
| 35 to 64 Years | 3 (1.9%) | 6 (4.0%) |
| 65 to 74 Years | 9 (17.3%) | 13 (20.6%) |
| 75 Years and over | 0 (0.0%) | 14 (37.8%) |
Technology Access in Frederica
Computing Device Access in Frederica
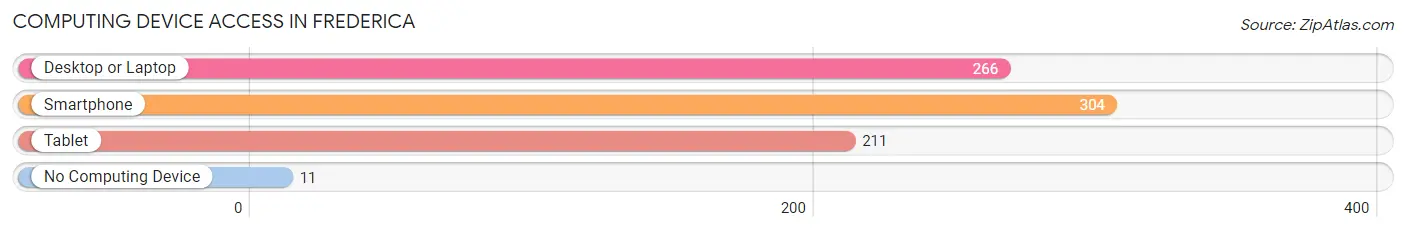
| Device Type | # Households | % Households |
| Desktop or Laptop | 266 | 76.9% |
| Smartphone | 304 | 87.9% |
| Tablet | 211 | 61.0% |
| No Computing Device | 11 | 3.2% |
| Total | 346 | 100.0% |
Internet Access in Frederica
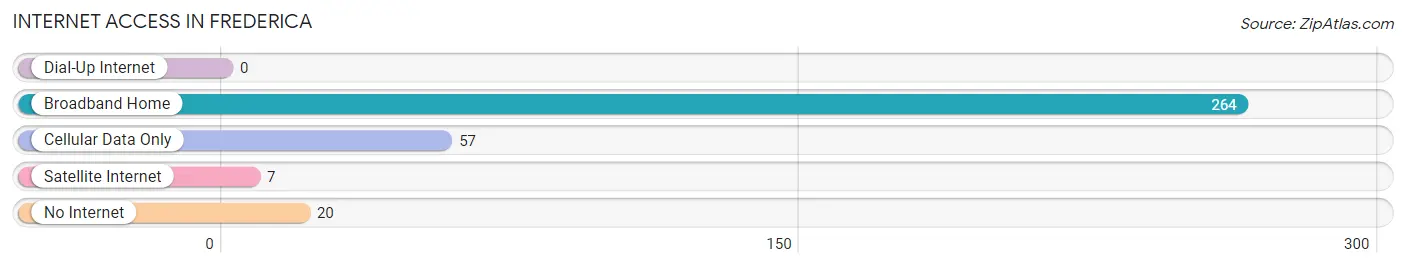
| Internet Type | # Households | % Households |
| Dial-Up Internet | 0 | 0.0% |
| Broadband Home | 264 | 76.3% |
| Cellular Data Only | 57 | 16.5% |
| Satellite Internet | 7 | 2.0% |
| No Internet | 20 | 5.8% |
| Total | 346 | 100.0% |
Frederica Summary
Frederica, Delaware is a small town located in Kent County, Delaware. It is situated on the banks of the Murderkill River, and is part of the Dover Metropolitan Statistical Area. The town has a population of 1,845 as of the 2010 census, and is home to a variety of businesses, including a number of small businesses and a few larger ones.
History
Frederica was first settled in the late 1600s by Dutch and Swedish settlers. The town was originally known as “Frederica”, after the Swedish princess, Frederica of Baden. The town was incorporated in 1864, and was named after the princess.
The town was a major port for the shipping of goods and services in the early 19th century. It was also a major stop on the Underground Railroad, and was home to a number of abolitionists.
Geography
Frederica is located in Kent County, Delaware, and is situated on the banks of the Murderkill River. The town is located approximately 25 miles south of Dover, the state capital. The town is bordered by the towns of Dover, Camden, and Milford.
The town has a total area of 1.2 square miles, all of which is land. The town is located in a humid subtropical climate zone, and experiences hot, humid summers and mild winters.
Economy
Frederica’s economy is largely based on small businesses and a few larger ones. The town is home to a number of small businesses, including restaurants, retail stores, and professional services. The town is also home to a few larger businesses, including a manufacturing plant and a distribution center.
The town is also home to a number of agricultural businesses, including dairy farms, poultry farms, and vegetable farms. The town is also home to a number of recreational businesses, including a golf course, a marina, and a number of parks.
Demographics
As of the 2010 census, the town had a population of 1,845. The population is largely white (90.2%), with a small percentage of African Americans (4.2%), Hispanics (2.2%), and Asians (1.2%). The median household income is $50,945, and the median age is 43.
The town is home to a number of churches, including the Frederica United Methodist Church, the Frederica Presbyterian Church, and the Frederica Baptist Church. The town is also home to a number of schools, including the Frederica Elementary School, the Frederica Middle School, and the Frederica High School.
Conclusion
Frederica, Delaware is a small town located in Kent County, Delaware. It is situated on the banks of the Murderkill River, and is part of the Dover Metropolitan Statistical Area. The town has a population of 1,845 as of the 2010 census, and is home to a variety of businesses, including a number of small businesses and a few larger ones. The town’s economy is largely based on small businesses and a few larger ones, and the town is home to a number of churches and schools. The town is largely white, with a small percentage of African Americans, Hispanics, and Asians.
Common Questions
What is the Total Population of Frederica?
Total Population of Frederica is 1,001.
What is the Total Male Population of Frederica?
Total Male Population of Frederica is 418.
What is the Total Female Population of Frederica?
Total Female Population of Frederica is 583.
What is the Ratio of Males per 100 Females in Frederica?
There are 71.70 Males per 100 Females in Frederica.
What is the Ratio of Females per 100 Males in Frederica?
There are 139.47 Females per 100 Males in Frederica.
What is the Median Population Age in Frederica?
Median Population Age in Frederica is 31.6 Years.
What is the Average Family Size in Frederica
Average Family Size in Frederica is 3.6 People.
What is the Average Household Size in Frederica
Average Household Size in Frederica is 2.9 People.
What is Per Capita Income in Frederica?
Per Capita income in Frederica is $24,666.
What is the Median Family Income in Frederica?
Median Family Income in Frederica is $55,703.
What is the Median Household income in Frederica?
Median Household Income in Frederica is $63,200.
What is Inequality or Gini Index in Frederica?
Inequality or Gini Index in Frederica is 0.31.
How Large is the Labor Force in Frederica?
There are 528 People in the Labor Forcein in Frederica.
What is the Percentage of People in the Labor Force in Frederica?
65.4% of People are in the Labor Force in Frederica.
What is the Unemployment Rate in Frederica?
Unemployment Rate in Frederica is 5.1%.