Benson, VT
Benson Map
Benson Overview
232
TOTAL POPULATION
105
MALE POPULATION
127
FEMALE POPULATION
82.68
MALES / 100 FEMALES
120.95
FEMALES / 100 MALES
39.7
MEDIAN AGE
3.5
AVG FAMILY SIZE
2.3
AVG HOUSEHOLD SIZE
$21,944
PER CAPITA INCOME
$31,607
AVG HOUSEHOLD INCOME
63.8%
WAGE / INCOME GAP [ % ]
36.2¢/ $1
WAGE / INCOME GAP [ $ ]
0.47
INEQUALITY / GINI INDEX
94
LABOR FORCE [ PEOPLE ]
50.8%
PERCENT IN LABOR FORCE
6.4%
UNEMPLOYMENT RATE
Benson Area Codes
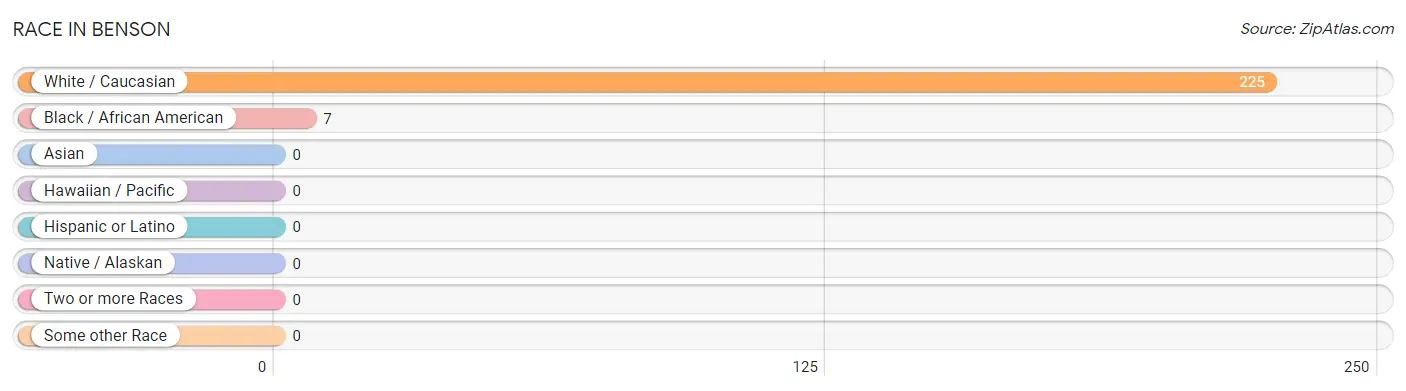
Race in Benson
The most populous races in Benson are White / Caucasian (225 | 97.0%), and Black / African American (7 | 3.0%).
| Race | # Population | % Population |
| Asian | 0 | 0.0% |
| Black / African American | 7 | 3.0% |
| Hawaiian / Pacific | 0 | 0.0% |
| Hispanic or Latino | 0 | 0.0% |
| Native / Alaskan | 0 | 0.0% |
| White / Caucasian | 225 | 97.0% |
| Two or more Races | 0 | 0.0% |
| Some other Race | 0 | 0.0% |
| Total | 232 | 100.0% |
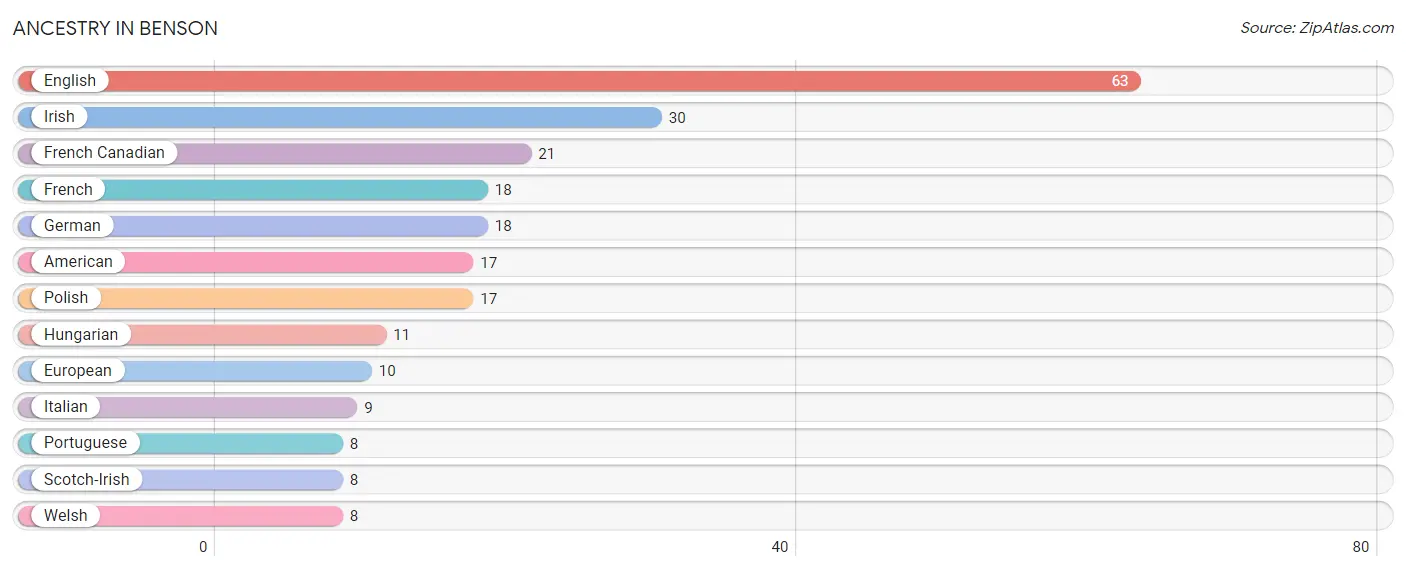
Ancestry in Benson
The most populous ancestries reported in Benson are English (63 | 27.2%), Irish (30 | 12.9%), French Canadian (21 | 9.0%), French (18 | 7.8%), and German (18 | 7.8%), together accounting for 64.7% of all Benson residents.
| Ancestry | # Population | % Population |
| American | 17 | 7.3% |
| English | 63 | 27.2% |
| European | 10 | 4.3% |
| French | 18 | 7.8% |
| French Canadian | 21 | 9.0% |
| German | 18 | 7.8% |
| Hungarian | 11 | 4.7% |
| Irish | 30 | 12.9% |
| Italian | 9 | 3.9% |
| Polish | 17 | 7.3% |
| Portuguese | 8 | 3.5% |
| Scotch-Irish | 8 | 3.5% |
| Welsh | 8 | 3.5% | View All 13 Rows |
Immigrants in Benson
The most numerous immigrant groups reported in Benson came from , and Canada (4 | 1.7%), together accounting for 1.7% of all Benson residents.

| Immigration Origin | # Population | % Population |
| Canada | 4 | 1.7% | View All 1 Rows |
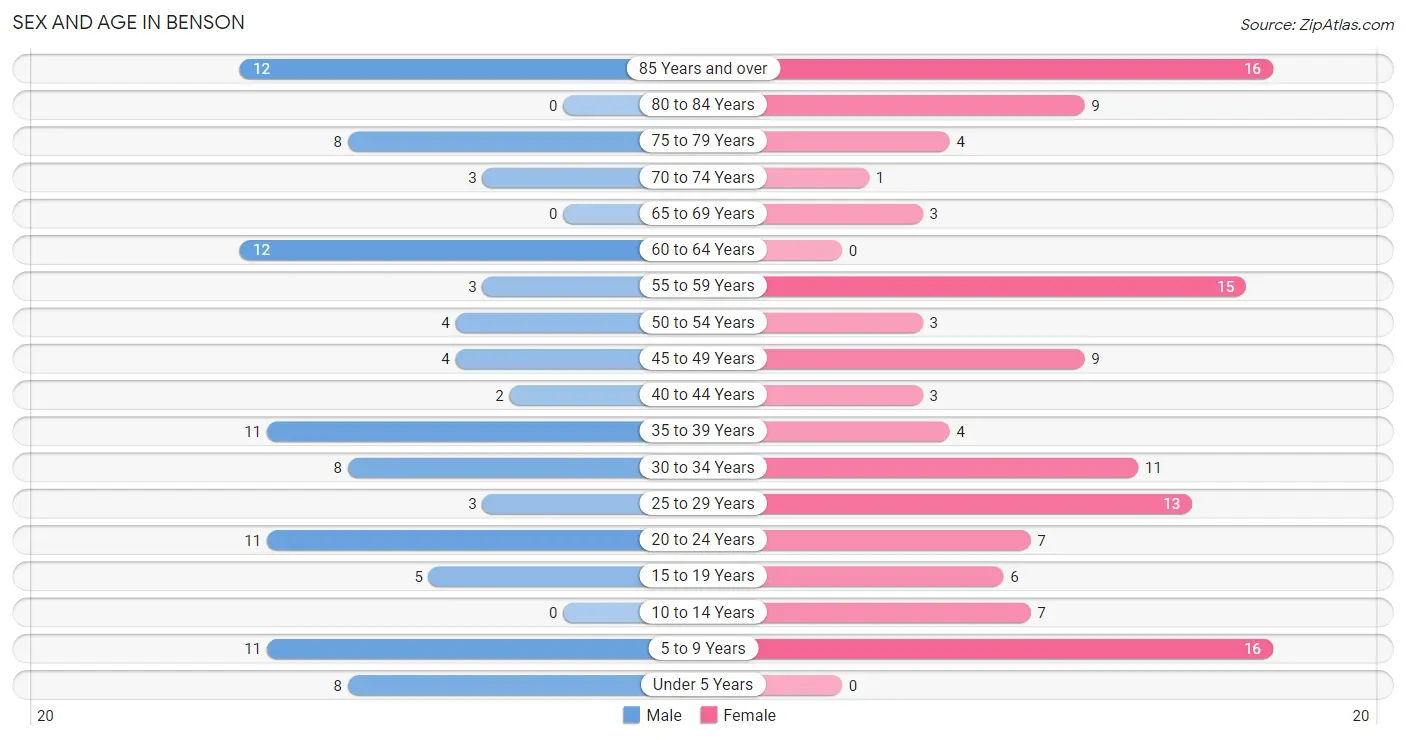
Sex and Age in Benson
Sex and Age in Benson
The most populous age groups in Benson are 60 to 64 Years (12 | 11.4%) for men and 5 to 9 Years (16 | 12.6%) for women.
| Age Bracket | Male | Female |
| Under 5 Years | 8 (7.6%) | 0 (0.0%) |
| 5 to 9 Years | 11 (10.5%) | 16 (12.6%) |
| 10 to 14 Years | 0 (0.0%) | 7 (5.5%) |
| 15 to 19 Years | 5 (4.8%) | 6 (4.7%) |
| 20 to 24 Years | 11 (10.5%) | 7 (5.5%) |
| 25 to 29 Years | 3 (2.9%) | 13 (10.2%) |
| 30 to 34 Years | 8 (7.6%) | 11 (8.7%) |
| 35 to 39 Years | 11 (10.5%) | 4 (3.2%) |
| 40 to 44 Years | 2 (1.9%) | 3 (2.4%) |
| 45 to 49 Years | 4 (3.8%) | 9 (7.1%) |
| 50 to 54 Years | 4 (3.8%) | 3 (2.4%) |
| 55 to 59 Years | 3 (2.9%) | 15 (11.8%) |
| 60 to 64 Years | 12 (11.4%) | 0 (0.0%) |
| 65 to 69 Years | 0 (0.0%) | 3 (2.4%) |
| 70 to 74 Years | 3 (2.9%) | 1 (0.8%) |
| 75 to 79 Years | 8 (7.6%) | 4 (3.2%) |
| 80 to 84 Years | 0 (0.0%) | 9 (7.1%) |
| 85 Years and over | 12 (11.4%) | 16 (12.6%) |
| Total | 105 (100.0%) | 127 (100.0%) |
Families and Households in Benson
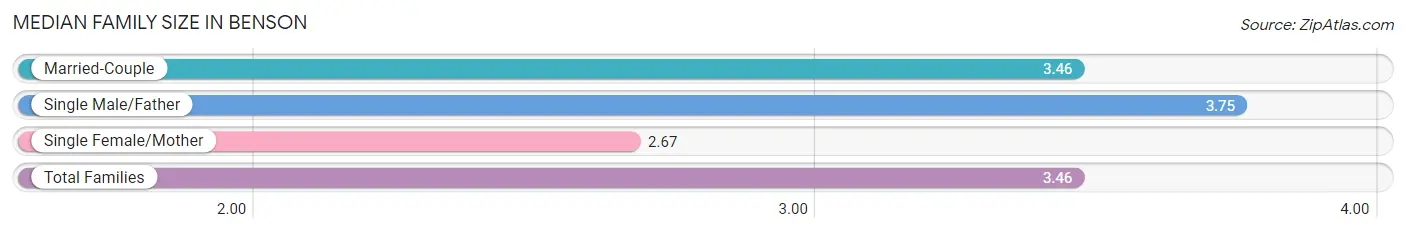
Median Family Size in Benson
The median family size in Benson is 3.46 persons per family, with single male/father families (8 | 16.0%) accounting for the largest median family size of 3.75 persons per family. On the other hand, single female/mother families (3 | 6.0%) represent the smallest median family size with 2.67 persons per family.
| Family Type | # Families | Family Size |
| Married-Couple | 39 (78.0%) | 3.46 |
| Single Male/Father | 8 (16.0%) | 3.75 |
| Single Female/Mother | 3 (6.0%) | 2.67 |
| Total Families | 50 (100.0%) | 3.46 |
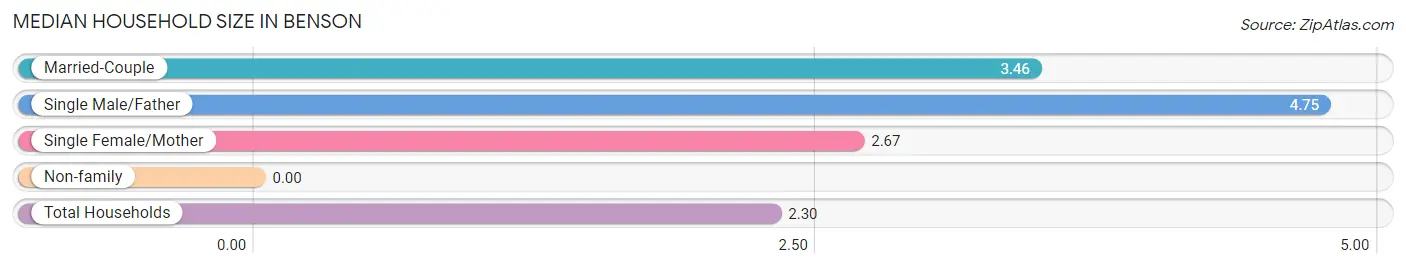
Median Household Size in Benson
| Household Type | # Households | Household Size |
| Married-Couple | 39 (38.6%) | 3.46 |
| Single Male/Father | 8 (7.9%) | 4.75 |
| Single Female/Mother | 3 (3.0%) | 2.67 |
| Non-family | 51 (50.5%) | - |
| Total Households | 101 (100.0%) | 2.30 |
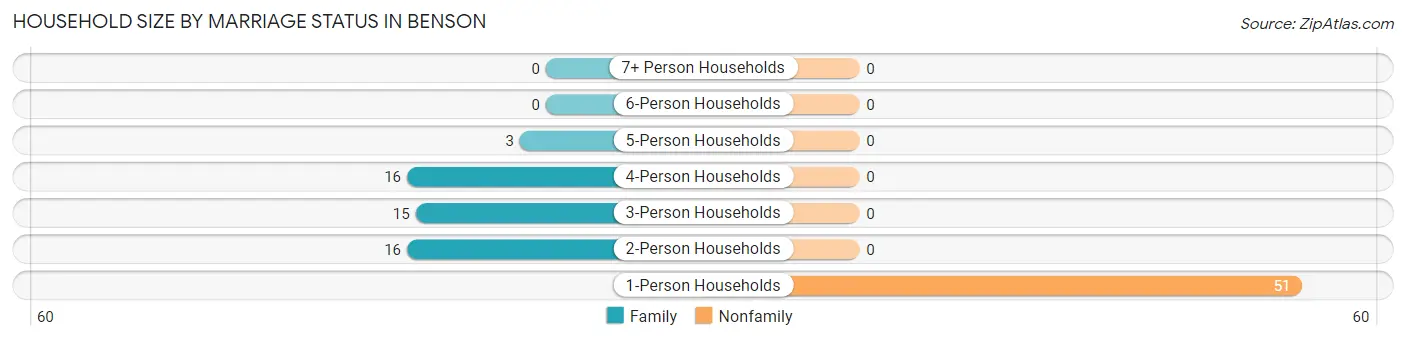
Household Size by Marriage Status in Benson
Out of a total of 101 households in Benson, 50 (49.5%) are family households, while 51 (50.5%) are nonfamily households. The most numerous type of family households are 2-person households, comprising 16, and the most common type of nonfamily households are 1-person households, comprising 51.
| Household Size | Family Households | Nonfamily Households |
| 1-Person Households | - | 51 (50.5%) |
| 2-Person Households | 16 (15.8%) | 0 (0.0%) |
| 3-Person Households | 15 (14.8%) | 0 (0.0%) |
| 4-Person Households | 16 (15.8%) | 0 (0.0%) |
| 5-Person Households | 3 (3.0%) | 0 (0.0%) |
| 6-Person Households | 0 (0.0%) | 0 (0.0%) |
| 7+ Person Households | 0 (0.0%) | 0 (0.0%) |
| Total | 50 (49.5%) | 51 (50.5%) |
Female Fertility in Benson
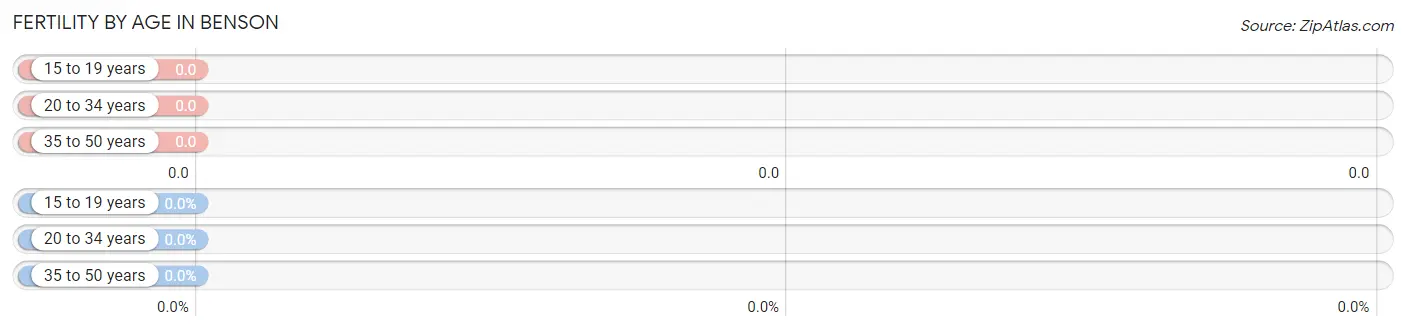
Fertility by Age in Benson
| Age Bracket | Women with Births | Births / 1,000 Women |
| 15 to 19 years | 0 (0.0%) | 0.0 |
| 20 to 34 years | 0 (0.0%) | 0.0 |
| 35 to 50 years | 0 (0.0%) | 0.0 |
| Total | 0 (0.0%) | 0.0 |
Fertility by Age by Marriage Status in Benson
| Age Bracket | Married | Unmarried |
| 15 to 19 years | 0 (0.0%) | 0 (0.0%) |
| 20 to 34 years | 0 (0.0%) | 0 (0.0%) |
| 35 to 50 years | 0 (0.0%) | 0 (0.0%) |
| Total | 0 (0.0%) | 0 (0.0%) |
Fertility by Education in Benson
| Educational Attainment | Women with Births | Births / 1,000 Women |
| Less than High School | 0 (0.0%) | 0.0 |
| High School Diploma | 0 (0.0%) | 0.0 |
| College or Associate's Degree | 0 (0.0%) | 0.0 |
| Bachelor's Degree | 0 (0.0%) | 0.0 |
| Graduate Degree | 0 (0.0%) | 0.0 |
| Total | 0 (0.0%) | 0.0 |
Fertility by Education by Marriage Status in Benson
| Educational Attainment | Married | Unmarried |
| Less than High School | 0 (0.0%) | 0 (0.0%) |
| High School Diploma | 0 (0.0%) | 0 (0.0%) |
| College or Associate's Degree | 0 (0.0%) | 0 (0.0%) |
| Bachelor's Degree | 0 (0.0%) | 0 (0.0%) |
| Graduate Degree | 0 (0.0%) | 0 (0.0%) |
| Total | 0 (0.0%) | 0 (0.0%) |
Income in Benson
Income Overview in Benson
| Characteristic | Number | Measure |
| Per Capita Income | 232 | $21,944 |
| Median Family Income | 50 | $0 |
| Mean Family Income | 50 | $68,286 |
| Median Household Income | 101 | $31,607 |
| Mean Household Income | 101 | $46,048 |
| Income Deficit | 50 | $0 |
| Wage / Income Gap (%) | 232 | 63.76% |
| Wage / Income Gap ($) | 232 | 36.24¢ per $1 |
| Gini / Inequality Index | 232 | 0.47 |
Earnings by Sex in Benson
Average Earnings in Benson are $35,000, $53,125 for men and $19,250 for women, a difference of 63.8%.
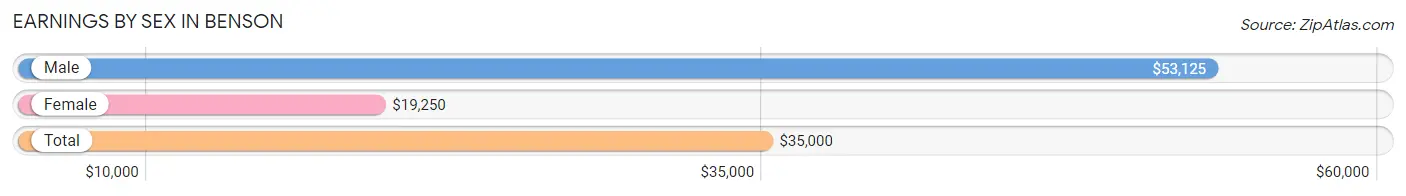
| Sex | Number | Average Earnings |
| Male | 41 (46.6%) | $53,125 |
| Female | 47 (53.4%) | $19,250 |
| Total | 88 (100.0%) | $35,000 |
Earnings by Sex by Income Bracket in Benson
The most common earnings brackets in Benson are $65,000 to $74,999 for men (10 | 24.4%) and $15,000 to $17,499 for women (10 | 21.3%).
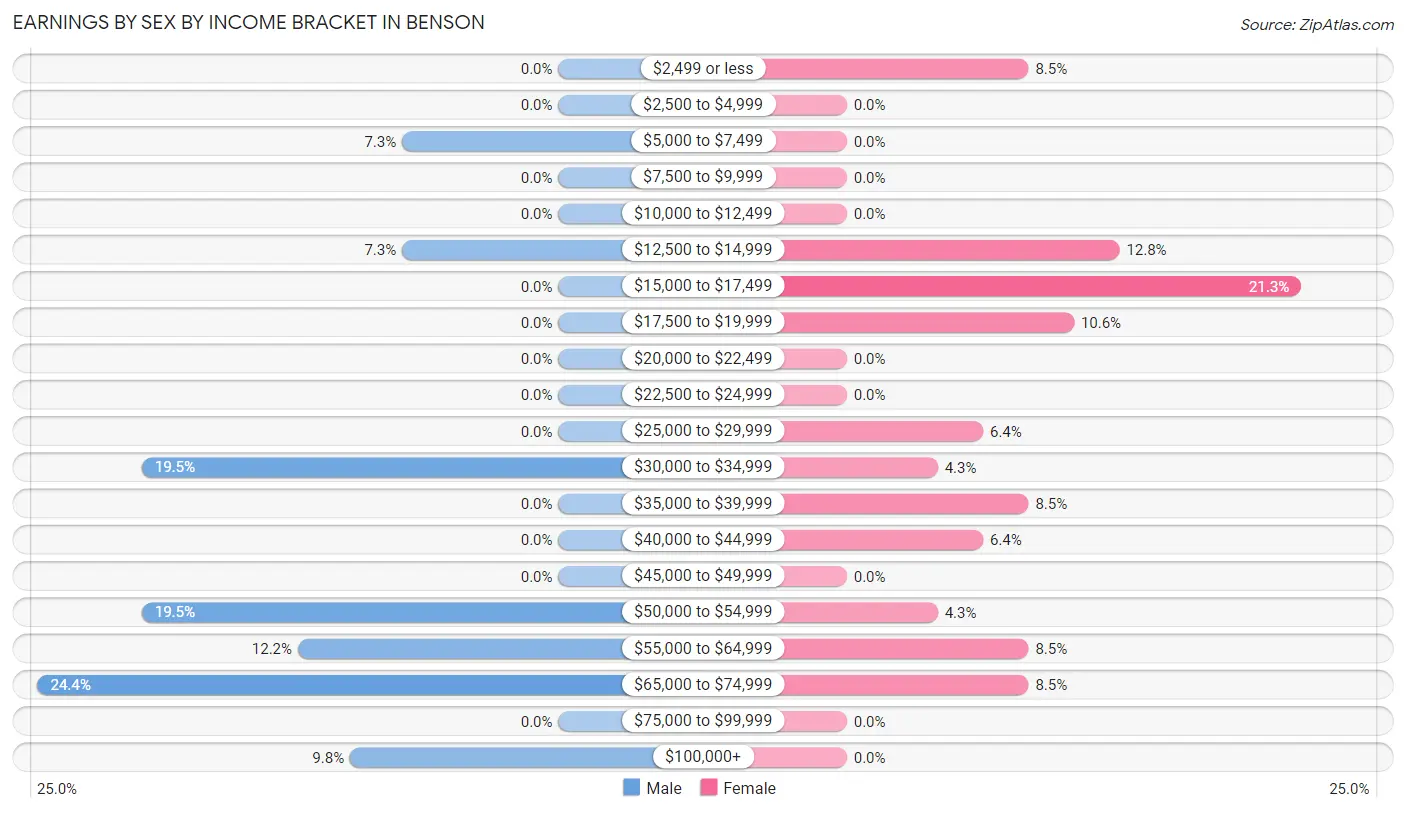
| Income | Male | Female |
| $2,499 or less | 0 (0.0%) | 4 (8.5%) |
| $2,500 to $4,999 | 0 (0.0%) | 0 (0.0%) |
| $5,000 to $7,499 | 3 (7.3%) | 0 (0.0%) |
| $7,500 to $9,999 | 0 (0.0%) | 0 (0.0%) |
| $10,000 to $12,499 | 0 (0.0%) | 0 (0.0%) |
| $12,500 to $14,999 | 3 (7.3%) | 6 (12.8%) |
| $15,000 to $17,499 | 0 (0.0%) | 10 (21.3%) |
| $17,500 to $19,999 | 0 (0.0%) | 5 (10.6%) |
| $20,000 to $22,499 | 0 (0.0%) | 0 (0.0%) |
| $22,500 to $24,999 | 0 (0.0%) | 0 (0.0%) |
| $25,000 to $29,999 | 0 (0.0%) | 3 (6.4%) |
| $30,000 to $34,999 | 8 (19.5%) | 2 (4.3%) |
| $35,000 to $39,999 | 0 (0.0%) | 4 (8.5%) |
| $40,000 to $44,999 | 0 (0.0%) | 3 (6.4%) |
| $45,000 to $49,999 | 0 (0.0%) | 0 (0.0%) |
| $50,000 to $54,999 | 8 (19.5%) | 2 (4.3%) |
| $55,000 to $64,999 | 5 (12.2%) | 4 (8.5%) |
| $65,000 to $74,999 | 10 (24.4%) | 4 (8.5%) |
| $75,000 to $99,999 | 0 (0.0%) | 0 (0.0%) |
| $100,000+ | 4 (9.8%) | 0 (0.0%) |
| Total | 41 (100.0%) | 47 (100.0%) |
Earnings by Sex by Educational Attainment in Benson
Average earnings in Benson are $51,667 for men and $33,125 for women, a difference of 35.9%. Men with an educational attainment of high school diploma enjoy the highest average annual earnings of $52,188, while those with high school diploma education earn the least with $52,188. Women with an educational attainment of college or associate's degree earn the most with the average annual earnings of $52,500, while those with high school diploma education have the smallest earnings of $22,500.
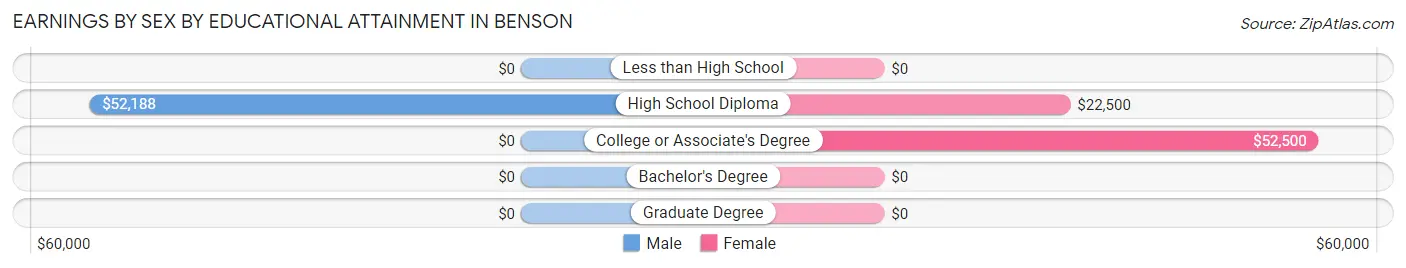
| Educational Attainment | Male Income | Female Income |
| Less than High School | - | - |
| High School Diploma | $52,188 | $22,500 |
| College or Associate's Degree | - | - |
| Bachelor's Degree | - | - |
| Graduate Degree | - | - |
| Total | $51,667 | $33,125 |
Family Income in Benson
Family Income Brackets in Benson
According to the Benson family income data, there are 22 families falling into the $25,000 to $34,999 income range, which is the most common income bracket and makes up 44.0% of all families.
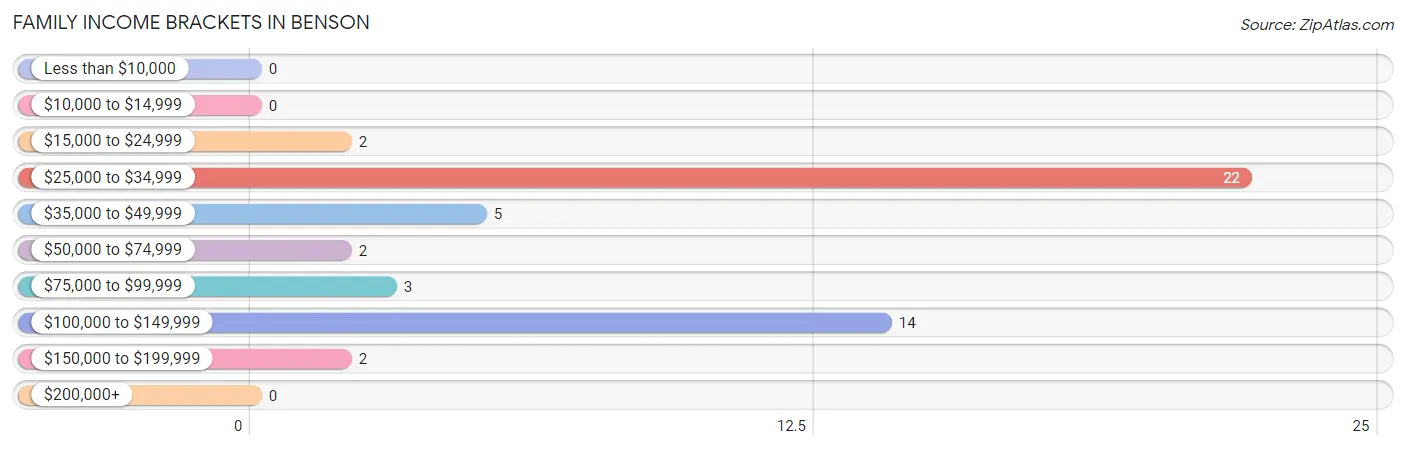
| Income Bracket | # Families | % Families |
| Less than $10,000 | 0 | 0.0% |
| $10,000 to $14,999 | 0 | 0.0% |
| $15,000 to $24,999 | 2 | 4.0% |
| $25,000 to $34,999 | 22 | 44.0% |
| $35,000 to $49,999 | 5 | 10.0% |
| $50,000 to $74,999 | 2 | 4.0% |
| $75,000 to $99,999 | 3 | 6.0% |
| $100,000 to $149,999 | 14 | 28.0% |
| $150,000 to $199,999 | 2 | 4.0% |
| $200,000+ | 0 | 0.0% |
Family Income by Famaliy Size in Benson
2-person families (16 | 32.0%) account for the highest median family income in Benson with $32,143 per family, while 2-person families (16 | 32.0%) have the highest median income of $16,072 per family member.
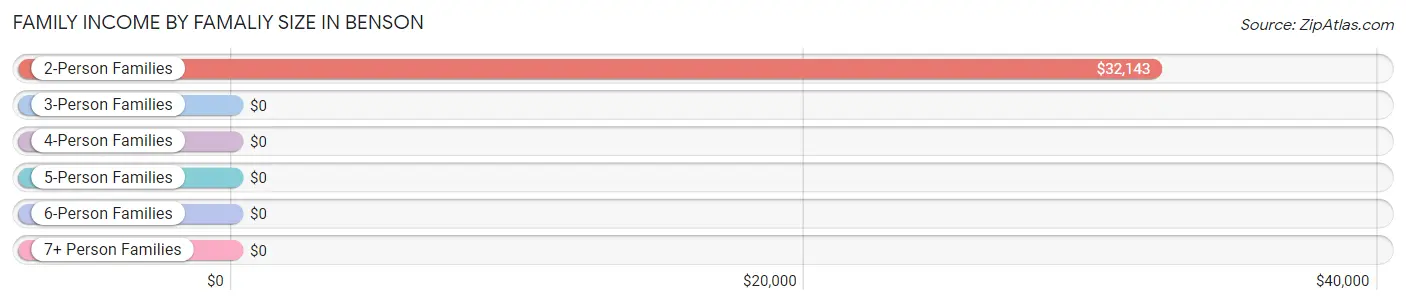
| Income Bracket | # Families | Median Income |
| 2-Person Families | 16 (32.0%) | $32,143 |
| 3-Person Families | 23 (46.0%) | $0 |
| 4-Person Families | 8 (16.0%) | $0 |
| 5-Person Families | 3 (6.0%) | $0 |
| 6-Person Families | 0 (0.0%) | $0 |
| 7+ Person Families | 0 (0.0%) | $0 |
| Total | 50 (100.0%) | $0 |
Family Income by Number of Earners in Benson
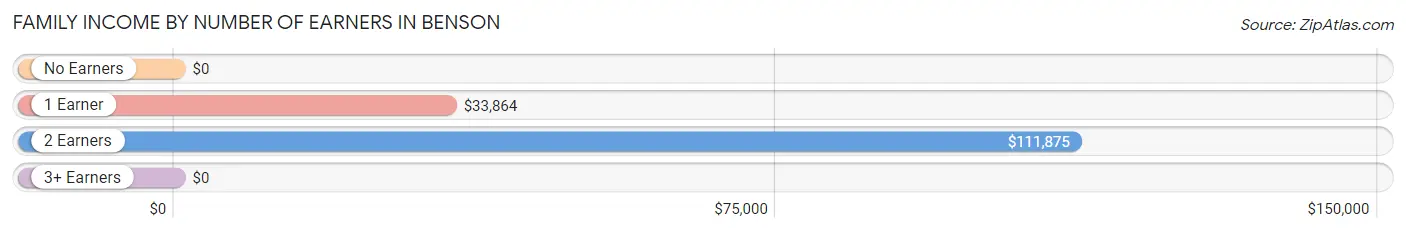
| Number of Earners | # Families | Median Income |
| No Earners | 9 (18.0%) | $0 |
| 1 Earner | 20 (40.0%) | $33,864 |
| 2 Earners | 16 (32.0%) | $111,875 |
| 3+ Earners | 5 (10.0%) | $0 |
| Total | 50 (100.0%) | $0 |
Household Income in Benson
Household Income Brackets in Benson
With 24 households falling in the category, the $25,000 to $34,999 income range is the most frequent in Benson, accounting for 23.8% of all households.
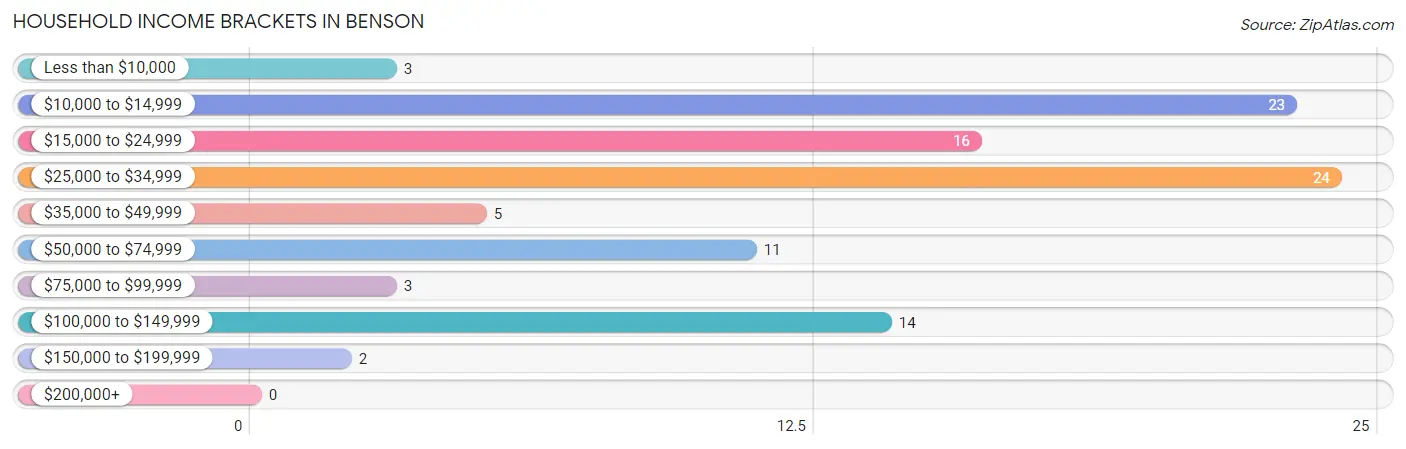
| Income Bracket | # Households | % Households |
| Less than $10,000 | 3 | 3.0% |
| $10,000 to $14,999 | 23 | 22.8% |
| $15,000 to $24,999 | 16 | 15.8% |
| $25,000 to $34,999 | 24 | 23.8% |
| $35,000 to $49,999 | 5 | 5.0% |
| $50,000 to $74,999 | 11 | 10.9% |
| $75,000 to $99,999 | 3 | 3.0% |
| $100,000 to $149,999 | 14 | 13.9% |
| $150,000 to $199,999 | 2 | 2.0% |
| $200,000+ | 0 | 0.0% |
Household Income by Householder Age in Benson
The median household income in Benson is $31,607, with the highest median household income of $23,125 found in the 45 to 64 years age bracket for the primary householder. A total of 33 households (32.7%) fall into this category.
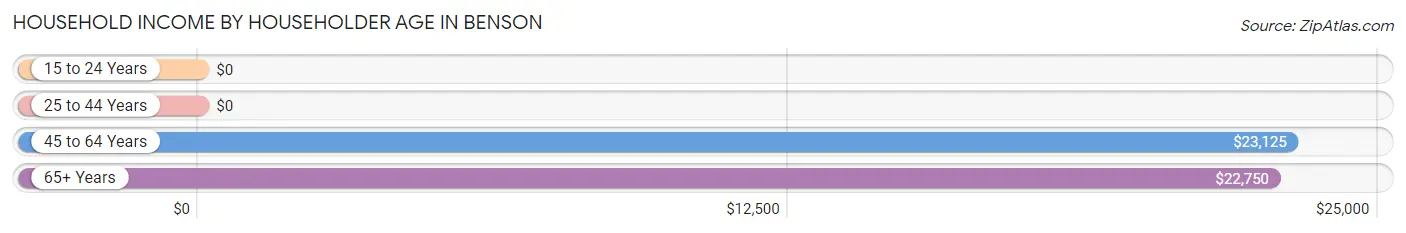
| Income Bracket | # Households | Median Income |
| 15 to 24 Years | 0 (0.0%) | $0 |
| 25 to 44 Years | 29 (28.7%) | $0 |
| 45 to 64 Years | 33 (32.7%) | $23,125 |
| 65+ Years | 39 (38.6%) | $22,750 |
| Total | 101 (100.0%) | $31,607 |
Poverty in Benson
Income Below Poverty by Sex and Age in Benson
With 10.5% poverty level for males and 16.5% for females among the residents of Benson, 75 year old and over males and 45 to 54 year old females are the most vulnerable to poverty, with 8 males (40.0%) and 9 females (75.0%) in their respective age groups living below the poverty level.
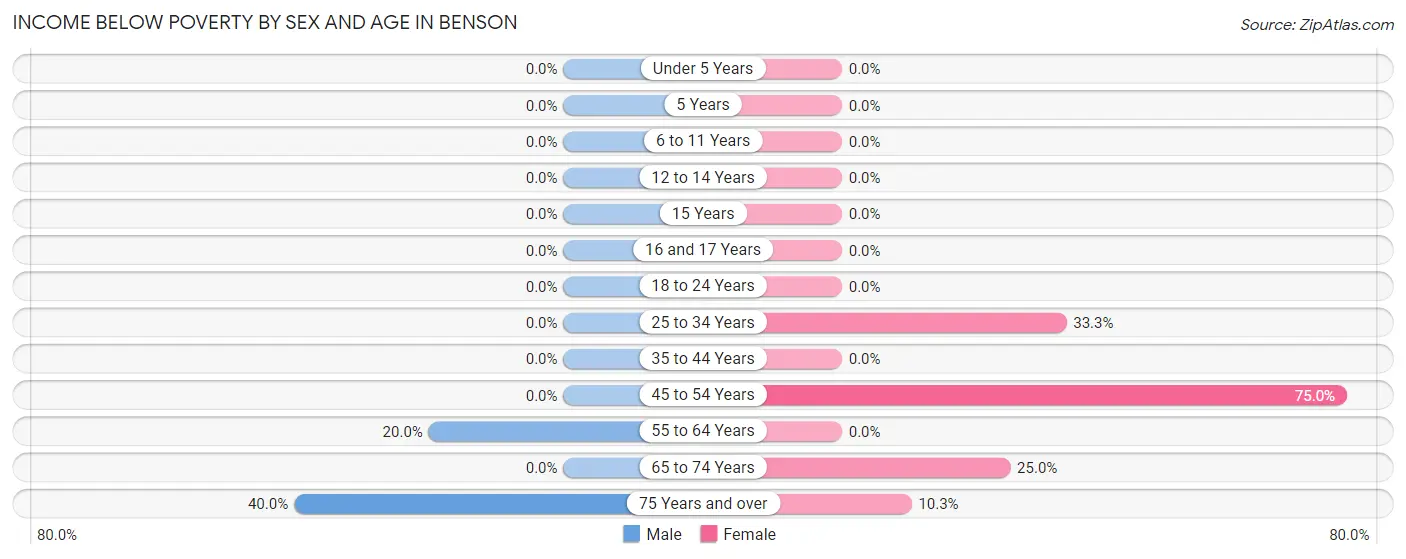
| Age Bracket | Male | Female |
| Under 5 Years | 0 (0.0%) | 0 (0.0%) |
| 5 Years | 0 (0.0%) | 0 (0.0%) |
| 6 to 11 Years | 0 (0.0%) | 0 (0.0%) |
| 12 to 14 Years | 0 (0.0%) | 0 (0.0%) |
| 15 Years | 0 (0.0%) | 0 (0.0%) |
| 16 and 17 Years | 0 (0.0%) | 0 (0.0%) |
| 18 to 24 Years | 0 (0.0%) | 0 (0.0%) |
| 25 to 34 Years | 0 (0.0%) | 8 (33.3%) |
| 35 to 44 Years | 0 (0.0%) | 0 (0.0%) |
| 45 to 54 Years | 0 (0.0%) | 9 (75.0%) |
| 55 to 64 Years | 3 (20.0%) | 0 (0.0%) |
| 65 to 74 Years | 0 (0.0%) | 1 (25.0%) |
| 75 Years and over | 8 (40.0%) | 3 (10.3%) |
| Total | 11 (10.5%) | 21 (16.5%) |
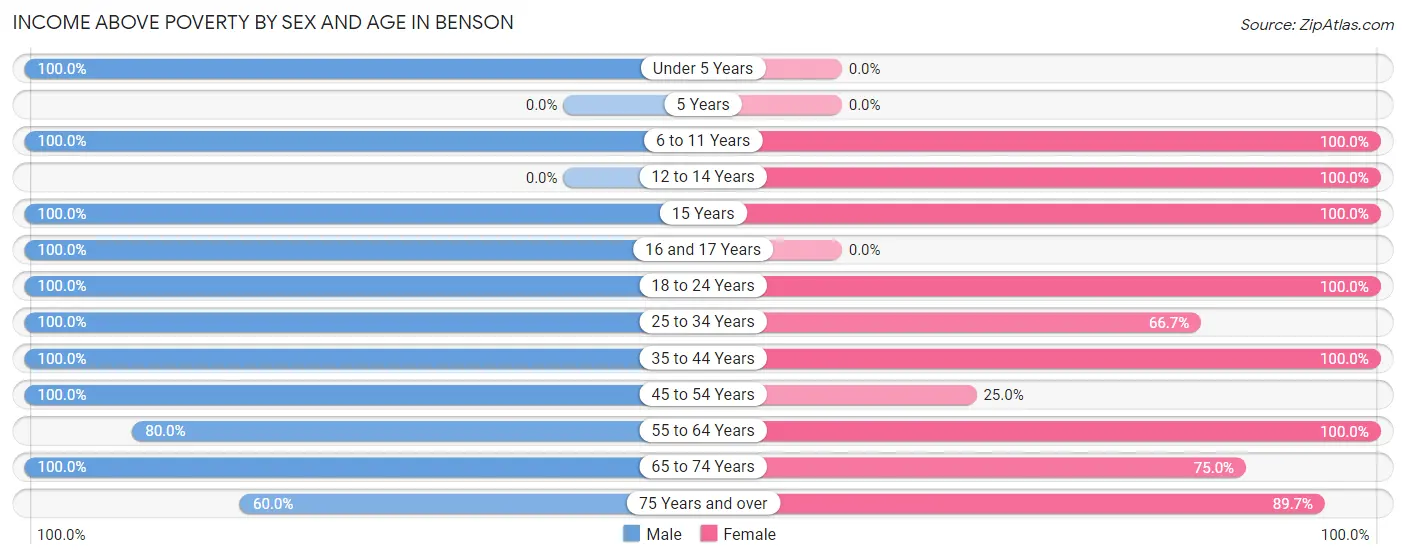
Income Above Poverty by Sex and Age in Benson
According to the poverty statistics in Benson, males aged under 5 years and females aged 6 to 11 years are the age groups that are most secure financially, with 100.0% of males and 100.0% of females in these age groups living above the poverty line.
| Age Bracket | Male | Female |
| Under 5 Years | 8 (100.0%) | 0 (0.0%) |
| 5 Years | 0 (0.0%) | 0 (0.0%) |
| 6 to 11 Years | 11 (100.0%) | 16 (100.0%) |
| 12 to 14 Years | 0 (0.0%) | 7 (100.0%) |
| 15 Years | 2 (100.0%) | 3 (100.0%) |
| 16 and 17 Years | 3 (100.0%) | 0 (0.0%) |
| 18 to 24 Years | 11 (100.0%) | 10 (100.0%) |
| 25 to 34 Years | 11 (100.0%) | 16 (66.7%) |
| 35 to 44 Years | 13 (100.0%) | 7 (100.0%) |
| 45 to 54 Years | 8 (100.0%) | 3 (25.0%) |
| 55 to 64 Years | 12 (80.0%) | 15 (100.0%) |
| 65 to 74 Years | 3 (100.0%) | 3 (75.0%) |
| 75 Years and over | 12 (60.0%) | 26 (89.7%) |
| Total | 94 (89.5%) | 106 (83.5%) |
Income Below Poverty Among Married-Couple Families in Benson
| Children | Above Poverty | Below Poverty |
| No Children | 23 (100.0%) | 0 (0.0%) |
| 1 or 2 Children | 16 (100.0%) | 0 (0.0%) |
| 3 or 4 Children | 0 (0.0%) | 0 (0.0%) |
| 5 or more Children | 0 (0.0%) | 0 (0.0%) |
| Total | 39 (100.0%) | 0 (0.0%) |
Income Below Poverty Among Single-Parent Households in Benson
| Children | Single Father | Single Mother |
| No Children | 0 (0.0%) | 0 (0.0%) |
| 1 or 2 Children | 0 (0.0%) | 0 (0.0%) |
| 3 or 4 Children | 0 (0.0%) | 0 (0.0%) |
| 5 or more Children | 0 (0.0%) | 0 (0.0%) |
| Total | 0 (0.0%) | 0 (0.0%) |
Income Below Poverty Among Married-Couple vs Single-Parent Households in Benson
| Children | Married-Couple Families | Single-Parent Households |
| No Children | 0 (0.0%) | 0 (0.0%) |
| 1 or 2 Children | 0 (0.0%) | 0 (0.0%) |
| 3 or 4 Children | 0 (0.0%) | 0 (0.0%) |
| 5 or more Children | 0 (0.0%) | 0 (0.0%) |
| Total | 0 (0.0%) | 0 (0.0%) |
Employment Characteristics in Benson
Employment by Class of Employer in Benson
Among the 88 employed individuals in Benson, private company employees (43 | 48.9%), self-employed (not incorporated) (25 | 28.4%), and state government employees (8 | 9.1%) make up the most common classes of employment.
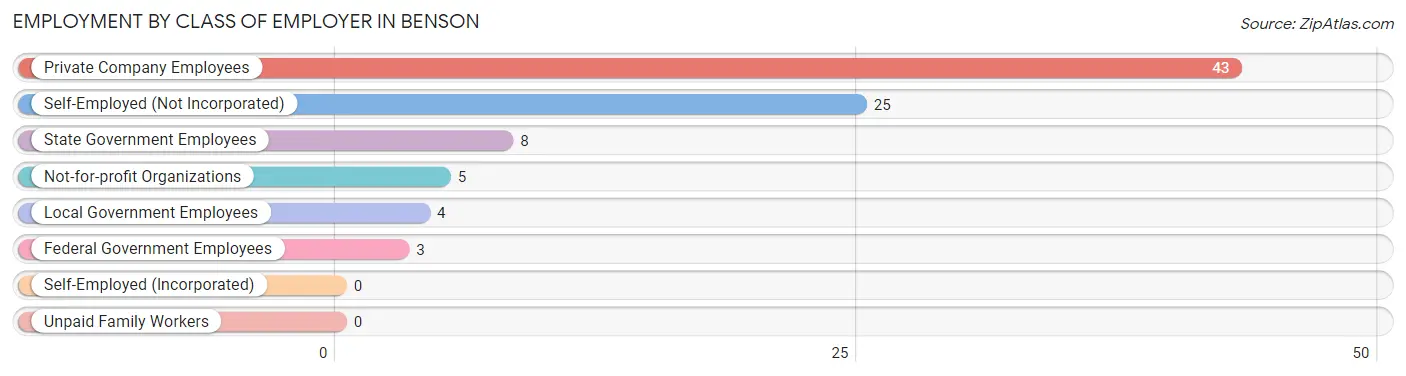
| Employer Class | # Employees | % Employees |
| Private Company Employees | 43 | 48.9% |
| Self-Employed (Incorporated) | 0 | 0.0% |
| Self-Employed (Not Incorporated) | 25 | 28.4% |
| Not-for-profit Organizations | 5 | 5.7% |
| Local Government Employees | 4 | 4.5% |
| State Government Employees | 8 | 9.1% |
| Federal Government Employees | 3 | 3.4% |
| Unpaid Family Workers | 0 | 0.0% |
| Total | 88 | 100.0% |
Employment Status by Age in Benson
According to the labor force statistics for Benson, out of the total population over 16 years of age (185), 50.8% or 94 individuals are in the labor force, with 6.4% or 6 of them unemployed. The age group with the highest labor force participation rate is 16 to 19 years, with 100.0% or 6 individuals in the labor force. Within the labor force, the 16 to 19 years age range has the highest percentage of unemployed individuals, with 50.0% or 3 of them being unemployed.
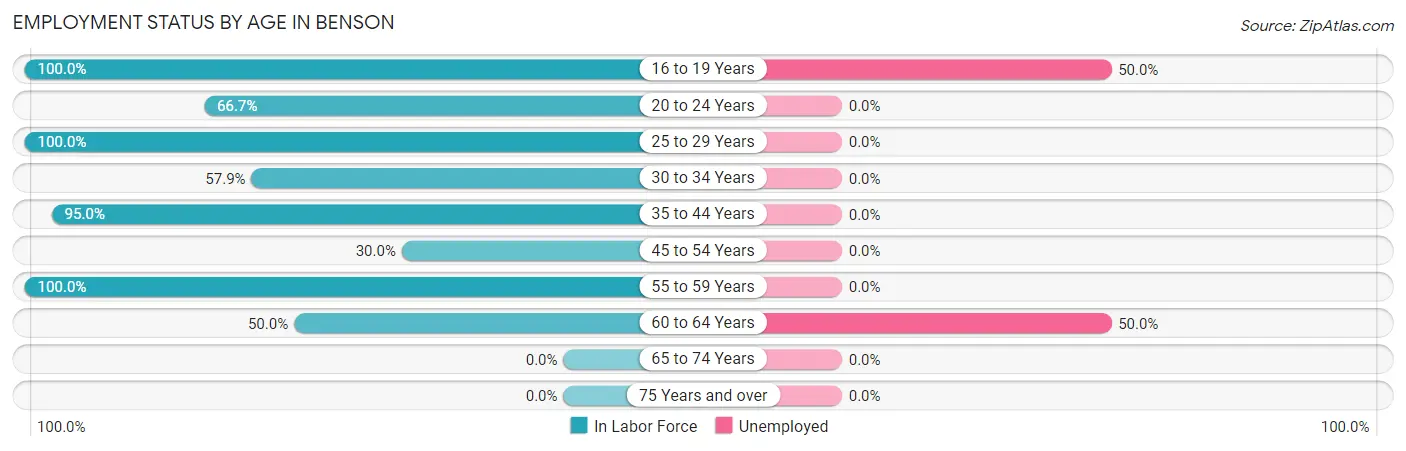
| Age Bracket | In Labor Force | Unemployed |
| 16 to 19 Years | 6 (100.0%) | 3 (50.0%) |
| 20 to 24 Years | 12 (66.7%) | 0 (0.0%) |
| 25 to 29 Years | 16 (100.0%) | 0 (0.0%) |
| 30 to 34 Years | 11 (57.9%) | 0 (0.0%) |
| 35 to 44 Years | 19 (95.0%) | 0 (0.0%) |
| 45 to 54 Years | 6 (30.0%) | 0 (0.0%) |
| 55 to 59 Years | 18 (100.0%) | 0 (0.0%) |
| 60 to 64 Years | 6 (50.0%) | 3 (50.0%) |
| 65 to 74 Years | 0 (0.0%) | 0 (0.0%) |
| 75 Years and over | 0 (0.0%) | 0 (0.0%) |
| Total | 94 (50.8%) | 6 (6.4%) |
Employment Status by Educational Attainment in Benson
According to labor force statistics for Benson, 72.4% of individuals (76) out of the total population between 25 and 64 years of age (105) are in the labor force, with 3.9% or 3 of them being unemployed. The group with the highest labor force participation rate are those with the educational attainment of bachelor's degree or higher, with 100.0% or 2 individuals in the labor force. Within the labor force, individuals with high school diploma education have the highest percentage of unemployment, with 6.0% or 3 of them being unemployed.
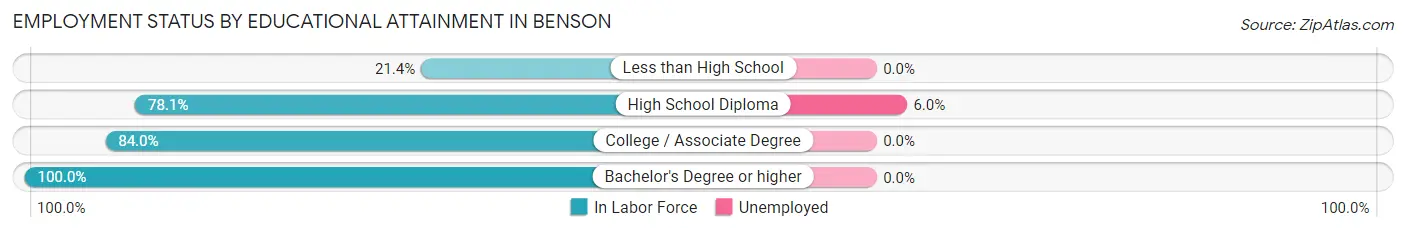
| Educational Attainment | In Labor Force | Unemployed |
| Less than High School | 3 (21.4%) | 0 (0.0%) |
| High School Diploma | 50 (78.1%) | 4 (6.0%) |
| College / Associate Degree | 21 (84.0%) | 0 (0.0%) |
| Bachelor's Degree or higher | 2 (100.0%) | 0 (0.0%) |
| Total | 76 (72.4%) | 4 (3.9%) |
Employment Occupations by Sex in Benson
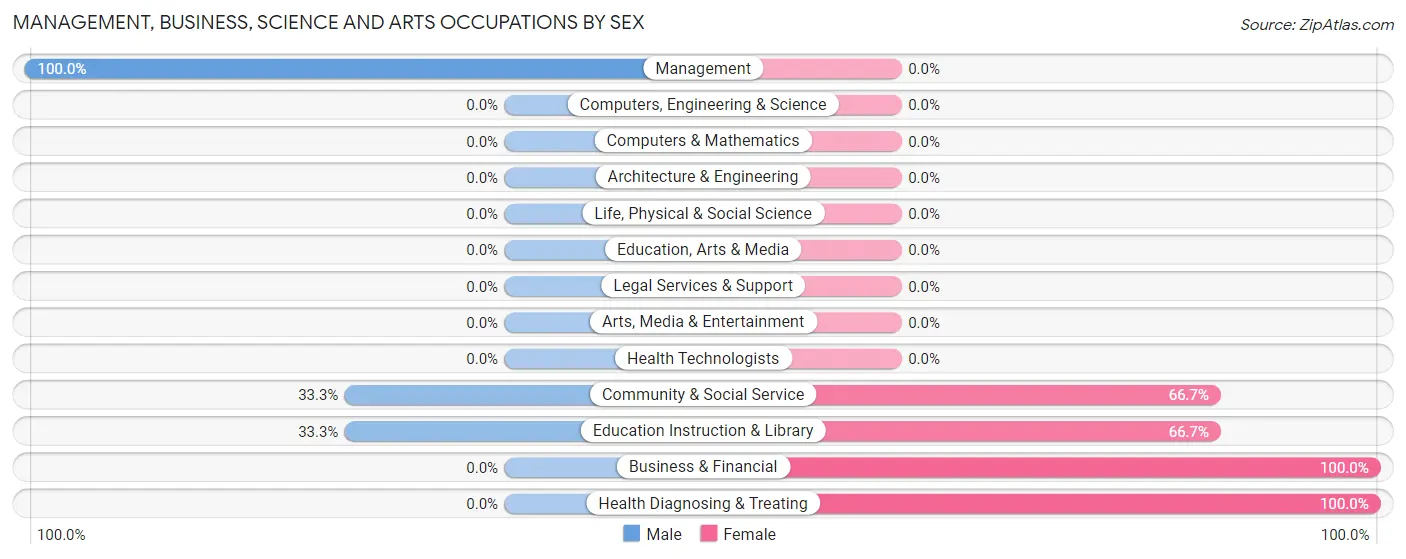
Management, Business, Science and Arts Occupations
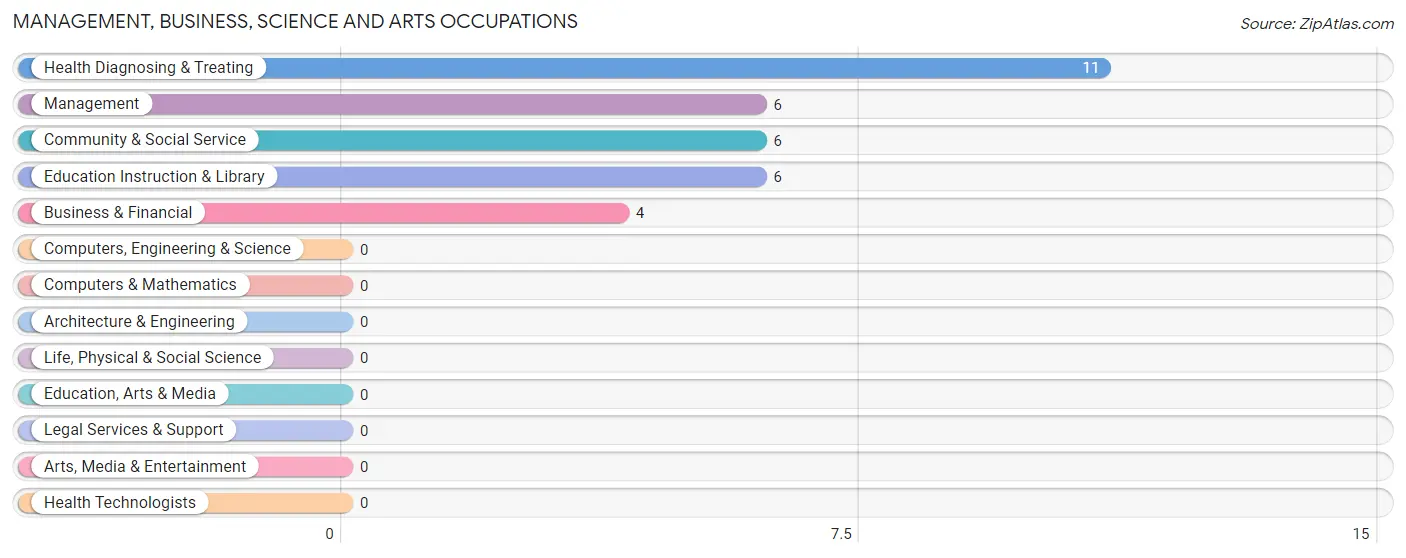
The most common Management, Business, Science and Arts occupations in Benson are Health Diagnosing & Treating (11 | 12.5%), Management (6 | 6.8%), Community & Social Service (6 | 6.8%), Education Instruction & Library (6 | 6.8%), and Business & Financial (4 | 4.5%).
Management, Business, Science and Arts Occupations by Sex
Within the Management, Business, Science and Arts occupations in Benson, the most male-oriented occupations are Management (100.0%), Community & Social Service (33.3%), and Education Instruction & Library (33.3%), while the most female-oriented occupations are Business & Financial (100.0%), Health Diagnosing & Treating (100.0%), and Community & Social Service (66.7%).
| Occupation | Male | Female |
| Management | 6 (100.0%) | 0 (0.0%) |
| Business & Financial | 0 (0.0%) | 4 (100.0%) |
| Computers, Engineering & Science | 0 (0.0%) | 0 (0.0%) |
| Computers & Mathematics | 0 (0.0%) | 0 (0.0%) |
| Architecture & Engineering | 0 (0.0%) | 0 (0.0%) |
| Life, Physical & Social Science | 0 (0.0%) | 0 (0.0%) |
| Community & Social Service | 2 (33.3%) | 4 (66.7%) |
| Education, Arts & Media | 0 (0.0%) | 0 (0.0%) |
| Legal Services & Support | 0 (0.0%) | 0 (0.0%) |
| Education Instruction & Library | 2 (33.3%) | 4 (66.7%) |
| Arts, Media & Entertainment | 0 (0.0%) | 0 (0.0%) |
| Health Diagnosing & Treating | 0 (0.0%) | 11 (100.0%) |
| Health Technologists | 0 (0.0%) | 0 (0.0%) |
| Total (Category) | 8 (29.6%) | 19 (70.4%) |
| Total (Overall) | 41 (46.6%) | 47 (53.4%) |
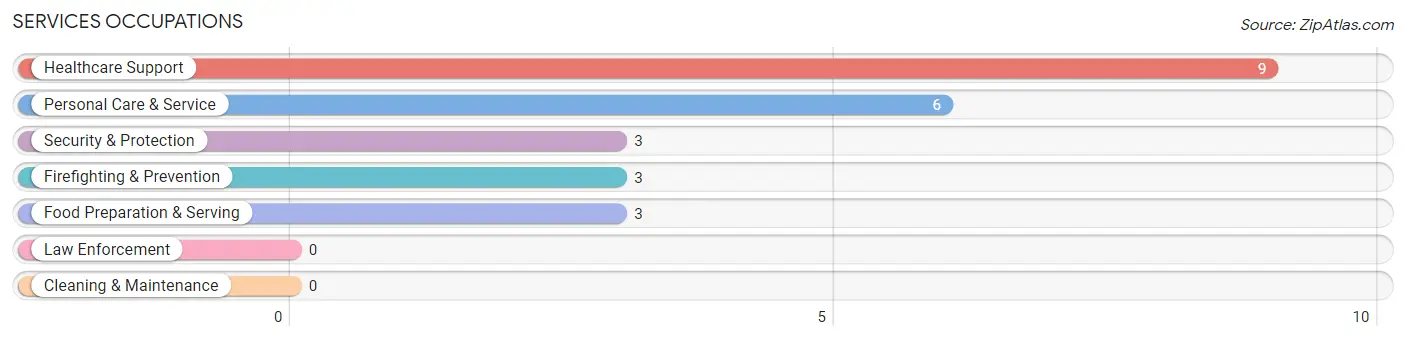
Services Occupations
The most common Services occupations in Benson are Healthcare Support (9 | 10.2%), Personal Care & Service (6 | 6.8%), Security & Protection (3 | 3.4%), Firefighting & Prevention (3 | 3.4%), and Food Preparation & Serving (3 | 3.4%).
Services Occupations by Sex
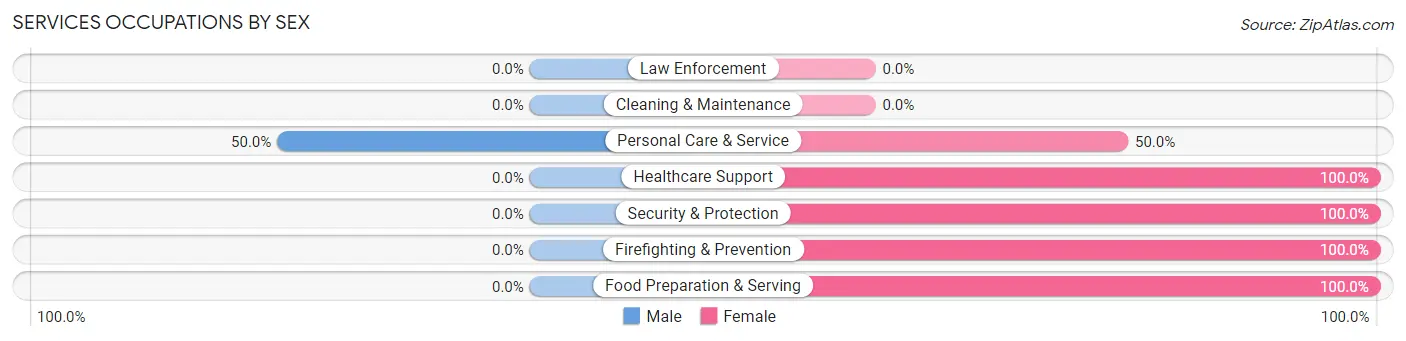
| Occupation | Male | Female |
| Healthcare Support | 0 (0.0%) | 9 (100.0%) |
| Security & Protection | 0 (0.0%) | 3 (100.0%) |
| Firefighting & Prevention | 0 (0.0%) | 3 (100.0%) |
| Law Enforcement | 0 (0.0%) | 0 (0.0%) |
| Food Preparation & Serving | 0 (0.0%) | 3 (100.0%) |
| Cleaning & Maintenance | 0 (0.0%) | 0 (0.0%) |
| Personal Care & Service | 3 (50.0%) | 3 (50.0%) |
| Total (Category) | 3 (14.3%) | 18 (85.7%) |
| Total (Overall) | 41 (46.6%) | 47 (53.4%) |
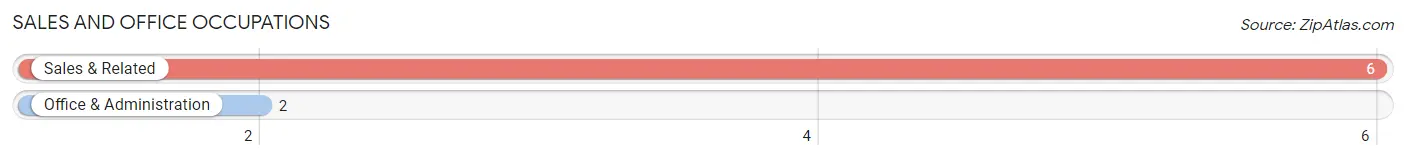
Sales and Office Occupations
The most common Sales and Office occupations in Benson are Sales & Related (6 | 6.8%), and Office & Administration (2 | 2.3%).
Sales and Office Occupations by Sex
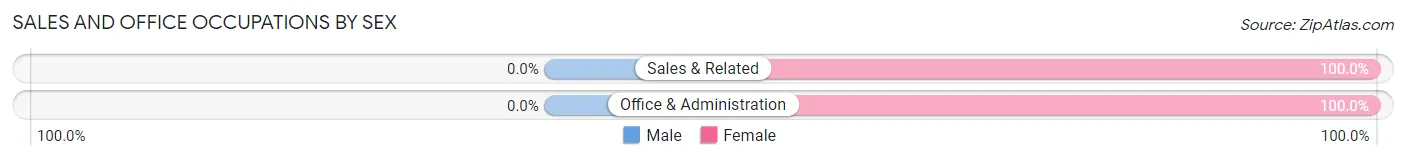
| Occupation | Male | Female |
| Sales & Related | 0 (0.0%) | 6 (100.0%) |
| Office & Administration | 0 (0.0%) | 2 (100.0%) |
| Total (Category) | 0 (0.0%) | 8 (100.0%) |
| Total (Overall) | 41 (46.6%) | 47 (53.4%) |
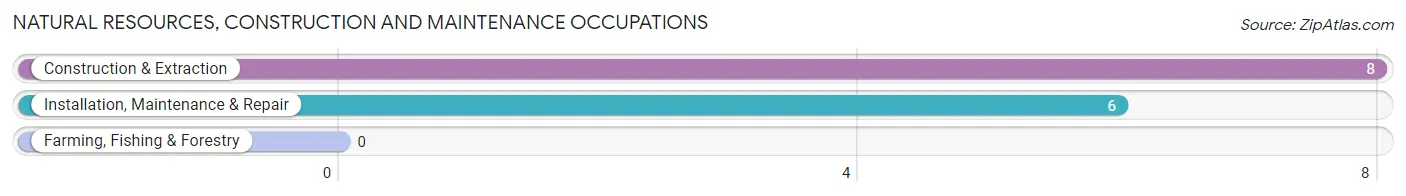
Natural Resources, Construction and Maintenance Occupations
The most common Natural Resources, Construction and Maintenance occupations in Benson are Construction & Extraction (8 | 9.1%), and Installation, Maintenance & Repair (6 | 6.8%).
Natural Resources, Construction and Maintenance Occupations by Sex
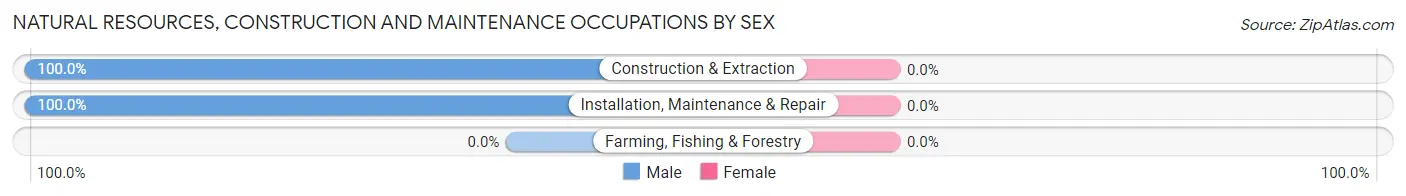
| Occupation | Male | Female |
| Farming, Fishing & Forestry | 0 (0.0%) | 0 (0.0%) |
| Construction & Extraction | 8 (100.0%) | 0 (0.0%) |
| Installation, Maintenance & Repair | 6 (100.0%) | 0 (0.0%) |
| Total (Category) | 14 (100.0%) | 0 (0.0%) |
| Total (Overall) | 41 (46.6%) | 47 (53.4%) |
Production, Transportation and Moving Occupations
The most common Production, Transportation and Moving occupations in Benson are Production (11 | 12.5%), Transportation (4 | 4.5%), and Material Moving (3 | 3.4%).
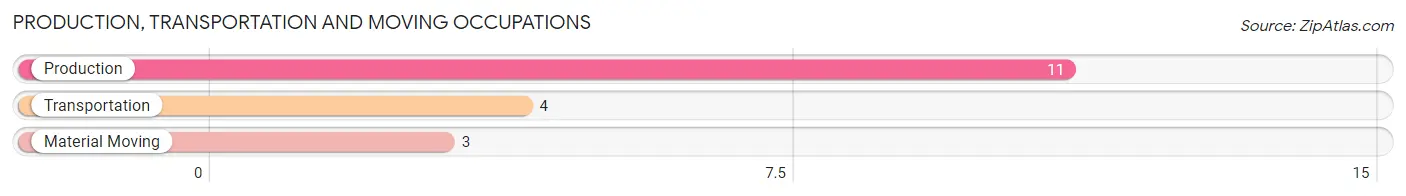
Production, Transportation and Moving Occupations by Sex
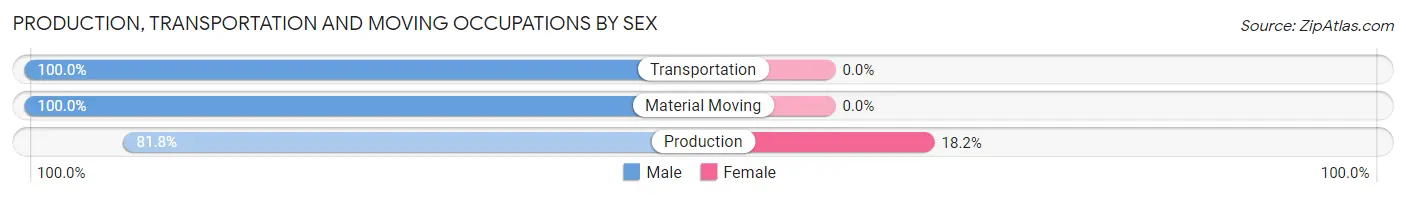
| Occupation | Male | Female |
| Production | 9 (81.8%) | 2 (18.2%) |
| Transportation | 4 (100.0%) | 0 (0.0%) |
| Material Moving | 3 (100.0%) | 0 (0.0%) |
| Total (Category) | 16 (88.9%) | 2 (11.1%) |
| Total (Overall) | 41 (46.6%) | 47 (53.4%) |
Employment Industries by Sex in Benson
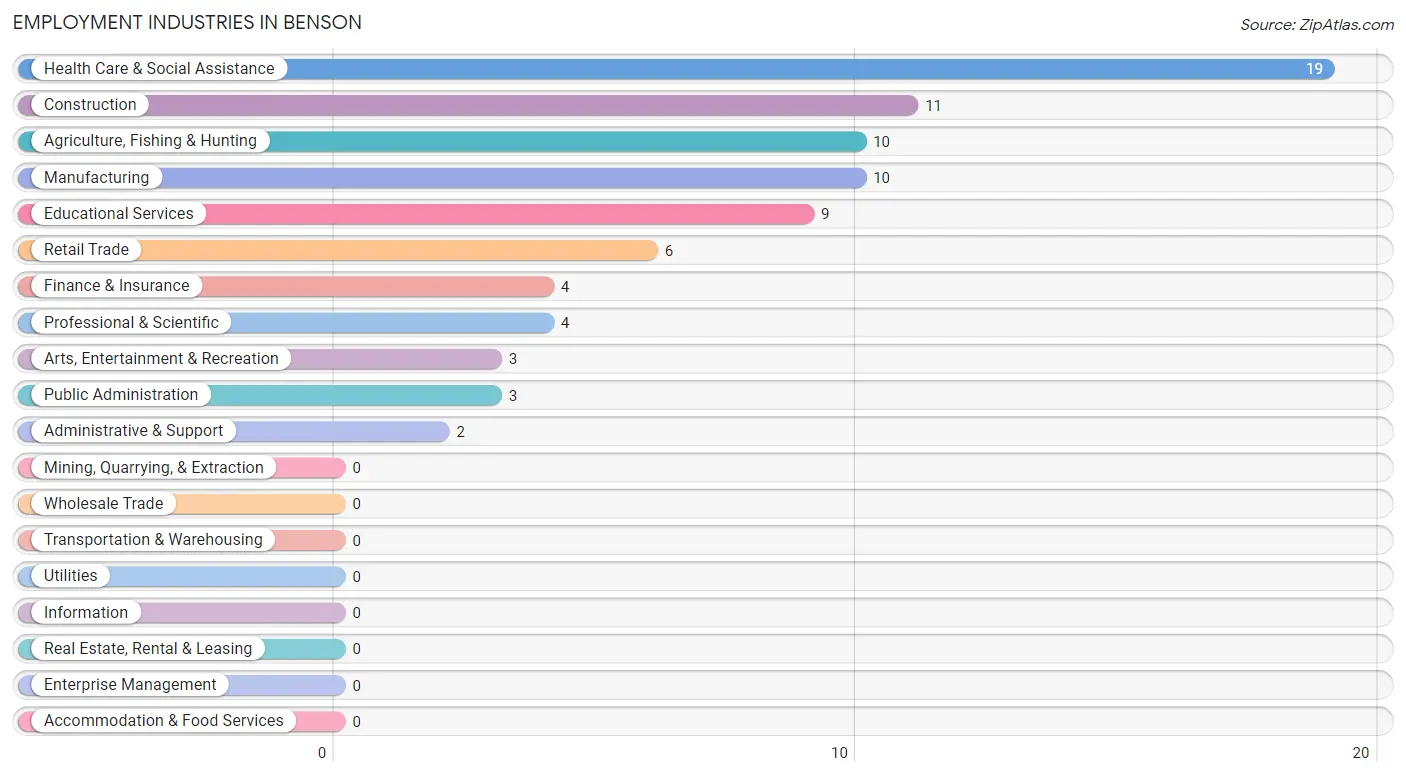
Employment Industries in Benson
The major employment industries in Benson include Health Care & Social Assistance (19 | 21.6%), Construction (11 | 12.5%), Agriculture, Fishing & Hunting (10 | 11.4%), Manufacturing (10 | 11.4%), and Educational Services (9 | 10.2%).
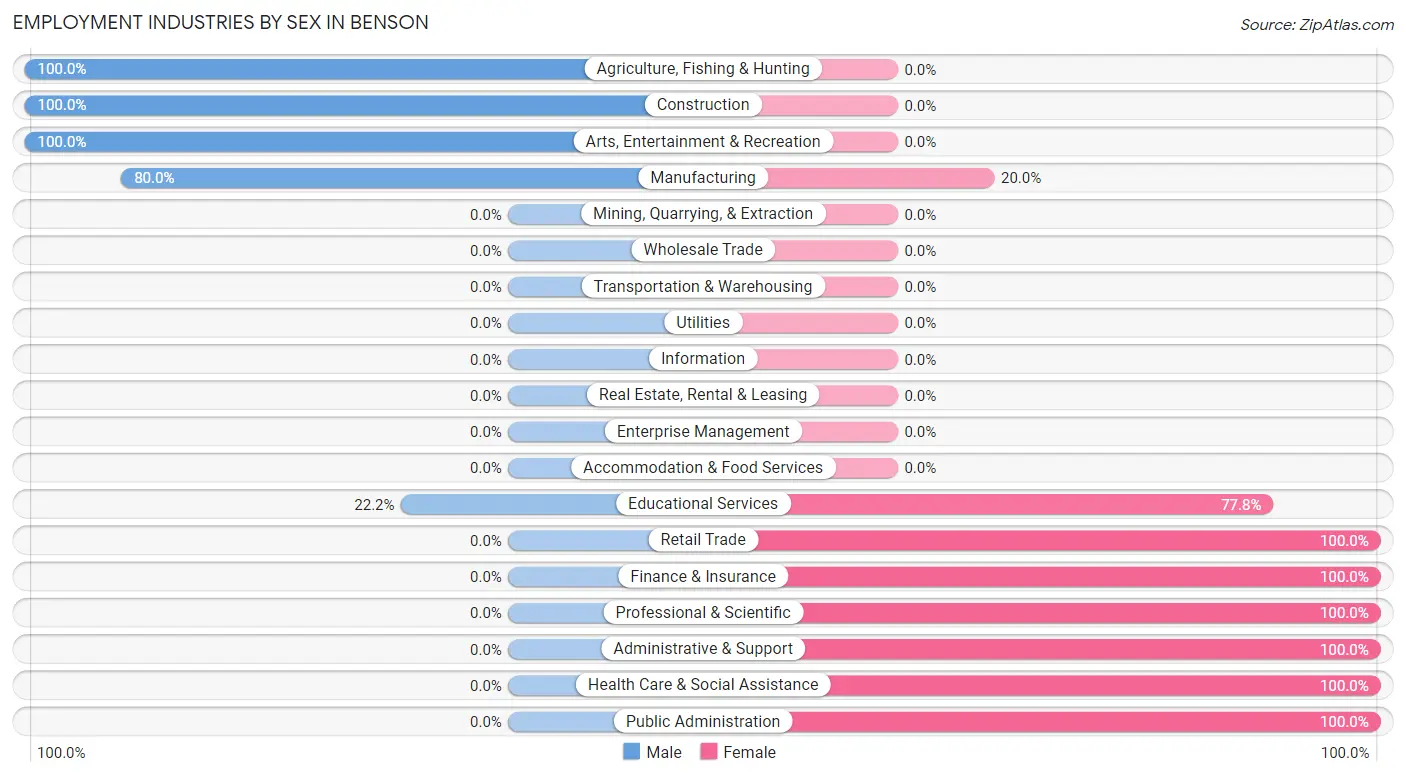
Employment Industries by Sex in Benson
The Benson industries that see more men than women are Agriculture, Fishing & Hunting (100.0%), Construction (100.0%), and Arts, Entertainment & Recreation (100.0%), whereas the industries that tend to have a higher number of women are Retail Trade (100.0%), Finance & Insurance (100.0%), and Professional & Scientific (100.0%).
| Industry | Male | Female |
| Agriculture, Fishing & Hunting | 10 (100.0%) | 0 (0.0%) |
| Mining, Quarrying, & Extraction | 0 (0.0%) | 0 (0.0%) |
| Construction | 11 (100.0%) | 0 (0.0%) |
| Manufacturing | 8 (80.0%) | 2 (20.0%) |
| Wholesale Trade | 0 (0.0%) | 0 (0.0%) |
| Retail Trade | 0 (0.0%) | 6 (100.0%) |
| Transportation & Warehousing | 0 (0.0%) | 0 (0.0%) |
| Utilities | 0 (0.0%) | 0 (0.0%) |
| Information | 0 (0.0%) | 0 (0.0%) |
| Finance & Insurance | 0 (0.0%) | 4 (100.0%) |
| Real Estate, Rental & Leasing | 0 (0.0%) | 0 (0.0%) |
| Professional & Scientific | 0 (0.0%) | 4 (100.0%) |
| Enterprise Management | 0 (0.0%) | 0 (0.0%) |
| Administrative & Support | 0 (0.0%) | 2 (100.0%) |
| Educational Services | 2 (22.2%) | 7 (77.8%) |
| Health Care & Social Assistance | 0 (0.0%) | 19 (100.0%) |
| Arts, Entertainment & Recreation | 3 (100.0%) | 0 (0.0%) |
| Accommodation & Food Services | 0 (0.0%) | 0 (0.0%) |
| Public Administration | 0 (0.0%) | 3 (100.0%) |
| Total | 41 (46.6%) | 47 (53.4%) |
Education in Benson
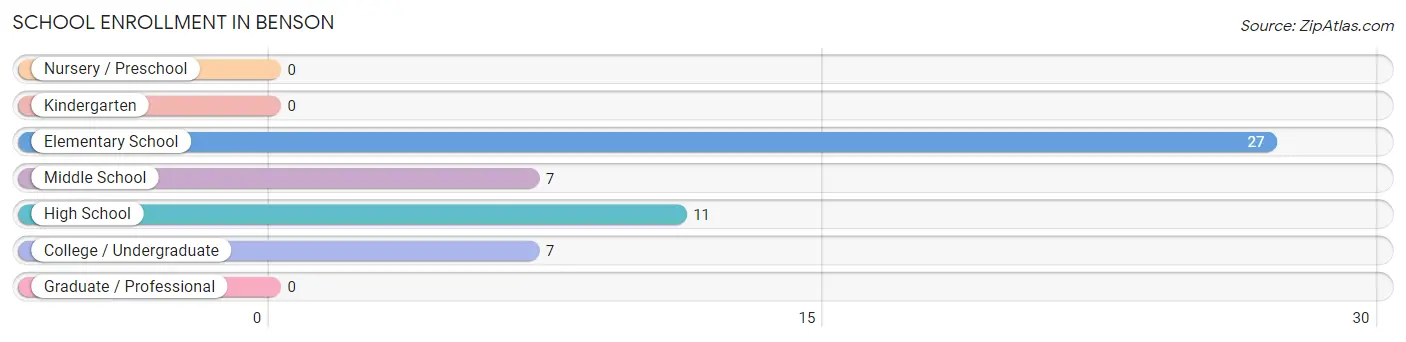
School Enrollment in Benson
The most common levels of schooling among the 52 students in Benson are elementary school (27 | 51.9%), high school (11 | 21.1%), and middle school (7 | 13.5%).
| School Level | # Students | % Students |
| Nursery / Preschool | 0 | 0.0% |
| Kindergarten | 0 | 0.0% |
| Elementary School | 27 | 51.9% |
| Middle School | 7 | 13.5% |
| High School | 11 | 21.1% |
| College / Undergraduate | 7 | 13.5% |
| Graduate / Professional | 0 | 0.0% |
| Total | 52 | 100.0% |
School Enrollment by Age by Funding Source in Benson
Out of a total of 52 students who are enrolled in schools in Benson, 2 (3.8%) attend a private institution, while the remaining 50 (96.2%) are enrolled in public schools. The age group of 15 to 17 year olds has the highest likelihood of being enrolled in private schools, with 2 (25.0% in the age bracket) enrolled. Conversely, the age group of 5 to 9 year old has the lowest likelihood of being enrolled in a private school, with 27 (100.0% in the age bracket) attending a public institution.
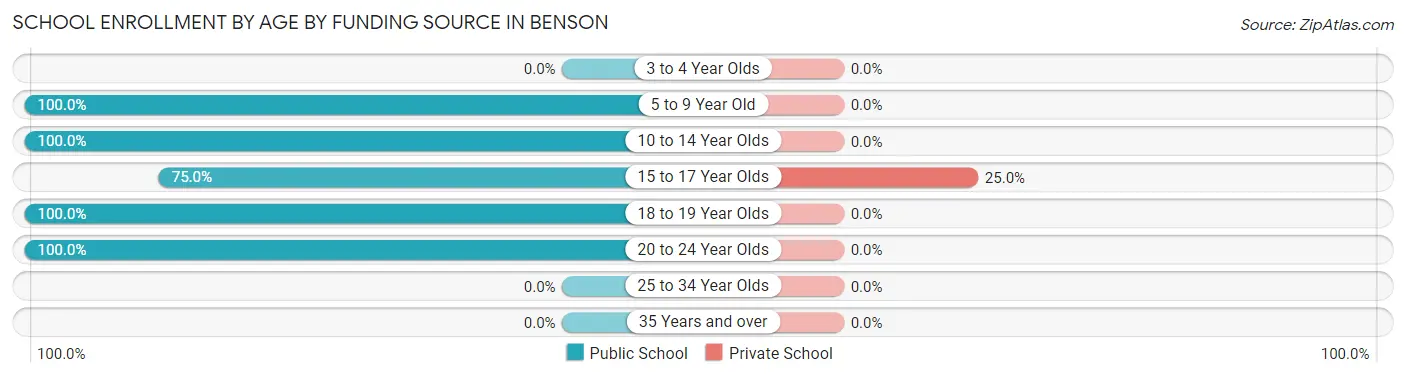
| Age Bracket | Public School | Private School |
| 3 to 4 Year Olds | 0 (0.0%) | 0 (0.0%) |
| 5 to 9 Year Old | 27 (100.0%) | 0 (0.0%) |
| 10 to 14 Year Olds | 7 (100.0%) | 0 (0.0%) |
| 15 to 17 Year Olds | 6 (75.0%) | 2 (25.0%) |
| 18 to 19 Year Olds | 3 (100.0%) | 0 (0.0%) |
| 20 to 24 Year Olds | 7 (100.0%) | 0 (0.0%) |
| 25 to 34 Year Olds | 0 (0.0%) | 0 (0.0%) |
| 35 Years and over | 0 (0.0%) | 0 (0.0%) |
| Total | 50 (96.2%) | 2 (3.8%) |
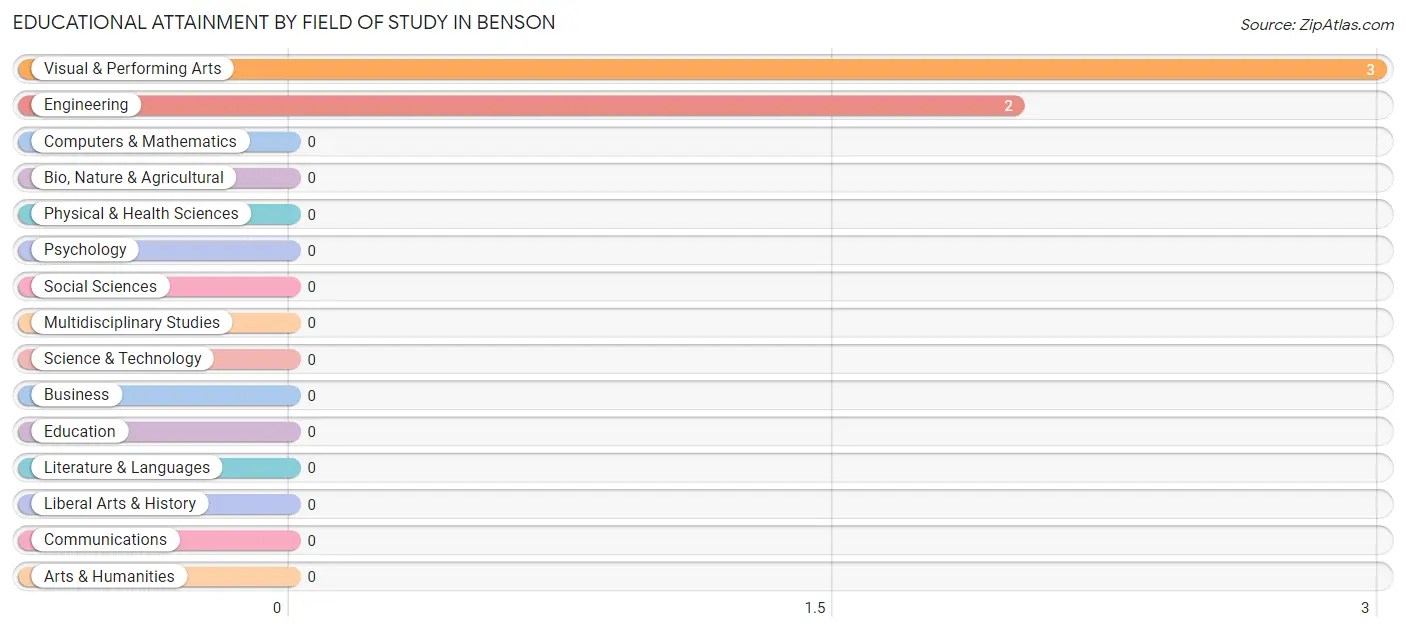
Educational Attainment by Field of Study in Benson
Visual & performing arts (3 | 60.0%), and engineering (2 | 40.0%) are the most common fields of study among 5 individuals in Benson who have obtained a bachelor's degree or higher.
| Field of Study | # Graduates | % Graduates |
| Computers & Mathematics | 0 | 0.0% |
| Bio, Nature & Agricultural | 0 | 0.0% |
| Physical & Health Sciences | 0 | 0.0% |
| Psychology | 0 | 0.0% |
| Social Sciences | 0 | 0.0% |
| Engineering | 2 | 40.0% |
| Multidisciplinary Studies | 0 | 0.0% |
| Science & Technology | 0 | 0.0% |
| Business | 0 | 0.0% |
| Education | 0 | 0.0% |
| Literature & Languages | 0 | 0.0% |
| Liberal Arts & History | 0 | 0.0% |
| Visual & Performing Arts | 3 | 60.0% |
| Communications | 0 | 0.0% |
| Arts & Humanities | 0 | 0.0% |
| Total | 5 | 100.0% |
Transportation & Commute in Benson
Vehicle Availability by Sex in Benson
The most prevalent vehicle ownership categories in Benson are males with 2 vehicles (9, accounting for 22.0%) and females with 2 vehicles (12, making up 19.2%).
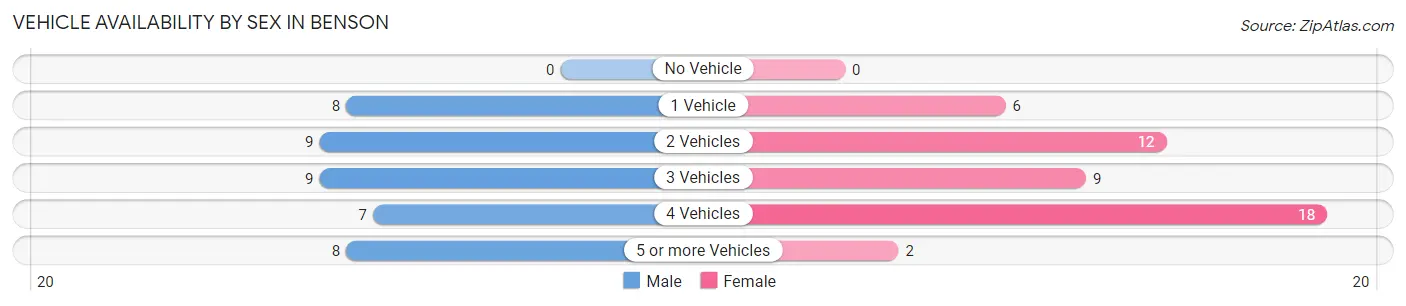
| Vehicles Available | Male | Female |
| No Vehicle | 0 (0.0%) | 0 (0.0%) |
| 1 Vehicle | 8 (19.5%) | 6 (12.8%) |
| 2 Vehicles | 9 (22.0%) | 12 (25.5%) |
| 3 Vehicles | 9 (22.0%) | 9 (19.2%) |
| 4 Vehicles | 7 (17.1%) | 18 (38.3%) |
| 5 or more Vehicles | 8 (19.5%) | 2 (4.3%) |
| Total | 41 (100.0%) | 47 (100.0%) |
Commute Time in Benson
The most frequently occuring commute durations in Benson are 30 to 34 minutes (31 commuters, 38.3%), 5 to 9 minutes (10 commuters, 12.3%), and less than 5 minutes (9 commuters, 11.1%).
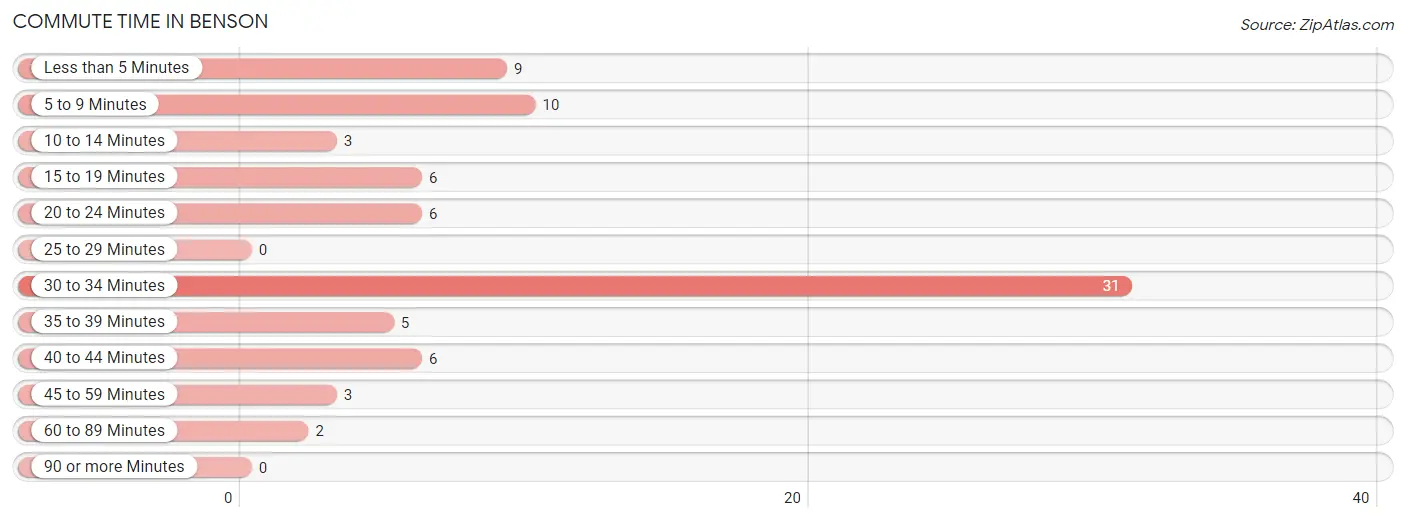
| Commute Time | # Commuters | % Commuters |
| Less than 5 Minutes | 9 | 11.1% |
| 5 to 9 Minutes | 10 | 12.3% |
| 10 to 14 Minutes | 3 | 3.7% |
| 15 to 19 Minutes | 6 | 7.4% |
| 20 to 24 Minutes | 6 | 7.4% |
| 25 to 29 Minutes | 0 | 0.0% |
| 30 to 34 Minutes | 31 | 38.3% |
| 35 to 39 Minutes | 5 | 6.2% |
| 40 to 44 Minutes | 6 | 7.4% |
| 45 to 59 Minutes | 3 | 3.7% |
| 60 to 89 Minutes | 2 | 2.5% |
| 90 or more Minutes | 0 | 0.0% |
Commute Time by Sex in Benson
The most common commute times in Benson are 30 to 34 minutes (16 commuters, 43.2%) for males and 30 to 34 minutes (15 commuters, 34.1%) for females.
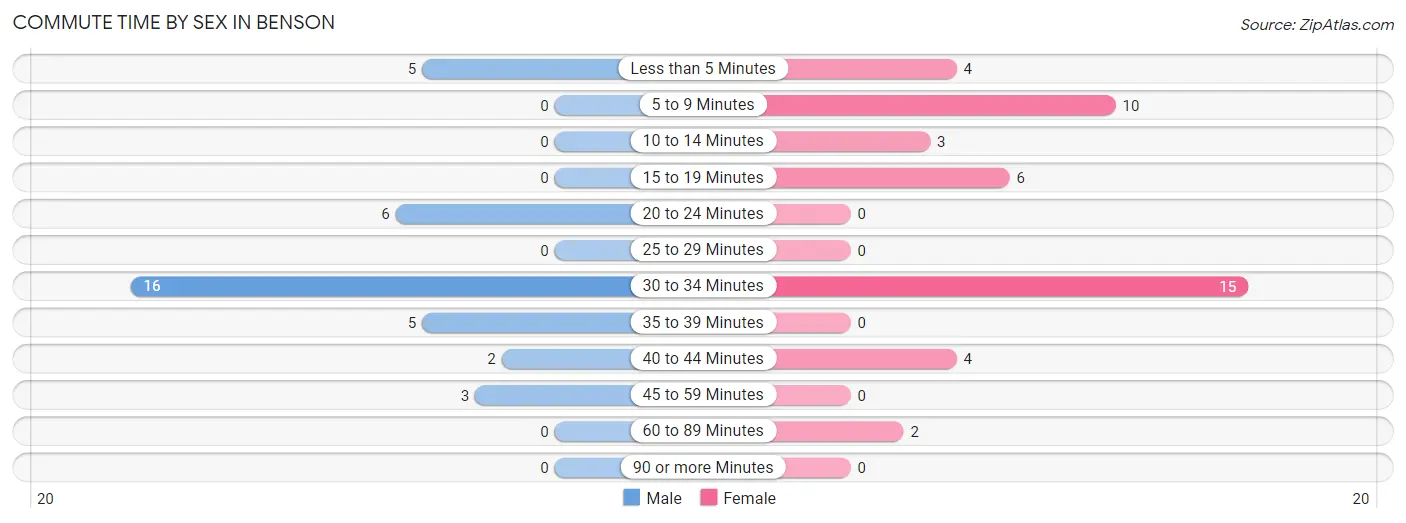
| Commute Time | Male | Female |
| Less than 5 Minutes | 5 (13.5%) | 4 (9.1%) |
| 5 to 9 Minutes | 0 (0.0%) | 10 (22.7%) |
| 10 to 14 Minutes | 0 (0.0%) | 3 (6.8%) |
| 15 to 19 Minutes | 0 (0.0%) | 6 (13.6%) |
| 20 to 24 Minutes | 6 (16.2%) | 0 (0.0%) |
| 25 to 29 Minutes | 0 (0.0%) | 0 (0.0%) |
| 30 to 34 Minutes | 16 (43.2%) | 15 (34.1%) |
| 35 to 39 Minutes | 5 (13.5%) | 0 (0.0%) |
| 40 to 44 Minutes | 2 (5.4%) | 4 (9.1%) |
| 45 to 59 Minutes | 3 (8.1%) | 0 (0.0%) |
| 60 to 89 Minutes | 0 (0.0%) | 2 (4.5%) |
| 90 or more Minutes | 0 (0.0%) | 0 (0.0%) |
Time of Departure to Work by Sex in Benson
The most frequent times of departure to work in Benson are 6:30 AM to 6:59 AM (12, 32.4%) for males and 12:00 PM to 3:59 PM (9, 20.4%) for females.
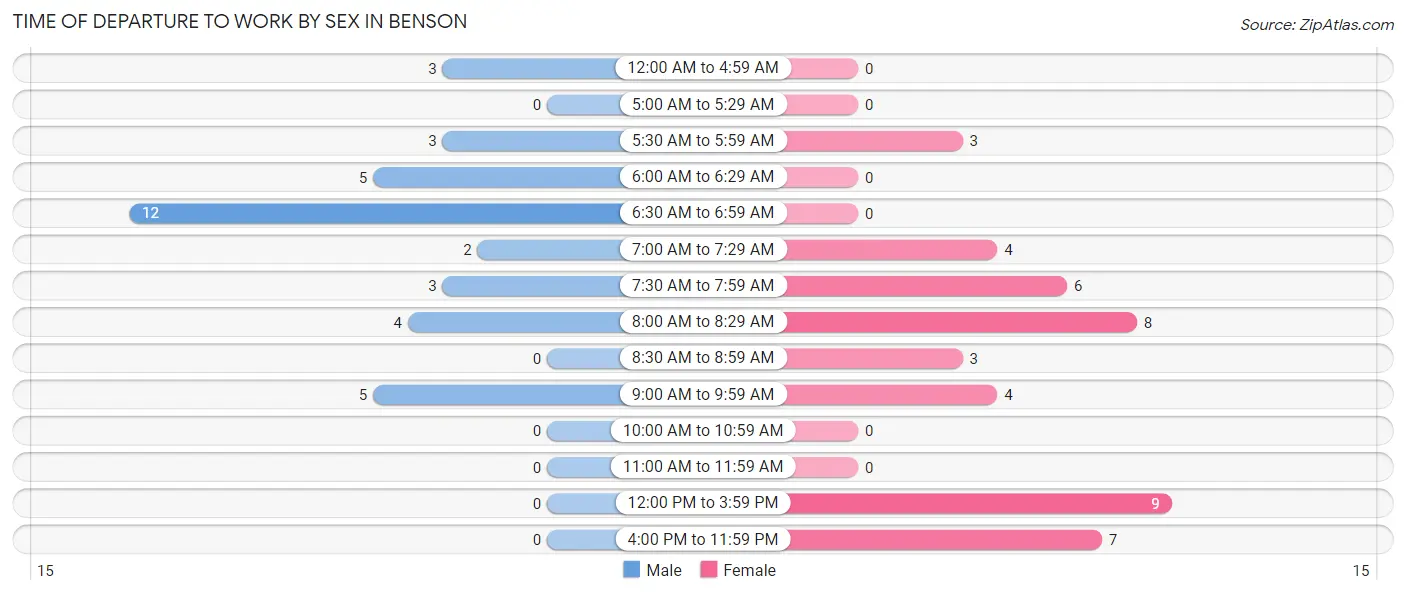
| Time of Departure | Male | Female |
| 12:00 AM to 4:59 AM | 3 (8.1%) | 0 (0.0%) |
| 5:00 AM to 5:29 AM | 0 (0.0%) | 0 (0.0%) |
| 5:30 AM to 5:59 AM | 3 (8.1%) | 3 (6.8%) |
| 6:00 AM to 6:29 AM | 5 (13.5%) | 0 (0.0%) |
| 6:30 AM to 6:59 AM | 12 (32.4%) | 0 (0.0%) |
| 7:00 AM to 7:29 AM | 2 (5.4%) | 4 (9.1%) |
| 7:30 AM to 7:59 AM | 3 (8.1%) | 6 (13.6%) |
| 8:00 AM to 8:29 AM | 4 (10.8%) | 8 (18.2%) |
| 8:30 AM to 8:59 AM | 0 (0.0%) | 3 (6.8%) |
| 9:00 AM to 9:59 AM | 5 (13.5%) | 4 (9.1%) |
| 10:00 AM to 10:59 AM | 0 (0.0%) | 0 (0.0%) |
| 11:00 AM to 11:59 AM | 0 (0.0%) | 0 (0.0%) |
| 12:00 PM to 3:59 PM | 0 (0.0%) | 9 (20.4%) |
| 4:00 PM to 11:59 PM | 0 (0.0%) | 7 (15.9%) |
| Total | 37 (100.0%) | 44 (100.0%) |
Housing Occupancy in Benson
Occupancy by Ownership in Benson
Of the total 101 dwellings in Benson, owner-occupied units account for 64 (63.4%), while renter-occupied units make up 37 (36.6%).
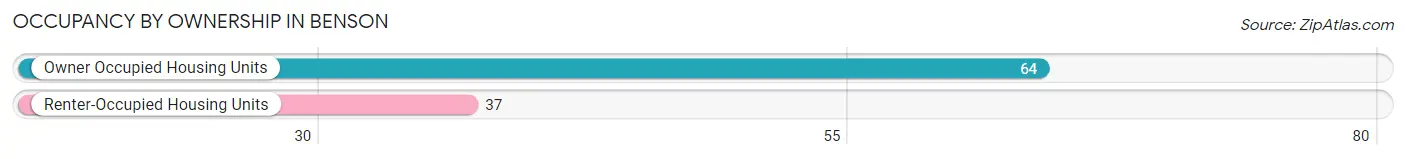
| Occupancy | # Housing Units | % Housing Units |
| Owner Occupied Housing Units | 64 | 63.4% |
| Renter-Occupied Housing Units | 37 | 36.6% |
| Total Occupied Housing Units | 101 | 100.0% |
Occupancy by Household Size in Benson
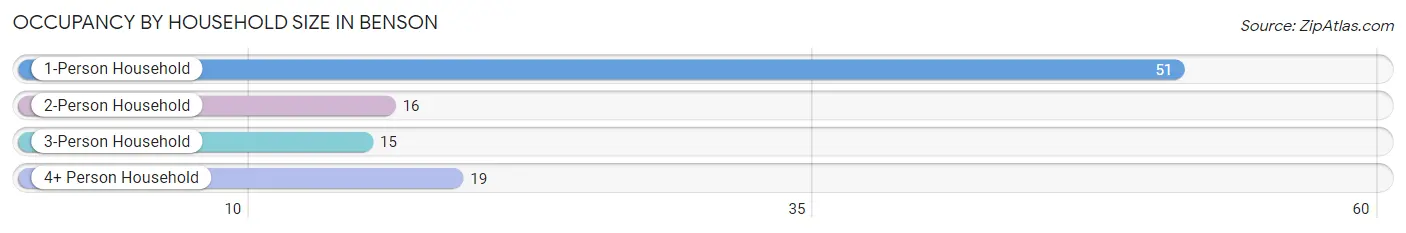
| Household Size | # Housing Units | % Housing Units |
| 1-Person Household | 51 | 50.5% |
| 2-Person Household | 16 | 15.8% |
| 3-Person Household | 15 | 14.8% |
| 4+ Person Household | 19 | 18.8% |
| Total Housing Units | 101 | 100.0% |
Occupancy by Ownership by Household Size in Benson
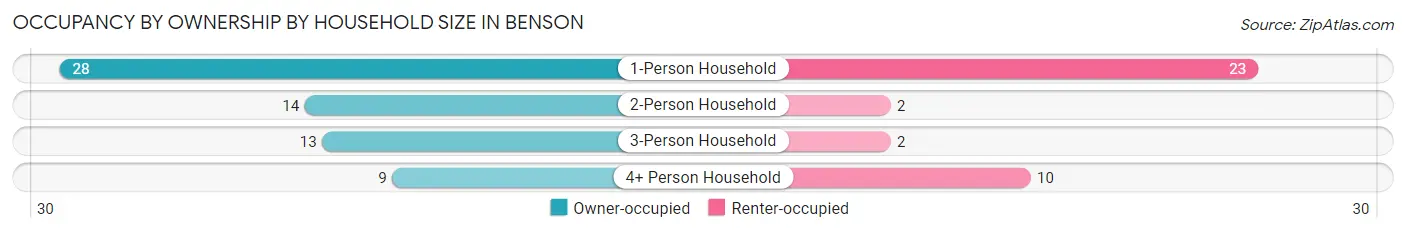
| Household Size | Owner-occupied | Renter-occupied |
| 1-Person Household | 28 (54.9%) | 23 (45.1%) |
| 2-Person Household | 14 (87.5%) | 2 (12.5%) |
| 3-Person Household | 13 (86.7%) | 2 (13.3%) |
| 4+ Person Household | 9 (47.4%) | 10 (52.6%) |
| Total Housing Units | 64 (63.4%) | 37 (36.6%) |
Occupancy by Educational Attainment in Benson
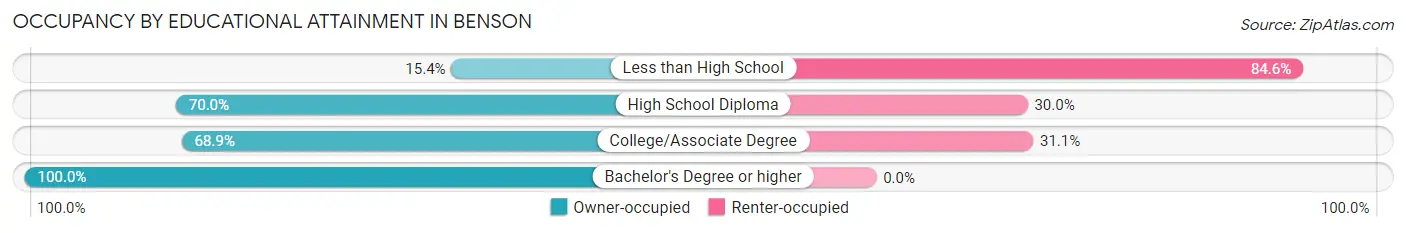
| Household Size | Owner-occupied | Renter-occupied |
| Less than High School | 2 (15.4%) | 11 (84.6%) |
| High School Diploma | 28 (70.0%) | 12 (30.0%) |
| College/Associate Degree | 31 (68.9%) | 14 (31.1%) |
| Bachelor's Degree or higher | 3 (100.0%) | 0 (0.0%) |
Occupancy by Age of Householder in Benson
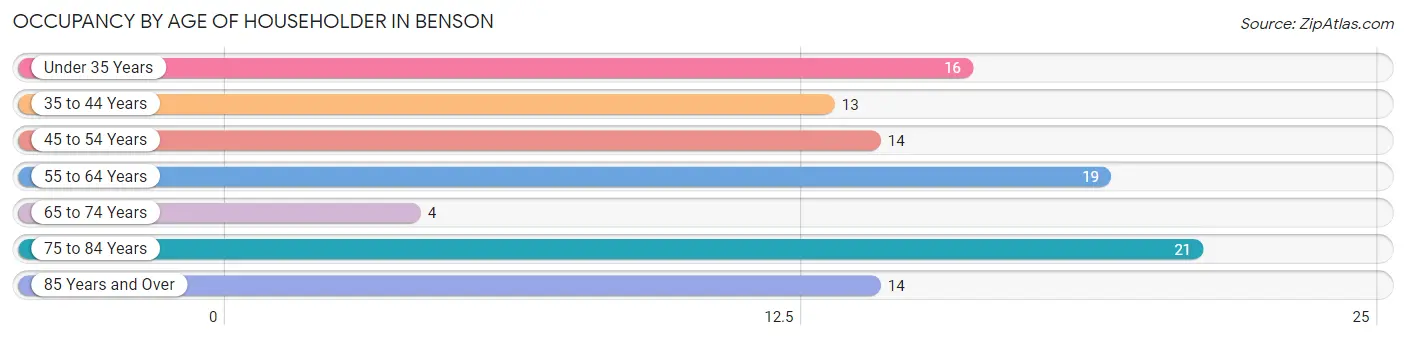
| Age Bracket | # Households | % Households |
| Under 35 Years | 16 | 15.8% |
| 35 to 44 Years | 13 | 12.9% |
| 45 to 54 Years | 14 | 13.9% |
| 55 to 64 Years | 19 | 18.8% |
| 65 to 74 Years | 4 | 4.0% |
| 75 to 84 Years | 21 | 20.8% |
| 85 Years and Over | 14 | 13.9% |
| Total | 101 | 100.0% |
Housing Finances in Benson
Median Income by Occupancy in Benson
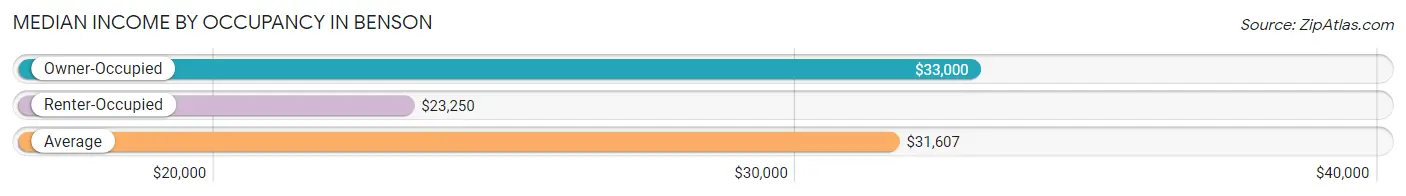
| Occupancy Type | # Households | Median Income |
| Owner-Occupied | 64 (63.4%) | $33,000 |
| Renter-Occupied | 37 (36.6%) | $23,250 |
| Average | 101 (100.0%) | $31,607 |
Occupancy by Householder Income Bracket in Benson
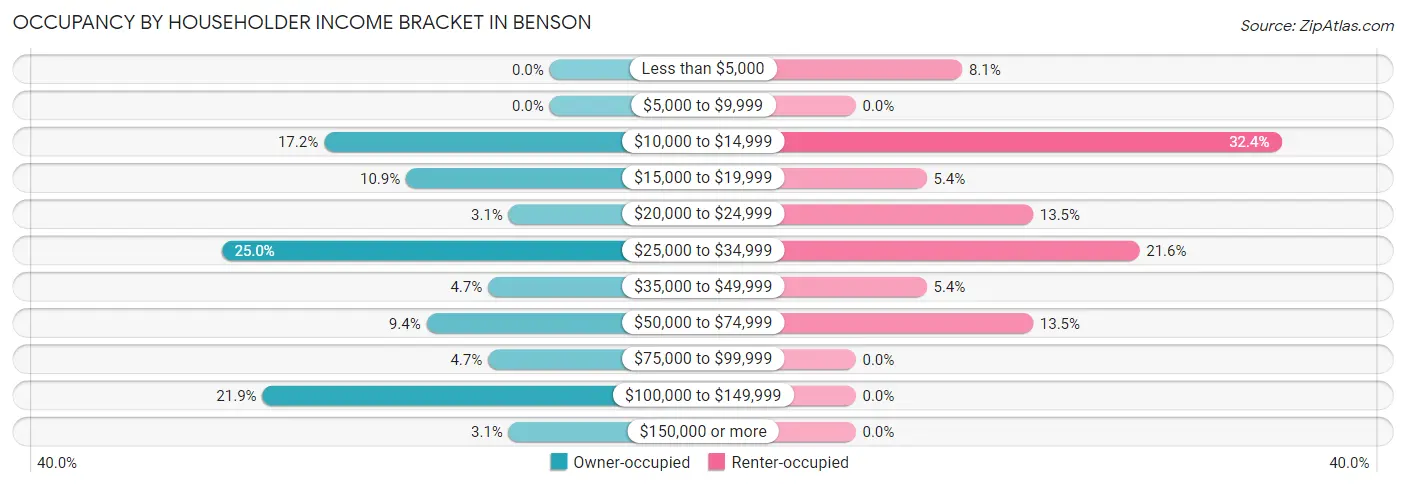
| Income Bracket | Owner-occupied | Renter-occupied |
| Less than $5,000 | 0 (0.0%) | 3 (8.1%) |
| $5,000 to $9,999 | 0 (0.0%) | 0 (0.0%) |
| $10,000 to $14,999 | 11 (17.2%) | 12 (32.4%) |
| $15,000 to $19,999 | 7 (10.9%) | 2 (5.4%) |
| $20,000 to $24,999 | 2 (3.1%) | 5 (13.5%) |
| $25,000 to $34,999 | 16 (25.0%) | 8 (21.6%) |
| $35,000 to $49,999 | 3 (4.7%) | 2 (5.4%) |
| $50,000 to $74,999 | 6 (9.4%) | 5 (13.5%) |
| $75,000 to $99,999 | 3 (4.7%) | 0 (0.0%) |
| $100,000 to $149,999 | 14 (21.9%) | 0 (0.0%) |
| $150,000 or more | 2 (3.1%) | 0 (0.0%) |
| Total | 64 (100.0%) | 37 (100.0%) |
Monthly Housing Cost Tiers in Benson
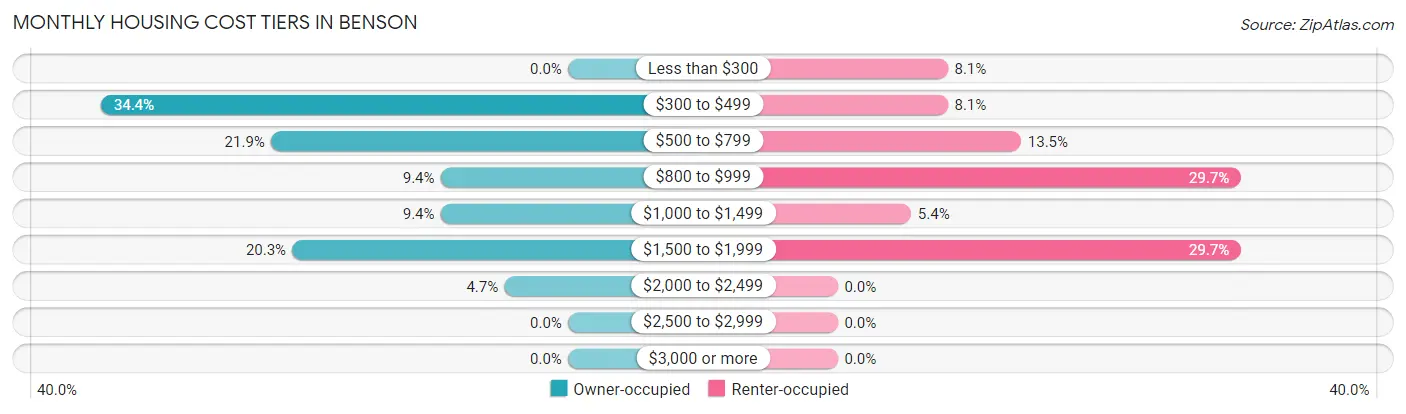
| Monthly Cost | Owner-occupied | Renter-occupied |
| Less than $300 | 0 (0.0%) | 3 (8.1%) |
| $300 to $499 | 22 (34.4%) | 3 (8.1%) |
| $500 to $799 | 14 (21.9%) | 5 (13.5%) |
| $800 to $999 | 6 (9.4%) | 11 (29.7%) |
| $1,000 to $1,499 | 6 (9.4%) | 2 (5.4%) |
| $1,500 to $1,999 | 13 (20.3%) | 11 (29.7%) |
| $2,000 to $2,499 | 3 (4.7%) | 0 (0.0%) |
| $2,500 to $2,999 | 0 (0.0%) | 0 (0.0%) |
| $3,000 or more | 0 (0.0%) | 0 (0.0%) |
| Total | 64 (100.0%) | 37 (100.0%) |
Physical Housing Characteristics in Benson
Housing Structures in Benson
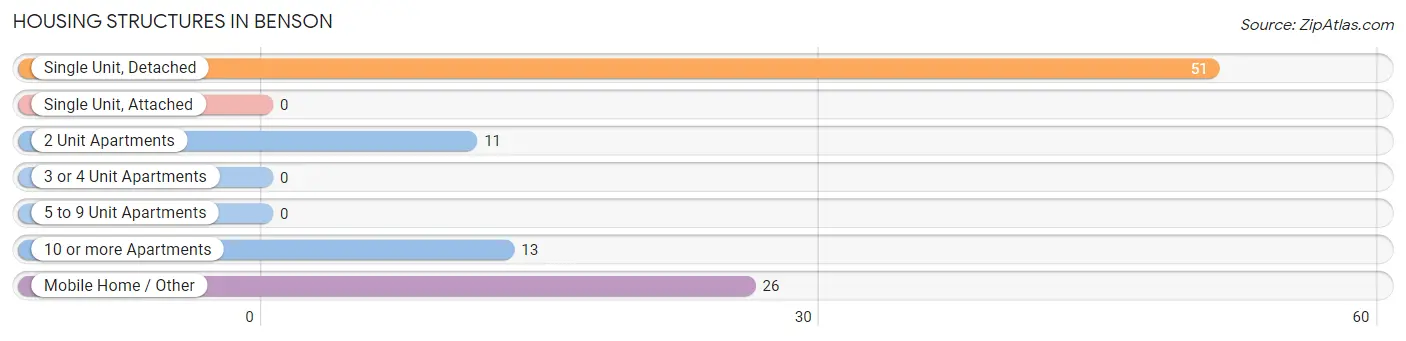
| Structure Type | # Housing Units | % Housing Units |
| Single Unit, Detached | 51 | 50.5% |
| Single Unit, Attached | 0 | 0.0% |
| 2 Unit Apartments | 11 | 10.9% |
| 3 or 4 Unit Apartments | 0 | 0.0% |
| 5 to 9 Unit Apartments | 0 | 0.0% |
| 10 or more Apartments | 13 | 12.9% |
| Mobile Home / Other | 26 | 25.7% |
| Total | 101 | 100.0% |
Housing Structures by Occupancy in Benson
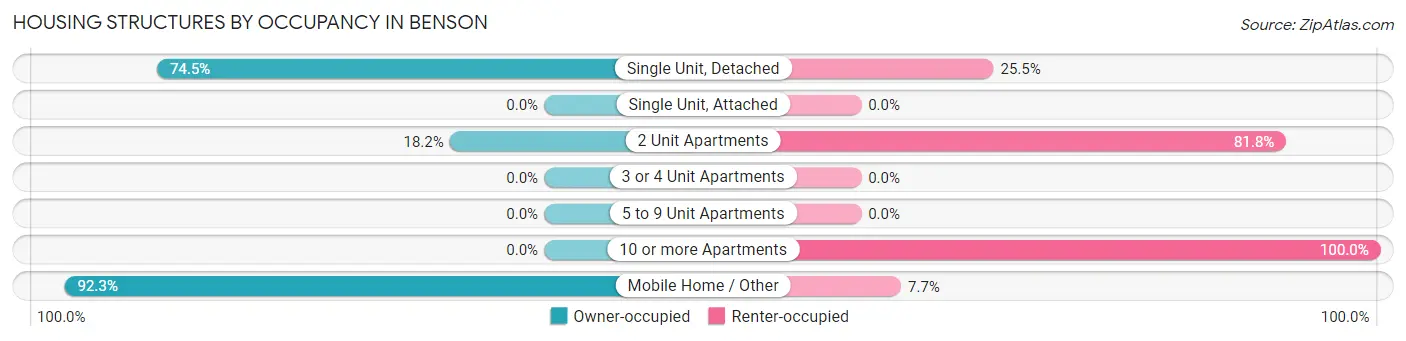
| Structure Type | Owner-occupied | Renter-occupied |
| Single Unit, Detached | 38 (74.5%) | 13 (25.5%) |
| Single Unit, Attached | 0 (0.0%) | 0 (0.0%) |
| 2 Unit Apartments | 2 (18.2%) | 9 (81.8%) |
| 3 or 4 Unit Apartments | 0 (0.0%) | 0 (0.0%) |
| 5 to 9 Unit Apartments | 0 (0.0%) | 0 (0.0%) |
| 10 or more Apartments | 0 (0.0%) | 13 (100.0%) |
| Mobile Home / Other | 24 (92.3%) | 2 (7.7%) |
| Total | 64 (63.4%) | 37 (36.6%) |
Housing Structures by Number of Rooms in Benson
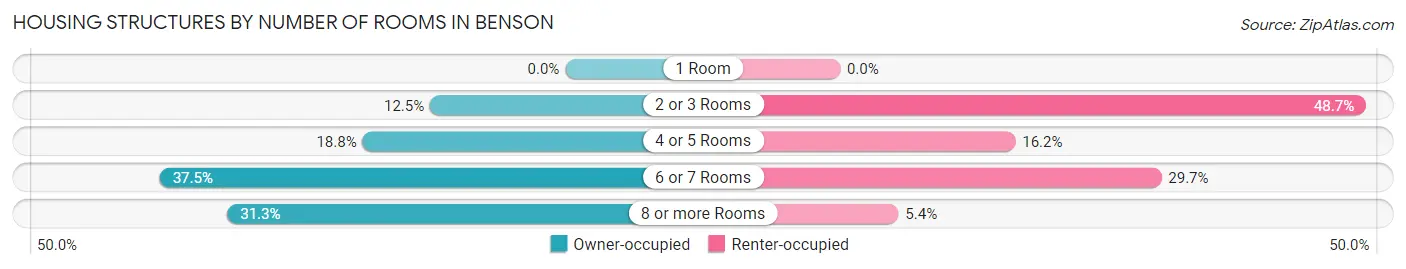
| Number of Rooms | Owner-occupied | Renter-occupied |
| 1 Room | 0 (0.0%) | 0 (0.0%) |
| 2 or 3 Rooms | 8 (12.5%) | 18 (48.6%) |
| 4 or 5 Rooms | 12 (18.8%) | 6 (16.2%) |
| 6 or 7 Rooms | 24 (37.5%) | 11 (29.7%) |
| 8 or more Rooms | 20 (31.2%) | 2 (5.4%) |
| Total | 64 (100.0%) | 37 (100.0%) |
Housing Structure by Heating Type in Benson
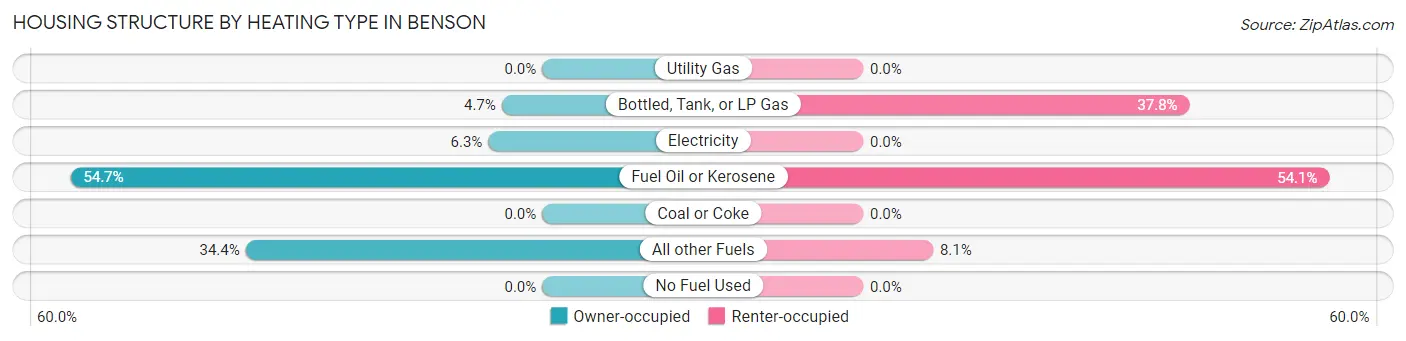
| Heating Type | Owner-occupied | Renter-occupied |
| Utility Gas | 0 (0.0%) | 0 (0.0%) |
| Bottled, Tank, or LP Gas | 3 (4.7%) | 14 (37.8%) |
| Electricity | 4 (6.2%) | 0 (0.0%) |
| Fuel Oil or Kerosene | 35 (54.7%) | 20 (54.0%) |
| Coal or Coke | 0 (0.0%) | 0 (0.0%) |
| All other Fuels | 22 (34.4%) | 3 (8.1%) |
| No Fuel Used | 0 (0.0%) | 0 (0.0%) |
| Total | 64 (100.0%) | 37 (100.0%) |
Household Vehicle Usage in Benson
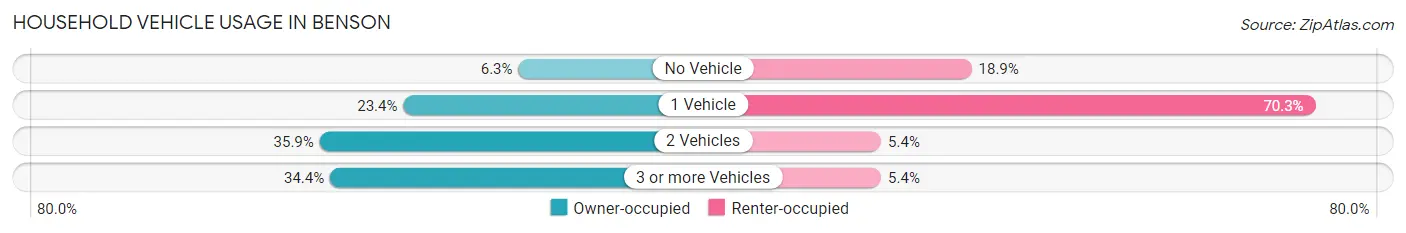
| Vehicles per Household | Owner-occupied | Renter-occupied |
| No Vehicle | 4 (6.2%) | 7 (18.9%) |
| 1 Vehicle | 15 (23.4%) | 26 (70.3%) |
| 2 Vehicles | 23 (35.9%) | 2 (5.4%) |
| 3 or more Vehicles | 22 (34.4%) | 2 (5.4%) |
| Total | 64 (100.0%) | 37 (100.0%) |
Real Estate & Mortgages in Benson
Real Estate and Mortgage Overview in Benson
| Characteristic | Without Mortgage | With Mortgage |
| Housing Units | 40 | 24 |
| Median Property Value | $162,500 | $204,500 |
| Median Household Income | $25,000 | $2 |
| Monthly Housing Costs | $471 | $0 |
| Real Estate Taxes | - | - |
Property Value by Mortgage Status in Benson
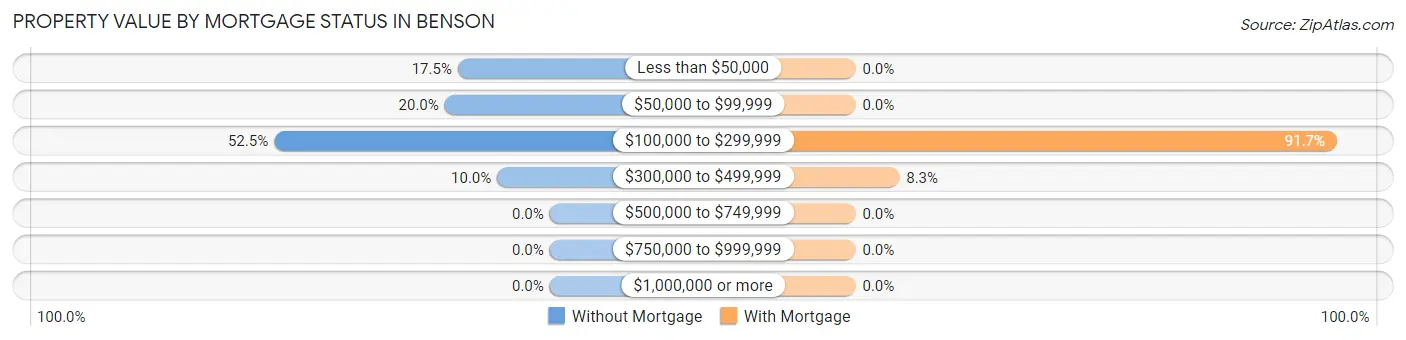
| Property Value | Without Mortgage | With Mortgage |
| Less than $50,000 | 7 (17.5%) | 0 (0.0%) |
| $50,000 to $99,999 | 8 (20.0%) | 0 (0.0%) |
| $100,000 to $299,999 | 21 (52.5%) | 22 (91.7%) |
| $300,000 to $499,999 | 4 (10.0%) | 2 (8.3%) |
| $500,000 to $749,999 | 0 (0.0%) | 0 (0.0%) |
| $750,000 to $999,999 | 0 (0.0%) | 0 (0.0%) |
| $1,000,000 or more | 0 (0.0%) | 0 (0.0%) |
| Total | 40 (100.0%) | 24 (100.0%) |
Household Income by Mortgage Status in Benson
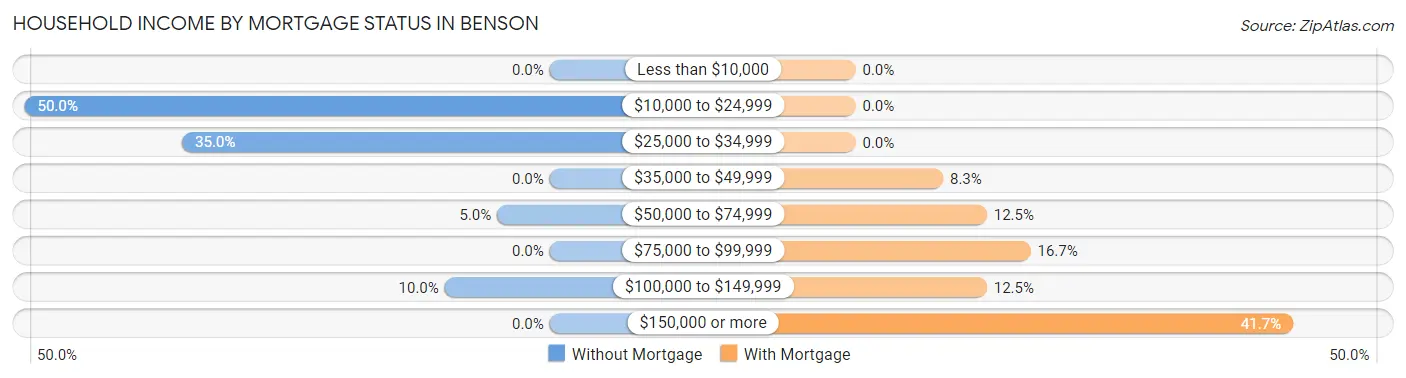
| Household Income | Without Mortgage | With Mortgage |
| Less than $10,000 | 0 (0.0%) | 0 (0.0%) |
| $10,000 to $24,999 | 20 (50.0%) | 0 (0.0%) |
| $25,000 to $34,999 | 14 (35.0%) | 0 (0.0%) |
| $35,000 to $49,999 | 0 (0.0%) | 2 (8.3%) |
| $50,000 to $74,999 | 2 (5.0%) | 3 (12.5%) |
| $75,000 to $99,999 | 0 (0.0%) | 4 (16.7%) |
| $100,000 to $149,999 | 4 (10.0%) | 3 (12.5%) |
| $150,000 or more | 0 (0.0%) | 10 (41.7%) |
| Total | 40 (100.0%) | 24 (100.0%) |
Property Value to Household Income Ratio in Benson
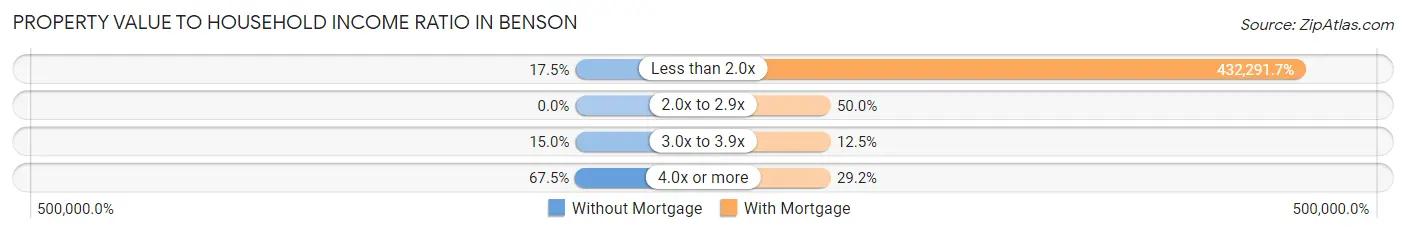
| Value-to-Income Ratio | Without Mortgage | With Mortgage |
| Less than 2.0x | 7 (17.5%) | 103,750 (432,291.7%) |
| 2.0x to 2.9x | 0 (0.0%) | 12 (50.0%) |
| 3.0x to 3.9x | 6 (15.0%) | 3 (12.5%) |
| 4.0x or more | 27 (67.5%) | 7 (29.2%) |
| Total | 40 (100.0%) | 24 (100.0%) |
Real Estate Taxes by Mortgage Status in Benson
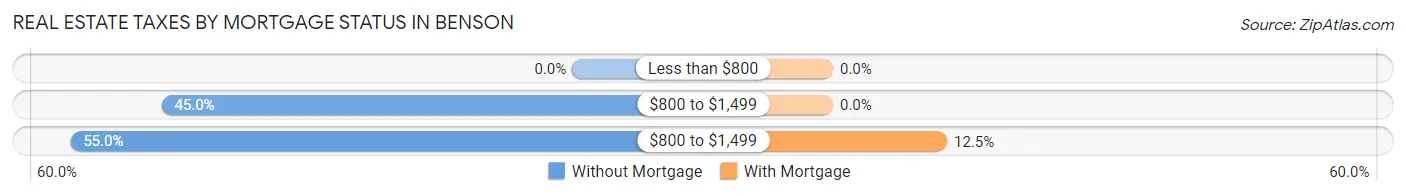
| Property Taxes | Without Mortgage | With Mortgage |
| Less than $800 | 0 (0.0%) | 0 (0.0%) |
| $800 to $1,499 | 18 (45.0%) | 0 (0.0%) |
| $800 to $1,499 | 22 (55.0%) | 3 (12.5%) |
| Total | 40 (100.0%) | 24 (100.0%) |
Health & Disability in Benson
Health Insurance Coverage by Age in Benson
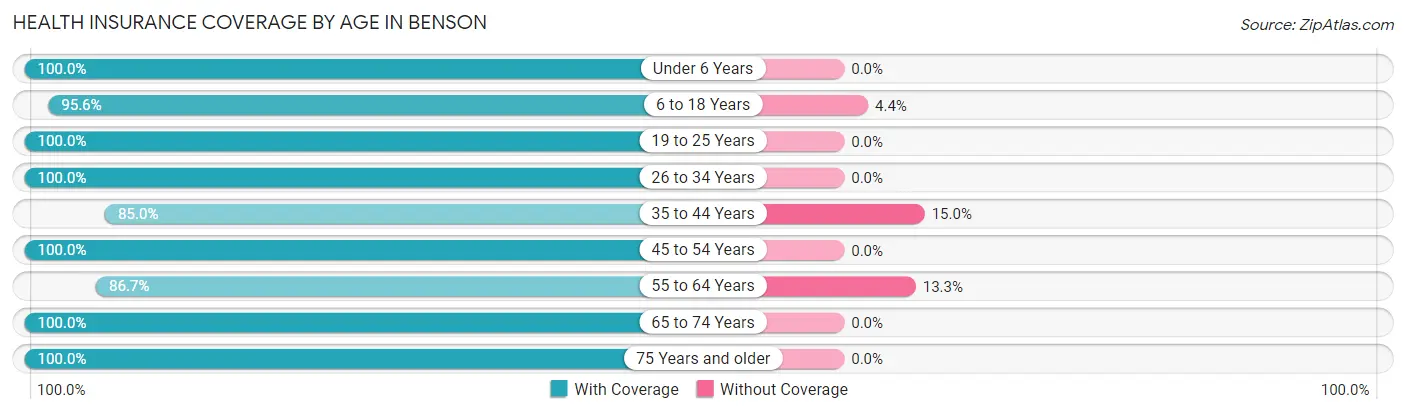
| Age Bracket | With Coverage | Without Coverage |
| Under 6 Years | 8 (100.0%) | 0 (0.0%) |
| 6 to 18 Years | 43 (95.6%) | 2 (4.4%) |
| 19 to 25 Years | 18 (100.0%) | 0 (0.0%) |
| 26 to 34 Years | 35 (100.0%) | 0 (0.0%) |
| 35 to 44 Years | 17 (85.0%) | 3 (15.0%) |
| 45 to 54 Years | 20 (100.0%) | 0 (0.0%) |
| 55 to 64 Years | 26 (86.7%) | 4 (13.3%) |
| 65 to 74 Years | 7 (100.0%) | 0 (0.0%) |
| 75 Years and older | 49 (100.0%) | 0 (0.0%) |
| Total | 223 (96.1%) | 9 (3.9%) |
Health Insurance Coverage by Citizenship Status in Benson
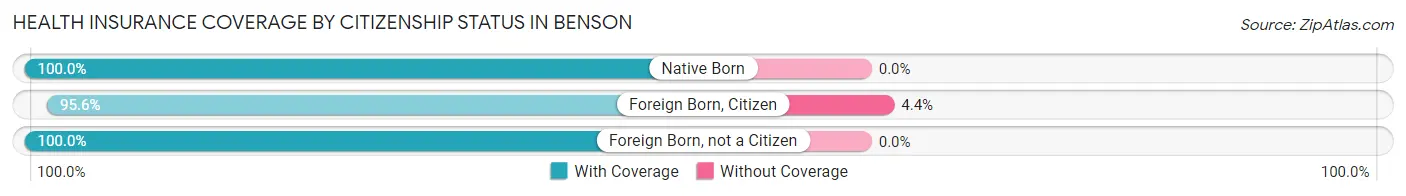
| Citizenship Status | With Coverage | Without Coverage |
| Native Born | 8 (100.0%) | 0 (0.0%) |
| Foreign Born, Citizen | 43 (95.6%) | 2 (4.4%) |
| Foreign Born, not a Citizen | 18 (100.0%) | 0 (0.0%) |
Health Insurance Coverage by Household Income in Benson
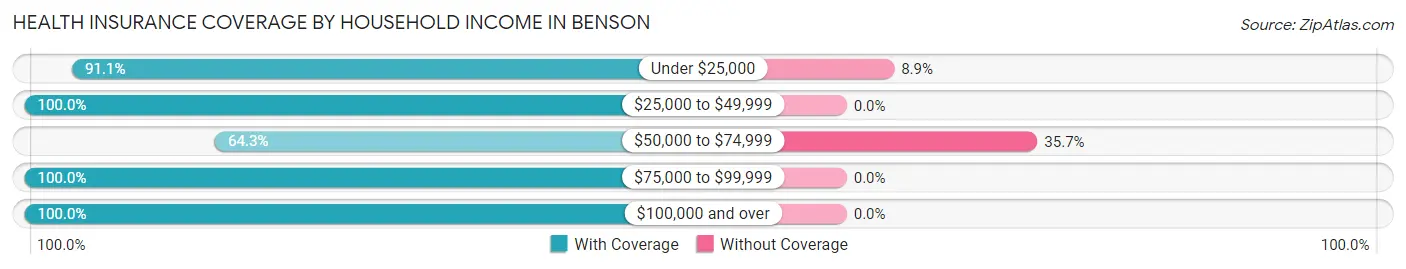
| Household Income | With Coverage | Without Coverage |
| Under $25,000 | 41 (91.1%) | 4 (8.9%) |
| $25,000 to $49,999 | 99 (100.0%) | 0 (0.0%) |
| $50,000 to $74,999 | 9 (64.3%) | 5 (35.7%) |
| $75,000 to $99,999 | 9 (100.0%) | 0 (0.0%) |
| $100,000 and over | 65 (100.0%) | 0 (0.0%) |
Public vs Private Health Insurance Coverage by Age in Benson
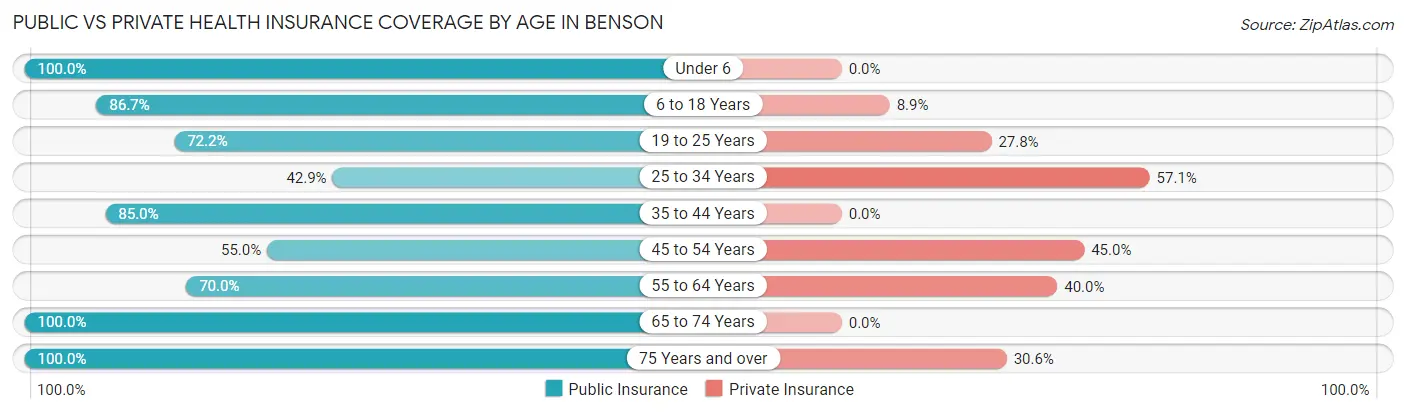
| Age Bracket | Public Insurance | Private Insurance |
| Under 6 | 8 (100.0%) | 0 (0.0%) |
| 6 to 18 Years | 39 (86.7%) | 4 (8.9%) |
| 19 to 25 Years | 13 (72.2%) | 5 (27.8%) |
| 25 to 34 Years | 15 (42.9%) | 20 (57.1%) |
| 35 to 44 Years | 17 (85.0%) | 0 (0.0%) |
| 45 to 54 Years | 11 (55.0%) | 9 (45.0%) |
| 55 to 64 Years | 21 (70.0%) | 12 (40.0%) |
| 65 to 74 Years | 7 (100.0%) | 0 (0.0%) |
| 75 Years and over | 49 (100.0%) | 15 (30.6%) |
| Total | 180 (77.6%) | 65 (28.0%) |
Disability Status by Sex by Age in Benson
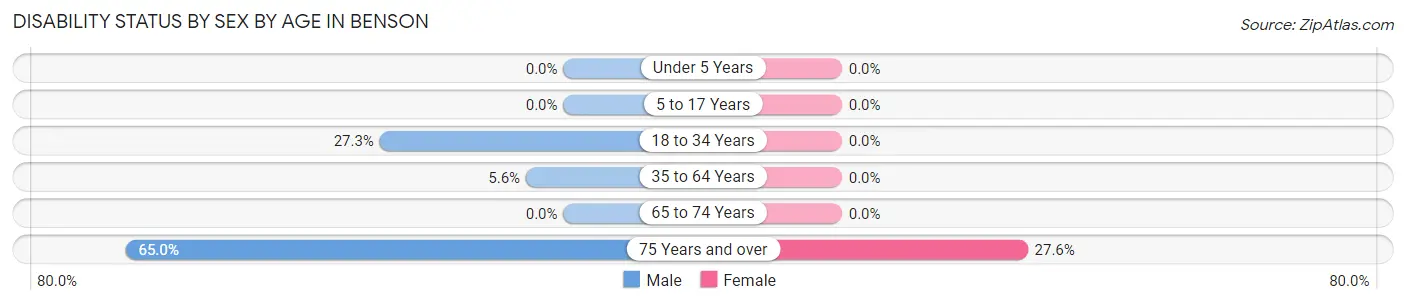
| Age Bracket | Male | Female |
| Under 5 Years | 0 (0.0%) | 0 (0.0%) |
| 5 to 17 Years | 0 (0.0%) | 0 (0.0%) |
| 18 to 34 Years | 6 (27.3%) | 0 (0.0%) |
| 35 to 64 Years | 2 (5.6%) | 0 (0.0%) |
| 65 to 74 Years | 0 (0.0%) | 0 (0.0%) |
| 75 Years and over | 13 (65.0%) | 8 (27.6%) |
Disability Class by Sex by Age in Benson
Disability Class: Hearing Difficulty
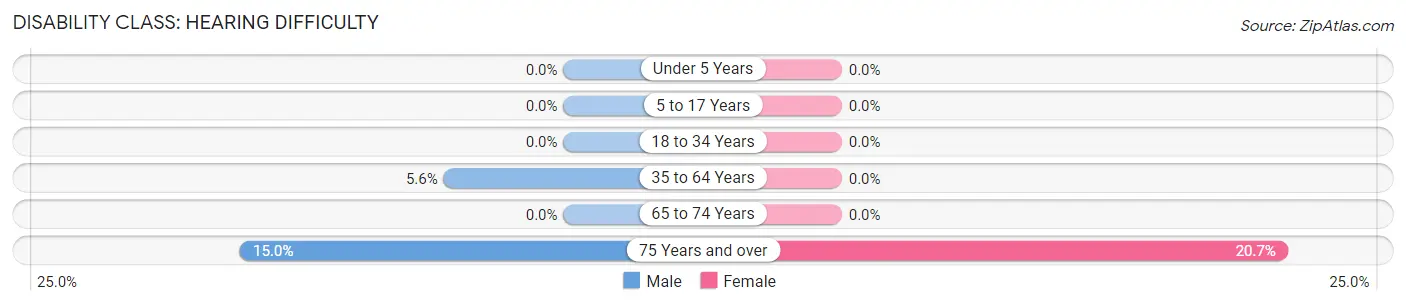
| Age Bracket | Male | Female |
| Under 5 Years | 0 (0.0%) | 0 (0.0%) |
| 5 to 17 Years | 0 (0.0%) | 0 (0.0%) |
| 18 to 34 Years | 0 (0.0%) | 0 (0.0%) |
| 35 to 64 Years | 2 (5.6%) | 0 (0.0%) |
| 65 to 74 Years | 0 (0.0%) | 0 (0.0%) |
| 75 Years and over | 3 (15.0%) | 6 (20.7%) |
Disability Class: Vision Difficulty
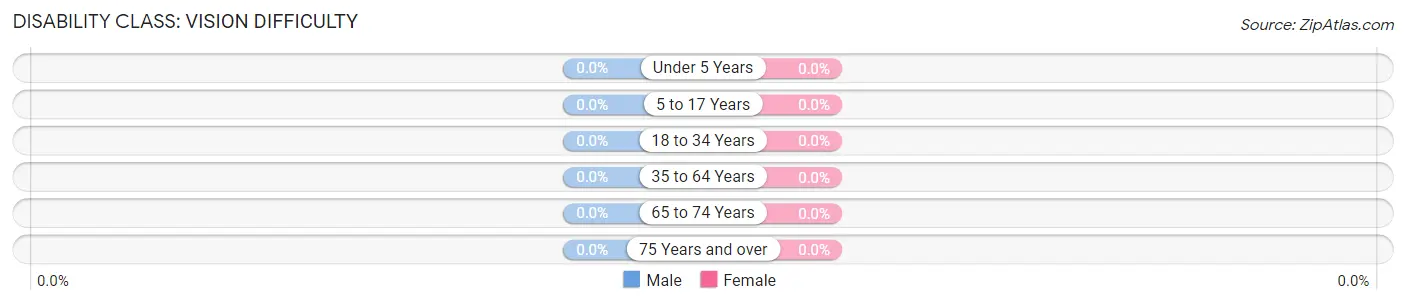
| Age Bracket | Male | Female |
| Under 5 Years | 0 (0.0%) | 0 (0.0%) |
| 5 to 17 Years | 0 (0.0%) | 0 (0.0%) |
| 18 to 34 Years | 0 (0.0%) | 0 (0.0%) |
| 35 to 64 Years | 0 (0.0%) | 0 (0.0%) |
| 65 to 74 Years | 0 (0.0%) | 0 (0.0%) |
| 75 Years and over | 0 (0.0%) | 0 (0.0%) |
Disability Class: Cognitive Difficulty
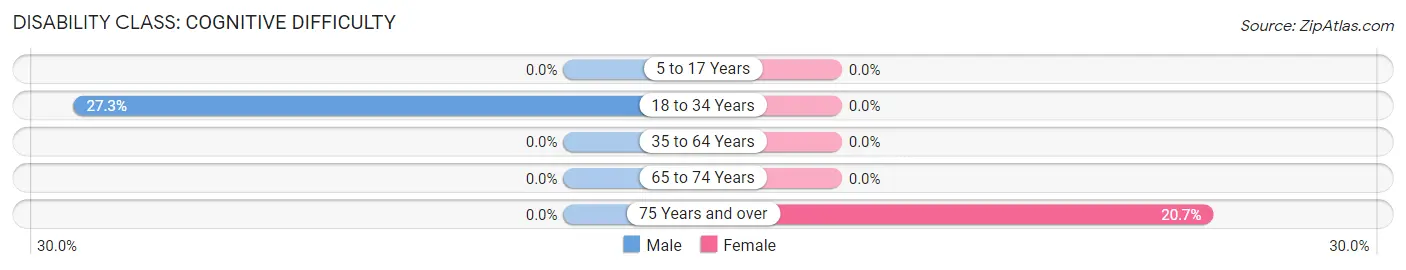
| Age Bracket | Male | Female |
| 5 to 17 Years | 0 (0.0%) | 0 (0.0%) |
| 18 to 34 Years | 6 (27.3%) | 0 (0.0%) |
| 35 to 64 Years | 0 (0.0%) | 0 (0.0%) |
| 65 to 74 Years | 0 (0.0%) | 0 (0.0%) |
| 75 Years and over | 0 (0.0%) | 6 (20.7%) |
Disability Class: Ambulatory Difficulty
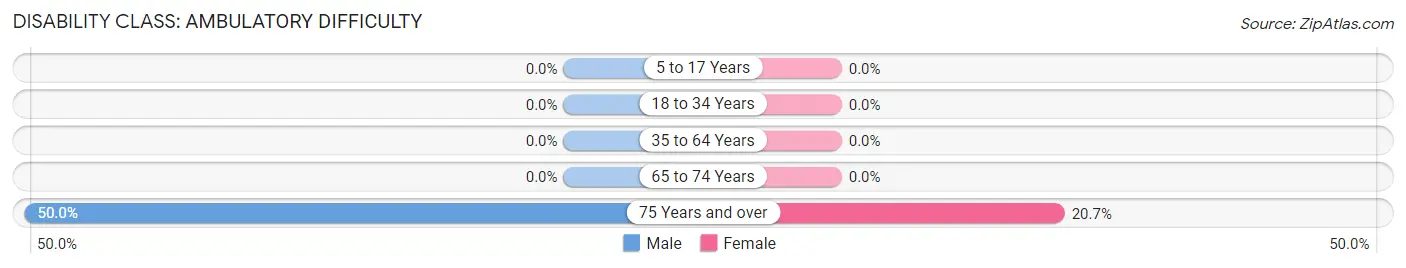
| Age Bracket | Male | Female |
| 5 to 17 Years | 0 (0.0%) | 0 (0.0%) |
| 18 to 34 Years | 0 (0.0%) | 0 (0.0%) |
| 35 to 64 Years | 0 (0.0%) | 0 (0.0%) |
| 65 to 74 Years | 0 (0.0%) | 0 (0.0%) |
| 75 Years and over | 10 (50.0%) | 6 (20.7%) |
Disability Class: Self-Care Difficulty
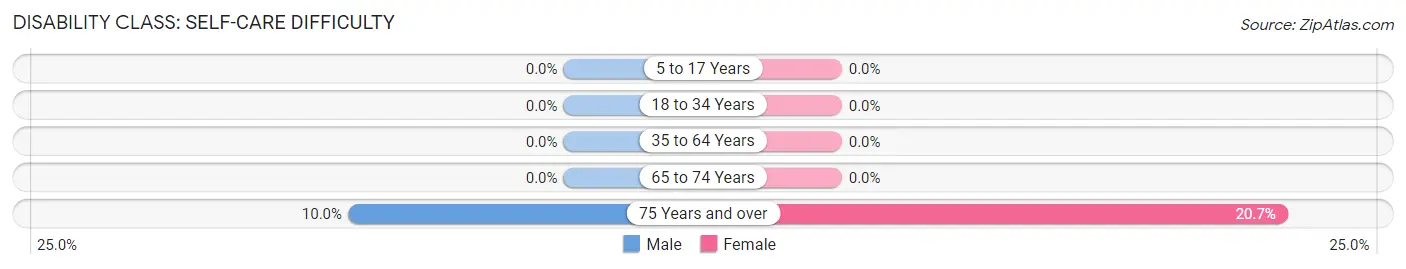
| Age Bracket | Male | Female |
| 5 to 17 Years | 0 (0.0%) | 0 (0.0%) |
| 18 to 34 Years | 0 (0.0%) | 0 (0.0%) |
| 35 to 64 Years | 0 (0.0%) | 0 (0.0%) |
| 65 to 74 Years | 0 (0.0%) | 0 (0.0%) |
| 75 Years and over | 2 (10.0%) | 6 (20.7%) |
Technology Access in Benson
Computing Device Access in Benson
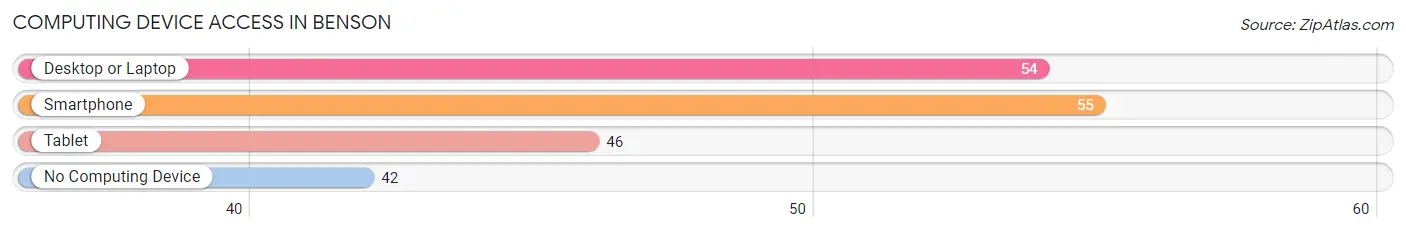
| Device Type | # Households | % Households |
| Desktop or Laptop | 54 | 53.5% |
| Smartphone | 55 | 54.5% |
| Tablet | 46 | 45.5% |
| No Computing Device | 42 | 41.6% |
| Total | 101 | 100.0% |
Internet Access in Benson
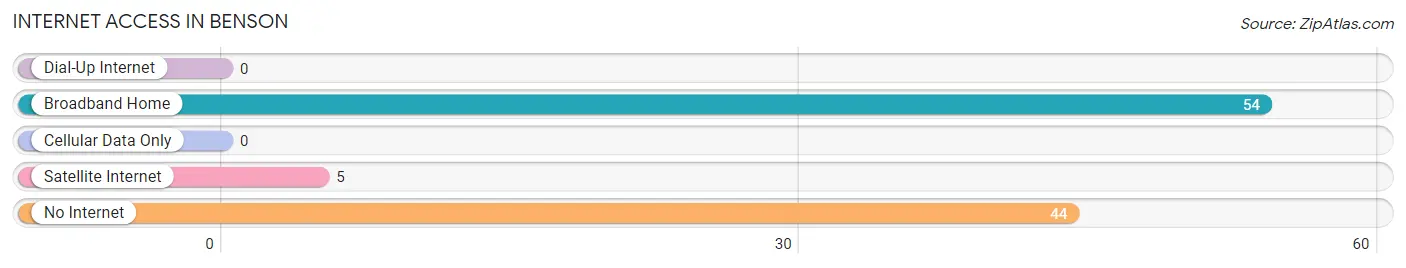
| Internet Type | # Households | % Households |
| Dial-Up Internet | 0 | 0.0% |
| Broadband Home | 54 | 53.5% |
| Cellular Data Only | 0 | 0.0% |
| Satellite Internet | 5 | 5.0% |
| No Internet | 44 | 43.6% |
| Total | 101 | 100.0% |
Benson Summary
Benson, Vermont is a small town located in Rutland County in the state of Vermont. It is situated in the Green Mountains and is bordered by the towns of Castleton, Fair Haven, and Sudbury. The town has a population of 1,717 people, according to the 2010 census.
History
Benson was first settled in 1780 by a group of settlers from Connecticut. The town was named after the first settler, John Benson. The town was incorporated in 1781 and was originally part of the town of Fair Haven. In 1810, Benson was separated from Fair Haven and became its own town.
Geography
Benson is located in the Green Mountains of Vermont. The town is bordered by the towns of Castleton, Fair Haven, and Sudbury. The town is situated on the western side of the Taconic Mountains and is located at an elevation of 1,400 feet. The town is located in the Taconic Valley and is surrounded by hills and mountains. The town is located near the headwaters of the Otter Creek and is home to several small lakes and ponds.
Economy
Benson is a small rural town with a population of 1,717 people. The town is primarily agricultural, with dairy farming being the main industry. The town is also home to several small businesses, including a sawmill, a general store, and a few restaurants. The town is also home to a few small manufacturing companies.
Demographics
According to the 2010 census, Benson has a population of 1,717 people. The town has a median household income of $45,000 and a median family income of $50,000. The town has a poverty rate of 11.3%, which is slightly higher than the state average of 10.3%. The town is predominantly white, with 95.3% of the population being white. The town also has a small Hispanic population, with 4.7% of the population being Hispanic.
Conclusion
Benson, Vermont is a small rural town located in the Green Mountains of Vermont. The town has a population of 1,717 people and is primarily agricultural, with dairy farming being the main industry. The town has a median household income of $45,000 and a poverty rate of 11.3%. The town is predominantly white, with 95.3% of the population being white. Benson is a small town with a rich history and a bright future.
Common Questions
What is the Total Population of Benson?
Total Population of Benson is 232.
What is the Total Male Population of Benson?
Total Male Population of Benson is 105.
What is the Total Female Population of Benson?
Total Female Population of Benson is 127.
What is the Ratio of Males per 100 Females in Benson?
There are 82.68 Males per 100 Females in Benson.
What is the Ratio of Females per 100 Males in Benson?
There are 120.95 Females per 100 Males in Benson.
What is the Median Population Age in Benson?
Median Population Age in Benson is 39.7 Years.
What is the Average Family Size in Benson
Average Family Size in Benson is 3.5 People.
What is the Average Household Size in Benson
Average Household Size in Benson is 2.3 People.
What is Per Capita Income in Benson?
Per Capita income in Benson is $21,944.
What is the Median Household income in Benson?
Median Household Income in Benson is $31,607.
What is Income or Wage Gap in Benson?
Income or Wage Gap in Benson is 63.8%.
Women in Benson earn 36.2 cents for every dollar earned by a man.
What is Inequality or Gini Index in Benson?
Inequality or Gini Index in Benson is 0.47.
How Large is the Labor Force in Benson?
There are 94 People in the Labor Forcein in Benson.
What is the Percentage of People in the Labor Force in Benson?
50.8% of People are in the Labor Force in Benson.
What is the Unemployment Rate in Benson?
Unemployment Rate in Benson is 6.4%.