Cuban vs Immigrants from Bosnia and Herzegovina 4 or more Vehicles in Household

COMPARE

Cuban
Race
Ancestry
AfghanAfricanAlaska NativeAlaskan AthabascanAlbanianAleutAlsatianAmericanApacheArabArapahoArgentineanArmenianAssyrian/Chaldean/SyriacAustralianAustrianBahamianBangladeshiBarbadianBasqueBelgianBelizeanBermudanBhutaneseBlackfeetBolivianBrazilianBritishBritish West IndianBulgarianBurmeseCajunCambodianCanadianCape VerdeanCarpatho RusynCelticCentral AmericanCentral American IndianCherokeeCheyenneChickasawChileanChineseChippewaChoctawColombianColvilleComancheCosta RicanCreeCreekCroatianCrowCubanCypriotCzechCzechoslovakianDanishDelawareDominicanDutchDutch West IndianEastern EuropeanEcuadorianEgyptianEnglishEstonianEthiopianEuropeanFijianFilipinoFinnishFrenchFrench American IndianFrench CanadianGermanGerman RussianGhanaianGreekGuamanian/ChamorroGuatemalanGuyaneseHaitianHmongHonduranHopiHoumaHungarianIcelanderIndian (Asian)IndonesianInupiatIranianIraqiIrishIroquoisIsraeliItalianJamaicanJapaneseJordanianKenyanKiowaKoreanLaotianLatvianLebaneseLiberianLithuanianLumbeeLuxembourgerMacedonianMalaysianMalteseMarshalleseMenomineeMexicanMexican American IndianMongolianMoroccanNative HawaiianNavajoNepaleseNew ZealanderNicaraguanNigerianNorthern EuropeanNorwegianOkinawanOsageOttawaPaiutePakistaniPalestinianPanamanianParaguayanPennsylvania GermanPeruvianPimaPolishPortuguesePotawatomiPuebloPuerto RicanPuget Sound SalishRomanianRussianSalvadoranSamoanScandinavianScotch-IrishScottishSeminoleSenegaleseSerbianShoshoneSierra LeoneanSiouxSlavicSlovakSloveneSomaliSouth AfricanSouth AmericanSouth American IndianSoviet UnionSpaniardSpanishSpanish AmericanSpanish American IndianSri LankanSubsaharan AfricanSudaneseSwedishSwissSyrianTaiwaneseThaiTlingit-HaidaTohono O'OdhamTonganTrinidadian and TobagonianTsimshianTurkishU.S. Virgin IslanderUgandanUkrainianUruguayanUteVenezuelanVietnameseWelshWest IndianYakamaYaquiYugoslavianYumanYup'ikZimbabwean
Immigration
NonimmigrantsImmigrantsAfghanistanAfricaAlbaniaArgentinaArmeniaAsiaAustraliaAustriaBahamasBangladeshBarbadosBelarusBelgiumBelizeBoliviaBrazilBulgariaBurma/MyanmarCabo VerdeCambodiaCameroonCanadaCaribbeanCentral AmericaChileChinaColombiaCongoCosta RicaCroatiaCubaCzechoslovakiaDenmarkDominicaDominican RepublicEastern AfricaEastern AsiaEastern EuropeEcuadorEgyptEl SalvadorEnglandEritreaEthiopiaEuropeFijiFranceGermanyGhanaGreeceGrenadaGuatemalaGuyanaHaitiHondurasHong KongHungaryIndiaIndonesiaIranIraqIrelandIsraelItalyJamaicaJapanJordanKazakhstanKenyaKoreaKuwaitLaosLatin AmericaLatviaLebanonLiberiaLithuaniaMalaysiaMexicoMicronesiaMiddle AfricaMoldovaMoroccoNepalNetherlandsNicaraguaNigeriaNorth AmericaNorth MacedoniaNorthern AfricaNorthern EuropeNorwayOceaniaPakistanPanamaPeruPhilippinesPolandPortugalRomaniaRussiaSaudi ArabiaScotlandSenegalSerbiaSierra LeoneSingaporeSomaliaSouth AfricaSouth AmericaSouth Central AsiaSouth Eastern AsiaSouthern EuropeSpainSri LankaSt. Vincent and the GrenadinesSudanSwedenSwitzerlandSyriaTaiwanThailandTrinidad and TobagoTurkeyUgandaUkraineUruguayUzbekistanVenezuelaVietnamWest IndiesWestern AfricaWestern AsiaWestern EuropeYemenZaireZimbabweAzores
Immigrants from Bosnia and Herzegovina
Race
Ancestry
AfghanAfricanAlaska NativeAlaskan AthabascanAlbanianAleutAlsatianAmericanApacheArabArapahoArgentineanArmenianAssyrian/Chaldean/SyriacAustralianAustrianBahamianBangladeshiBarbadianBasqueBelgianBelizeanBermudanBhutaneseBlackfeetBolivianBrazilianBritishBritish West IndianBulgarianBurmeseCajunCambodianCanadianCape VerdeanCarpatho RusynCelticCentral AmericanCentral American IndianCherokeeCheyenneChickasawChileanChineseChippewaChoctawColombianColvilleComancheCosta RicanCreeCreekCroatianCrowCypriotCzechCzechoslovakianDanishDelawareDominicanDutchDutch West IndianEastern EuropeanEcuadorianEgyptianEnglishEstonianEthiopianEuropeanFijianFilipinoFinnishFrenchFrench American IndianFrench CanadianGermanGerman RussianGhanaianGreekGuamanian/ChamorroGuatemalanGuyaneseHaitianHmongHonduranHopiHoumaHungarianIcelanderIndian (Asian)IndonesianInupiatIranianIraqiIrishIroquoisIsraeliItalianJamaicanJapaneseJordanianKenyanKiowaKoreanLaotianLatvianLebaneseLiberianLithuanianLumbeeLuxembourgerMacedonianMalaysianMalteseMarshalleseMenomineeMexicanMexican American IndianMongolianMoroccanNative HawaiianNavajoNepaleseNew ZealanderNicaraguanNigerianNorthern EuropeanNorwegianOkinawanOsageOttawaPaiutePakistaniPalestinianPanamanianParaguayanPennsylvania GermanPeruvianPimaPolishPortuguesePotawatomiPuebloPuerto RicanPuget Sound SalishRomanianRussianSalvadoranSamoanScandinavianScotch-IrishScottishSeminoleSenegaleseSerbianShoshoneSierra LeoneanSiouxSlavicSlovakSloveneSomaliSouth AfricanSouth AmericanSouth American IndianSoviet UnionSpaniardSpanishSpanish AmericanSpanish American IndianSri LankanSubsaharan AfricanSudaneseSwedishSwissSyrianTaiwaneseThaiTlingit-HaidaTohono O'OdhamTonganTrinidadian and TobagonianTsimshianTurkishU.S. Virgin IslanderUgandanUkrainianUruguayanUteVenezuelanVietnameseWelshWest IndianYakamaYaquiYugoslavianYumanYup'ikZimbabwean
Immigration
NonimmigrantsImmigrantsAfghanistanAfricaAlbaniaArgentinaArmeniaAsiaAustraliaAustriaBahamasBangladeshBarbadosBelarusBelgiumBelizeBoliviaBosnia and HerzegovinaBrazilBulgariaBurma/MyanmarCabo VerdeCambodiaCameroonCanadaCaribbeanCentral AmericaChileChinaColombiaCongoCosta RicaCroatiaCubaCzechoslovakiaDenmarkDominicaDominican RepublicEastern AfricaEastern AsiaEastern EuropeEcuadorEgyptEl SalvadorEnglandEritreaEthiopiaEuropeFijiFranceGermanyGhanaGreeceGrenadaGuatemalaGuyanaHaitiHondurasHong KongHungaryIndiaIndonesiaIranIraqIrelandIsraelItalyJamaicaJapanJordanKazakhstanKenyaKoreaKuwaitLaosLatin AmericaLatviaLebanonLiberiaLithuaniaMalaysiaMexicoMicronesiaMiddle AfricaMoldovaMoroccoNepalNetherlandsNicaraguaNigeriaNorth AmericaNorth MacedoniaNorthern AfricaNorthern EuropeNorwayOceaniaPakistanPanamaPeruPhilippinesPolandPortugalRomaniaRussiaSaudi ArabiaScotlandSenegalSerbiaSierra LeoneSingaporeSomaliaSouth AfricaSouth AmericaSouth Central AsiaSouth Eastern AsiaSouthern EuropeSpainSri LankaSt. Vincent and the GrenadinesSudanSwedenSwitzerlandSyriaTaiwanThailandTrinidad and TobagoTurkeyUgandaUkraineUruguayUzbekistanVenezuelaVietnamWest IndiesWestern AfricaWestern AsiaWestern EuropeYemenZaireZimbabweAzores
4 or more Vehicles in Household
Income
Poverty
Unemployment
Labor Participation
Family Structure
Vehicle Availability
Education Level
Disability

4 or more Vehicles in Household Comparison

Cubans

Immigrants from Bosnia and Herzegovina

Tragic
Tragic
6.0%
4 OR MORE VEHICLES IN HOUSEHOLD
9.2/ 100
METRIC RATING
224th/ 347
METRIC RANK
5.3%
4 OR MORE VEHICLES IN HOUSEHOLD
0.2/ 100
METRIC RATING
289th/ 347
METRIC RANK

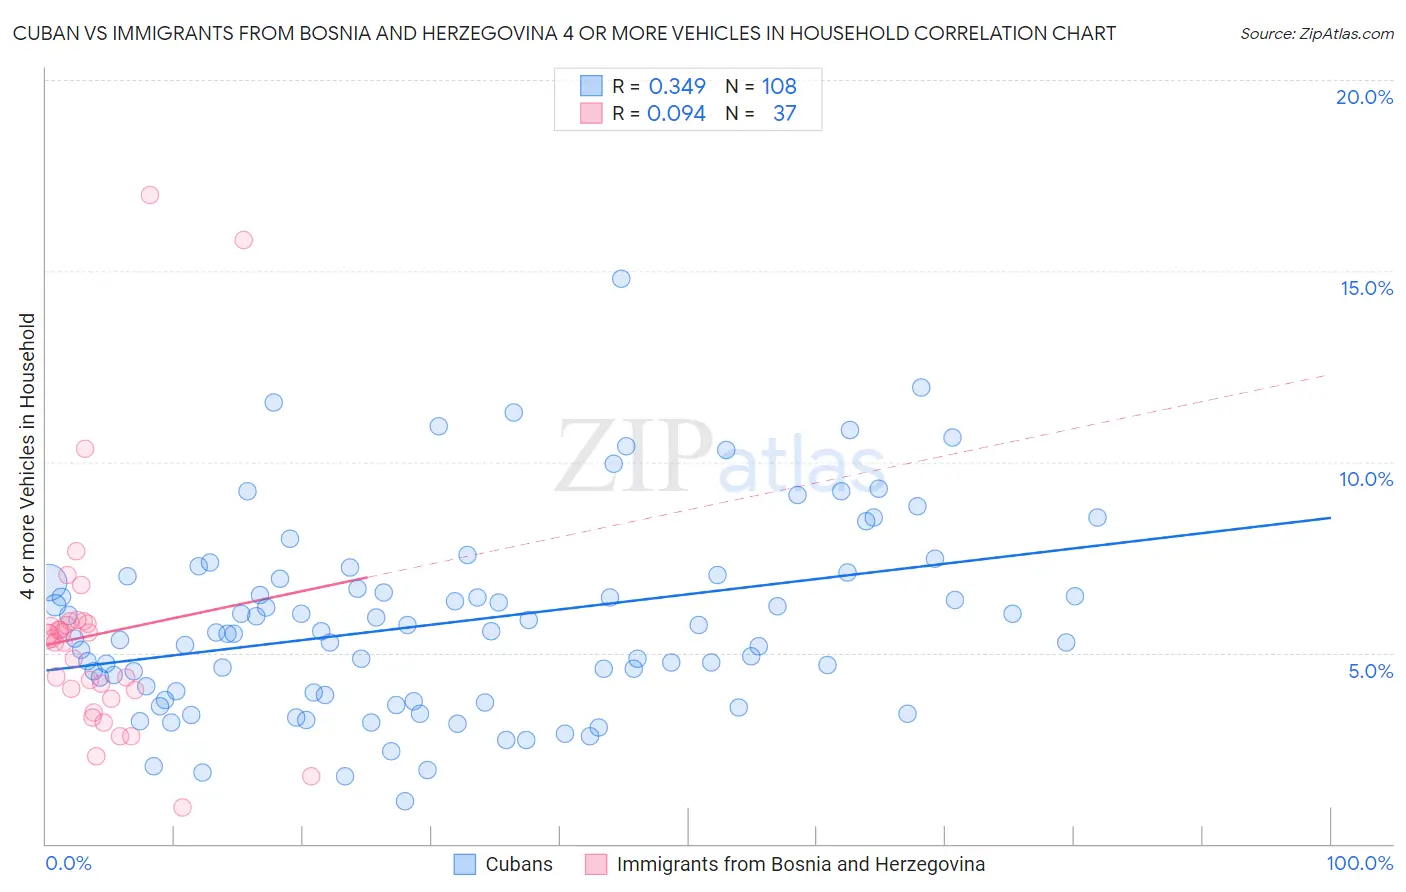
Cuban vs Immigrants from Bosnia and Herzegovina 4 or more Vehicles in Household Correlation Chart

The statistical analysis conducted on geographies consisting of 447,048,308 people shows a mild positive correlation between the proportion of Cubans and percentage of households with 4 or more vehicles available in the United States with a correlation coefficient (R) of 0.349 and weighted average of 6.0%. Similarly, the statistical analysis conducted on geographies consisting of 156,484,341 people shows a slight positive correlation between the proportion of Immigrants from Bosnia and Herzegovina and percentage of households with 4 or more vehicles available in the United States with a correlation coefficient (R) of 0.094 and weighted average of 5.3%, a difference of 11.7%.
Cuban vs Immigrants from Bosnia and Herzegovina 4 or more Vehicles in Household

4 or more Vehicles in Household Correlation Summary

MeasurementCubanImmigrants from Bosnia and Herzegovina
Minimum1.1%0.96%
Maximum14.8%17.0%
Range13.7%16.0%
Mean5.8%5.5%
Median5.5%5.4%
Interquartile 25% (IQ1)3.9%3.9%
Interquartile 75% (IQ3)7.0%5.8%
Interquartile Range (IQR)3.0%1.9%
Standard Deviation (Sample)2.5%3.2%
Standard Deviation (Population)2.5%3.1%

Similar Demographics by 4 or more Vehicles in Household

Demographics Similar to Cubans by 4 or more Vehicles in Household

In terms of 4 or more vehicles in household, the demographic groups most similar to Cubans are Cajun (6.0%, a difference of 0.010%), Immigrants from Kenya (6.0%, a difference of 0.010%), Immigrants from Moldova (6.0%, a difference of 0.050%), Indonesian (6.0%, a difference of 0.080%), and Russian (6.0%, a difference of 0.34%).
DemographicsRating | Rank4 or more Vehicles in Household
Nigerians
12.2
/100
|
#217
Poor
6.0%
Immigrants | Italy
11.0
/100
|
#218
Poor
6.0%
Serbians
11.0
/100
|
#219
Poor
6.0%
Russians
10.3
/100
|
#220
Poor
6.0%
Immigrants | Moldova
9.3
/100
|
#221
Tragic
6.0%
Cajuns
9.2
/100
|
#222
Tragic
6.0%
Immigrants | Kenya
9.2
/100
|
#223
Tragic
6.0%
Cubans
9.2
/100
|
#224
Tragic
6.0%
Indonesians
8.9
/100
|
#225
Tragic
6.0%
Immigrants | Singapore
7.9
/100
|
#226
Tragic
5.9%
Immigrants | Western Asia
7.8
/100
|
#227
Tragic
5.9%
Immigrants | Uganda
7.5
/100
|
#228
Tragic
5.9%
Eastern Europeans
6.8
/100
|
#229
Tragic
5.9%
Immigrants | Malaysia
6.7
/100
|
#230
Tragic
5.9%
Immigrants | Switzerland
6.4
/100
|
#231
Tragic
5.9%

Demographics Similar to Immigrants from Bosnia and Herzegovina by 4 or more Vehicles in Household

In terms of 4 or more vehicles in household, the demographic groups most similar to Immigrants from Bosnia and Herzegovina are Venezuelan (5.3%, a difference of 0.14%), Immigrants from Russia (5.3%, a difference of 0.30%), Immigrants from Croatia (5.4%, a difference of 0.33%), Immigrants from Colombia (5.4%, a difference of 0.42%), and Immigrants from Liberia (5.4%, a difference of 0.46%).
DemographicsRating | Rank4 or more Vehicles in Household
Immigrants | Spain
0.3
/100
|
#282
Tragic
5.4%
Immigrants | Ireland
0.3
/100
|
#283
Tragic
5.4%
Brazilians
0.3
/100
|
#284
Tragic
5.4%
Immigrants | Liberia
0.2
/100
|
#285
Tragic
5.4%
Immigrants | Colombia
0.2
/100
|
#286
Tragic
5.4%
Immigrants | Croatia
0.2
/100
|
#287
Tragic
5.4%
Venezuelans
0.2
/100
|
#288
Tragic
5.3%
Immigrants | Bosnia and Herzegovina
0.2
/100
|
#289
Tragic
5.3%
Immigrants | Russia
0.2
/100
|
#290
Tragic
5.3%
Immigrants | Bahamas
0.1
/100
|
#291
Tragic
5.3%
Liberians
0.1
/100
|
#292
Tragic
5.3%
Immigrants | Congo
0.1
/100
|
#293
Tragic
5.2%
Ghanaians
0.1
/100
|
#294
Tragic
5.2%
Immigrants | Brazil
0.1
/100
|
#295
Tragic
5.2%
Israelis
0.1
/100
|
#296
Tragic
5.2%