Zip Codes with the Highest Percentage of Population with a Degree in Liberal Arts and History in Odessa, TX
RELATED REPORTS & OPTIONS
Liberal Arts and History
Odessa
Compare Zip Codes
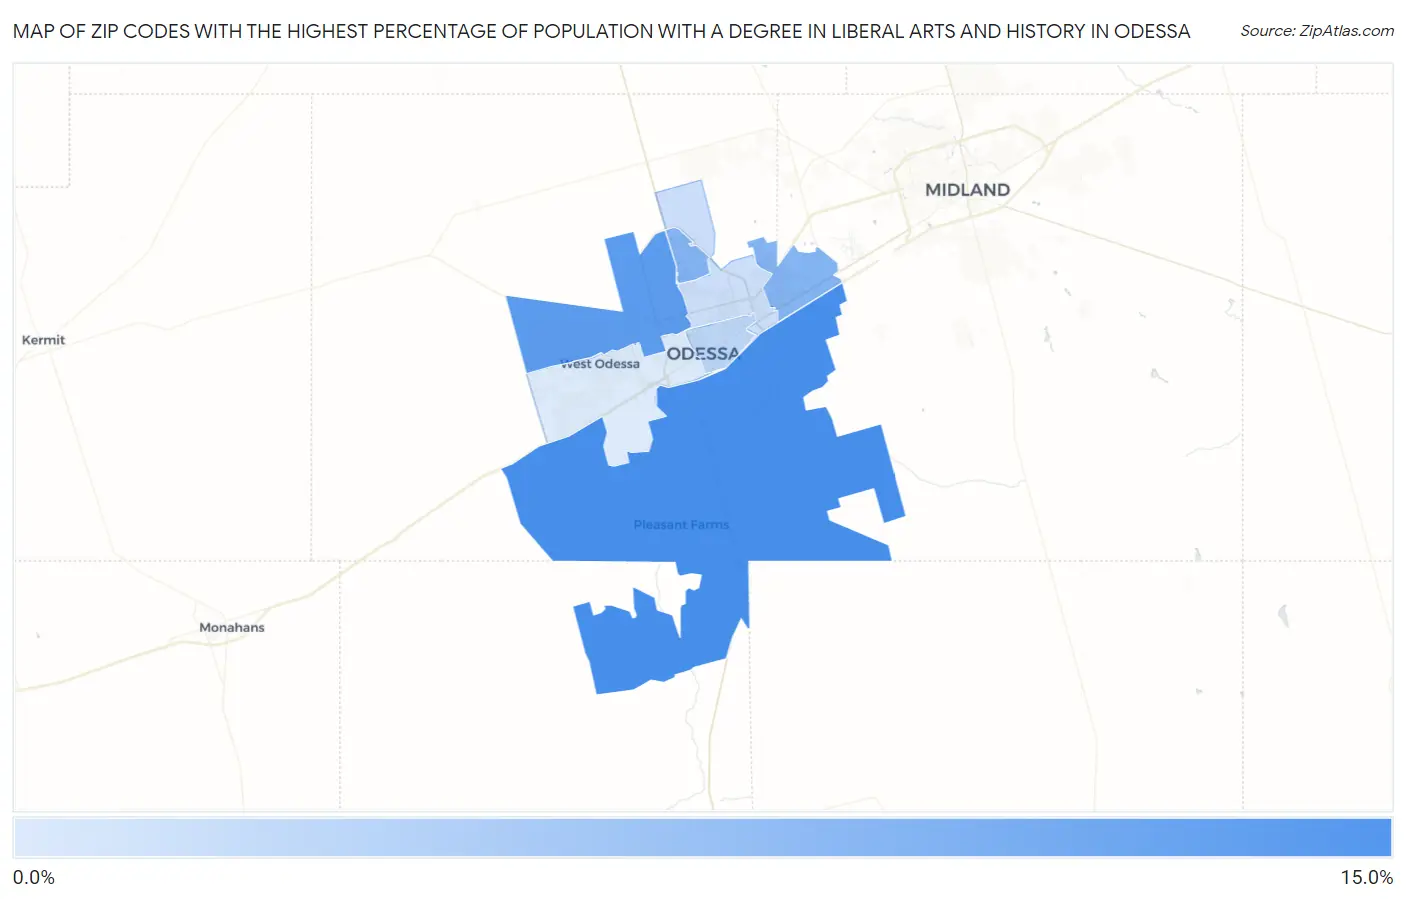
Map of Zip Codes with the Highest Percentage of Population with a Degree in Liberal Arts and History in Odessa
0.0%
15.0%
Zip Codes with the Highest Percentage of Population with a Degree in Liberal Arts and History in Odessa, TX
| Zip Code | % Graduates | vs State | vs National | |
| 1. | 79766 | 12.6% | 4.2%(+8.48)#94 | 4.9%(+7.76)#2,004 |
| 2. | 79764 | 11.4% | 4.2%(+7.22)#114 | 4.9%(+6.50)#2,412 |
| 3. | 79765 | 8.5% | 4.2%(+4.33)#212 | 4.9%(+3.61)#4,355 |
| 4. | 79761 | 4.5% | 4.2%(+0.388)#657 | 4.9%(-0.333)#12,859 |
| 5. | 79762 | 3.6% | 4.2%(-0.575)#878 | 4.9%(-1.30)#16,318 |
| 6. | 79763 | 2.4% | 4.2%(-1.77)#1,165 | 4.9%(-2.49)#20,331 |
1
Common Questions
What are the Top 5 Zip Codes with the Highest Percentage of Population with a Degree in Liberal Arts and History in Odessa, TX?
Top 5 Zip Codes with the Highest Percentage of Population with a Degree in Liberal Arts and History in Odessa, TX are:
What zip code has the Highest Percentage of Population with a Degree in Liberal Arts and History in Odessa, TX?
79766 has the Highest Percentage of Population with a Degree in Liberal Arts and History in Odessa, TX with 12.6%.
What is the Percentage of Population with a Degree in Liberal Arts and History in Odessa, TX?
Percentage of Population with a Degree in Liberal Arts and History in Odessa is 5.0%.
What is the Percentage of Population with a Degree in Liberal Arts and History in Texas?
Percentage of Population with a Degree in Liberal Arts and History in Texas is 4.2%.
What is the Percentage of Population with a Degree in Liberal Arts and History in the United States?
Percentage of Population with a Degree in Liberal Arts and History in the United States is 4.9%.