Zip Codes with the Highest Percentage of Population with a Degree in Liberal Arts and History in El Paso, TX
RELATED REPORTS & OPTIONS
Liberal Arts and History
El Paso
Compare Zip Codes
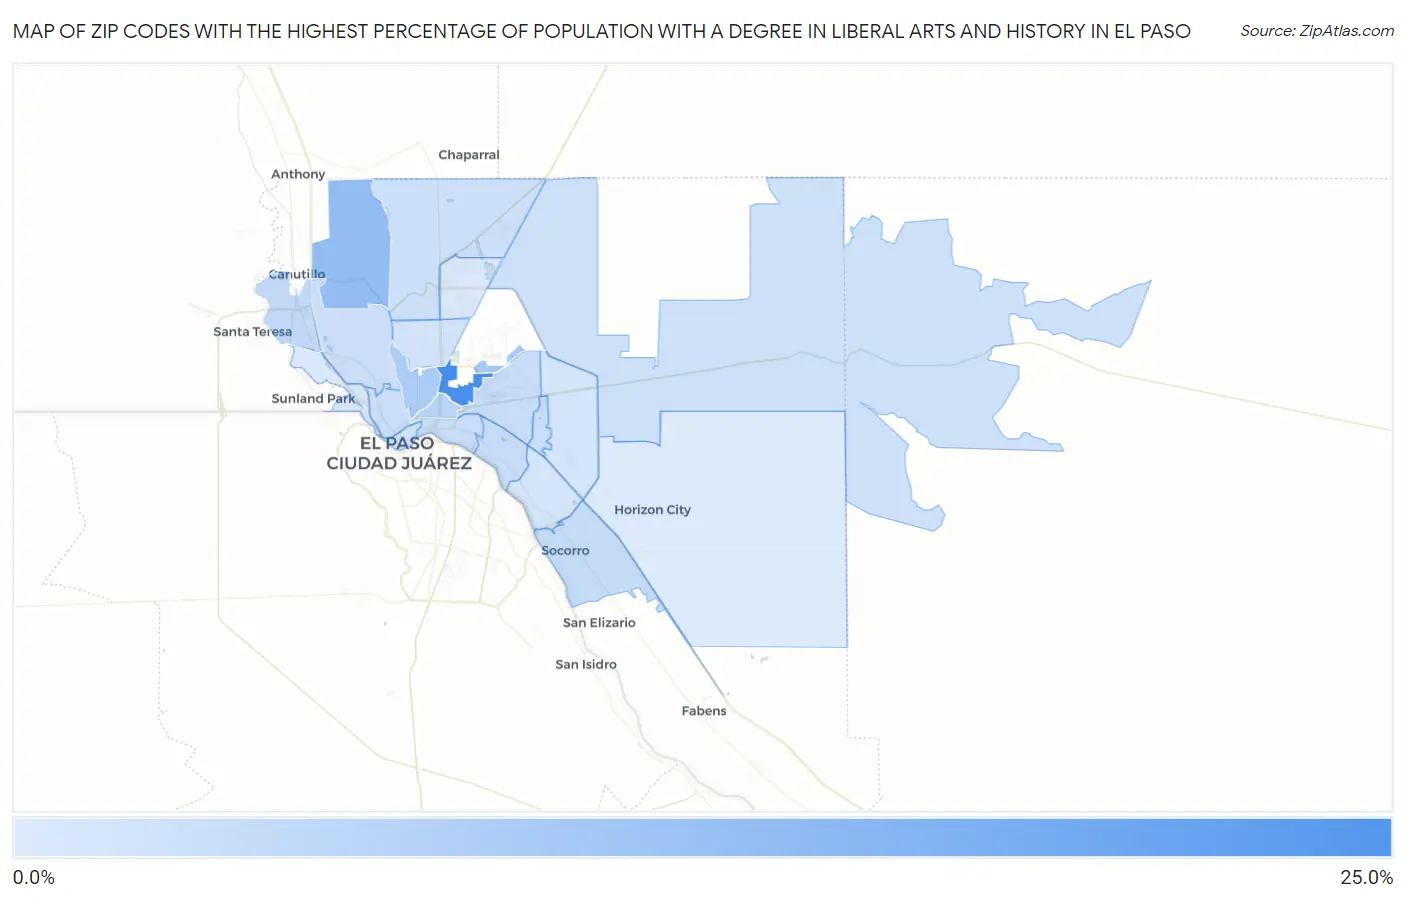
Map of Zip Codes with the Highest Percentage of Population with a Degree in Liberal Arts and History in El Paso
0.0%
25.0%
Zip Codes with the Highest Percentage of Population with a Degree in Liberal Arts and History in El Paso, TX
| Zip Code | % Graduates | vs State | vs National | |
| 1. | 79906 | 22.4% | 4.2%(+18.2)#38 | 4.9%(+17.5)#713 |
| 2. | 79911 | 11.1% | 4.2%(+6.98)#117 | 4.9%(+6.26)#2,494 |
| 3. | 79908 | 8.2% | 4.2%(+4.09)#221 | 4.9%(+3.37)#4,615 |
| 4. | 79930 | 7.8% | 4.2%(+3.65)#259 | 4.9%(+2.93)#5,175 |
| 5. | 79903 | 6.2% | 4.2%(+2.06)#401 | 4.9%(+1.34)#8,000 |
| 6. | 79932 | 5.1% | 4.2%(+0.911)#558 | 4.9%(+0.189)#11,159 |
| 7. | 79927 | 4.4% | 4.2%(+0.232)#691 | 4.9%(-0.489)#13,350 |
| 8. | 79925 | 4.2% | 4.2%(+0.027)#744 | 4.9%(-0.694)#14,106 |
| 9. | 79915 | 4.0% | 4.2%(-0.112)#777 | 4.9%(-0.833)#14,634 |
| 10. | 79935 | 3.9% | 4.2%(-0.214)#800 | 4.9%(-0.935)#15,034 |
| 11. | 79905 | 3.9% | 4.2%(-0.248)#807 | 4.9%(-0.969)#15,160 |
| 12. | 79902 | 3.9% | 4.2%(-0.261)#810 | 4.9%(-0.983)#15,211 |
| 13. | 79912 | 3.9% | 4.2%(-0.273)#813 | 4.9%(-0.994)#15,241 |
| 14. | 79934 | 3.4% | 4.2%(-0.758)#931 | 4.9%(-1.48)#16,986 |
| 15. | 79938 | 3.0% | 4.2%(-1.13)#1,007 | 4.9%(-1.86)#18,303 |
| 16. | 79904 | 2.9% | 4.2%(-1.28)#1,045 | 4.9%(-2.00)#18,774 |
| 17. | 79901 | 2.9% | 4.2%(-1.28)#1,048 | 4.9%(-2.00)#18,782 |
| 18. | 79907 | 2.7% | 4.2%(-1.47)#1,087 | 4.9%(-2.19)#19,387 |
| 19. | 79936 | 2.4% | 4.2%(-1.75)#1,159 | 4.9%(-2.47)#20,267 |
| 20. | 79924 | 1.8% | 4.2%(-2.40)#1,278 | 4.9%(-3.12)#21,964 |
| 21. | 79922 | 1.7% | 4.2%(-2.44)#1,287 | 4.9%(-3.17)#22,065 |
| 22. | 79928 | 1.4% | 4.2%(-2.78)#1,332 | 4.9%(-3.50)#22,745 |
1
Common Questions
What are the Top 10 Zip Codes with the Highest Percentage of Population with a Degree in Liberal Arts and History in El Paso, TX?
Top 10 Zip Codes with the Highest Percentage of Population with a Degree in Liberal Arts and History in El Paso, TX are:
What zip code has the Highest Percentage of Population with a Degree in Liberal Arts and History in El Paso, TX?
79906 has the Highest Percentage of Population with a Degree in Liberal Arts and History in El Paso, TX with 22.4%.
What is the Percentage of Population with a Degree in Liberal Arts and History in El Paso, TX?
Percentage of Population with a Degree in Liberal Arts and History in El Paso is 3.7%.
What is the Percentage of Population with a Degree in Liberal Arts and History in Texas?
Percentage of Population with a Degree in Liberal Arts and History in Texas is 4.2%.
What is the Percentage of Population with a Degree in Liberal Arts and History in the United States?
Percentage of Population with a Degree in Liberal Arts and History in the United States is 4.9%.