Zip Codes with the Highest Percentage of Population with a Degree in Liberal Arts and History in Greenville, TX
RELATED REPORTS & OPTIONS
Liberal Arts and History
Greenville
Compare Zip Codes
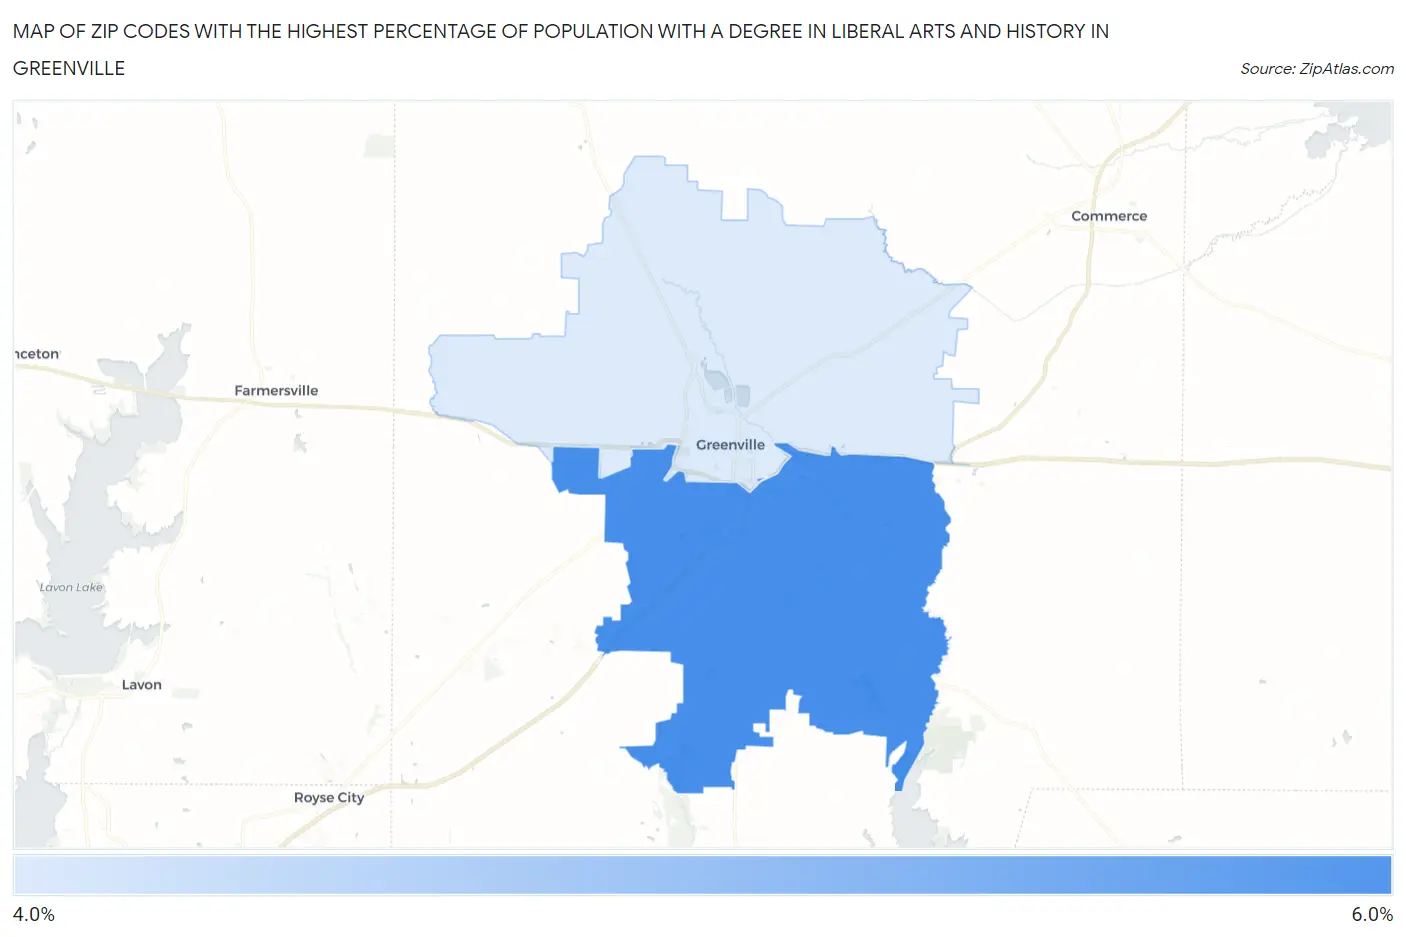
Map of Zip Codes with the Highest Percentage of Population with a Degree in Liberal Arts and History in Greenville
0.0%
6.0%
Zip Codes with the Highest Percentage of Population with a Degree in Liberal Arts and History in Greenville, TX
| Zip Code | % Graduates | vs State | vs National | |
| 1. | 75402 | 5.3% | 4.2%(+1.19)#521 | 4.9%(+0.470)#10,301 |
| 2. | 75401 | 4.6% | 4.2%(+0.492)#634 | 4.9%(-0.230)#12,511 |
1
Common Questions
What are the Top Zip Codes with the Highest Percentage of Population with a Degree in Liberal Arts and History in Greenville, TX?
Top Zip Codes with the Highest Percentage of Population with a Degree in Liberal Arts and History in Greenville, TX are:
What zip code has the Highest Percentage of Population with a Degree in Liberal Arts and History in Greenville, TX?
75402 has the Highest Percentage of Population with a Degree in Liberal Arts and History in Greenville, TX with 5.3%.
What is the Percentage of Population with a Degree in Liberal Arts and History in Greenville, TX?
Percentage of Population with a Degree in Liberal Arts and History in Greenville is 5.0%.
What is the Percentage of Population with a Degree in Liberal Arts and History in Texas?
Percentage of Population with a Degree in Liberal Arts and History in Texas is 4.2%.
What is the Percentage of Population with a Degree in Liberal Arts and History in the United States?
Percentage of Population with a Degree in Liberal Arts and History in the United States is 4.9%.