Zip Codes with the Highest Percentage of Owner-Occupied Units in El Paso, TX

RELATED REPORTS & OPTIONS

Highest Owner-Occupied
Population
Families and Households
Female Fertility
Female Fertility (Unmarried)
Race (Community Size)
Race (Percentage)
Ancestry (Community Size)
AfghanAfricanAmericanApacheArabArgentineanArmenianAustrianBarbadianBasqueBelgianBelizeanBhutaneseBlackfeetBolivianBrazilianBritishBurmeseCajunCanadianCentral AmericanCentral American IndianCherokeeCheyenneChickasawChileanChippewaChoctawColombianComancheCosta RicanCreeCreekCroatianCubanCzechCzechoslovakianDanishDominicanDutchEastern EuropeanEcuadorianEgyptianEnglishEthiopianEuropeanFilipinoFinnishFrenchFrench CanadianGermanGerman RussianGhanaianGreekGuamanian / ChamorroGuatemalanHaitianHonduranHopiHungarianIndian (Asian)IndonesianInupiatIranianIrishIroquoisItalianJamaicanJapaneseJordanianKoreanLaotianLebaneseLithuanianLumbeeLuxembourgerMexicanMexican American IndianMongolianMoroccanNative HawaiianNavajoNicaraguanNigerianNorthern EuropeanNorwegianOttawaPakistaniPanamanianPeruvianPimaPolishPortuguesePotawatomiPuebloPuerto RicanRomanianRussianSalvadoranSamoanScandinavianScotch-IrishScottishSenegaleseSiouxSlovakSloveneSouth AmericanSpaniardSpanishSpanish AmericanSpanish American IndianSri LankanSubsaharan AfricanSwedishSwissSyrianThaiTohono O'OdhamTonganTurkishUkrainianVenezuelanWelshWest IndianYaquiYugoslavian
Ancestry (Percentage)
AfghanAfricanAmericanApacheArabArgentineanArmenianAustrianBarbadianBasqueBelgianBelizeanBhutaneseBlackfeetBolivianBrazilianBritishBurmeseCajunCanadianCentral AmericanCentral American IndianCherokeeCheyenneChickasawChileanChippewaChoctawColombianComancheCosta RicanCreeCreekCroatianCubanCzechCzechoslovakianDanishDominicanDutchEastern EuropeanEcuadorianEgyptianEnglishEthiopianEuropeanFilipinoFinnishFrenchFrench CanadianGermanGerman RussianGhanaianGreekGuamanian / ChamorroGuatemalanHaitianHonduranHopiHungarianIndian (Asian)IndonesianInupiatIranianIrishIroquoisItalianJamaicanJapaneseJordanianKoreanLaotianLebaneseLithuanianLumbeeLuxembourgerMexicanMexican American IndianMongolianMoroccanNative HawaiianNavajoNicaraguanNigerianNorthern EuropeanNorwegianOttawaPakistaniPanamanianPeruvianPimaPolishPortuguesePotawatomiPuebloPuerto RicanRomanianRussianSalvadoranSamoanScandinavianScotch-IrishScottishSenegaleseSiouxSlovakSloveneSouth AmericanSpaniardSpanishSpanish AmericanSpanish American IndianSri LankanSubsaharan AfricanSwedishSwissSyrianThaiTohono O'OdhamTonganTurkishUkrainianVenezuelanWelshWest IndianYaquiYugoslavian
Immigrant Origin (Total)
Immigrant Origin (Percentage)
Income
Income (Families)
Income (Households)
Poverty
Poverty (Families)
Unemployment
Employment Occupations
Employment Industries
Employer Class
Commute Time
Commute Means
School Enrollment
Education by Degree Field
Occupancy
Finances
Physical Characteristics
El Paso
Compare Zip Codes
Comparison Subject

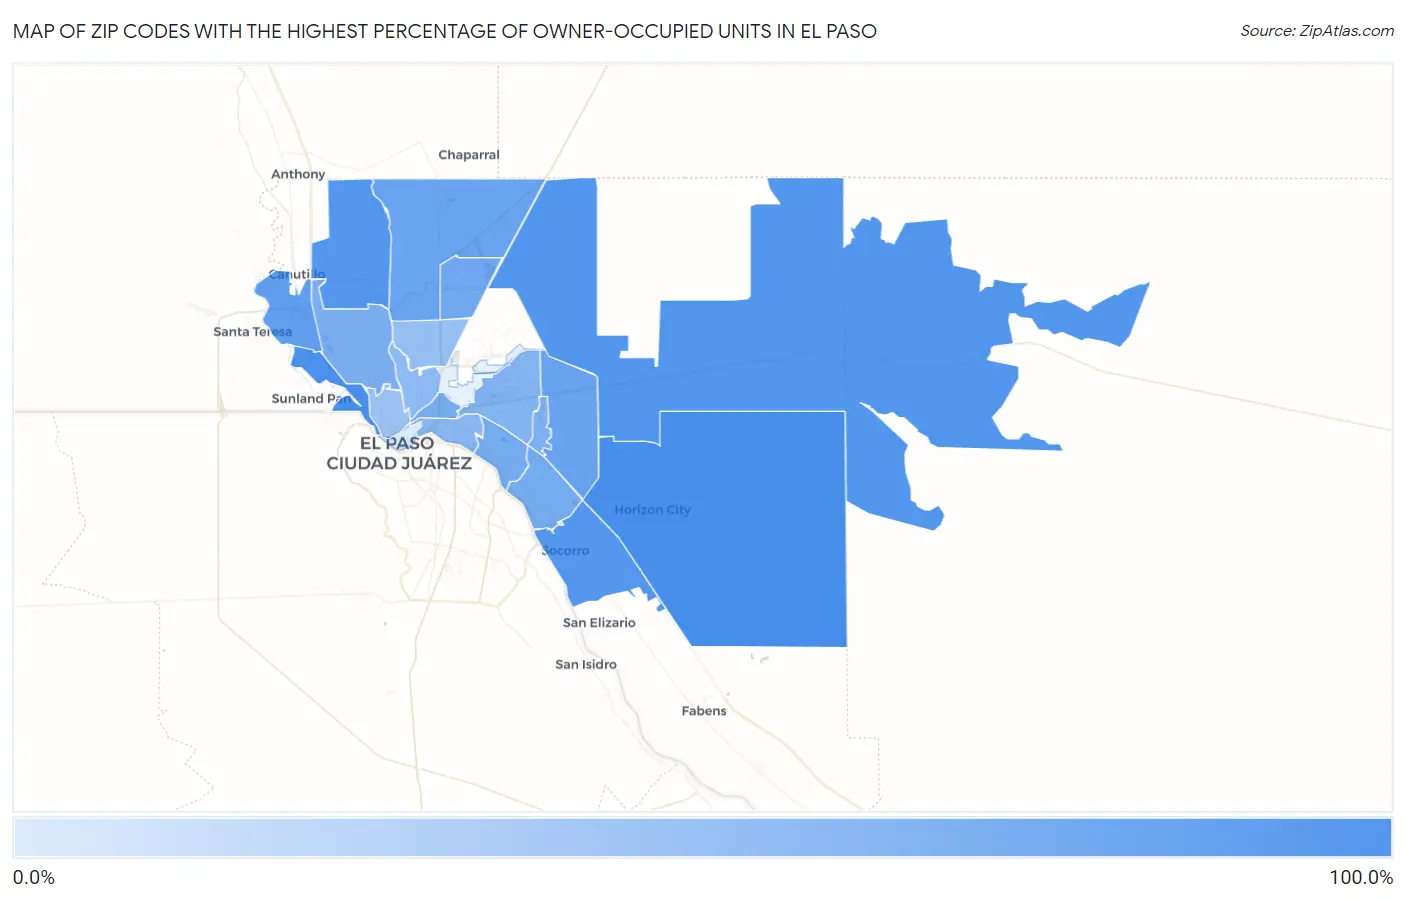
Map of Zip Codes with the Highest Percentage of Owner-Occupied Units in El Paso

0.0%
100.0%
Zip Codes with the Highest Percentage of Owner-Occupied Units in El Paso Map

Zip Codes with the Highest Percentage of Owner-Occupied Units in El Paso, TX

Zip Code % Owner-Occupied vs State vs National
1.7992888.8%62.4%(+26.4)#28664.8%(+24.0)#6,361
2.7992286.8%62.4%(+24.4)#34864.8%(+22.0)#8,028
3.7993880.7%62.4%(+18.3)#62764.8%(+15.9)#13,908
4.7991179.8%62.4%(+17.4)#68064.8%(+15.0)#14,832
5.7992779.6%62.4%(+17.2)#69164.8%(+14.8)#14,997
6.7993271.8%62.4%(+9.38)#1,05964.8%(+6.96)#21,588
7.7993666.6%62.4%(+4.25)#1,26864.8%(+1.83)#24,695
8.7993466.2%62.4%(+3.76)#1,28464.8%(+1.34)#24,903
9.7992461.6%62.4%(-0.805)#1,41264.8%(-3.23)#26,880
10.7991559.3%62.4%(-3.11)#1,46964.8%(-5.53)#27,623
11.7990359.0%62.4%(-3.36)#1,47464.8%(-5.78)#27,693
12.7990758.0%62.4%(-4.36)#1,50164.8%(-6.78)#27,967
13.7991255.3%62.4%(-7.06)#1,56064.8%(-9.48)#28,673
14.7993552.6%62.4%(-9.83)#1,60664.8%(-12.3)#29,261
15.7992550.9%62.4%(-11.5)#1,63964.8%(-13.9)#29,565
16.7990546.8%62.4%(-15.6)#1,69664.8%(-18.0)#30,230
17.7993044.5%62.4%(-17.9)#1,71864.8%(-20.3)#30,549
18.7990440.4%62.4%(-22.0)#1,74864.8%(-24.5)#30,979
19.7990238.0%62.4%(-24.4)#1,76864.8%(-26.8)#31,184
20.799017.1%62.4%(-55.3)#1,87264.8%(-57.7)#32,407

Common Questions

What are the Top 10 Zip Codes with the Highest Percentage of Owner-Occupied Units in El Paso, TX?
Top 10 Zip Codes with the Highest Percentage of Owner-Occupied Units in El Paso, TX are:
#1
88.8%
#2
86.8%
#3
80.7%
#4
79.8%
#5
79.6%
#6
71.8%
#7
66.6%
#8
66.2%
#9
61.6%
#10
59.3%
What zip code has the Highest Percentage of Owner-Occupied Units in El Paso, TX?
79928 has the Highest Percentage of Owner-Occupied Units in El Paso, TX with 88.8%.
What is the Percentage of Owner-Occupied Units in El Paso, TX?
Percentage of Owner-Occupied Units in El Paso is 59.5%.
What is the Percentage of Owner-Occupied Units in Texas?
Percentage of Owner-Occupied Units in Texas is 62.4%.
What is the Percentage of Owner-Occupied Units in the United States?
Percentage of Owner-Occupied Units in the United States is 64.8%.