Zip Codes with the Highest Percentage of Families with Income Above $100,000 in El Paso, TX
RELATED REPORTS & OPTIONS
Family Income | $100k+
El Paso
Compare Zip Codes
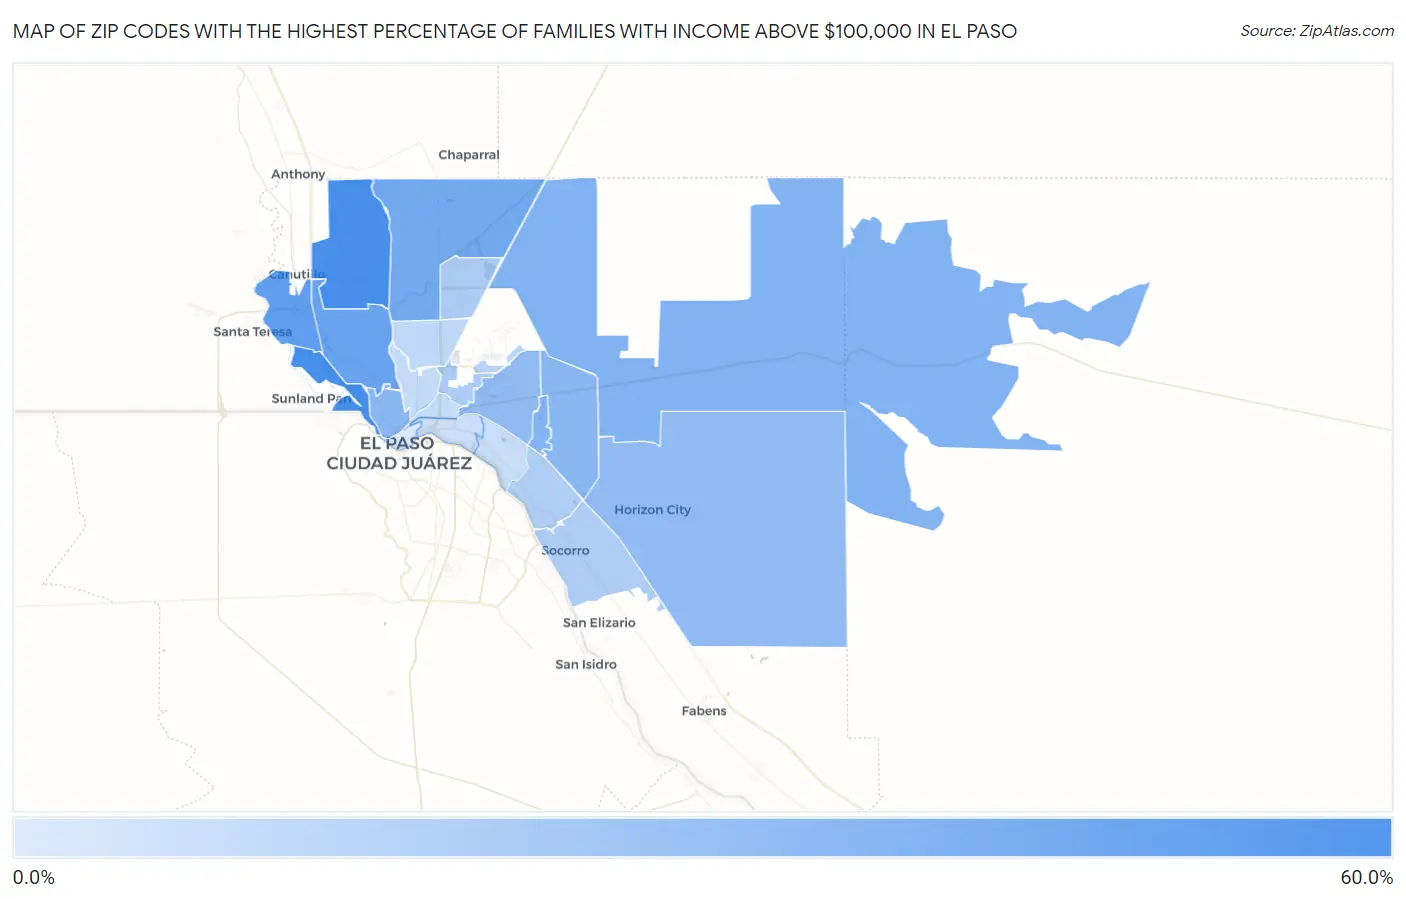
Map of Zip Codes with the Highest Percentage of Families with Income Above $100,000 in El Paso
0.0%
60.0%
Zip Codes with the Highest Percentage of Families with Income Above $100,000 in El Paso, TX
| Zip Code | Families with Income > $100k | vs State | vs National | |
| 1. | 79911 | 58.2% | 43.7%(+14.5)#283 | 46.1%(+12.1)#5,707 |
| 2. | 79922 | 57.7% | 43.7%(+14.0)#289 | 46.1%(+11.6)#5,881 |
| 3. | 79932 | 47.4% | 43.7%(+3.70)#519 | 46.1%(+1.30)#10,076 |
| 4. | 79912 | 45.0% | 43.7%(+1.30)#594 | 46.1%(-1.10)#11,322 |
| 5. | 79934 | 40.2% | 43.7%(-3.50)#757 | 46.1%(-5.90)#14,240 |
| 6. | 79938 | 35.1% | 43.7%(-8.60)#959 | 46.1%(-11.0)#17,811 |
| 7. | 79935 | 34.1% | 43.7%(-9.60)#998 | 46.1%(-12.0)#18,488 |
| 8. | 79902 | 31.7% | 43.7%(-12.0)#1,113 | 46.1%(-14.4)#20,218 |
| 9. | 79936 | 30.9% | 43.7%(-12.8)#1,152 | 46.1%(-15.2)#20,777 |
| 10. | 79928 | 28.9% | 43.7%(-14.8)#1,241 | 46.1%(-17.2)#22,163 |
| 11. | 79925 | 28.4% | 43.7%(-15.3)#1,268 | 46.1%(-17.7)#22,504 |
| 12. | 79906 | 19.7% | 43.7%(-24.0)#1,573 | 46.1%(-26.4)#27,373 |
| 13. | 79924 | 19.1% | 43.7%(-24.6)#1,592 | 46.1%(-27.0)#27,643 |
| 14. | 79927 | 18.6% | 43.7%(-25.1)#1,607 | 46.1%(-27.5)#27,855 |
| 15. | 79907 | 17.6% | 43.7%(-26.1)#1,626 | 46.1%(-28.5)#28,222 |
| 16. | 79908 | 15.0% | 43.7%(-28.7)#1,676 | 46.1%(-31.1)#29,107 |
| 17. | 79904 | 13.5% | 43.7%(-30.2)#1,711 | 46.1%(-32.6)#29,533 |
| 18. | 79930 | 12.0% | 43.7%(-31.7)#1,737 | 46.1%(-34.1)#29,940 |
| 19. | 79903 | 10.9% | 43.7%(-32.8)#1,749 | 46.1%(-35.2)#30,172 |
| 20. | 79915 | 10.5% | 43.7%(-33.2)#1,753 | 46.1%(-35.6)#30,245 |
| 21. | 79905 | 9.6% | 43.7%(-34.1)#1,765 | 46.1%(-36.5)#30,405 |
| 22. | 79901 | 4.2% | 43.7%(-39.5)#1,797 | 46.1%(-41.9)#31,067 |
1
Common Questions
What are the Top 10 Zip Codes with the Highest Percentage of Families with Income Above $100,000 in El Paso, TX?
Top 10 Zip Codes with the Highest Percentage of Families with Income Above $100,000 in El Paso, TX are:
What zip code has the Highest Percentage of Families with Income Above $100,000 in El Paso, TX?
79911 has the Highest Percentage of Families with Income Above $100,000 in El Paso, TX with 58.2%.
What is the Percentage of Families with Income Above $100,000 in El Paso, TX?
Percentage of Families with Income Above $100,000 in El Paso is 28.9%.
What is the Percentage of Families with Income Above $100,000 in Texas?
Percentage of Families with Income Above $100,000 in Texas is 43.7%.
What is the Percentage of Families with Income Above $100,000 in the United States?
Percentage of Families with Income Above $100,000 in the United States is 46.1%.