Zip Codes with the Highest Percentage of Population with a Degree in Physical and Health Sciences in El Paso, TX
RELATED REPORTS & OPTIONS
Physical and Health Sciences
El Paso
Compare Zip Codes
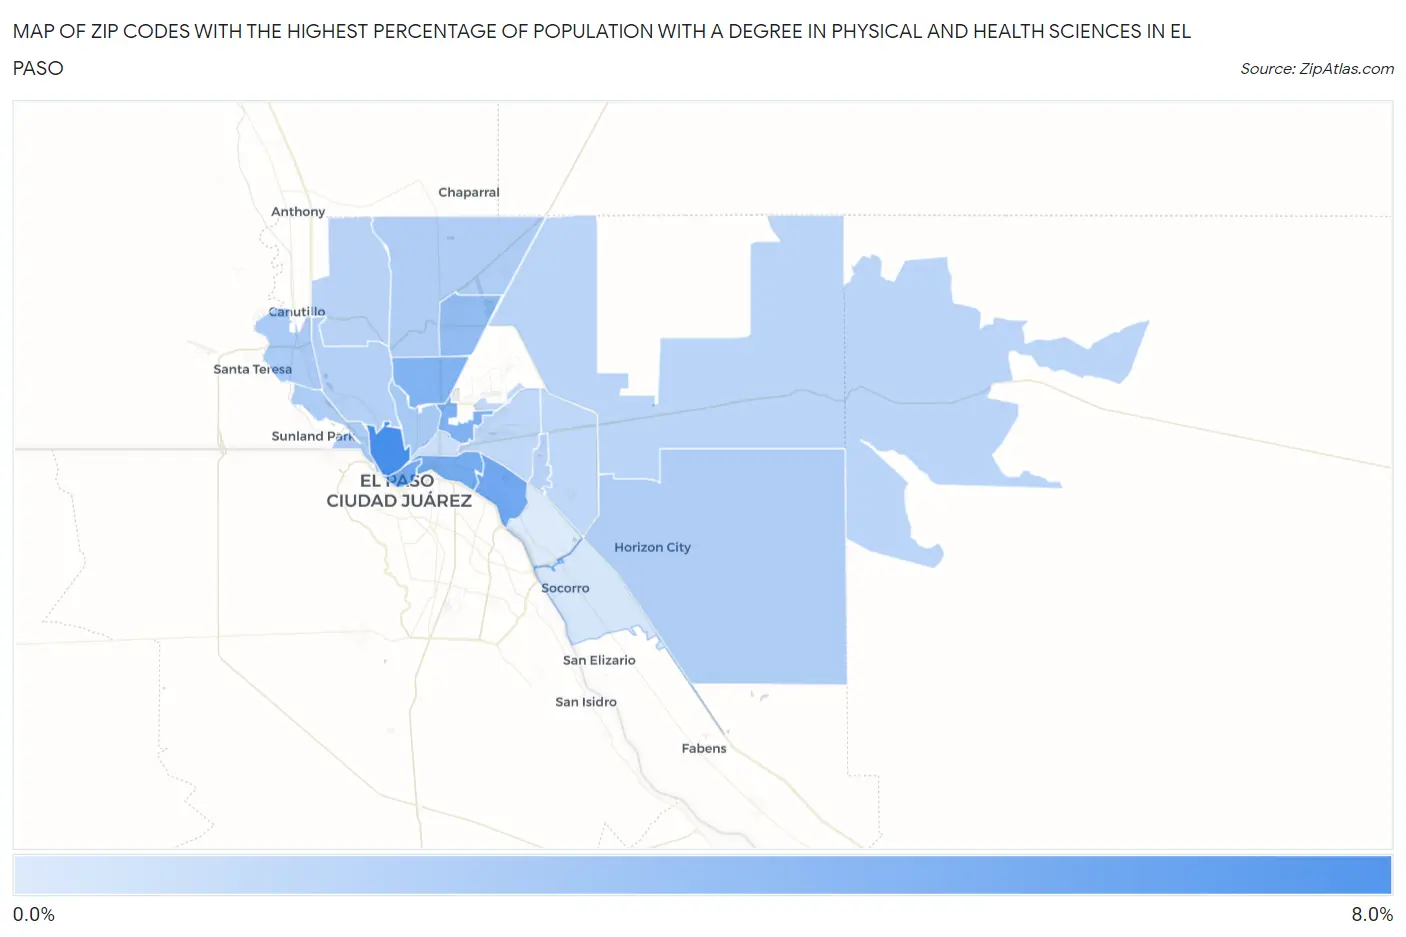
Map of Zip Codes with the Highest Percentage of Population with a Degree in Physical and Health Sciences in El Paso
0.0%
8.0%
Zip Codes with the Highest Percentage of Population with a Degree in Physical and Health Sciences in El Paso, TX
| Zip Code | % Graduates | vs State | vs National | |
| 1. | 79902 | 6.4% | 3.3%(+3.09)#201 | 3.1%(+3.31)#2,895 |
| 2. | 79915 | 4.7% | 3.3%(+1.33)#330 | 3.1%(+1.55)#5,210 |
| 3. | 79901 | 4.5% | 3.3%(+1.19)#346 | 3.1%(+1.41)#5,511 |
| 4. | 79905 | 4.4% | 3.3%(+1.13)#351 | 3.1%(+1.35)#5,638 |
| 5. | 79906 | 4.1% | 3.3%(+0.767)#413 | 3.1%(+0.987)#6,509 |
| 6. | 79904 | 4.0% | 3.3%(+0.679)#433 | 3.1%(+0.899)#6,770 |
| 7. | 79924 | 3.3% | 3.3%(-0.051)#610 | 3.1%(+0.169)#9,306 |
| 8. | 79930 | 2.4% | 3.3%(-0.930)#845 | 3.1%(-0.710)#13,241 |
| 9. | 79932 | 2.3% | 3.3%(-1.02)#865 | 3.1%(-0.797)#13,659 |
| 10. | 79922 | 2.1% | 3.3%(-1.18)#910 | 3.1%(-0.957)#14,407 |
| 11. | 79934 | 2.1% | 3.3%(-1.22)#922 | 3.1%(-0.995)#14,624 |
| 12. | 79928 | 2.1% | 3.3%(-1.25)#938 | 3.1%(-1.03)#14,814 |
| 13. | 79912 | 1.9% | 3.3%(-1.43)#989 | 3.1%(-1.21)#15,574 |
| 14. | 79935 | 1.7% | 3.3%(-1.60)#1,034 | 3.1%(-1.38)#16,326 |
| 15. | 79911 | 1.7% | 3.3%(-1.62)#1,040 | 3.1%(-1.40)#16,428 |
| 16. | 79938 | 1.6% | 3.3%(-1.70)#1,058 | 3.1%(-1.48)#16,783 |
| 17. | 79925 | 1.5% | 3.3%(-1.85)#1,099 | 3.1%(-1.63)#17,448 |
| 18. | 79936 | 1.4% | 3.3%(-1.88)#1,107 | 3.1%(-1.66)#17,578 |
| 19. | 79908 | 1.3% | 3.3%(-1.98)#1,126 | 3.1%(-1.76)#17,962 |
| 20. | 79903 | 0.97% | 3.3%(-2.35)#1,203 | 3.1%(-2.13)#19,344 |
| 21. | 79927 | 0.54% | 3.3%(-2.78)#1,261 | 3.1%(-2.56)#20,525 |
| 22. | 79907 | 0.23% | 3.3%(-3.09)#1,296 | 3.1%(-2.87)#21,011 |
1
Common Questions
What are the Top 10 Zip Codes with the Highest Percentage of Population with a Degree in Physical and Health Sciences in El Paso, TX?
Top 10 Zip Codes with the Highest Percentage of Population with a Degree in Physical and Health Sciences in El Paso, TX are:
What zip code has the Highest Percentage of Population with a Degree in Physical and Health Sciences in El Paso, TX?
79902 has the Highest Percentage of Population with a Degree in Physical and Health Sciences in El Paso, TX with 6.4%.
What is the Percentage of Population with a Degree in Physical and Health Sciences in El Paso, TX?
Percentage of Population with a Degree in Physical and Health Sciences in El Paso is 2.2%.
What is the Percentage of Population with a Degree in Physical and Health Sciences in Texas?
Percentage of Population with a Degree in Physical and Health Sciences in Texas is 3.3%.
What is the Percentage of Population with a Degree in Physical and Health Sciences in the United States?
Percentage of Population with a Degree in Physical and Health Sciences in the United States is 3.1%.