Zip Codes with the Highest Percentage of Population with a Degree in Liberal Arts and History in Carrollton, TX
RELATED REPORTS & OPTIONS
Liberal Arts and History
Carrollton
Compare Zip Codes
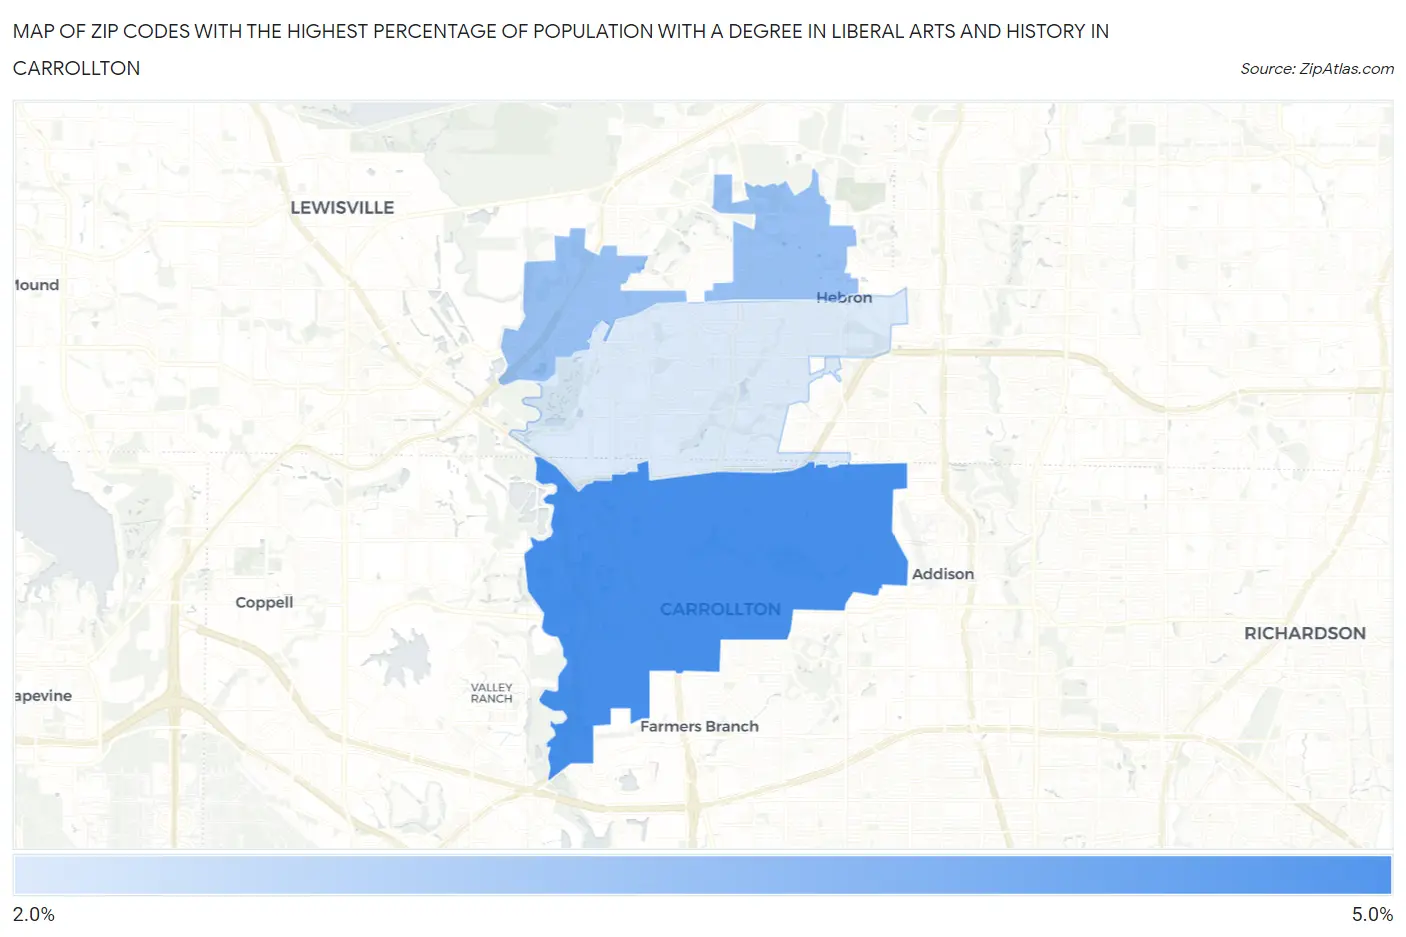
Map of Zip Codes with the Highest Percentage of Population with a Degree in Liberal Arts and History in Carrollton
0.0%
5.0%
Zip Codes with the Highest Percentage of Population with a Degree in Liberal Arts and History in Carrollton, TX
| Zip Code | % Graduates | vs State | vs National | |
| 1. | 75006 | 4.9% | 4.2%(+0.795)#577 | 4.9%(+0.073)#11,515 |
| 2. | 75010 | 3.6% | 4.2%(-0.591)#880 | 4.9%(-1.31)#16,375 |
| 3. | 75007 | 2.4% | 4.2%(-1.78)#1,166 | 4.9%(-2.50)#20,352 |
1
Common Questions
What are the Top Zip Codes with the Highest Percentage of Population with a Degree in Liberal Arts and History in Carrollton, TX?
Top Zip Codes with the Highest Percentage of Population with a Degree in Liberal Arts and History in Carrollton, TX are:
What zip code has the Highest Percentage of Population with a Degree in Liberal Arts and History in Carrollton, TX?
75006 has the Highest Percentage of Population with a Degree in Liberal Arts and History in Carrollton, TX with 4.9%.
What is the Percentage of Population with a Degree in Liberal Arts and History in Carrollton, TX?
Percentage of Population with a Degree in Liberal Arts and History in Carrollton is 3.4%.
What is the Percentage of Population with a Degree in Liberal Arts and History in Texas?
Percentage of Population with a Degree in Liberal Arts and History in Texas is 4.2%.
What is the Percentage of Population with a Degree in Liberal Arts and History in the United States?
Percentage of Population with a Degree in Liberal Arts and History in the United States is 4.9%.