Zip Codes with the Highest Percentage of Population with a Degree in Liberal Arts and History in Conroe, TX
RELATED REPORTS & OPTIONS
Liberal Arts and History
Conroe
Compare Zip Codes
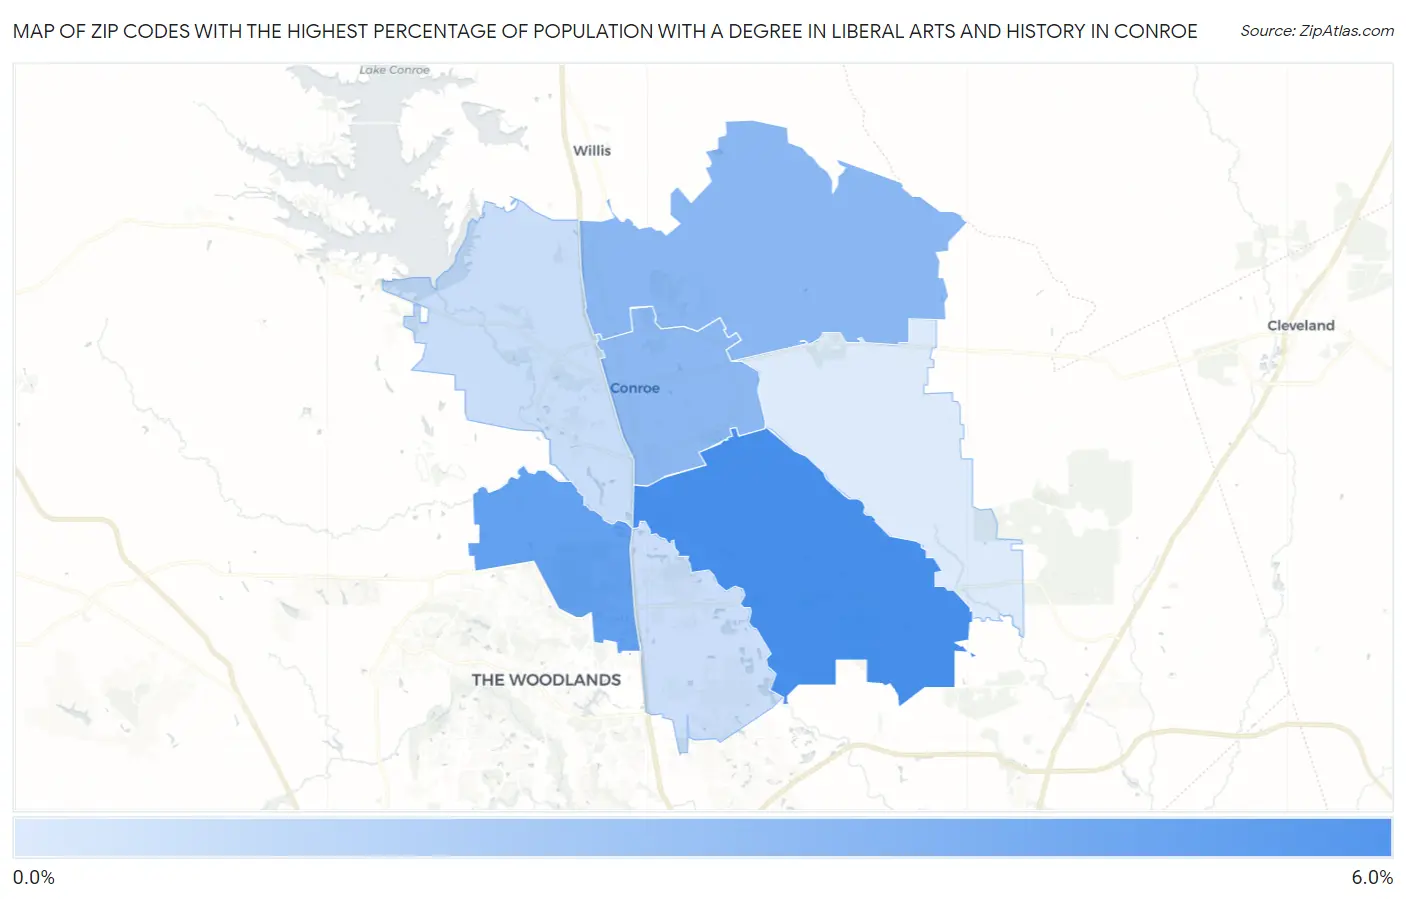
Map of Zip Codes with the Highest Percentage of Population with a Degree in Liberal Arts and History in Conroe
0.0%
6.0%
Zip Codes with the Highest Percentage of Population with a Degree in Liberal Arts and History in Conroe, TX
| Zip Code | % Graduates | vs State | vs National | |
| 1. | 77302 | 5.4% | 4.2%(+1.22)#518 | 4.9%(+0.497)#10,208 |
| 2. | 77384 | 4.6% | 4.2%(+0.437)#648 | 4.9%(-0.285)#12,674 |
| 3. | 77303 | 3.5% | 4.2%(-0.663)#901 | 4.9%(-1.38)#16,641 |
| 4. | 77301 | 3.4% | 4.2%(-0.723)#926 | 4.9%(-1.44)#16,889 |
| 5. | 77304 | 1.7% | 4.2%(-2.40)#1,279 | 4.9%(-3.13)#21,978 |
| 6. | 77385 | 1.7% | 4.2%(-2.46)#1,288 | 4.9%(-3.18)#22,080 |
| 7. | 77306 | 1.2% | 4.2%(-2.97)#1,351 | 4.9%(-3.69)#23,071 |
1
Common Questions
What are the Top 5 Zip Codes with the Highest Percentage of Population with a Degree in Liberal Arts and History in Conroe, TX?
Top 5 Zip Codes with the Highest Percentage of Population with a Degree in Liberal Arts and History in Conroe, TX are:
What zip code has the Highest Percentage of Population with a Degree in Liberal Arts and History in Conroe, TX?
77302 has the Highest Percentage of Population with a Degree in Liberal Arts and History in Conroe, TX with 5.4%.
What is the Percentage of Population with a Degree in Liberal Arts and History in Conroe, TX?
Percentage of Population with a Degree in Liberal Arts and History in Conroe is 3.1%.
What is the Percentage of Population with a Degree in Liberal Arts and History in Texas?
Percentage of Population with a Degree in Liberal Arts and History in Texas is 4.2%.
What is the Percentage of Population with a Degree in Liberal Arts and History in the United States?
Percentage of Population with a Degree in Liberal Arts and History in the United States is 4.9%.