Zip Codes with the Highest Percentage of Population Employed in Security & Protection in El Paso, TX
RELATED REPORTS & OPTIONS
Security & Protection
El Paso
Compare Zip Codes
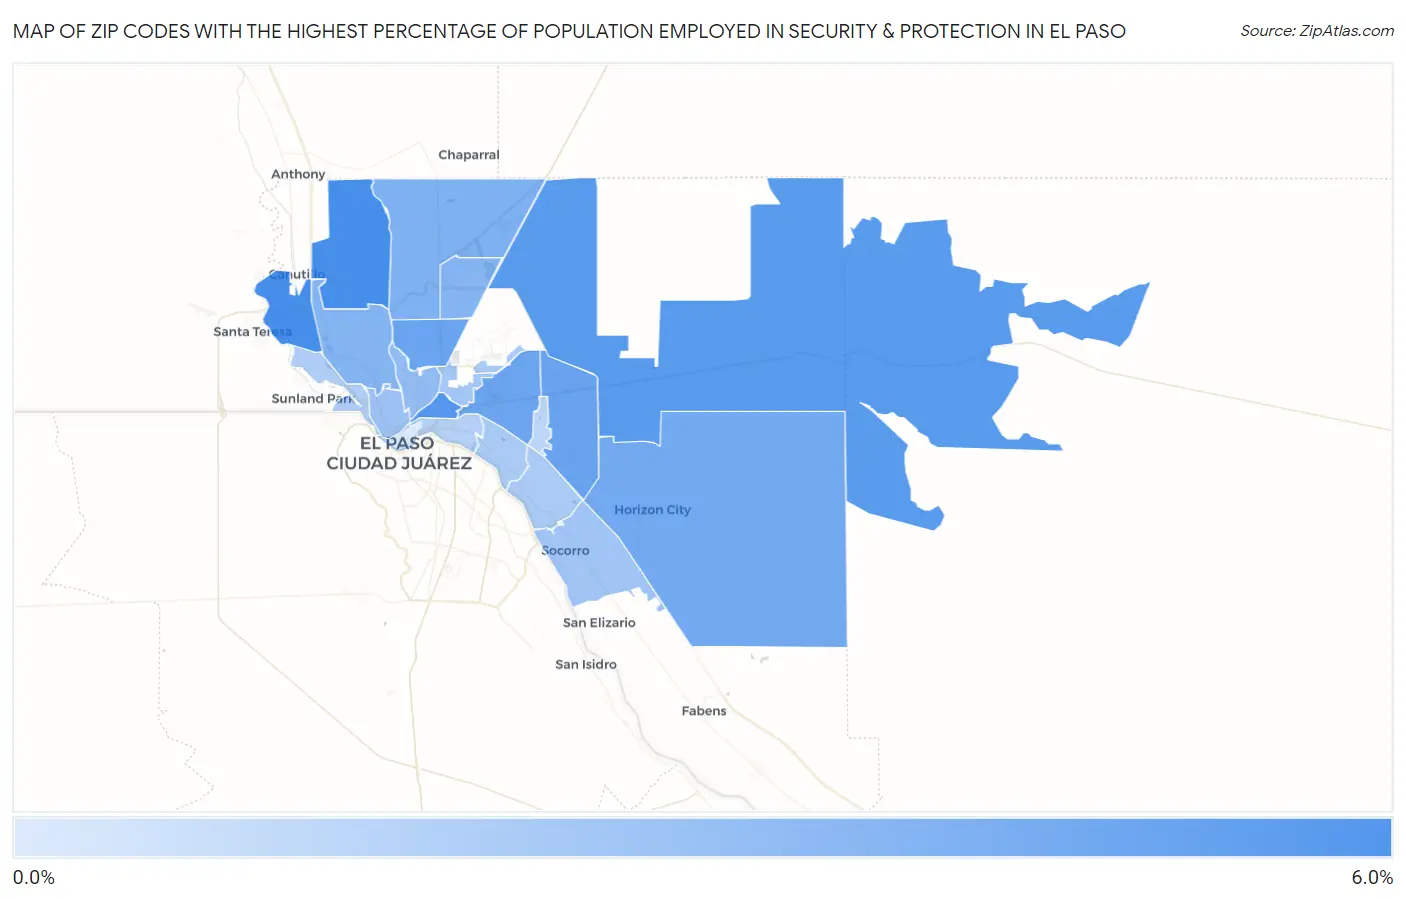
Map of Zip Codes with the Highest Percentage of Population Employed in Security & Protection in El Paso
0.0%
6.0%
Zip Codes with the Highest Percentage of Population Employed in Security & Protection in El Paso, TX
| Zip Code | % Employed | vs State | vs National | |
| 1. | 79911 | 5.9% | 2.2%(+3.72)#163 | 2.1%(+3.80)#2,115 |
| 2. | 79932 | 5.9% | 2.2%(+3.72)#164 | 2.1%(+3.79)#2,120 |
| 3. | 79903 | 5.5% | 2.2%(+3.26)#189 | 2.1%(+3.33)#2,467 |
| 4. | 79938 | 5.4% | 2.2%(+3.15)#197 | 2.1%(+3.23)#2,565 |
| 5. | 79936 | 4.9% | 2.2%(+2.64)#240 | 2.1%(+2.71)#3,094 |
| 6. | 79904 | 4.7% | 2.2%(+2.51)#252 | 2.1%(+2.59)#3,251 |
| 7. | 79925 | 4.7% | 2.2%(+2.44)#261 | 2.1%(+2.52)#3,349 |
| 8. | 79928 | 4.4% | 2.2%(+2.19)#280 | 2.1%(+2.27)#3,748 |
| 9. | 79934 | 4.0% | 2.2%(+1.80)#323 | 2.1%(+1.87)#4,453 |
| 10. | 79912 | 3.9% | 2.2%(+1.71)#338 | 2.1%(+1.78)#4,629 |
| 11. | 79924 | 3.8% | 2.2%(+1.58)#358 | 2.1%(+1.65)#4,903 |
| 12. | 79930 | 3.4% | 2.2%(+1.19)#431 | 2.1%(+1.27)#5,886 |
| 13. | 79902 | 3.1% | 2.2%(+0.883)#498 | 2.1%(+0.959)#6,868 |
| 14. | 79927 | 2.9% | 2.2%(+0.675)#551 | 2.1%(+0.750)#7,642 |
| 15. | 79906 | 2.8% | 2.2%(+0.580)#577 | 2.1%(+0.655)#8,103 |
| 16. | 79908 | 2.6% | 2.2%(+0.387)#630 | 2.1%(+0.462)#8,958 |
| 17. | 79907 | 2.6% | 2.2%(+0.381)#633 | 2.1%(+0.456)#8,984 |
| 18. | 79915 | 2.6% | 2.2%(+0.364)#636 | 2.1%(+0.439)#9,061 |
| 19. | 79922 | 2.4% | 2.2%(+0.209)#693 | 2.1%(+0.285)#9,878 |
| 20. | 79905 | 2.3% | 2.2%(+0.054)#750 | 2.1%(+0.129)#10,781 |
| 21. | 79935 | 2.0% | 2.2%(-0.242)#871 | 2.1%(-0.166)#12,677 |
| 22. | 79901 | 0.91% | 2.2%(-1.31)#1,341 | 2.1%(-1.24)#20,708 |
1
Common Questions
What are the Top 10 Zip Codes with the Highest Percentage of Population Employed in Security & Protection in El Paso, TX?
Top 10 Zip Codes with the Highest Percentage of Population Employed in Security & Protection in El Paso, TX are:
What zip code has the Highest Percentage of Population Employed in Security & Protection in El Paso, TX?
79911 has the Highest Percentage of Population Employed in Security & Protection in El Paso, TX with 5.9%.
What is the Percentage of Population Employed in Security & Protection in El Paso, TX?
Percentage of Population Employed in Security & Protection in El Paso is 4.2%.
What is the Percentage of Population Employed in Security & Protection in Texas?
Percentage of Population Employed in Security & Protection in Texas is 2.2%.
What is the Percentage of Population Employed in Security & Protection in the United States?
Percentage of Population Employed in Security & Protection in the United States is 2.1%.