Zip Codes with the Highest Child Poverty Level Among Girls Under the Age of 16 in El Paso, TX
RELATED REPORTS & OPTIONS
Highest Poverty | Girls 0-16
El Paso
Compare Zip Codes
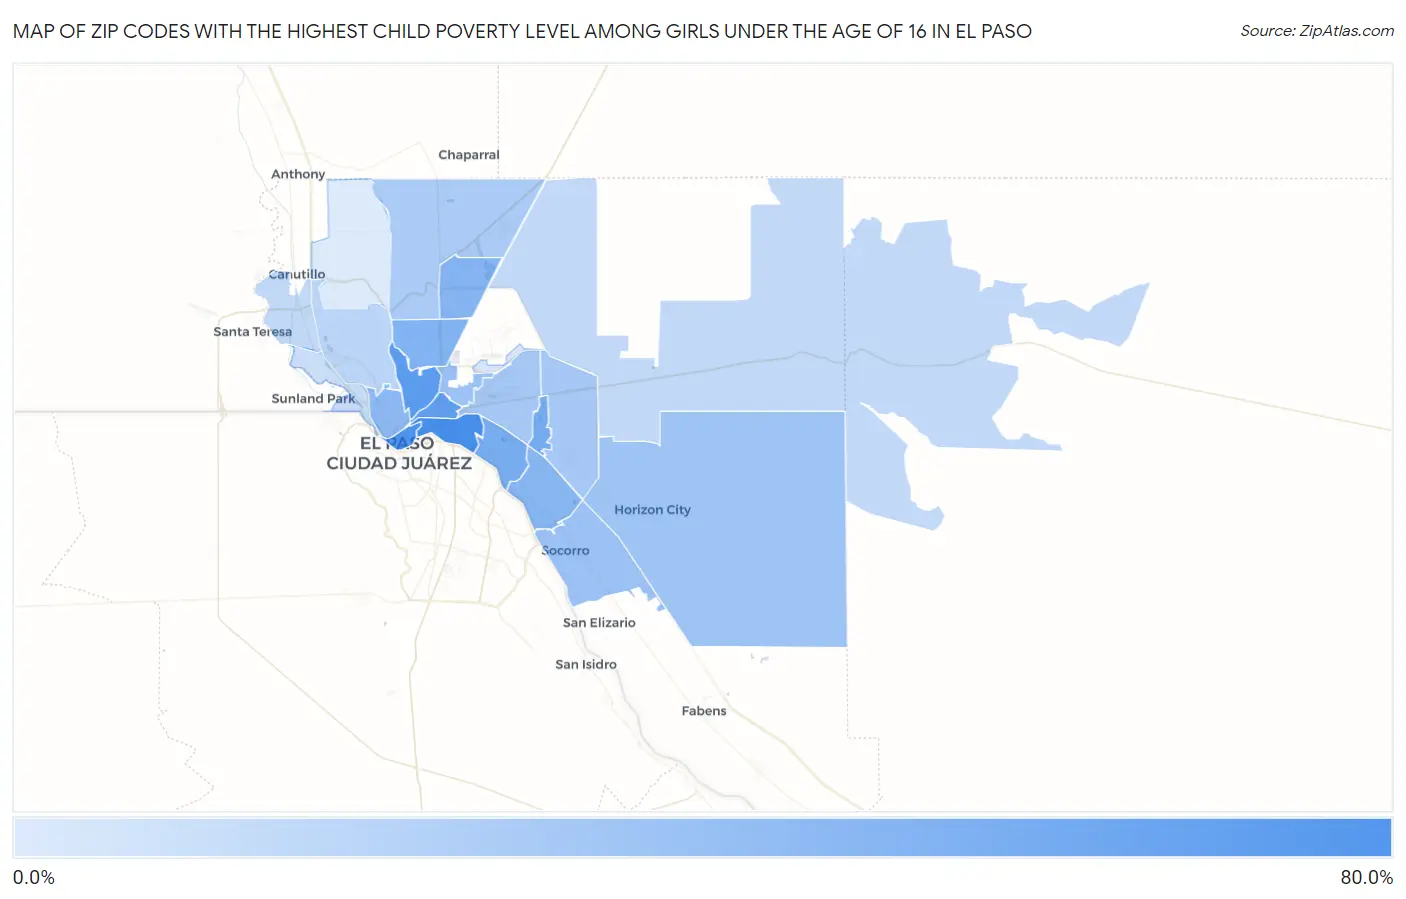
Map of Zip Codes with the Highest Child Poverty Level Among Girls Under the Age of 16 in El Paso
0.0%
80.0%
Zip Codes with the Highest Child Poverty Level Among Girls Under the Age of 16 in El Paso, TX
| Zip Code | Child Poverty (Girls) | vs State | vs National | |
| 1. | 79905 | 62.6% | 19.7%(+42.9)#53 | 17.0%(+45.6)#1,136 |
| 2. | 79901 | 58.5% | 19.7%(+38.8)#65 | 17.0%(+41.6)#1,366 |
| 3. | 79930 | 52.7% | 19.7%(+33.0)#92 | 17.0%(+35.8)#1,794 |
| 4. | 79903 | 50.4% | 19.7%(+30.7)#108 | 17.0%(+33.4)#2,015 |
| 5. | 79935 | 42.3% | 19.7%(+22.6)#180 | 17.0%(+25.3)#2,997 |
| 6. | 79915 | 40.6% | 19.7%(+20.9)#204 | 17.0%(+23.7)#3,255 |
| 7. | 79904 | 36.9% | 19.7%(+17.2)#259 | 17.0%(+19.9)#3,957 |
| 8. | 79924 | 35.1% | 19.7%(+15.4)#295 | 17.0%(+18.1)#4,362 |
| 9. | 79907 | 34.7% | 19.7%(+15.0)#301 | 17.0%(+17.7)#4,451 |
| 10. | 79902 | 32.4% | 19.7%(+12.7)#353 | 17.0%(+15.4)#5,069 |
| 11. | 79927 | 27.4% | 19.7%(+7.72)#473 | 17.0%(+10.4)#6,603 |
| 12. | 79906 | 26.5% | 19.7%(+6.77)#492 | 17.0%(+9.48)#6,942 |
| 13. | 79928 | 25.3% | 19.7%(+5.59)#534 | 17.0%(+8.30)#7,421 |
| 14. | 79925 | 23.3% | 19.7%(+3.66)#594 | 17.0%(+6.37)#8,228 |
| 15. | 79936 | 23.0% | 19.7%(+3.34)#608 | 17.0%(+6.06)#8,362 |
| 16. | 79934 | 21.6% | 19.7%(+1.95)#645 | 17.0%(+4.67)#9,029 |
| 17. | 79912 | 15.8% | 19.7%(-3.84)#843 | 17.0%(-1.13)#12,222 |
| 18. | 79932 | 13.1% | 19.7%(-6.64)#956 | 17.0%(-3.92)#14,065 |
| 19. | 79938 | 13.0% | 19.7%(-6.69)#959 | 17.0%(-3.98)#14,112 |
| 20. | 79922 | 10.8% | 19.7%(-8.85)#1,045 | 17.0%(-6.13)#15,625 |
| 21. | 79908 | 5.8% | 19.7%(-13.9)#1,250 | 17.0%(-11.2)#19,739 |
| 22. | 79911 | 4.4% | 19.7%(-15.3)#1,312 | 17.0%(-12.5)#20,930 |
1
Common Questions
What are the Top 10 Zip Codes with the Highest Child Poverty Level Among Girls Under the Age of 16 in El Paso, TX?
Top 10 Zip Codes with the Highest Child Poverty Level Among Girls Under the Age of 16 in El Paso, TX are:
What zip code has the Highest Child Poverty Level Among Girls Under the Age of 16 in El Paso, TX?
79905 has the Highest Child Poverty Level Among Girls Under the Age of 16 in El Paso, TX with 62.6%.
What is the Poverty Level Among Girls Under the Age of 16 in El Paso, TX?
Poverty Level Among Girls Under the Age of 16 in El Paso is 26.7%.
What is the Poverty Level Among Girls Under the Age of 16 in Texas?
Poverty Level Among Girls Under the Age of 16 in Texas is 19.7%.
What is the Poverty Level Among Girls Under the Age of 16 in the United States?
Poverty Level Among Girls Under the Age of 16 in the United States is 17.0%.