Zip Codes with the Lowest Percentage of Owner-Occupied Units in El Paso, TX

RELATED REPORTS & OPTIONS

Lowest Owner-Occupied
Population
Families and Households
Female Fertility
Female Fertility (Unmarried)
Race (Community Size)
Race (Percentage)
Ancestry (Community Size)
AfghanAfricanAmericanApacheArabArgentineanArmenianAustrianBarbadianBasqueBelgianBelizeanBhutaneseBlackfeetBolivianBrazilianBritishBurmeseCajunCanadianCentral AmericanCentral American IndianCherokeeCheyenneChickasawChileanChippewaChoctawColombianComancheCosta RicanCreeCreekCroatianCubanCzechCzechoslovakianDanishDominicanDutchEastern EuropeanEcuadorianEgyptianEnglishEthiopianEuropeanFilipinoFinnishFrenchFrench CanadianGermanGerman RussianGhanaianGreekGuamanian / ChamorroGuatemalanHaitianHonduranHopiHungarianIndian (Asian)IndonesianInupiatIranianIrishIroquoisItalianJamaicanJapaneseJordanianKoreanLaotianLebaneseLithuanianLumbeeLuxembourgerMexicanMexican American IndianMongolianMoroccanNative HawaiianNavajoNicaraguanNigerianNorthern EuropeanNorwegianOttawaPakistaniPanamanianPeruvianPimaPolishPortuguesePotawatomiPuebloPuerto RicanRomanianRussianSalvadoranSamoanScandinavianScotch-IrishScottishSenegaleseSiouxSlovakSloveneSouth AmericanSpaniardSpanishSpanish AmericanSpanish American IndianSri LankanSubsaharan AfricanSwedishSwissSyrianThaiTohono O'OdhamTonganTurkishUkrainianVenezuelanWelshWest IndianYaquiYugoslavian
Ancestry (Percentage)
AfghanAfricanAmericanApacheArabArgentineanArmenianAustrianBarbadianBasqueBelgianBelizeanBhutaneseBlackfeetBolivianBrazilianBritishBurmeseCajunCanadianCentral AmericanCentral American IndianCherokeeCheyenneChickasawChileanChippewaChoctawColombianComancheCosta RicanCreeCreekCroatianCubanCzechCzechoslovakianDanishDominicanDutchEastern EuropeanEcuadorianEgyptianEnglishEthiopianEuropeanFilipinoFinnishFrenchFrench CanadianGermanGerman RussianGhanaianGreekGuamanian / ChamorroGuatemalanHaitianHonduranHopiHungarianIndian (Asian)IndonesianInupiatIranianIrishIroquoisItalianJamaicanJapaneseJordanianKoreanLaotianLebaneseLithuanianLumbeeLuxembourgerMexicanMexican American IndianMongolianMoroccanNative HawaiianNavajoNicaraguanNigerianNorthern EuropeanNorwegianOttawaPakistaniPanamanianPeruvianPimaPolishPortuguesePotawatomiPuebloPuerto RicanRomanianRussianSalvadoranSamoanScandinavianScotch-IrishScottishSenegaleseSiouxSlovakSloveneSouth AmericanSpaniardSpanishSpanish AmericanSpanish American IndianSri LankanSubsaharan AfricanSwedishSwissSyrianThaiTohono O'OdhamTonganTurkishUkrainianVenezuelanWelshWest IndianYaquiYugoslavian
Immigrant Origin (Total)
Immigrant Origin (Percentage)
Income
Income (Families)
Income (Households)
Poverty
Poverty (Families)
Unemployment
Employment Occupations
Employment Industries
Employer Class
Commute Time
Commute Means
School Enrollment
Education by Degree Field
Occupancy
Finances
Physical Characteristics
El Paso
Compare Zip Codes
Comparison Subject

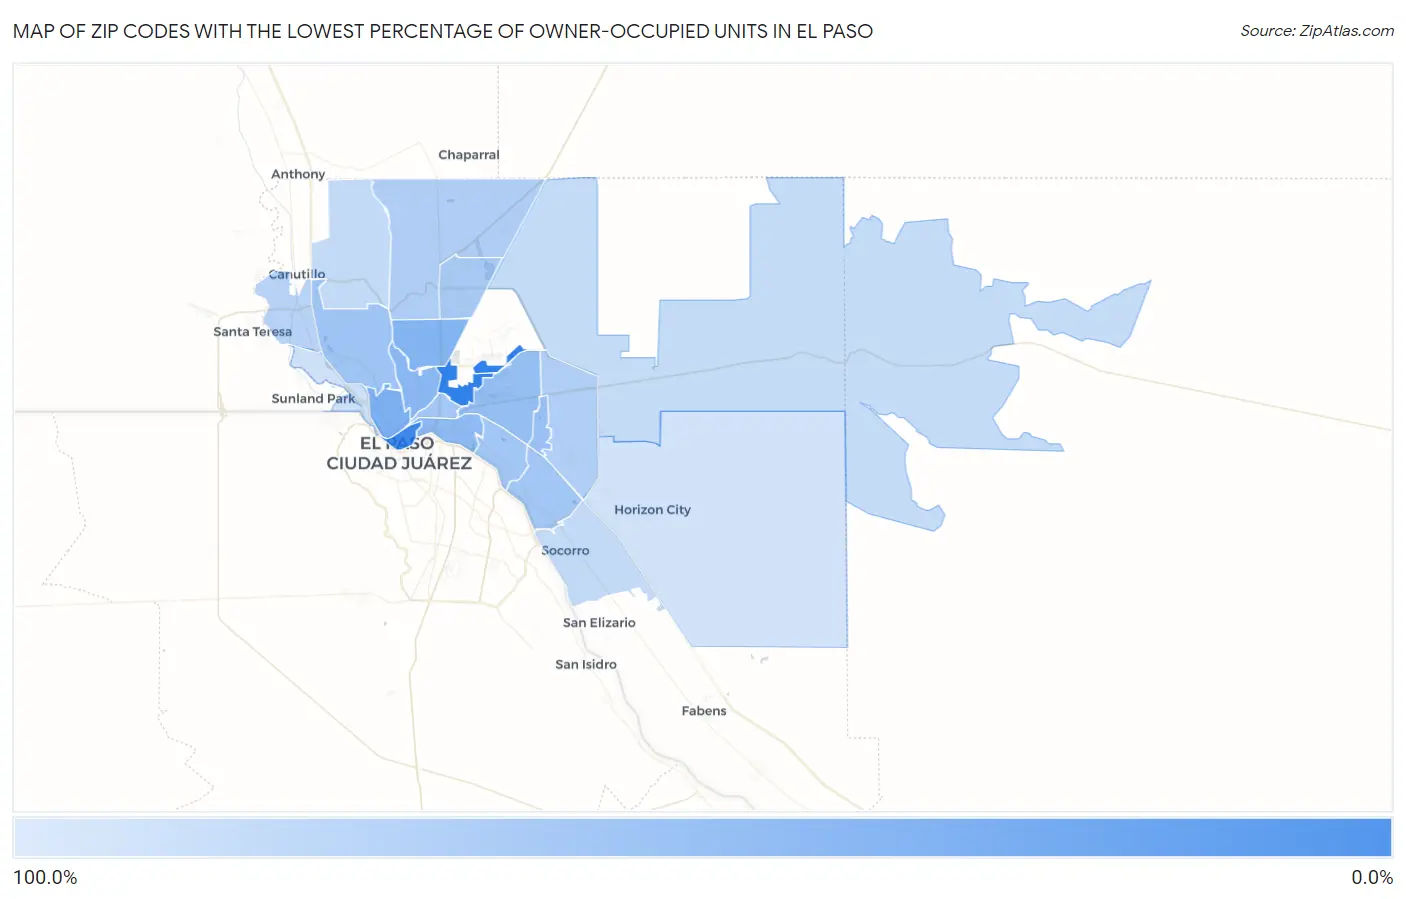
Map of Zip Codes with the Lowest Percentage of Owner-Occupied Units in El Paso

100.0%
0.0%
Zip Codes with the Lowest Percentage of Owner-Occupied Units in El Paso Map

Zip Codes with the Lowest Percentage of Owner-Occupied Units in El Paso, TX

Zip Code % Owner-Occupied vs State vs National
1.799017.1%62.4%(-55.3)#1364.8%(-57.7)#114
2.7990238.0%62.4%(-24.4)#11764.8%(-26.8)#1,337
3.7990440.4%62.4%(-22.0)#13764.8%(-24.5)#1,542
4.7993044.5%62.4%(-17.9)#16764.8%(-20.3)#1,972
5.7990546.8%62.4%(-15.6)#18964.8%(-18.0)#2,291
6.7992550.9%62.4%(-11.5)#24664.8%(-13.9)#2,956
7.7993552.6%62.4%(-9.83)#27964.8%(-12.3)#3,260
8.7991255.3%62.4%(-7.06)#32564.8%(-9.48)#3,848
9.7990758.0%62.4%(-4.36)#38464.8%(-6.78)#4,554
10.7990359.0%62.4%(-3.36)#41164.8%(-5.78)#4,828
11.7991559.3%62.4%(-3.11)#41664.8%(-5.53)#4,898
12.7992461.6%62.4%(-0.805)#47364.8%(-3.23)#5,641
13.7993466.2%62.4%(+3.76)#60164.8%(+1.34)#7,618
14.7993666.6%62.4%(+4.25)#61764.8%(+1.83)#7,826
15.7993271.8%62.4%(+9.38)#82664.8%(+6.96)#10,933
16.7992779.6%62.4%(+17.2)#1,19464.8%(+14.8)#17,524
17.7991179.8%62.4%(+17.4)#1,20564.8%(+15.0)#17,689
18.7993880.7%62.4%(+18.3)#1,25864.8%(+15.9)#18,613
19.7992286.8%62.4%(+24.4)#1,53764.8%(+22.0)#24,493
20.7992888.8%62.4%(+26.4)#1,59964.8%(+24.0)#26,160

Common Questions

What are the Top 10 Zip Codes with the Lowest Percentage of Owner-Occupied Units in El Paso, TX?
Top 10 Zip Codes with the Lowest Percentage of Owner-Occupied Units in El Paso, TX are:
#1
0.0%
#2
0.0%
#3
7.1%
#4
38.0%
#5
40.4%
#6
44.5%
#7
46.8%
#8
50.9%
#9
52.6%
#10
55.3%
What zip code has the Lowest Percentage of Owner-Occupied Units in El Paso, TX?
79901 has the Lowest Percentage of Owner-Occupied Units in El Paso, TX with 7.1%.
What is the Percentage of Owner-Occupied Units in El Paso, TX?
Percentage of Owner-Occupied Units in El Paso is 59.5%.
What is the Percentage of Owner-Occupied Units in Texas?
Percentage of Owner-Occupied Units in Texas is 62.4%.
What is the Percentage of Owner-Occupied Units in the United States?
Percentage of Owner-Occupied Units in the United States is 64.8%.