Zip Codes with the Highest Poverty Level in El Paso, TX

RELATED REPORTS & OPTIONS

Highest Poverty
Population
Families and Households
Female Fertility
Female Fertility (Unmarried)
Race (Community Size)
Race (Percentage)
Ancestry (Community Size)
AfghanAfricanAmericanApacheArabArgentineanArmenianAustrianBarbadianBasqueBelgianBelizeanBhutaneseBlackfeetBolivianBrazilianBritishBurmeseCajunCanadianCentral AmericanCentral American IndianCherokeeCheyenneChickasawChileanChippewaChoctawColombianComancheCosta RicanCreeCreekCroatianCubanCzechCzechoslovakianDanishDominicanDutchEastern EuropeanEcuadorianEgyptianEnglishEthiopianEuropeanFilipinoFinnishFrenchFrench CanadianGermanGerman RussianGhanaianGreekGuamanian / ChamorroGuatemalanHaitianHonduranHopiHungarianIndian (Asian)IndonesianInupiatIranianIrishIroquoisItalianJamaicanJapaneseJordanianKoreanLaotianLebaneseLithuanianLumbeeLuxembourgerMexicanMexican American IndianMongolianMoroccanNative HawaiianNavajoNicaraguanNigerianNorthern EuropeanNorwegianOttawaPakistaniPanamanianPeruvianPimaPolishPortuguesePotawatomiPuebloPuerto RicanRomanianRussianSalvadoranSamoanScandinavianScotch-IrishScottishSenegaleseSiouxSlovakSloveneSouth AmericanSpaniardSpanishSpanish AmericanSpanish American IndianSri LankanSubsaharan AfricanSwedishSwissSyrianThaiTohono O'OdhamTonganTurkishUkrainianVenezuelanWelshWest IndianYaquiYugoslavian
Ancestry (Percentage)
AfghanAfricanAmericanApacheArabArgentineanArmenianAustrianBarbadianBasqueBelgianBelizeanBhutaneseBlackfeetBolivianBrazilianBritishBurmeseCajunCanadianCentral AmericanCentral American IndianCherokeeCheyenneChickasawChileanChippewaChoctawColombianComancheCosta RicanCreeCreekCroatianCubanCzechCzechoslovakianDanishDominicanDutchEastern EuropeanEcuadorianEgyptianEnglishEthiopianEuropeanFilipinoFinnishFrenchFrench CanadianGermanGerman RussianGhanaianGreekGuamanian / ChamorroGuatemalanHaitianHonduranHopiHungarianIndian (Asian)IndonesianInupiatIranianIrishIroquoisItalianJamaicanJapaneseJordanianKoreanLaotianLebaneseLithuanianLumbeeLuxembourgerMexicanMexican American IndianMongolianMoroccanNative HawaiianNavajoNicaraguanNigerianNorthern EuropeanNorwegianOttawaPakistaniPanamanianPeruvianPimaPolishPortuguesePotawatomiPuebloPuerto RicanRomanianRussianSalvadoranSamoanScandinavianScotch-IrishScottishSenegaleseSiouxSlovakSloveneSouth AmericanSpaniardSpanishSpanish AmericanSpanish American IndianSri LankanSubsaharan AfricanSwedishSwissSyrianThaiTohono O'OdhamTonganTurkishUkrainianVenezuelanWelshWest IndianYaquiYugoslavian
Immigrant Origin (Total)
Immigrant Origin (Percentage)
Income
Income (Families)
Income (Households)
Poverty
Poverty (Families)
Unemployment
Employment Occupations
Employment Industries
Employer Class
Commute Time
Commute Means
School Enrollment
Education by Degree Field
Occupancy
Finances
Physical Characteristics
El Paso
Compare Zip Codes
Comparison Subject

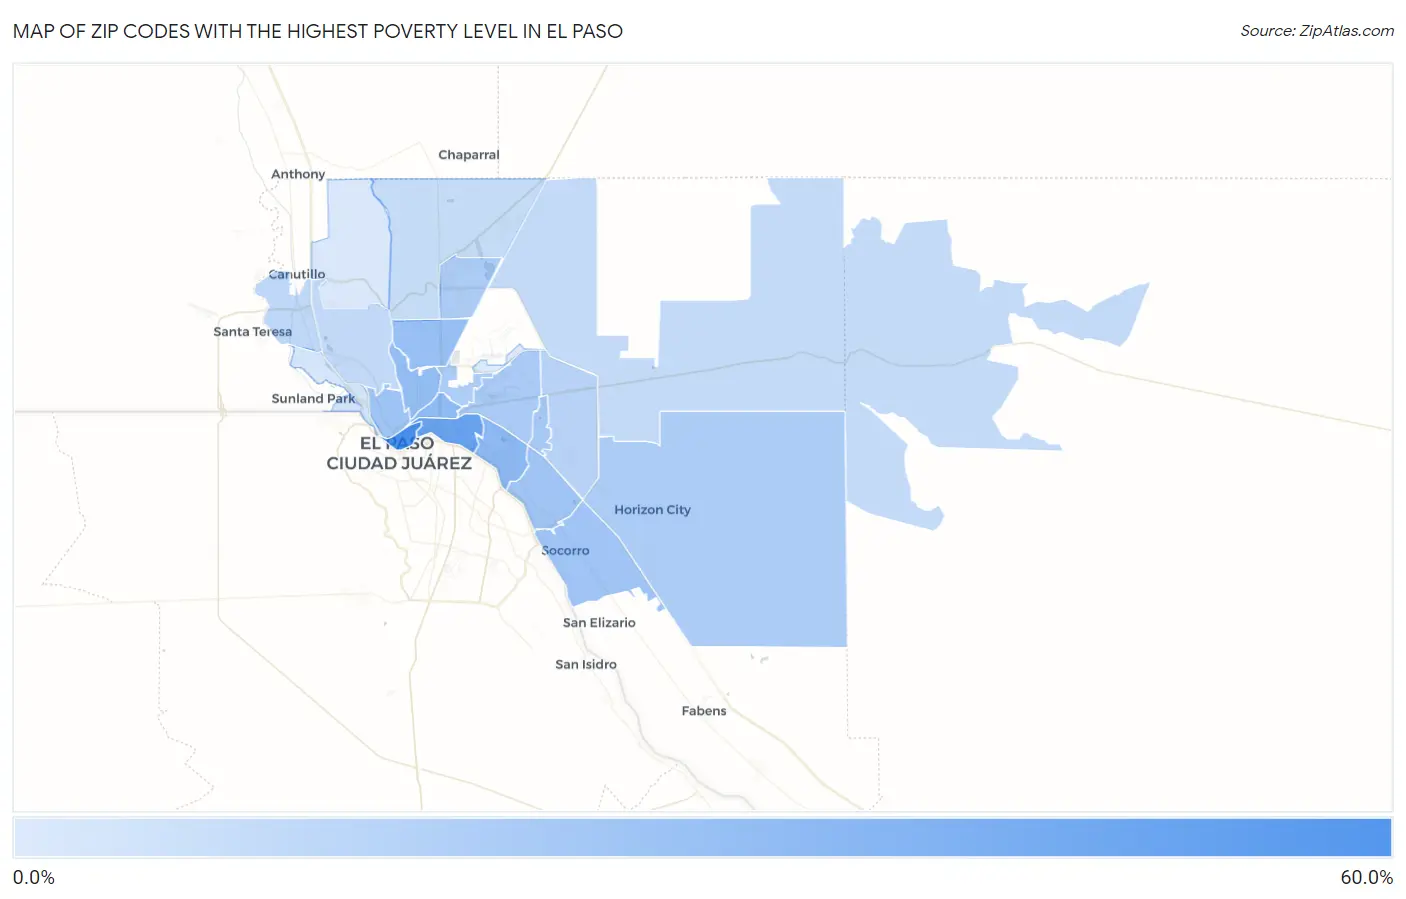
Map of Zip Codes with the Highest Poverty Level in El Paso

0.0%
60.0%
Zip Codes with the Highest Poverty Level in El Paso Map

Zip Codes with the Highest Poverty Level in El Paso, TX

Zip Code Poverty vs State vs National
1.7990158.3%13.9%(+44.4)#2012.5%(+45.8)#358
2.7990544.7%13.9%(+30.8)#4212.5%(+32.2)#805
3.7991530.7%13.9%(+16.8)#11812.5%(+18.2)#2,227
4.7990329.8%13.9%(+15.8)#13212.5%(+17.2)#2,415
5.7993027.7%13.9%(+13.8)#16712.5%(+15.2)#2,855
6.7990425.8%13.9%(+11.8)#20612.5%(+13.3)#3,372
7.7990223.8%13.9%(+9.81)#27212.5%(+11.2)#4,126
8.7990723.2%13.9%(+9.28)#29412.5%(+10.7)#4,324
9.7992722.7%13.9%(+8.76)#31712.5%(+10.2)#4,543
10.7993521.3%13.9%(+7.39)#36512.5%(+8.80)#5,256
11.7992519.9%13.9%(+5.95)#43512.5%(+7.36)#6,152
12.7990619.0%13.9%(+5.07)#47012.5%(+6.48)#6,770
13.7992819.0%13.9%(+5.01)#47412.5%(+6.42)#6,815
14.7992418.9%13.9%(+4.98)#47712.5%(+6.39)#6,839
15.7993614.9%13.9%(+1.000)#72612.5%(+2.41)#10,520
16.7993212.6%13.9%(-1.31)#91112.5%(+0.098)#13,375
17.7991212.6%13.9%(-1.34)#91712.5%(+0.067)#13,421
18.7993811.2%13.9%(-2.70)#1,03012.5%(-1.29)#15,430
19.7993410.8%13.9%(-3.16)#1,07112.5%(-1.75)#16,155
20.799226.6%13.9%(-7.34)#1,45212.5%(-5.93)#23,558
21.799114.4%13.9%(-9.56)#1,62612.5%(-8.15)#27,370
22.799083.9%13.9%(-10.1)#1,67112.5%(-8.67)#28,175

Common Questions

What are the Top 10 Zip Codes with the Highest Poverty Level in El Paso, TX?
Top 10 Zip Codes with the Highest Poverty Level in El Paso, TX are:
#1
58.3%
#2
44.7%
#3
30.7%
#4
29.8%
#5
27.7%
#6
25.8%
#7
23.8%
#8
23.2%
#9
22.7%
#10
21.3%
What zip code has the Highest Poverty Level in El Paso, TX?
79901 has the Highest Poverty Level in El Paso, TX with 58.3%.
What is the Poverty Level in El Paso, TX?
Poverty Level in El Paso is 18.9%.
What is the Poverty Level in Texas?
Poverty Level in Texas is 13.9%.
What is the Poverty Level in the United States?
Poverty Level in the United States is 12.5%.