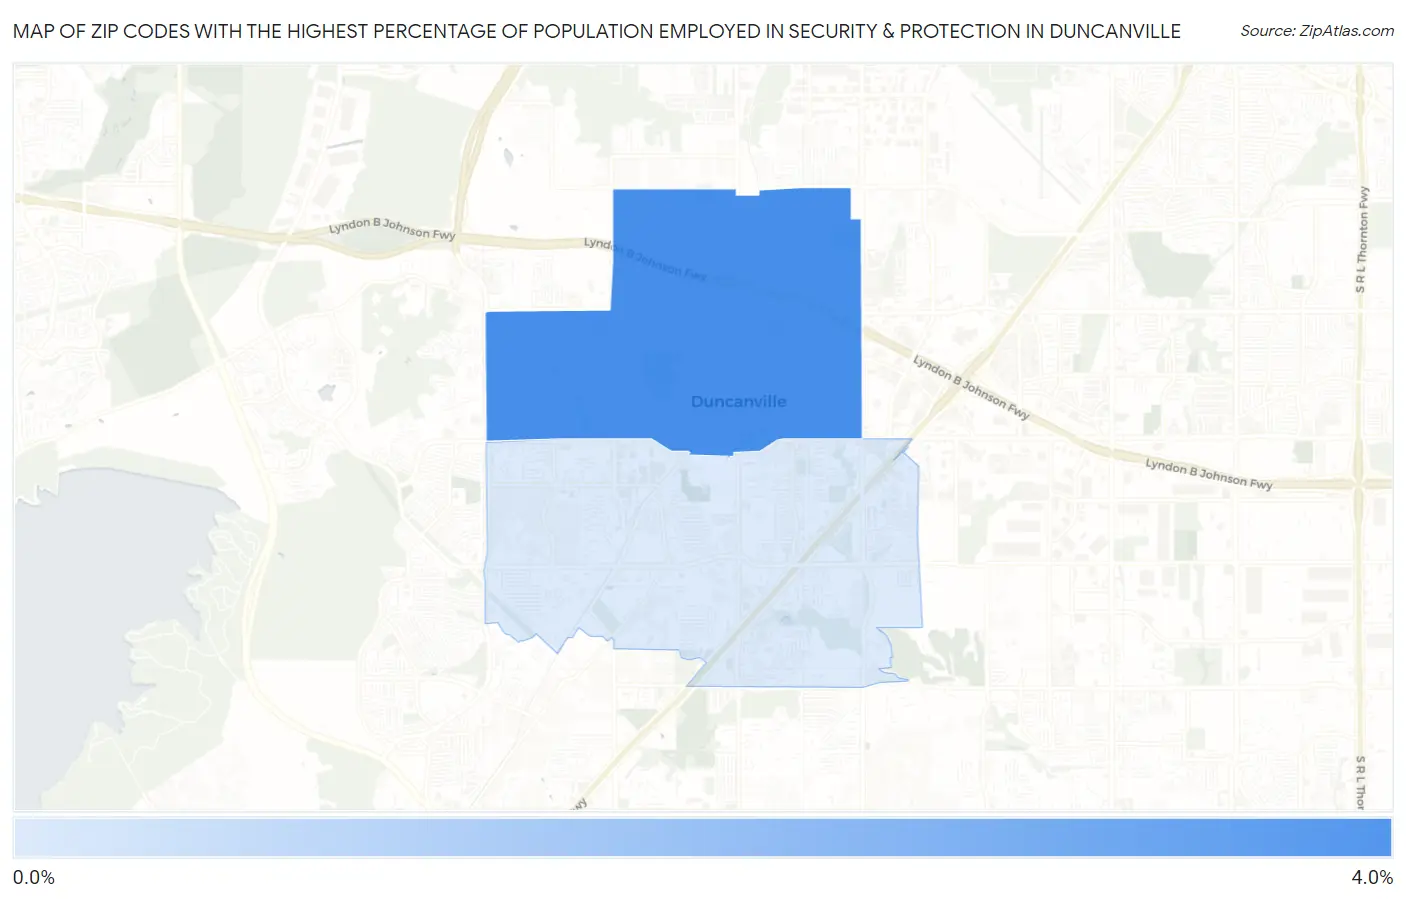
Zip Codes with the Highest Percentage of Population Employed in Security & Protection in Duncanville, TX
RELATED REPORTS & OPTIONS
Security & Protection
Duncanville
Compare Zip Codes
Map of Zip Codes with the Highest Percentage of Population Employed in Security & Protection in Duncanville
0.0%
4.0%
Zip Codes with the Highest Percentage of Population Employed in Security & Protection in Duncanville, TX
| Zip Code | % Employed | vs State | vs National | |
| 1. | 75116 | 3.8% | 2.2%(+1.61)#352 | 2.1%(+1.69)#4,831 |
| 2. | 75137 | 0.82% | 2.2%(-1.41)#1,371 | 2.1%(-1.33)#21,312 |
1
Common Questions
What are the Top Zip Codes with the Highest Percentage of Population Employed in Security & Protection in Duncanville, TX?
Top Zip Codes with the Highest Percentage of Population Employed in Security & Protection in Duncanville, TX are:
What zip code has the Highest Percentage of Population Employed in Security & Protection in Duncanville, TX?
75116 has the Highest Percentage of Population Employed in Security & Protection in Duncanville, TX with 3.8%.
What is the Percentage of Population Employed in Security & Protection in Duncanville, TX?
Percentage of Population Employed in Security & Protection in Duncanville is 2.3%.
What is the Percentage of Population Employed in Security & Protection in Texas?
Percentage of Population Employed in Security & Protection in Texas is 2.2%.
What is the Percentage of Population Employed in Security & Protection in the United States?
Percentage of Population Employed in Security & Protection in the United States is 2.1%.