Zip Codes with the Highest Percentage of Population Employed in Security & Protection in Bedford, TX
RELATED REPORTS & OPTIONS
Security & Protection
Bedford
Compare Zip Codes
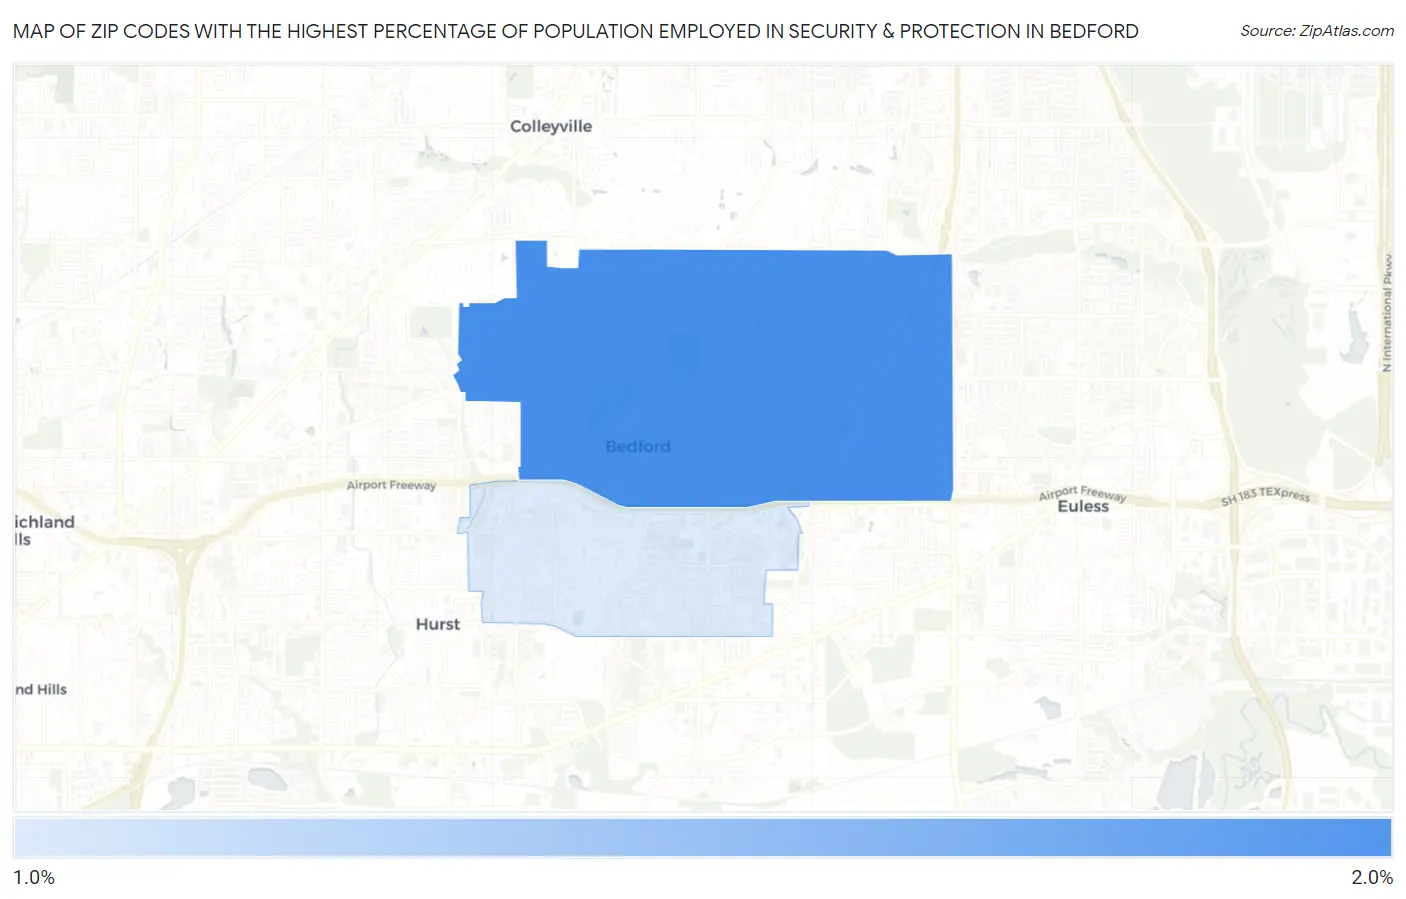
Map of Zip Codes with the Highest Percentage of Population Employed in Security & Protection in Bedford
0.0%
2.0%
Zip Codes with the Highest Percentage of Population Employed in Security & Protection in Bedford, TX
| Zip Code | % Employed | vs State | vs National | |
| 1. | 76021 | 1.7% | 2.2%(-0.539)#999 | 2.1%(-0.464)#14,793 |
| 2. | 76022 | 1.3% | 2.2%(-0.947)#1,175 | 2.1%(-0.871)#17,925 |
1
Common Questions
What are the Top Zip Codes with the Highest Percentage of Population Employed in Security & Protection in Bedford, TX?
Top Zip Codes with the Highest Percentage of Population Employed in Security & Protection in Bedford, TX are:
What zip code has the Highest Percentage of Population Employed in Security & Protection in Bedford, TX?
76021 has the Highest Percentage of Population Employed in Security & Protection in Bedford, TX with 1.7%.
What is the Percentage of Population Employed in Security & Protection in Bedford, TX?
Percentage of Population Employed in Security & Protection in Bedford is 1.6%.
What is the Percentage of Population Employed in Security & Protection in Texas?
Percentage of Population Employed in Security & Protection in Texas is 2.2%.
What is the Percentage of Population Employed in Security & Protection in the United States?
Percentage of Population Employed in Security & Protection in the United States is 2.1%.