Zip Codes with the Highest Percentage of Population Employed in Security & Protection in Sherman, TX
RELATED REPORTS & OPTIONS
Security & Protection
Sherman
Compare Zip Codes
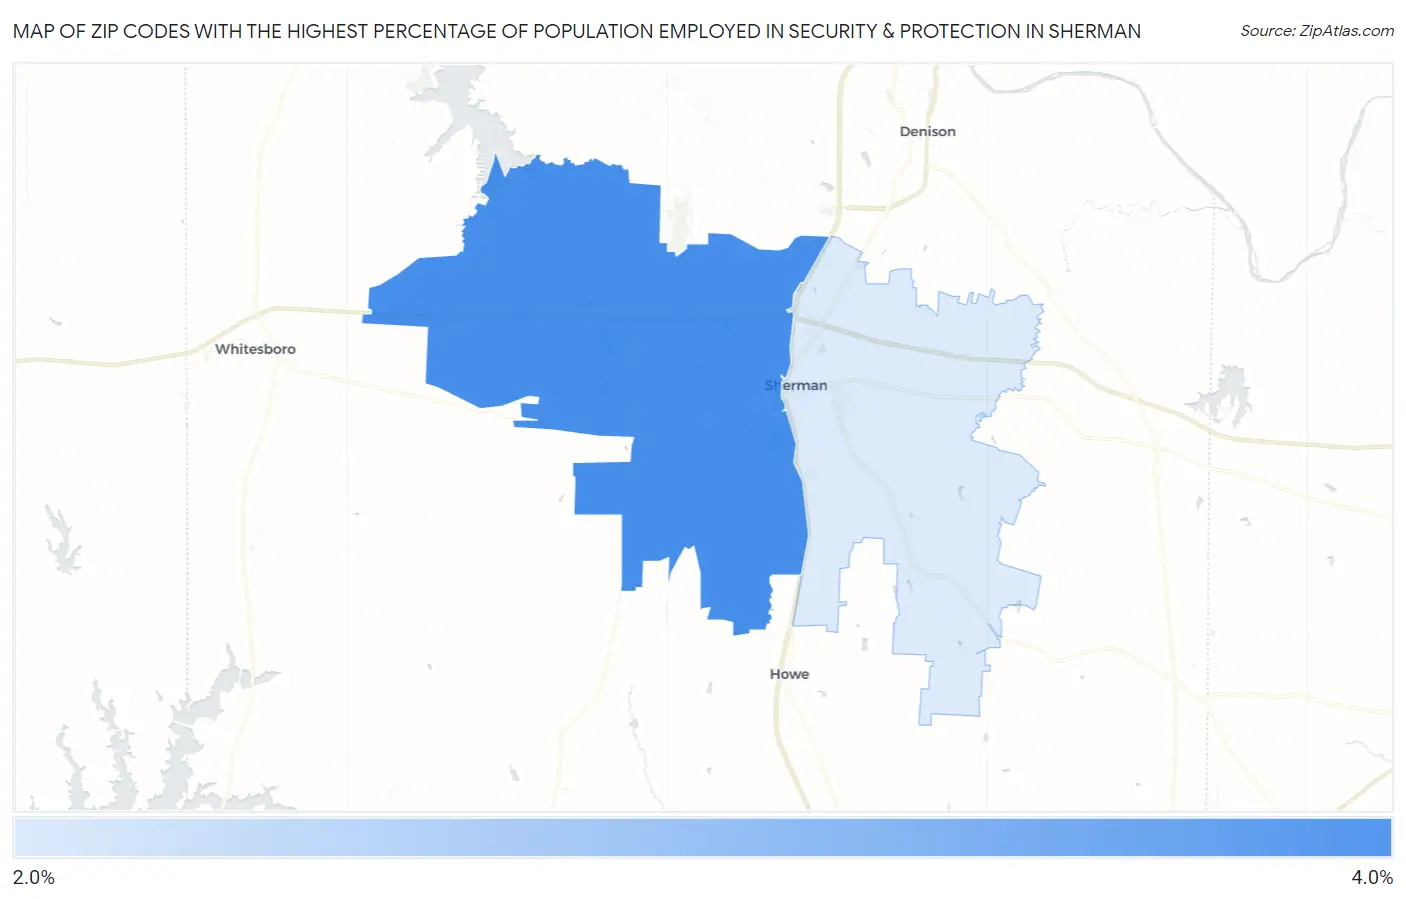
Map of Zip Codes with the Highest Percentage of Population Employed in Security & Protection in Sherman
0.0%
4.0%
Zip Codes with the Highest Percentage of Population Employed in Security & Protection in Sherman, TX
| Zip Code | % Employed | vs State | vs National | |
| 1. | 75092 | 3.4% | 2.2%(+1.20)#428 | 2.1%(+1.28)#5,859 |
| 2. | 75090 | 2.3% | 2.2%(+0.074)#746 | 2.1%(+0.150)#10,657 |
1
Common Questions
What are the Top Zip Codes with the Highest Percentage of Population Employed in Security & Protection in Sherman, TX?
Top Zip Codes with the Highest Percentage of Population Employed in Security & Protection in Sherman, TX are:
What zip code has the Highest Percentage of Population Employed in Security & Protection in Sherman, TX?
75092 has the Highest Percentage of Population Employed in Security & Protection in Sherman, TX with 3.4%.
What is the Percentage of Population Employed in Security & Protection in Sherman, TX?
Percentage of Population Employed in Security & Protection in Sherman is 1.9%.
What is the Percentage of Population Employed in Security & Protection in Texas?
Percentage of Population Employed in Security & Protection in Texas is 2.2%.
What is the Percentage of Population Employed in Security & Protection in the United States?
Percentage of Population Employed in Security & Protection in the United States is 2.1%.