Zip Codes with the Highest Percentage of Population Employed in Security & Protection in Corsicana, TX
RELATED REPORTS & OPTIONS
Security & Protection
Corsicana
Compare Zip Codes
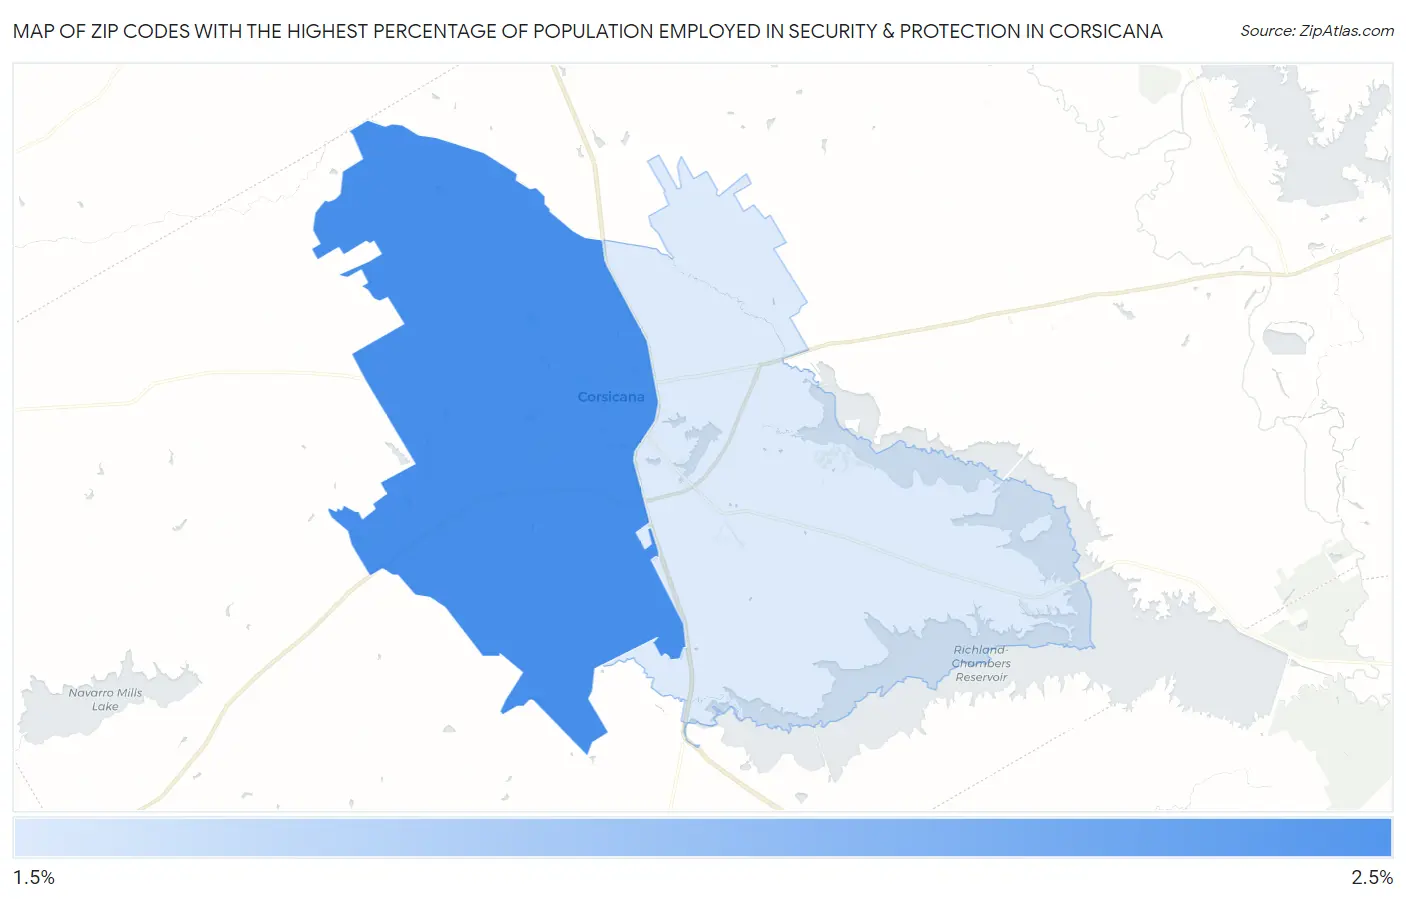
Map of Zip Codes with the Highest Percentage of Population Employed in Security & Protection in Corsicana
0.0%
2.5%
Zip Codes with the Highest Percentage of Population Employed in Security & Protection in Corsicana, TX
| Zip Code | % Employed | vs State | vs National | |
| 1. | 75110 | 2.2% | 2.2%(+0.018)#765 | 2.1%(+0.094)#10,997 |
| 2. | 75109 | 2.0% | 2.2%(-0.234)#865 | 2.1%(-0.159)#12,620 |
1
Common Questions
What are the Top Zip Codes with the Highest Percentage of Population Employed in Security & Protection in Corsicana, TX?
Top Zip Codes with the Highest Percentage of Population Employed in Security & Protection in Corsicana, TX are:
What zip code has the Highest Percentage of Population Employed in Security & Protection in Corsicana, TX?
75110 has the Highest Percentage of Population Employed in Security & Protection in Corsicana, TX with 2.2%.
What is the Percentage of Population Employed in Security & Protection in Corsicana, TX?
Percentage of Population Employed in Security & Protection in Corsicana is 1.9%.
What is the Percentage of Population Employed in Security & Protection in Texas?
Percentage of Population Employed in Security & Protection in Texas is 2.2%.
What is the Percentage of Population Employed in Security & Protection in the United States?
Percentage of Population Employed in Security & Protection in the United States is 2.1%.