Zip Codes with the Highest Percentage of Population Employed in Security & Protection in Santa Fe, TX
RELATED REPORTS & OPTIONS
Security & Protection
Santa Fe
Compare Zip Codes
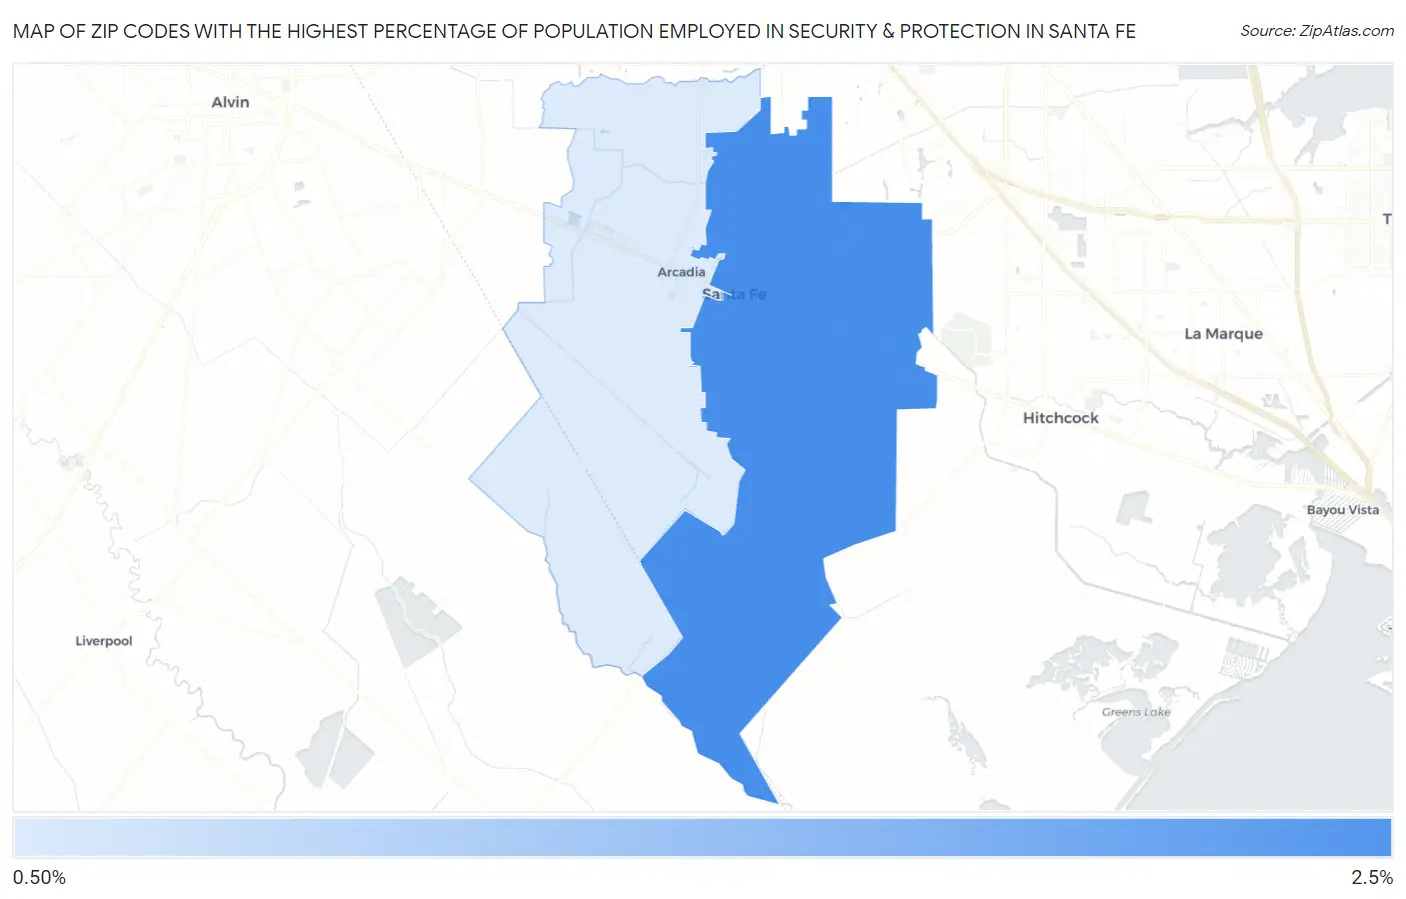
Map of Zip Codes with the Highest Percentage of Population Employed in Security & Protection in Santa Fe
0.0%
2.5%
Zip Codes with the Highest Percentage of Population Employed in Security & Protection in Santa Fe, TX
| Zip Code | % Employed | vs State | vs National | |
| 1. | 77510 | 2.0% | 2.2%(-0.180)#840 | 2.1%(-0.105)#12,287 |
| 2. | 77517 | 0.99% | 2.2%(-1.23)#1,309 | 2.1%(-1.16)#20,109 |
1
Common Questions
What are the Top Zip Codes with the Highest Percentage of Population Employed in Security & Protection in Santa Fe, TX?
Top Zip Codes with the Highest Percentage of Population Employed in Security & Protection in Santa Fe, TX are:
What zip code has the Highest Percentage of Population Employed in Security & Protection in Santa Fe, TX?
77510 has the Highest Percentage of Population Employed in Security & Protection in Santa Fe, TX with 2.0%.
What is the Percentage of Population Employed in Security & Protection in Santa Fe, TX?
Percentage of Population Employed in Security & Protection in Santa Fe is 1.9%.
What is the Percentage of Population Employed in Security & Protection in Texas?
Percentage of Population Employed in Security & Protection in Texas is 2.2%.
What is the Percentage of Population Employed in Security & Protection in the United States?
Percentage of Population Employed in Security & Protection in the United States is 2.1%.