Zip Codes with the Highest Percentage of Population Employed in Installation, Maintenance & Repair in Corsicana, TX
RELATED REPORTS & OPTIONS
Installation, Maintenance & Repair
Corsicana
Compare Zip Codes
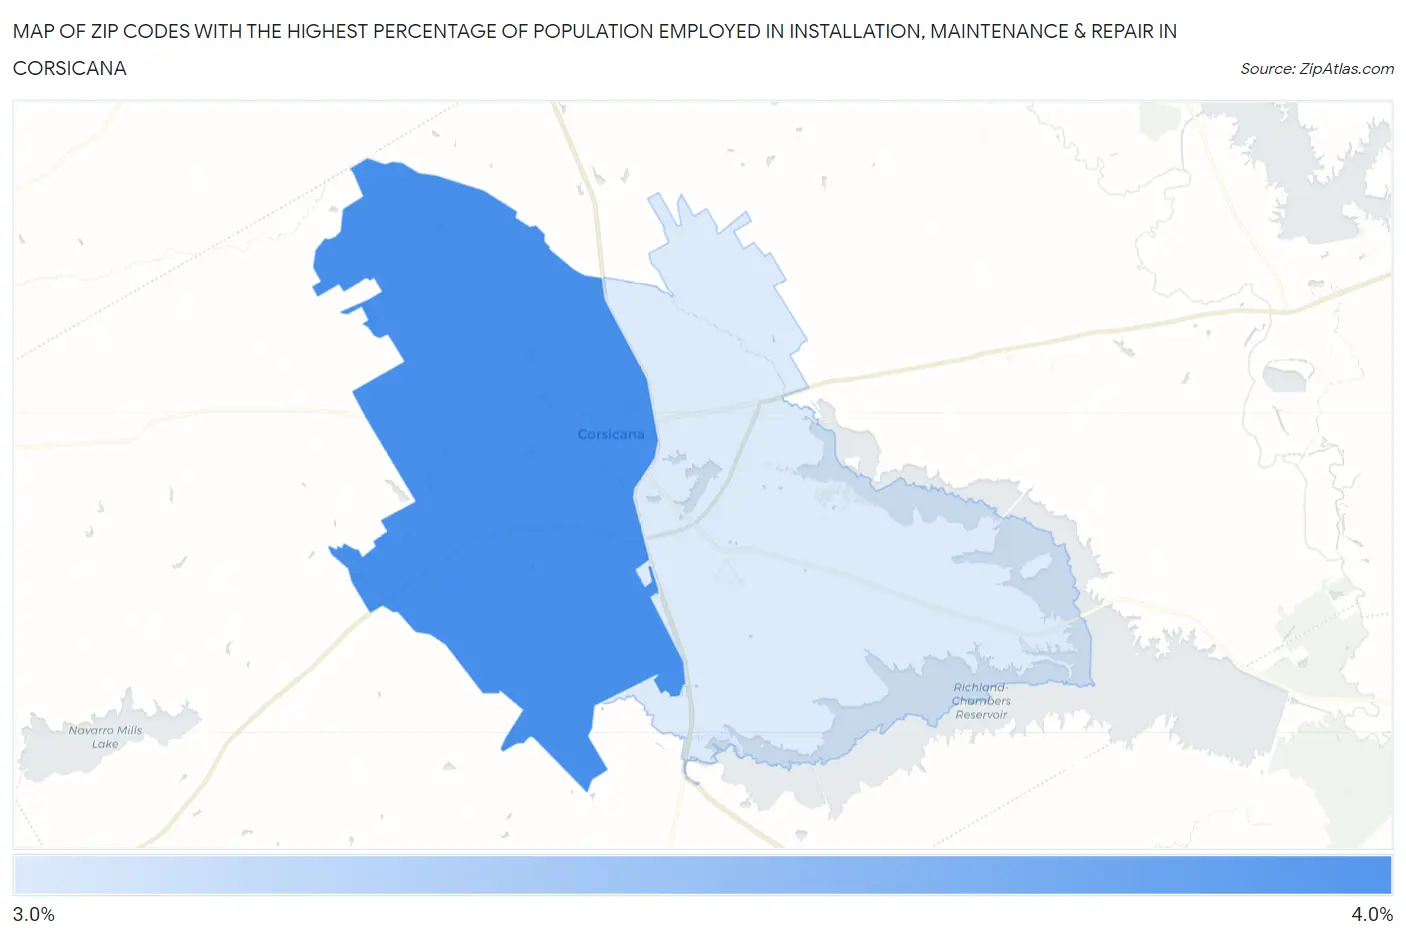
Map of Zip Codes with the Highest Percentage of Population Employed in Installation, Maintenance & Repair in Corsicana
0.0%
4.0%
Zip Codes with the Highest Percentage of Population Employed in Installation, Maintenance & Repair in Corsicana, TX
| Zip Code | % Employed | vs State | vs National | |
| 1. | 75110 | 3.9% | 3.4%(+0.456)#801 | 3.1%(+0.792)#12,992 |
| 2. | 75109 | 3.1% | 3.4%(-0.314)#1,028 | 3.1%(+0.021)#16,576 |
1
Common Questions
What are the Top Zip Codes with the Highest Percentage of Population Employed in Installation, Maintenance & Repair in Corsicana, TX?
Top Zip Codes with the Highest Percentage of Population Employed in Installation, Maintenance & Repair in Corsicana, TX are:
What zip code has the Highest Percentage of Population Employed in Installation, Maintenance & Repair in Corsicana, TX?
75110 has the Highest Percentage of Population Employed in Installation, Maintenance & Repair in Corsicana, TX with 3.9%.
What is the Percentage of Population Employed in Installation, Maintenance & Repair in Corsicana, TX?
Percentage of Population Employed in Installation, Maintenance & Repair in Corsicana is 3.7%.
What is the Percentage of Population Employed in Installation, Maintenance & Repair in Texas?
Percentage of Population Employed in Installation, Maintenance & Repair in Texas is 3.4%.
What is the Percentage of Population Employed in Installation, Maintenance & Repair in the United States?
Percentage of Population Employed in Installation, Maintenance & Repair in the United States is 3.1%.