Zip Codes with the Highest Percentage of Population Employed in Farming, Fishing & Forestry in Corsicana, TX
RELATED REPORTS & OPTIONS
Farming, Fishing & Forestry
Corsicana
Compare Zip Codes
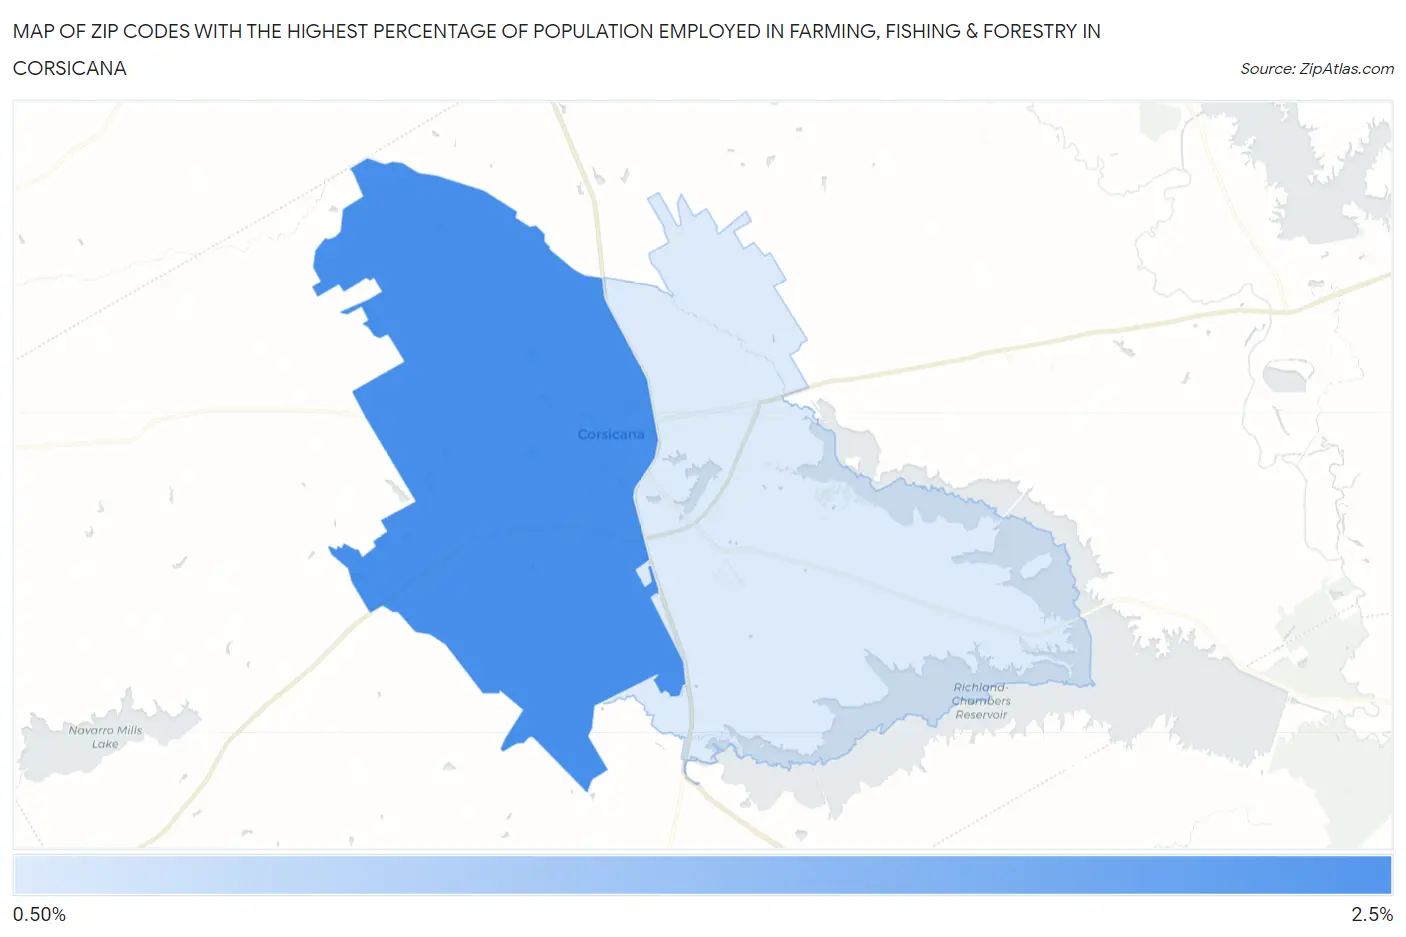
Map of Zip Codes with the Highest Percentage of Population Employed in Farming, Fishing & Forestry in Corsicana
0.0%
2.5%
Zip Codes with the Highest Percentage of Population Employed in Farming, Fishing & Forestry in Corsicana, TX
| Zip Code | % Employed | vs State | vs National | |
| 1. | 75110 | 2.1% | 0.37%(+1.75)#322 | 0.61%(+1.52)#6,286 |
| 2. | 75109 | 1.2% | 0.37%(+0.780)#481 | 0.61%(+0.546)#9,115 |
1
Common Questions
What are the Top Zip Codes with the Highest Percentage of Population Employed in Farming, Fishing & Forestry in Corsicana, TX?
Top Zip Codes with the Highest Percentage of Population Employed in Farming, Fishing & Forestry in Corsicana, TX are:
What zip code has the Highest Percentage of Population Employed in Farming, Fishing & Forestry in Corsicana, TX?
75110 has the Highest Percentage of Population Employed in Farming, Fishing & Forestry in Corsicana, TX with 2.1%.
What is the Percentage of Population Employed in Farming, Fishing & Forestry in Corsicana, TX?
Percentage of Population Employed in Farming, Fishing & Forestry in Corsicana is 2.2%.
What is the Percentage of Population Employed in Farming, Fishing & Forestry in Texas?
Percentage of Population Employed in Farming, Fishing & Forestry in Texas is 0.37%.
What is the Percentage of Population Employed in Farming, Fishing & Forestry in the United States?
Percentage of Population Employed in Farming, Fishing & Forestry in the United States is 0.61%.