Zip Codes with the Highest Percentage of Population Employed in Real Estate, Rental & Leasing in Corsicana, TX
RELATED REPORTS & OPTIONS
Real Estate, Rental & Leasing
Corsicana
Compare Zip Codes
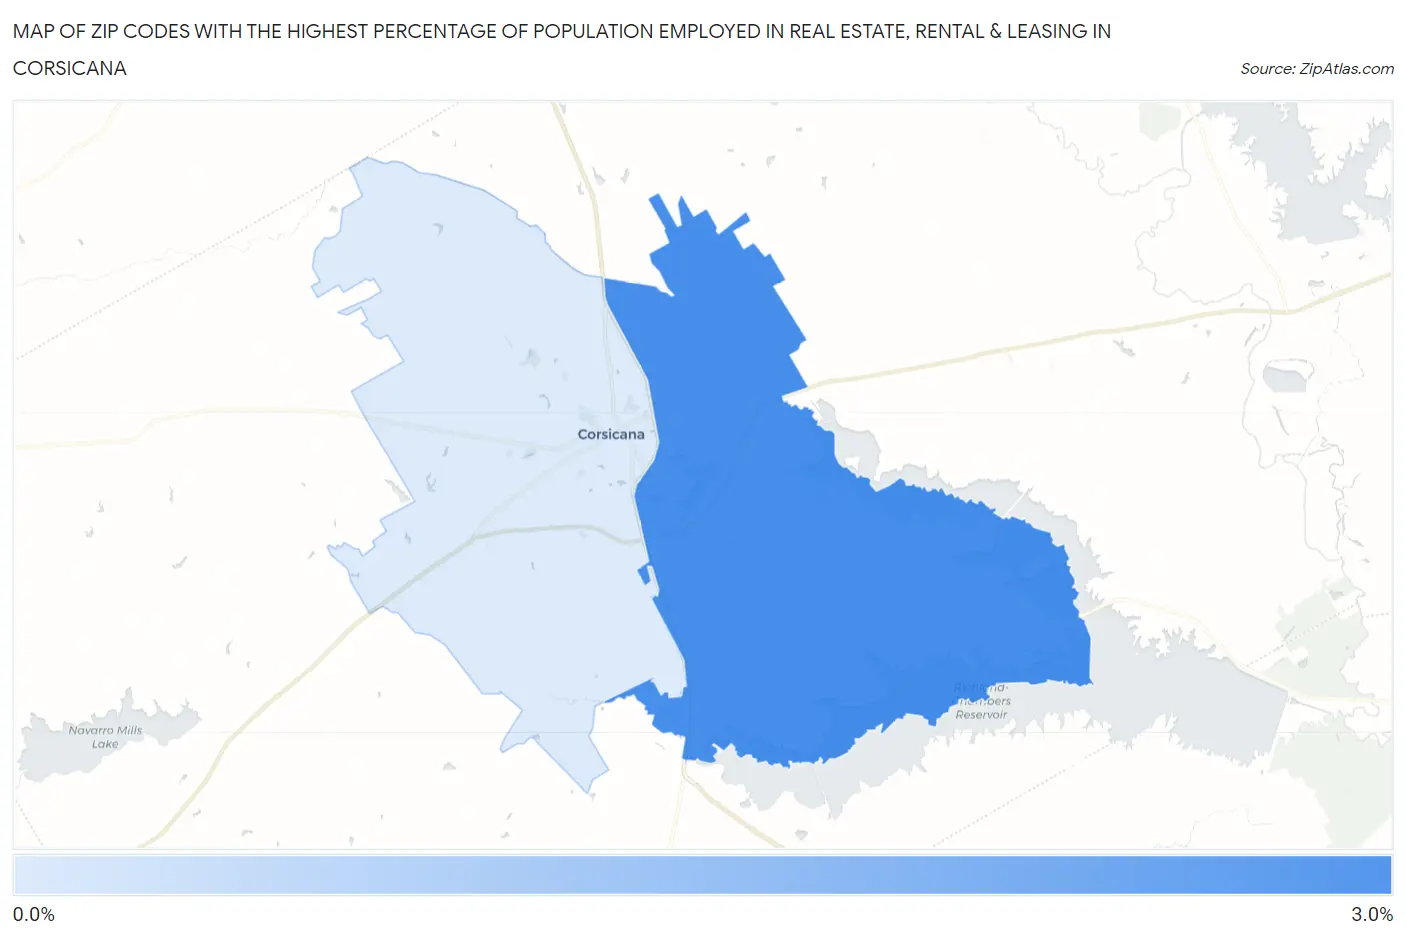
Map of Zip Codes with the Highest Percentage of Population Employed in Real Estate, Rental & Leasing in Corsicana
0.0%
3.0%
Zip Codes with the Highest Percentage of Population Employed in Real Estate, Rental & Leasing in Corsicana, TX
| Zip Code | % Employed | vs State | vs National | |
| 1. | 75109 | 2.9% | 2.0%(+0.924)#274 | 1.9%(+1.04)#4,077 |
| 2. | 75110 | 0.87% | 2.0%(-1.13)#1,085 | 1.9%(-1.02)#16,150 |
1
Common Questions
What are the Top Zip Codes with the Highest Percentage of Population Employed in Real Estate, Rental & Leasing in Corsicana, TX?
Top Zip Codes with the Highest Percentage of Population Employed in Real Estate, Rental & Leasing in Corsicana, TX are:
What zip code has the Highest Percentage of Population Employed in Real Estate, Rental & Leasing in Corsicana, TX?
75109 has the Highest Percentage of Population Employed in Real Estate, Rental & Leasing in Corsicana, TX with 2.9%.
What is the Percentage of Population Employed in Real Estate, Rental & Leasing in Corsicana, TX?
Percentage of Population Employed in Real Estate, Rental & Leasing in Corsicana is 0.81%.
What is the Percentage of Population Employed in Real Estate, Rental & Leasing in Texas?
Percentage of Population Employed in Real Estate, Rental & Leasing in Texas is 2.0%.
What is the Percentage of Population Employed in Real Estate, Rental & Leasing in the United States?
Percentage of Population Employed in Real Estate, Rental & Leasing in the United States is 1.9%.